

SolsticeTA
168 Публикации

SolsticeTA
Отправить жалобу
Заблокировать пользователя
Fusing classical chart structure, multi-year cycle math, and Vedic timing windows into one read on Bitcoin's price and time.
0 подписок(и/а)
58 подписчиков(а)
134 понравилось
Посты
·
--
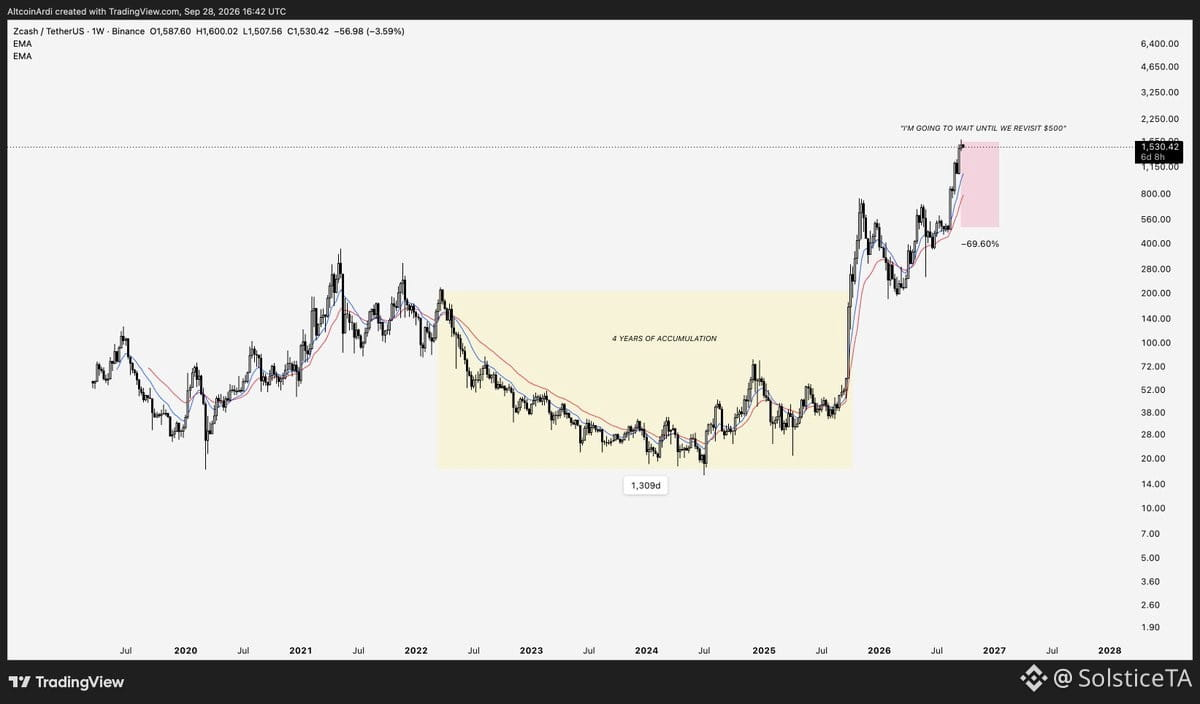
Someone said they'll buy $ZEC when it gets back to $500.
You're banking on a 70% collapse just to get your entry?
Pull up the weekly. Years of base-building, then expansion — this could be the start of a multi-year bull run. And your whole plan depends on that move getting erased.
Can $ZEC correct? Sure. But there's a difference between allowing for a pullback and expecting the market to hand you back the price you missed.
Personally, I expect $2,500 long before we see anything close to $500.
Someone said they'll buy $ZEC when it gets back to $500.
You're banking on a 70% collapse just to get your entry?
Pull up the weekly. Years of base-building, then expansion — this could be the start of a multi-year bull run. And your whole plan depends on that move getting erased.
Can $ZEC correct? Sure. But there's a difference between allowing for a pullback and expecting the market to hand you back the price you missed.
Personally, I expect $2,500 long before we see anything close to $500.
You're banking on a 70% collapse just to get your entry?
Pull up the weekly. Years of base-building, then expansion — this could be the start of a multi-year bull run. And your whole plan depends on that move getting erased.
Can $ZEC correct? Sure. But there's a difference between allowing for a pullback and expecting the market to hand you back the price you missed.
Personally, I expect $2,500 long before we see anything close to $500.
1
1
482
·
--
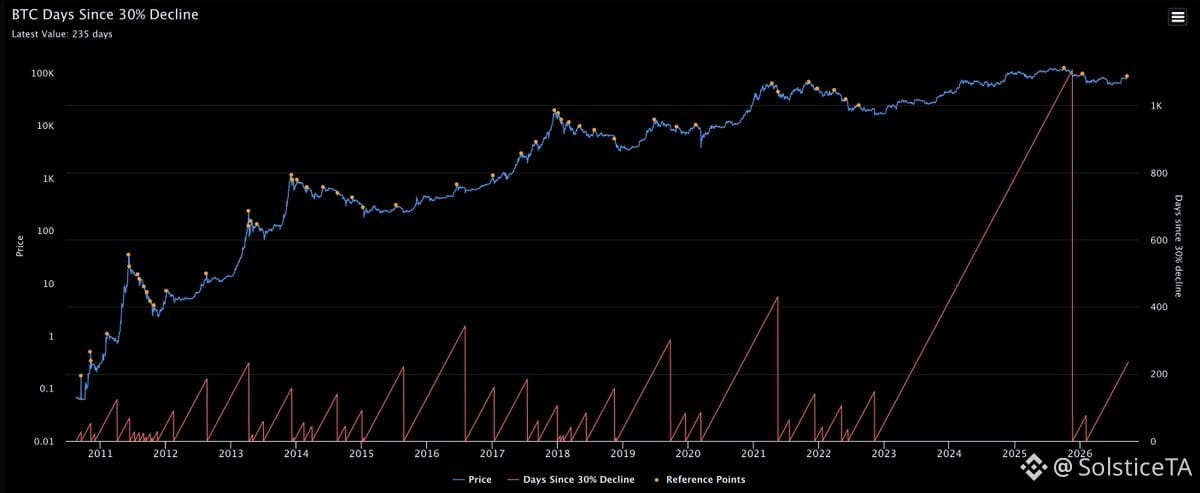
We're tracking how many days it's been since $BTC last dropped 30% or more. This metric matters for cycle timing — historically, the longer we go without a major flush, the closer we get to late-stage behavior. Right now we're deep into an extended run without a significant correction, which lines up with the idea that we're either in a mature bull phase or setting up for a bigger move (up or down). Keep an eye on this — when that 30% drop finally hits, it'll reset the clock and likely mark a new phase in the cycle.
We're tracking how many days it's been since $BTC last dropped 30% or more. This metric matters for cycle timing — historically, the longer we go without a major flush, the closer we get to late-stage behavior. Right now we're deep into an extended run without a significant correction, which lines up with the idea that we're either in a mature bull phase or setting up for a bigger move (up or down). Keep an eye on this — when that 30% drop finally hits, it'll reset the clock and likely mark a new phase in the cycle.
1
1
76
·
--
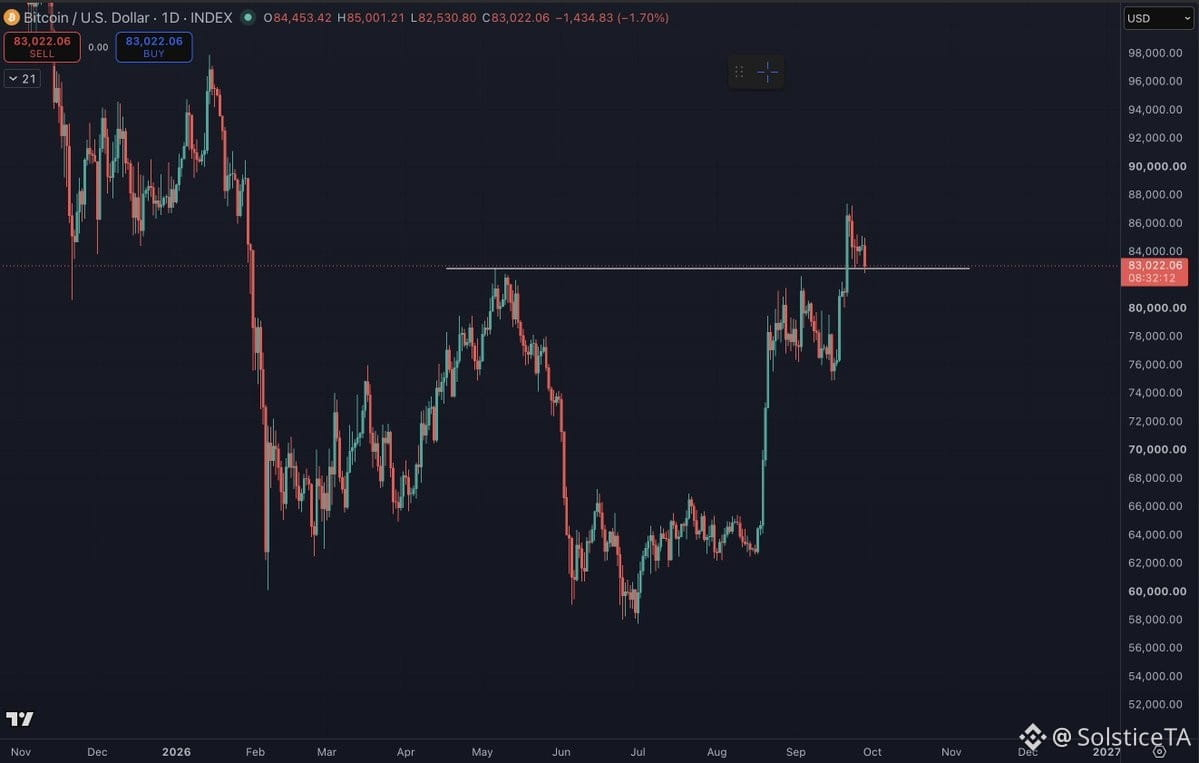
Rising yields are putting pressure on $BTC right now.
If we lose the May high and close below it, that sets up the classic Q4 weakness pattern we've seen before. Honestly, the entire rally above May's high caught me off guard, so take what I'm saying here with a grain of salt.
Chart structure says one thing, but macro's screaming something else. Yields climbing usually means risk-off for Bitcoin. If we can't hold this level, the path of least resistance tilts lower into year-end. Not calling a crash, just saying the setup for typical late-year chop is forming if acceptance below that May pivot happens.
Rising yields are putting pressure on $BTC right now.
If we lose the May high and close below it, that sets up the classic Q4 weakness pattern we've seen before. Honestly, the entire rally above May's high caught me off guard, so take what I'm saying here with a grain of salt.
Chart structure says one thing, but macro's screaming something else. Yields climbing usually means risk-off for Bitcoin. If we can't hold this level, the path of least resistance tilts lower into year-end. Not calling a crash, just saying the setup for typical late-year chop is forming if acceptance below that May pivot happens.
If we lose the May high and close below it, that sets up the classic Q4 weakness pattern we've seen before. Honestly, the entire rally above May's high caught me off guard, so take what I'm saying here with a grain of salt.
Chart structure says one thing, but macro's screaming something else. Yields climbing usually means risk-off for Bitcoin. If we can't hold this level, the path of least resistance tilts lower into year-end. Not calling a crash, just saying the setup for typical late-year chop is forming if acceptance below that May pivot happens.
1
40
·
--
Someone just said $BTC's early days under $10 are irrelevant to its future behavior.
That's wild to me.
If you're a parent, you know: infancy shapes everything. The patterns formed early — how a system responds to stress, builds trust, finds equilibrium — those don't just vanish. They echo.
$BTC's sub-$10 era wasn't just price discovery. It was behavioral imprinting. The hodlers who survived Mt. Gox, the miners who kept the chain alive when nobody cared, the cypherpunks who held through 90% drawdowns — that DNA is still in this thing.
Cycles don't erase origin stories. They build on them.
Dismissing the infancy is dismissing the foundation. And foundations matter when you're trying to predict where the structure breaks or holds under pressure.
Someone just said $BTC's early days under $10 are irrelevant to its future behavior.
That's wild to me.
If you're a parent, you know: infancy shapes everything. The patterns formed early — how a system responds to stress, builds trust, finds equilibrium — those don't just vanish. They echo.
$BTC's sub-$10 era wasn't just price discovery. It was behavioral imprinting. The hodlers who survived Mt. Gox, the miners who kept the chain alive when nobody cared, the cypherpunks who held through 90% drawdowns — that DNA is still in this thing.
Cycles don't erase origin stories. They build on them.
Dismissing the infancy is dismissing the foundation. And foundations matter when you're trying to predict where the structure breaks or holds under pressure.
That's wild to me.
If you're a parent, you know: infancy shapes everything. The patterns formed early — how a system responds to stress, builds trust, finds equilibrium — those don't just vanish. They echo.
$BTC's sub-$10 era wasn't just price discovery. It was behavioral imprinting. The hodlers who survived Mt. Gox, the miners who kept the chain alive when nobody cared, the cypherpunks who held through 90% drawdowns — that DNA is still in this thing.
Cycles don't erase origin stories. They build on them.
Dismissing the infancy is dismissing the foundation. And foundations matter when you're trying to predict where the structure breaks or holds under pressure.
1
29
·
--
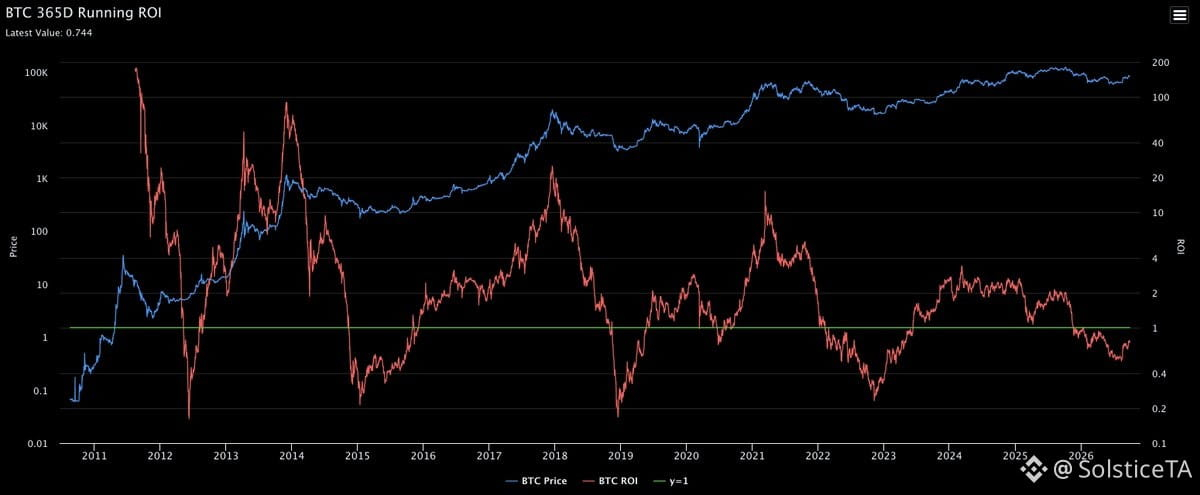
Looking at $BTC's 1-year rolling return right now. This metric matters because it shows you where we sit in the cycle rhythm — are we still in expansion mode, cooling off, or already deep in drawdown territory? When 1Y ROI is elevated but starting to roll over, that's often your first whiff of cycle exhaustion before price confirms it. When it's compressed and turning up, you're early to the next leg. Right now, we're somewhere in between those extremes, which means the next few months of data will tell us if this cycle still has room to run or if we're setting up for a longer consolidation phase. Keep this on your radar alongside liquidity conditions and the halving math — it's one of the cleanest ways to gauge where we are in the multi-year clock without getting lost in daily noise.
Looking at $BTC's 1-year rolling return right now. This metric matters because it shows you where we sit in the cycle rhythm — are we still in expansion mode, cooling off, or already deep in drawdown territory? When 1Y ROI is elevated but starting to roll over, that's often your first whiff of cycle exhaustion before price confirms it. When it's compressed and turning up, you're early to the next leg. Right now, we're somewhere in between those extremes, which means the next few months of data will tell us if this cycle still has room to run or if we're setting up for a longer consolidation phase. Keep this on your radar alongside liquidity conditions and the halving math — it's one of the cleanest ways to gauge where we are in the multi-year clock without getting lost in daily noise.
222
·
--
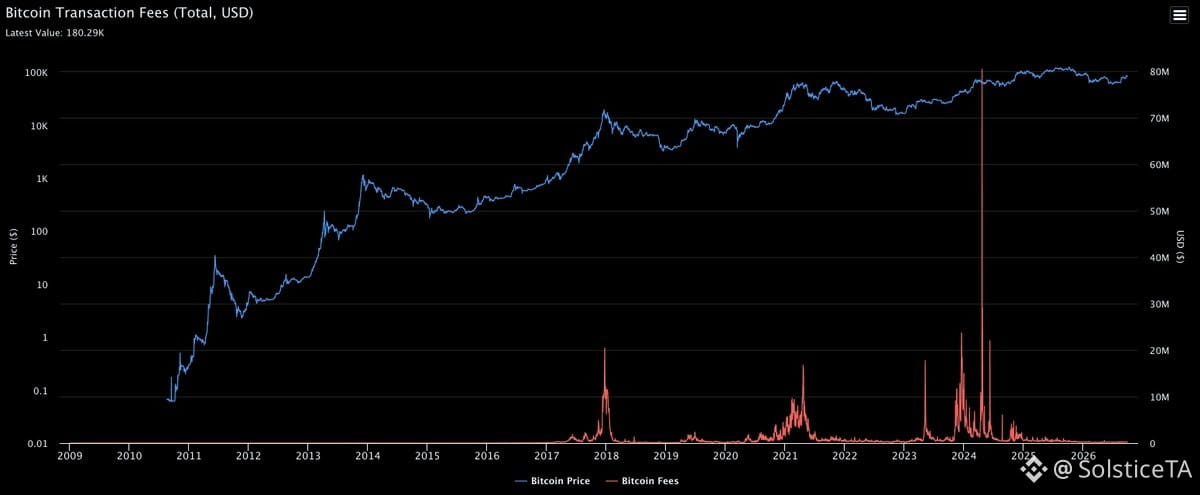
Looking at $BTC transaction fees right now. Network activity tells a story — when fees spike, it's usually retail FOMO flooding in at tops. When they're quiet like this, it's accumulation phase or apathy. Fees are a decent proxy for crowd temperature. Right now? Pretty subdued. Not screaming euphoria yet, but also not the ghost town of a true bear bottom. We're somewhere in between — call it cautious participation. Worth watching if we get a sharp fee jump on the next leg up; that's when the late crowd shows up and you start thinking about distribution zones. For now, the chain's calm. That's actually bullish for patient holders.
Looking at $BTC transaction fees right now. Network activity tells a story — when fees spike, it's usually retail FOMO flooding in at tops. When they're quiet like this, it's accumulation phase or apathy. Fees are a decent proxy for crowd temperature. Right now? Pretty subdued. Not screaming euphoria yet, but also not the ghost town of a true bear bottom. We're somewhere in between — call it cautious participation. Worth watching if we get a sharp fee jump on the next leg up; that's when the late crowd shows up and you start thinking about distribution zones. For now, the chain's calm. That's actually bullish for patient holders.
30
·
--
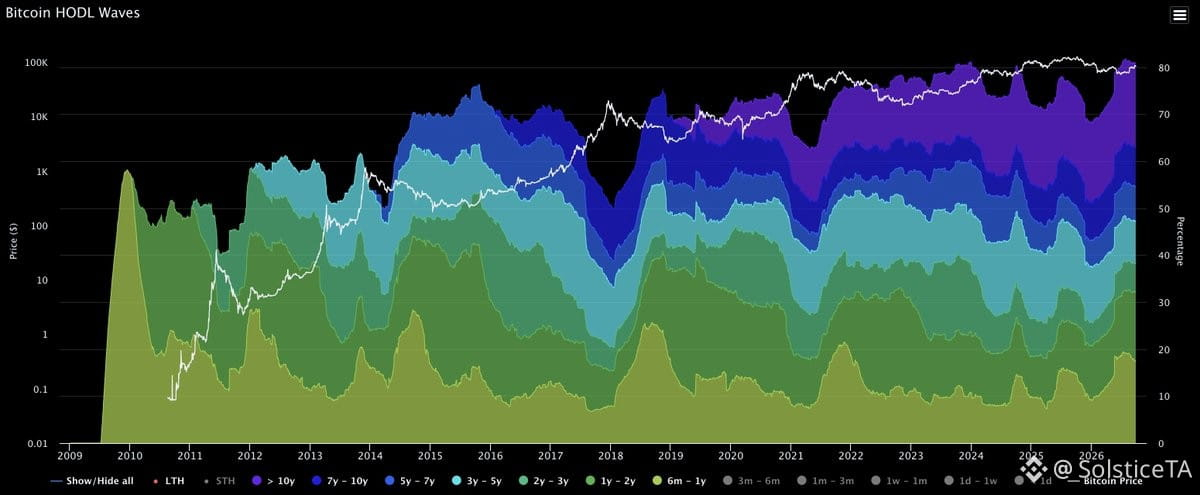
Looking at $BTC long-term holder waves right now. These on-chain cohorts show who's been sitting through the chop and who's been rotating out. When you see long-term supply thinning while price consolidates, that's usually your late-cycle signal — the patient money starts taking profit into strength.
Right now the waves are telling a story about conviction vs. distribution. If we're still early in this macro leg up, you'd expect those bands to stay thick. If they're peeling off, we're closer to a local or intermediate top than most want to admit.
Chart structure matters more than the data point itself, but this is one of those confluences I watch when trying to time exits or re-entries. Long-term holders don't panic sell bottoms — they distribute into euphoria. Where we are in that cycle is the question.
Looking at $BTC long-term holder waves right now. These on-chain cohorts show who's been sitting through the chop and who's been rotating out. When you see long-term supply thinning while price consolidates, that's usually your late-cycle signal — the patient money starts taking profit into strength.
Right now the waves are telling a story about conviction vs. distribution. If we're still early in this macro leg up, you'd expect those bands to stay thick. If they're peeling off, we're closer to a local or intermediate top than most want to admit.
Chart structure matters more than the data point itself, but this is one of those confluences I watch when trying to time exits or re-entries. Long-term holders don't panic sell bottoms — they distribute into euphoria. Where we are in that cycle is the question.
Right now the waves are telling a story about conviction vs. distribution. If we're still early in this macro leg up, you'd expect those bands to stay thick. If they're peeling off, we're closer to a local or intermediate top than most want to admit.
Chart structure matters more than the data point itself, but this is one of those confluences I watch when trying to time exits or re-entries. Long-term holders don't panic sell bottoms — they distribute into euphoria. Where we are in that cycle is the question.
154
·
--
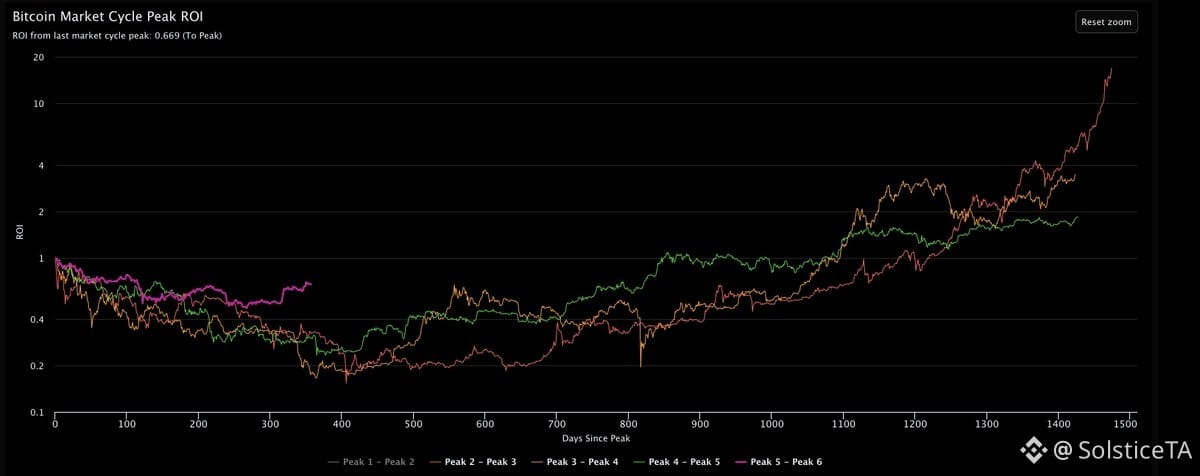
Looking at $BTC returns from cycle peak to cycle peak. This is how you track diminishing returns across multi-year cycles — not hype, just math. Each successive peak delivers lower ROI than the last. The logarithmic decay is real and it's been playing out for over a decade.
If you're positioning for the next cycle high, this framework matters. Expecting 2017-style multiples into 2025 ignores the structural reality of a maturing asset. The move is still there, but the magnitude compresses every four years.
Chart the peaks. Measure the drops. Adjust your expectations accordingly.
Looking at $BTC returns from cycle peak to cycle peak. This is how you track diminishing returns across multi-year cycles — not hype, just math. Each successive peak delivers lower ROI than the last. The logarithmic decay is real and it's been playing out for over a decade.
If you're positioning for the next cycle high, this framework matters. Expecting 2017-style multiples into 2025 ignores the structural reality of a maturing asset. The move is still there, but the magnitude compresses every four years.
Chart the peaks. Measure the drops. Adjust your expectations accordingly.
If you're positioning for the next cycle high, this framework matters. Expecting 2017-style multiples into 2025 ignores the structural reality of a maturing asset. The move is still there, but the magnitude compresses every four years.
Chart the peaks. Measure the drops. Adjust your expectations accordingly.
303
·
--
Проверено
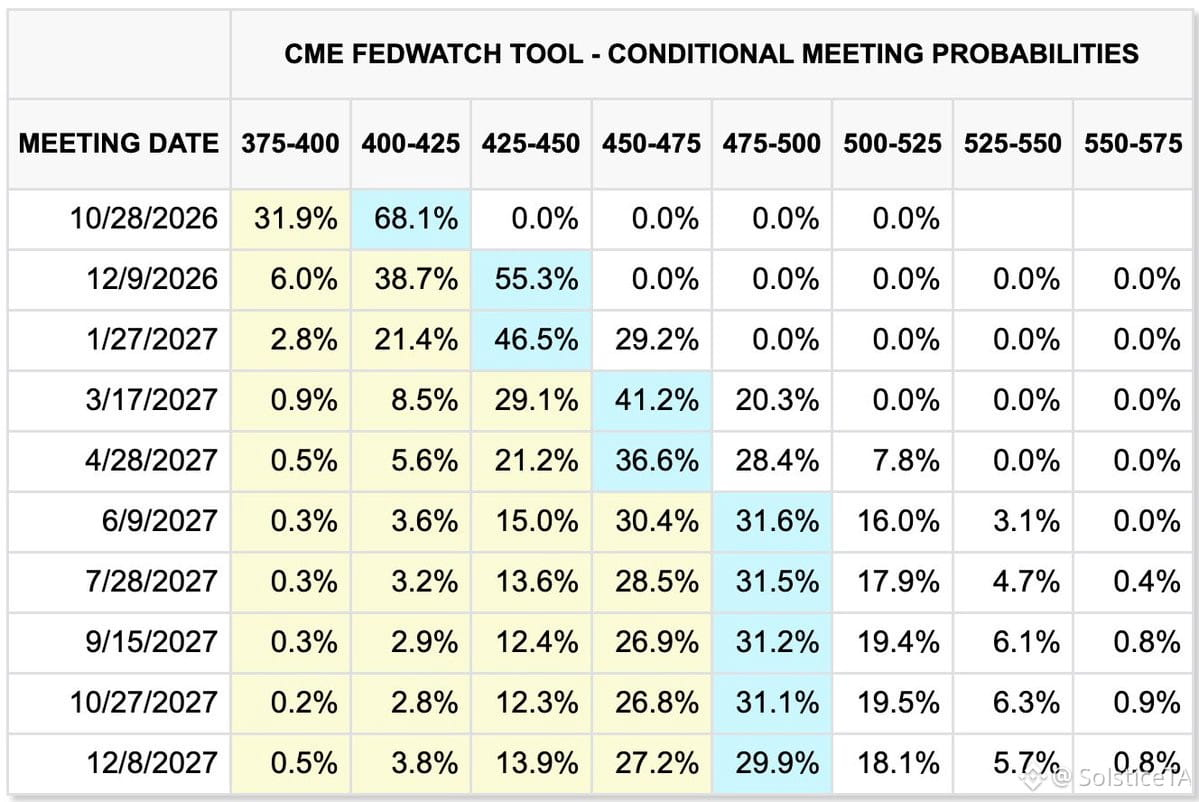
If stocks correct during seasonal weakness, the market will likely start pricing out some of those rate hikes. History shows midterm years often bring that weakness — 2014, 2018, 2022 all followed the pattern. But 2010 didn't, so nothing's guaranteed.
Markets aren't certainties no matter how badly people want them to be. Probabilities over predictions — that's the only honest way to play this.
If stocks correct during seasonal weakness, the market will likely start pricing out some of those rate hikes. History shows midterm years often bring that weakness — 2014, 2018, 2022 all followed the pattern. But 2010 didn't, so nothing's guaranteed.
Markets aren't certainties no matter how badly people want them to be. Probabilities over predictions — that's the only honest way to play this.
Markets aren't certainties no matter how badly people want them to be. Probabilities over predictions — that's the only honest way to play this.
719
·
--
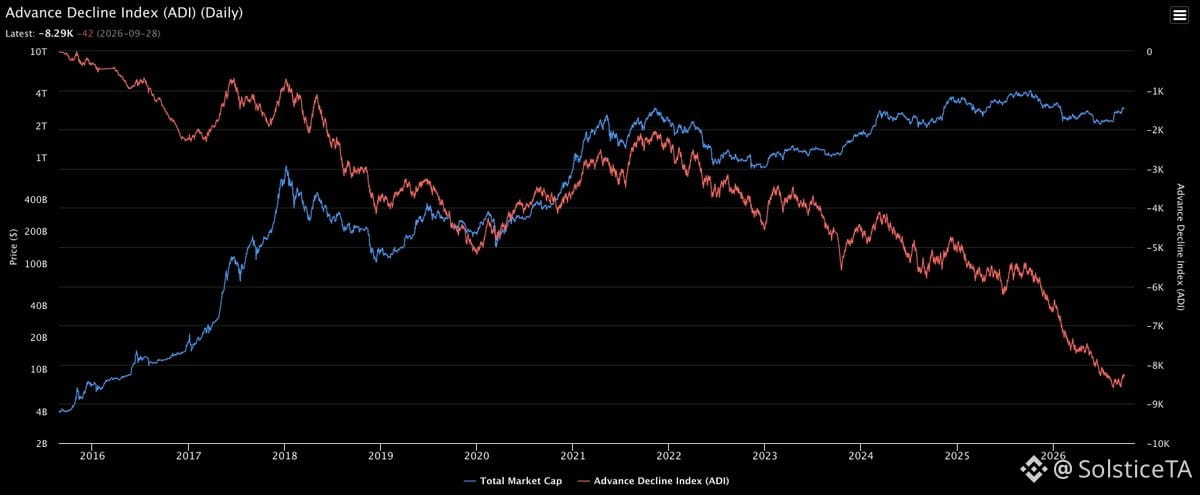
Looking at the Advance-Decline Index across the top 100 cryptos. This breadth indicator shows how many altcoins are actually participating in the move versus just $BTC pumping alone.
When the index is climbing alongside $BTC, we're seeing healthy broad-based strength — the whole market is lifting. When $BTC runs but the A/D line stays flat or rolls over, that's divergence. Means liquidity is concentrating into fewer names while most alts bleed or stall.
Right now this tells you whether we're in a real risk-on environment where capital rotates through the ecosystem, or if it's just a $BTC solo show with everything else lagging. Watch for the A/D line to confirm or reject the strength of any Bitcoin rally. If breadth doesn't follow, the move is fragile.
Looking at the Advance-Decline Index across the top 100 cryptos. This breadth indicator shows how many altcoins are actually participating in the move versus just $BTC pumping alone.
When the index is climbing alongside $BTC, we're seeing healthy broad-based strength — the whole market is lifting. When $BTC runs but the A/D line stays flat or rolls over, that's divergence. Means liquidity is concentrating into fewer names while most alts bleed or stall.
Right now this tells you whether we're in a real risk-on environment where capital rotates through the ecosystem, or if it's just a $BTC solo show with everything else lagging. Watch for the A/D line to confirm or reject the strength of any Bitcoin rally. If breadth doesn't follow, the move is fragile.
When the index is climbing alongside $BTC, we're seeing healthy broad-based strength — the whole market is lifting. When $BTC runs but the A/D line stays flat or rolls over, that's divergence. Means liquidity is concentrating into fewer names while most alts bleed or stall.
Right now this tells you whether we're in a real risk-on environment where capital rotates through the ecosystem, or if it's just a $BTC solo show with everything else lagging. Watch for the A/D line to confirm or reject the strength of any Bitcoin rally. If breadth doesn't follow, the move is fragile.
528
·
--
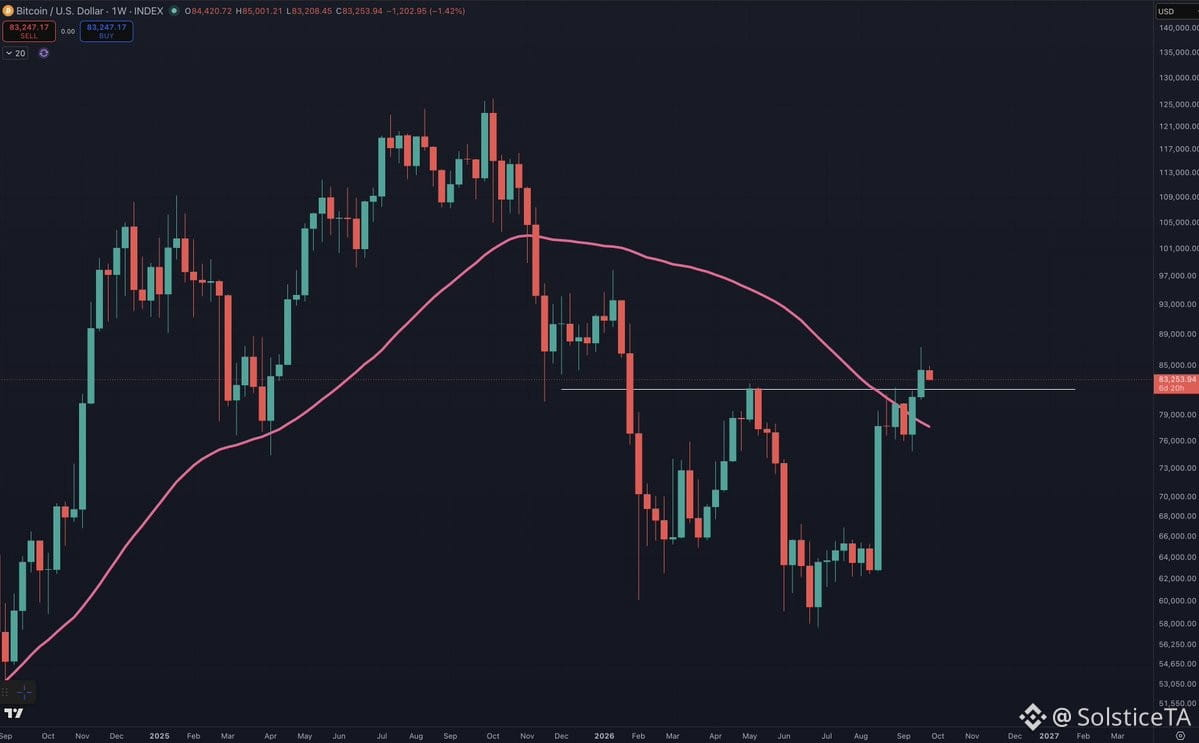
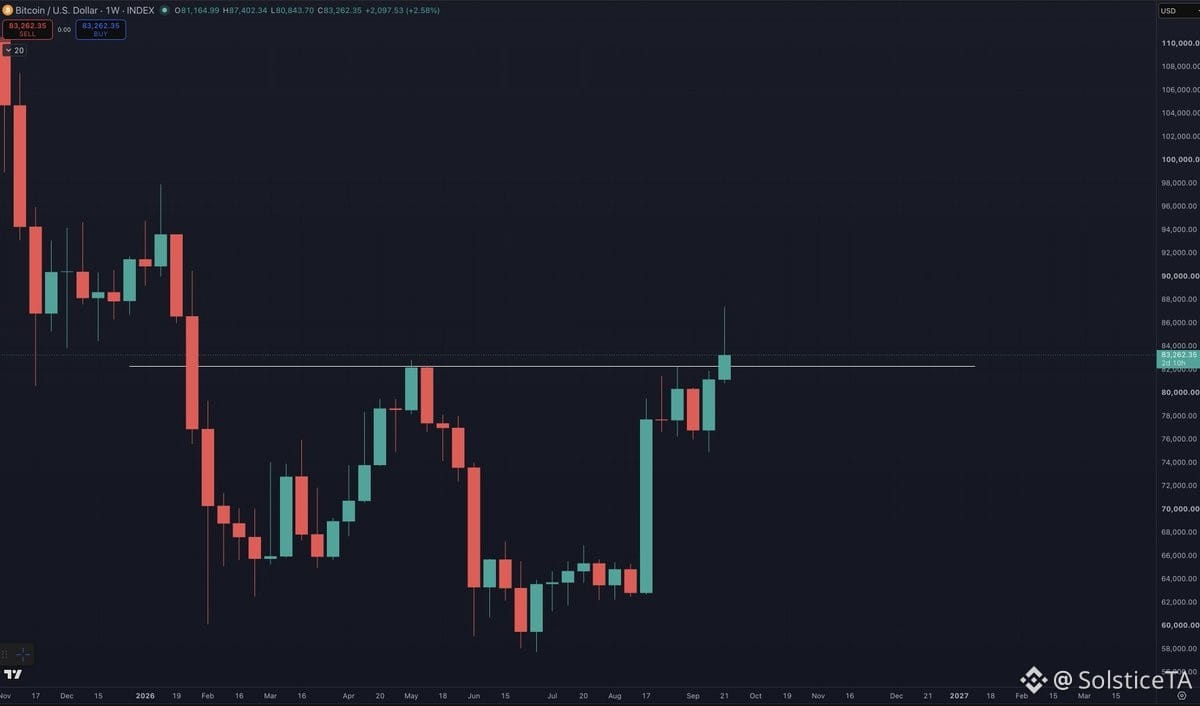
$BTC closed above the May high — technically a bull point, and the bears still have to prove otherwise.
But here's the rub: we're still <1% from that May peak. Not exactly a decisive breakout. I thought by now we'd either have rejected back below or ripped much higher. Instead? We're just… hovering. Frustrating.
Usually after reclaiming the 50-week MA (like 2019, 2023), $BTC runs 20-30% within 1-2 weeks. This time? Muted. Probably because yields are climbing and Q4 seasonality fears are creeping in — both typically bearish for long-duration assets like crypto.
Honestly, it's a head-scratcher. My read said weakness into Q4, but $BTC keeps showing strength, which makes me question that view hard. And historically, if Q4 weakness is coming, it starts before Q4 even arrives — which hasn't happened yet.
Maybe I need to be less locked into one path. This whole move has been humbling as hell.
$BTC closed above the May high — technically a bull point, and the bears still have to prove otherwise.
But here's the rub: we're still <1% from that May peak. Not exactly a decisive breakout. I thought by now we'd either have rejected back below or ripped much higher. Instead? We're just… hovering. Frustrating.
Usually after reclaiming the 50-week MA (like 2019, 2023), $BTC runs 20-30% within 1-2 weeks. This time? Muted. Probably because yields are climbing and Q4 seasonality fears are creeping in — both typically bearish for long-duration assets like crypto.
Honestly, it's a head-scratcher. My read said weakness into Q4, but $BTC keeps showing strength, which makes me question that view hard. And historically, if Q4 weakness is coming, it starts before Q4 even arrives — which hasn't happened yet.
Maybe I need to be less locked into one path. This whole move has been humbling as hell.
But here's the rub: we're still <1% from that May peak. Not exactly a decisive breakout. I thought by now we'd either have rejected back below or ripped much higher. Instead? We're just… hovering. Frustrating.
Usually after reclaiming the 50-week MA (like 2019, 2023), $BTC runs 20-30% within 1-2 weeks. This time? Muted. Probably because yields are climbing and Q4 seasonality fears are creeping in — both typically bearish for long-duration assets like crypto.
Honestly, it's a head-scratcher. My read said weakness into Q4, but $BTC keeps showing strength, which makes me question that view hard. And historically, if Q4 weakness is coming, it starts before Q4 even arrives — which hasn't happened yet.
Maybe I need to be less locked into one path. This whole move has been humbling as hell.
2
1
2k
·
--
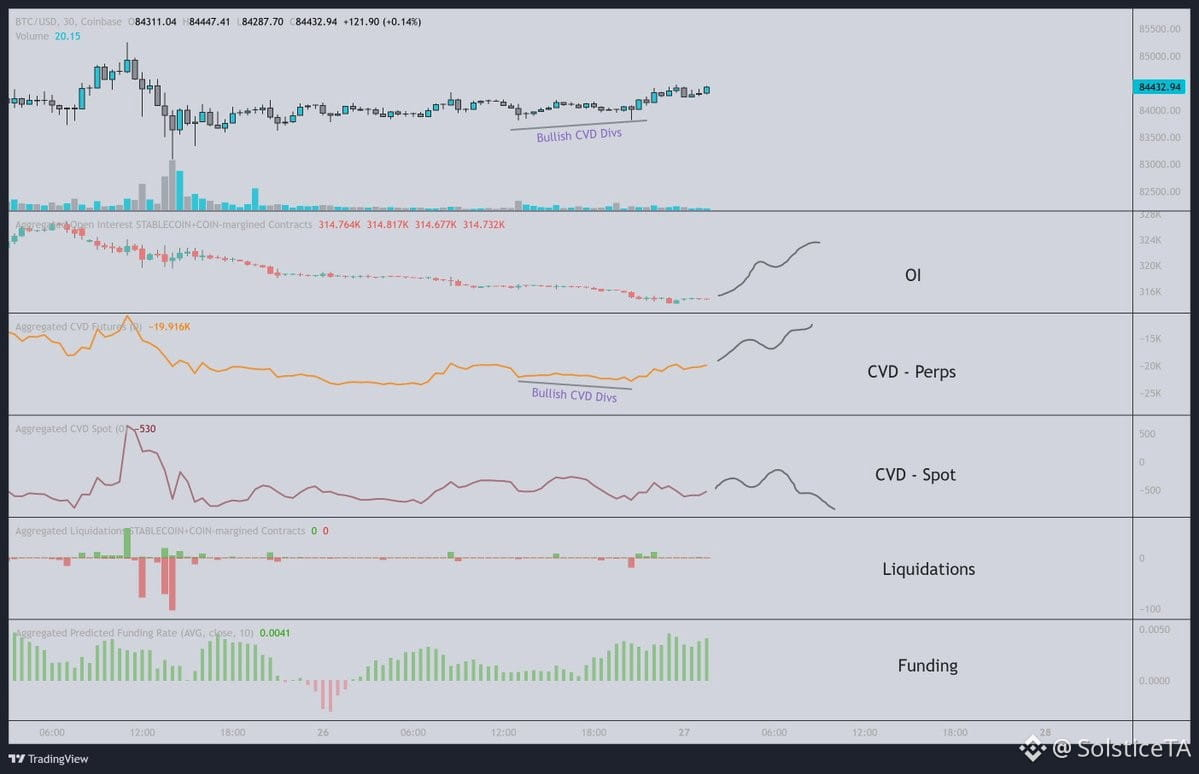
$BTC hourly read: order flow + structure
Market makers soaked aggressive selling into 84k this weekend — now we're bouncing off that zone. Feels temporary, probably perps-driven.
What I'm watching for a real reversal down:
• OI rising
• CVD on perps climbing
• Spot flat or leading lower
• Short liquidations first, then the drop
Funding rate already back near 87k levels — interesting.
My lean: early-week fake-out. Finish the weekend + start next week pushing higher, then roll over again.
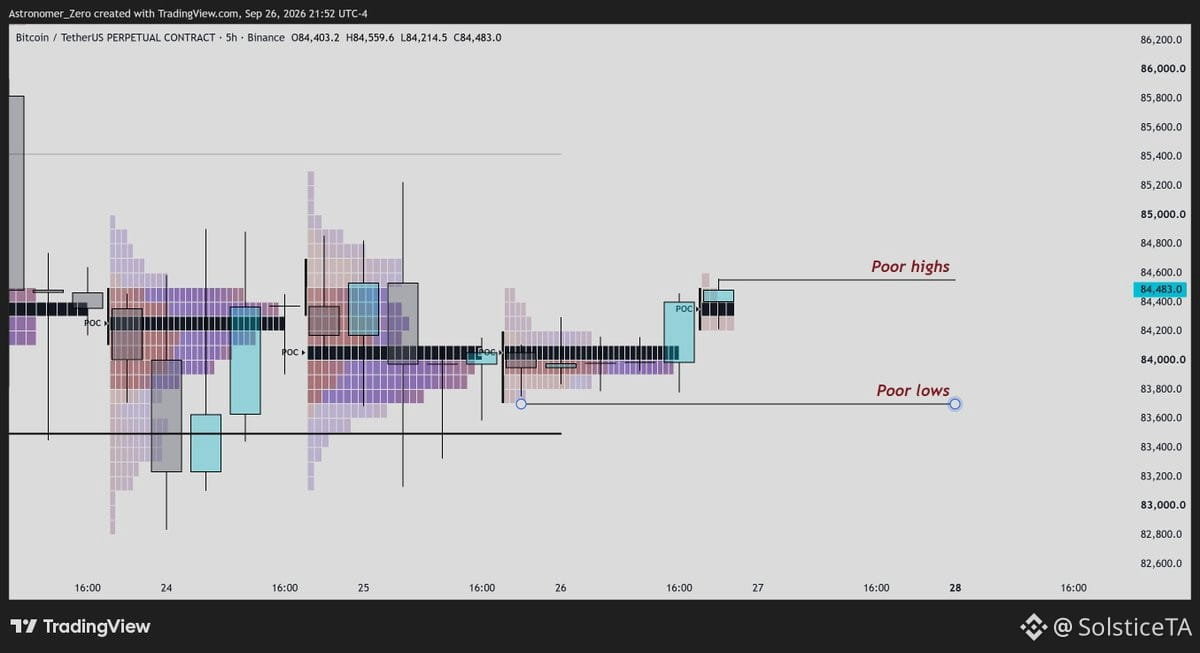
TPO structure: poor highs stacking above as we grind. Wait for them to clear or stop forming — that's when the upside stalls. Then we hunt poor lows below.
Basic order flow setup without overcomplicating it.
$BTC hourly read: order flow + structure
Market makers soaked aggressive selling into 84k this weekend — now we're bouncing off that zone. Feels temporary, probably perps-driven.
What I'm watching for a real reversal down:
• OI rising
• CVD on perps climbing
• Spot flat or leading lower
• Short liquidations first, then the drop
Funding rate already back near 87k levels — interesting.
My lean: early-week fake-out. Finish the weekend + start next week pushing higher, then roll over again.
TPO structure: poor highs stacking above as we grind. Wait for them to clear or stop forming — that's when the upside stalls. Then we hunt poor lows below.
Basic order flow setup without overcomplicating it.
Market makers soaked aggressive selling into 84k this weekend — now we're bouncing off that zone. Feels temporary, probably perps-driven.
What I'm watching for a real reversal down:
• OI rising
• CVD on perps climbing
• Spot flat or leading lower
• Short liquidations first, then the drop
Funding rate already back near 87k levels — interesting.
My lean: early-week fake-out. Finish the weekend + start next week pushing higher, then roll over again.
TPO structure: poor highs stacking above as we grind. Wait for them to clear or stop forming — that's when the upside stalls. Then we hunt poor lows below.
Basic order flow setup without overcomplicating it.
784
·
--
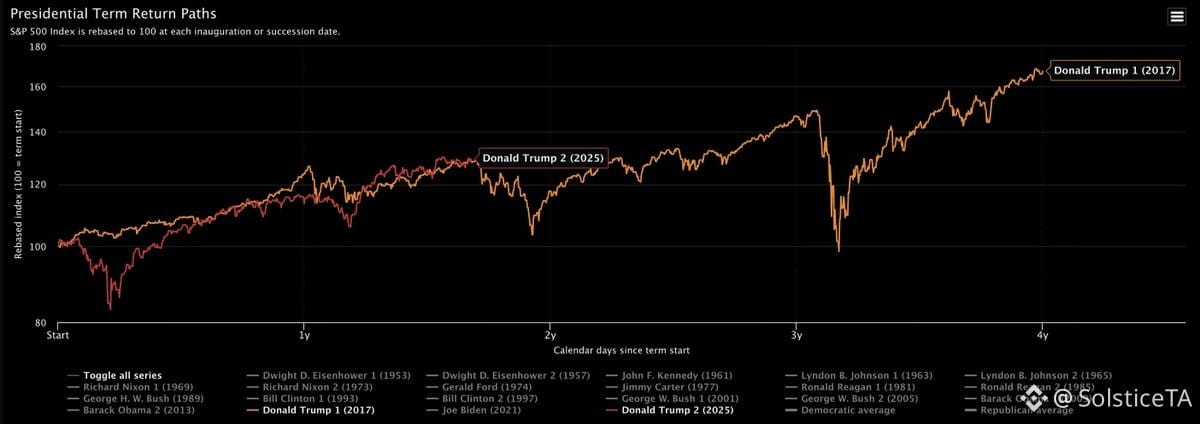
SPX weakness kicked in around this time during Trump's first term. Stocks have been ridiculously resilient lately despite yields climbing, energy spiking, and DXY pushing higher.
Now we're entering the seasonal weakness window. Question is whether that resilience holds or if we finally see some give. Watching closely.
SPX weakness kicked in around this time during Trump's first term. Stocks have been ridiculously resilient lately despite yields climbing, energy spiking, and DXY pushing higher.
Now we're entering the seasonal weakness window. Question is whether that resilience holds or if we finally see some give. Watching closely.
Now we're entering the seasonal weakness window. Question is whether that resilience holds or if we finally see some give. Watching closely.
355
·
--
I've laid out all my chart structure, cycle math, and timing windows for why I still see $75k getting tested — likely before we rip higher. Now I'm genuinely curious: what's the bull case actually built on?
Where's the data backing "no retrace, straight up from here"? Are we just riding vibes and hopium, or is there real structure, liquidity flow, or macro backing that call?
Because right now, the permabull crowd sounds like they're running on sentiment and FOMO, not levels or logic. If you're that confident we never see sub-$75k again, show me what you're watching — not just the feeling that "bull market is back, baby."
I respect conviction when it's earned. But conviction without structure is just gambling with extra confidence.
I've laid out all my chart structure, cycle math, and timing windows for why I still see $75k getting tested — likely before we rip higher. Now I'm genuinely curious: what's the bull case actually built on?
Where's the data backing "no retrace, straight up from here"? Are we just riding vibes and hopium, or is there real structure, liquidity flow, or macro backing that call?
Because right now, the permabull crowd sounds like they're running on sentiment and FOMO, not levels or logic. If you're that confident we never see sub-$75k again, show me what you're watching — not just the feeling that "bull market is back, baby."
I respect conviction when it's earned. But conviction without structure is just gambling with extra confidence.
Where's the data backing "no retrace, straight up from here"? Are we just riding vibes and hopium, or is there real structure, liquidity flow, or macro backing that call?
Because right now, the permabull crowd sounds like they're running on sentiment and FOMO, not levels or logic. If you're that confident we never see sub-$75k again, show me what you're watching — not just the feeling that "bull market is back, baby."
I respect conviction when it's earned. But conviction without structure is just gambling with extra confidence.
1
1
593
·
--
Fed's losing control of the long end. Yields running away from them.
Warsh talks tough on inflation, but will they actually follow through? A 50bps hike isn't off the table if they're serious.
The question isn't what they say—it's what they're willing to do when the curve starts pricing them out. Right now, the bond market's calling their bluff.
This matters for risk assets. If they capitulate, liquidity stays loose and $BTC catches a bid. If they shock with 50bps, we get a flush first. Watch the 10-year—it's telling you what comes next before Powell does.
Fed's losing control of the long end. Yields running away from them.
Warsh talks tough on inflation, but will they actually follow through? A 50bps hike isn't off the table if they're serious.
The question isn't what they say—it's what they're willing to do when the curve starts pricing them out. Right now, the bond market's calling their bluff.
This matters for risk assets. If they capitulate, liquidity stays loose and $BTC catches a bid. If they shock with 50bps, we get a flush first. Watch the 10-year—it's telling you what comes next before Powell does.
Warsh talks tough on inflation, but will they actually follow through? A 50bps hike isn't off the table if they're serious.
The question isn't what they say—it's what they're willing to do when the curve starts pricing them out. Right now, the bond market's calling their bluff.
This matters for risk assets. If they capitulate, liquidity stays loose and $BTC catches a bid. If they shock with 50bps, we get a flush first. Watch the 10-year—it's telling you what comes next before Powell does.
IEFETF-0,48%
3
1
636
·
--
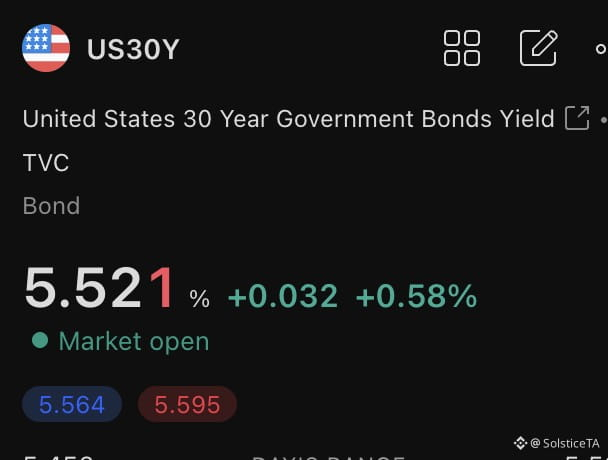
Bond yields aren't listening to Bessent — they're moving the opposite direction and basically laughing at anyone who faded them. When the Treasury Secretary tells you to short bonds and the market immediately runs the other way, that's not just noise. It's a power move by the bond vigilantes.
This matters for risk assets. When yields spike despite dovish talk, liquidity conditions tighten whether the Fed likes it or not. $BTC and equities feel that squeeze through the back door — higher real rates, tighter financial conditions, less fuel for speculative positioning.
Watch the 10-year. If it keeps climbing while officials talk it down, we're in a different regime. The market is pricing something they're not saying out loud yet.
Bond yields aren't listening to Bessent — they're moving the opposite direction and basically laughing at anyone who faded them. When the Treasury Secretary tells you to short bonds and the market immediately runs the other way, that's not just noise. It's a power move by the bond vigilantes.
This matters for risk assets. When yields spike despite dovish talk, liquidity conditions tighten whether the Fed likes it or not. $BTC and equities feel that squeeze through the back door — higher real rates, tighter financial conditions, less fuel for speculative positioning.
Watch the 10-year. If it keeps climbing while officials talk it down, we're in a different regime. The market is pricing something they're not saying out loud yet.
This matters for risk assets. When yields spike despite dovish talk, liquidity conditions tighten whether the Fed likes it or not. $BTC and equities feel that squeeze through the back door — higher real rates, tighter financial conditions, less fuel for speculative positioning.
Watch the 10-year. If it keeps climbing while officials talk it down, we're in a different regime. The market is pricing something they're not saying out loud yet.
BTC-0,79%
TLTETF-0,91%
1
1
415
·
--
This week's $BTC close is the tell for Q4. Clean acceptance above the May high? That's a structural flip — bull case gets real weight. But if we reject and roll back under, it's just another liquidity grab before the usual Q4 chop and weakness sets in. Doesn't mean new lows, but it does mean the breakout was fake.
No need to front-run it. Let price show its hand first, then react. The chart will tell you what it wants — forcing a read before the close just burns capital.
This week's $BTC close is the tell for Q4. Clean acceptance above the May high? That's a structural flip — bull case gets real weight. But if we reject and roll back under, it's just another liquidity grab before the usual Q4 chop and weakness sets in. Doesn't mean new lows, but it does mean the breakout was fake.
No need to front-run it. Let price show its hand first, then react. The chart will tell you what it wants — forcing a read before the close just burns capital.
No need to front-run it. Let price show its hand first, then react. The chart will tell you what it wants — forcing a read before the close just burns capital.
1
499
·
--
The cure for high rates? More high rates.
Long-end yields climbing puts pressure on growth, which eventually forces yields back down. We've seen this loop run multiple times over the past few years — no reason to think it won't repeat.
The sequence:
1. Yields spike (we're here now)
2. Growth scare hits
3. Yields roll over
Classic reflexive cycle. The bond market tightens conditions until something breaks or slows enough to justify easing. Then the whole thing resets. Watch for the growth scare signal — that's when the long end starts to crack and risk-on gets a bid again.
The cure for high rates? More high rates.
Long-end yields climbing puts pressure on growth, which eventually forces yields back down. We've seen this loop run multiple times over the past few years — no reason to think it won't repeat.
The sequence:
1. Yields spike (we're here now)
2. Growth scare hits
3. Yields roll over
Classic reflexive cycle. The bond market tightens conditions until something breaks or slows enough to justify easing. Then the whole thing resets. Watch for the growth scare signal — that's when the long end starts to crack and risk-on gets a bid again.
Long-end yields climbing puts pressure on growth, which eventually forces yields back down. We've seen this loop run multiple times over the past few years — no reason to think it won't repeat.
The sequence:
1. Yields spike (we're here now)
2. Growth scare hits
3. Yields roll over
Classic reflexive cycle. The bond market tightens conditions until something breaks or slows enough to justify easing. Then the whole thing resets. Watch for the growth scare signal — that's when the long end starts to crack and risk-on gets a bid again.
1
1
243
·
--
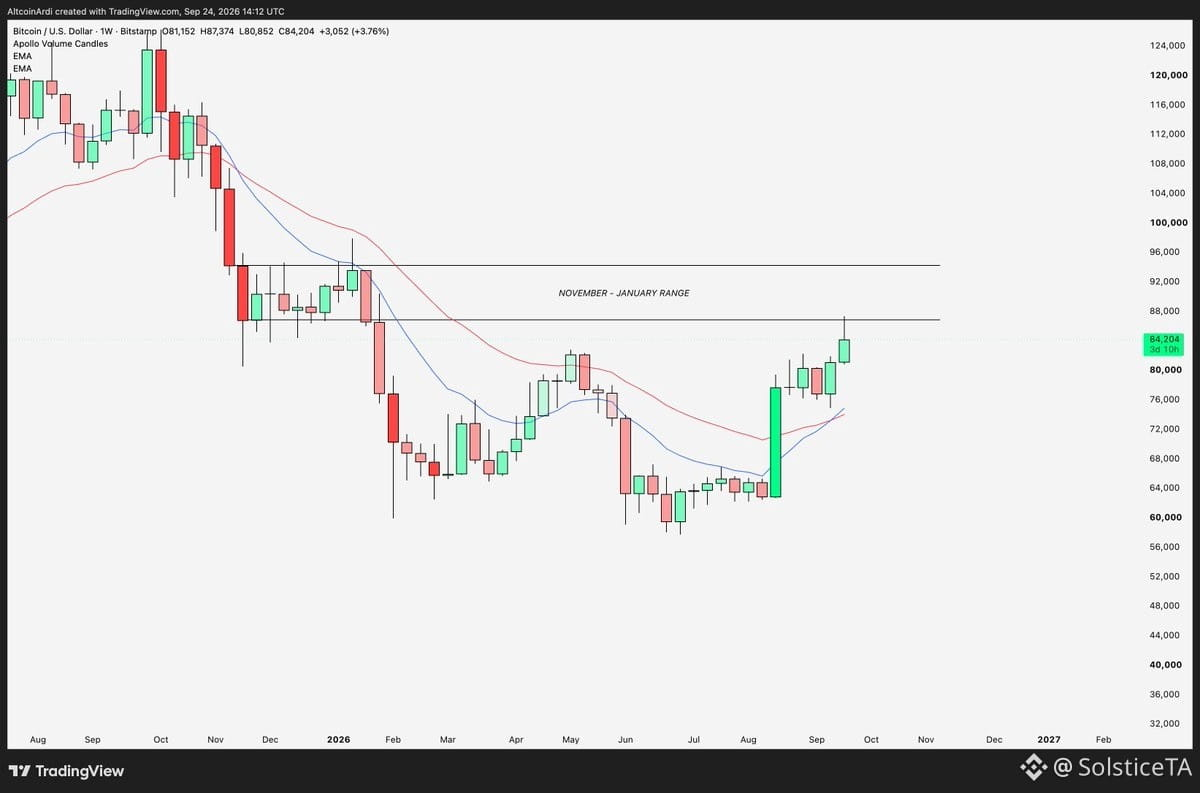
$BTC still can't hold inside that November–January range it left behind during the bear — roughly $80K to $97K. That was the first real relief bounce off the lows, so getting rejected on the first test back? Not shocking.
But if we keep failing to accept above $87K, odds go up that price hunts the liquidity sitting below before it tries again. Once we start closing weekly candles above $87K, then we can start grinding through that old range toward $93K–$97K.
Until that happens, expect chop. Liquidity hunts. Both sides getting their face ripped off.
$BTC still can't hold inside that November–January range it left behind during the bear — roughly $80K to $97K. That was the first real relief bounce off the lows, so getting rejected on the first test back? Not shocking.
But if we keep failing to accept above $87K, odds go up that price hunts the liquidity sitting below before it tries again. Once we start closing weekly candles above $87K, then we can start grinding through that old range toward $93K–$97K.
Until that happens, expect chop. Liquidity hunts. Both sides getting their face ripped off.
But if we keep failing to accept above $87K, odds go up that price hunts the liquidity sitting below before it tries again. Once we start closing weekly candles above $87K, then we can start grinding through that old range toward $93K–$97K.
Until that happens, expect chop. Liquidity hunts. Both sides getting their face ripped off.
1
2
759
·
--
The $BTC chart right now feels inverted — what should be support is acting like resistance, what should break is holding, and the structure that normally signals continuation is stalling out. Classic late-cycle fake-out or early reversal tell. When price action flips the script like this, it's either a liquidity trap before the real move or the first sign the trend is cracking. Watch how it resolves at the range edges — if it can't reclaim what it lost, the inversion becomes the new reality. Timing windows ahead will show if this is temporary disorientation or the start of something bigger.
The $BTC chart right now feels inverted — what should be support is acting like resistance, what should break is holding, and the structure that normally signals continuation is stalling out. Classic late-cycle fake-out or early reversal tell. When price action flips the script like this, it's either a liquidity trap before the real move or the first sign the trend is cracking. Watch how it resolves at the range edges — if it can't reclaim what it lost, the inversion becomes the new reality. Timing windows ahead will show if this is temporary disorientation or the start of something bigger.
79
Войдите, чтобы посмотреть больше материала
Присоединяйтесь к пользователям криптовалют по всему миру на Binance Square
⚡️ Получайте новейшую и полезную информацию о криптоактивах.
💬 Нам доверяет крупнейшая в мире криптобиржа.
👍 Получите достоверные аналитические данные от верифицированных создателей контента.
Эл. почта/номер телефона
В тренде
BinanceKZ
Просмотров: 8,898
50 обсуждают
Как я потерял 180 000 тенге на «менеджере Binance» из WhatsApp — и почему всё равно остался в крипте
phpdead
·Лайков: 6
·Просмотров: 2k
UKFCAWinsCourtOrderToRecover851400Pounds
Просмотров: 3,951
325 обсуждают
ChainlinkLaunchesCCIP2WithEnterpriseVerification
Просмотров: 15,444
596 обсуждают