

Crypto_Paykash
2.4k Публикации

Crypto_Paykash
Отправить жалобу
Заблокировать пользователя
Crypto enthusiast | Exploring blockchain and digital assets | Content creator | Writer | CMC KOL.
Открытая сделка
Случайный трейдер
4.3 г
15 подписок(и/а)
1.7K+ подписчиков(а)
3.2K+ понравилось
Посты
Портфель
Все
Цитирования
PINNED
For many traders that doesn't know how SpaceX $SPCX works is much bigger than many traders give it credit for.
From my perspective, anyone buying now should be thinking long term rather than chasing short-term price action. The company's future revenue potential is massive, so don't be surprised if the price trades below $100 at some point. That's completely normal in the stock market.
If you believe in the long-term story, short-term volatility is just part of the journey.
For many traders that doesn't know how SpaceX $SPCX works is much bigger than many traders give it credit for.
From my perspective, anyone buying now should be thinking long term rather than chasing short-term price action. The company's future revenue potential is massive, so don't be surprised if the price trades below $100 at some point. That's completely normal in the stock market.
If you believe in the long-term story, short-term volatility is just part of the journey.
From my perspective, anyone buying now should be thinking long term rather than chasing short-term price action. The company's future revenue potential is massive, so don't be surprised if the price trades below $100 at some point. That's completely normal in the stock market.
If you believe in the long-term story, short-term volatility is just part of the journey.
17
3
122
397.1k
PINNED
Статья
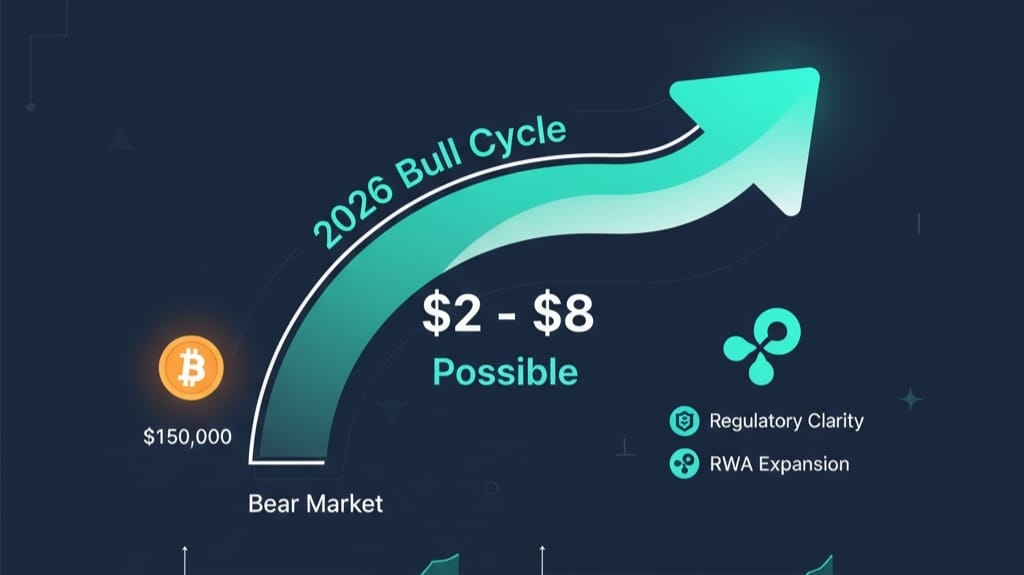
Understanding XRP’s Potential Cycle Turn in 2026Crypto markets move in cycles periods of rapid growth followed by deep corrections. In early 2026, sentiment feels bearish: Bitcoin sits near $69K after pulling back from 2025 highs, while major altcoins like Solana (SOL) and are down roughly 40–45% year-to-date. Historically, however, these pessimistic phases often set the stage for the next major rally.
XRP is particularly interesting right now. Trading around $1.40–$1.60, it remains below its 2018 ATH of $3.65 but far above the $0.20 lows seen in past downturns. The big question: Could 2026 mark a cycle turn from bear to bull?
What Are Crypto Market Cycles?
Crypto cycles typically align with Bitcoin’s four-year halving rhythm:
Accumulation, Bull Market, Distribution, Bear Market.
While we appear to be in a cooling phase, catalysts like ETF approvals, regulatory clarity, and institutional adoption can accelerate a reversal.
XRP’s 2026 Outlook
Analysts remain mixed but increasingly optimistic.
Conservative views: $2–$4 without major catalysts.
Bullish scenarios: $5–$8 if ETFs, regulation, and adoption improve.
Extreme upside: Higher targets depend heavily on mass institutional use.
Key drivers to watch:
Institutional inflows through potential XRP ETFs
Regulatory progress for Ripple
Expansion into real-world assets (RWAs)
A broader Bitcoin recovery
Technically, XRP appears to be defending previous breakout zones, suggesting $1.40 could act as strong support but regulatory setbacks or prolonged bearish conditions could keep it range-bound.
XRP vs. Solana: Speed vs. Stability
Solana tends to move faster due to retail hype, DeFi activity, and meme-coin ecosystems. Its cycles are explosive but volatile.
SOL: High-beta asset that often rebounds quickly.
XRP: Slower mover with stronger institutional narratives.
If alt season returns, may surge first, but XRP could deliver steadier, more sustainable gains.
XRP vs. Bitcoin: Following the Market Leader
Bitcoin still dictates macro direction. Historically, alts rally after BTC strengthens.
A BTC push toward new highs could lift XRP into the $4–$8 range.
Unlike Bitcoin’s scarcity-driven growth, XRP’s upside relies more on adoption and utility.
Expect higher volatility but also larger percentage moves.
In Conclusion:
Market cycles reward patience. While sentiment is uncertain, consolidation often comes before expansion.
The edge belongs to investors who stay informed and think long-term because the biggest moves usually begin when conviction is quiet.
Understanding XRP’s Potential Cycle Turn in 2026
Crypto markets move in cycles periods of rapid growth followed by deep corrections. In early 2026, sentiment feels bearish: Bitcoin sits near $69K after pulling back from 2025 highs, while major altcoins like Solana (SOL) and are down roughly 40–45% year-to-date. Historically, however, these pessimistic phases often set the stage for the next major rally.
XRP is particularly interesting right now. Trading around $1.40–$1.60, it remains below its 2018 ATH of $3.65 but far above the $0.20 lows seen in past downturns. The big question: Could 2026 mark a cycle turn from bear to bull?
What Are Crypto Market Cycles?
Crypto cycles typically align with Bitcoin’s four-year halving rhythm:
Accumulation, Bull Market, Distribution, Bear Market.
While we appear to be in a cooling phase, catalysts like ETF approvals, regulatory clarity, and institutional adoption can accelerate a reversal.
XRP’s 2026 Outlook
Analysts remain mixed but increasingly optimistic.
Conservative views: $2–$4 without major catalysts.
Bullish scenarios: $5–$8 if ETFs, regulation, and adoption improve.
Extreme upside: Higher targets depend heavily on mass institutional use.
Key drivers to watch:
Institutional inflows through potential XRP ETFs
Regulatory progress for Ripple
Expansion into real-world assets (RWAs)
A broader Bitcoin recovery
Technically, XRP appears to be defending previous breakout zones, suggesting $1.40 could act as strong support but regulatory setbacks or prolonged bearish conditions could keep it range-bound.
XRP vs. Solana: Speed vs. Stability
Solana tends to move faster due to retail hype, DeFi activity, and meme-coin ecosystems. Its cycles are explosive but volatile.
SOL: High-beta asset that often rebounds quickly.
XRP: Slower mover with stronger institutional narratives.
If alt season returns, may surge first, but XRP could deliver steadier, more sustainable gains.
XRP vs. Bitcoin: Following the Market Leader
Bitcoin still dictates macro direction. Historically, alts rally after BTC strengthens.
A BTC push toward new highs could lift XRP into the $4–$8 range.
Unlike Bitcoin’s scarcity-driven growth, XRP’s upside relies more on adoption and utility.
Expect higher volatility but also larger percentage moves.
In Conclusion:
Market cycles reward patience. While sentiment is uncertain, consolidation often comes before expansion.
The edge belongs to investors who stay informed and think long-term because the biggest moves usually begin when conviction is quiet.
XRP is particularly interesting right now. Trading around $1.40–$1.60, it remains below its 2018 ATH of $3.65 but far above the $0.20 lows seen in past downturns. The big question: Could 2026 mark a cycle turn from bear to bull?
What Are Crypto Market Cycles?
Crypto cycles typically align with Bitcoin’s four-year halving rhythm:
Accumulation, Bull Market, Distribution, Bear Market.
While we appear to be in a cooling phase, catalysts like ETF approvals, regulatory clarity, and institutional adoption can accelerate a reversal.
XRP’s 2026 Outlook
Analysts remain mixed but increasingly optimistic.
Conservative views: $2–$4 without major catalysts.
Bullish scenarios: $5–$8 if ETFs, regulation, and adoption improve.
Extreme upside: Higher targets depend heavily on mass institutional use.
Key drivers to watch:
Institutional inflows through potential XRP ETFs
Regulatory progress for Ripple
Expansion into real-world assets (RWAs)
A broader Bitcoin recovery
Technically, XRP appears to be defending previous breakout zones, suggesting $1.40 could act as strong support but regulatory setbacks or prolonged bearish conditions could keep it range-bound.
XRP vs. Solana: Speed vs. Stability
Solana tends to move faster due to retail hype, DeFi activity, and meme-coin ecosystems. Its cycles are explosive but volatile.
SOL: High-beta asset that often rebounds quickly.
XRP: Slower mover with stronger institutional narratives.
If alt season returns, may surge first, but XRP could deliver steadier, more sustainable gains.
XRP vs. Bitcoin: Following the Market Leader
Bitcoin still dictates macro direction. Historically, alts rally after BTC strengthens.
A BTC push toward new highs could lift XRP into the $4–$8 range.
Unlike Bitcoin’s scarcity-driven growth, XRP’s upside relies more on adoption and utility.
Expect higher volatility but also larger percentage moves.
In Conclusion:
Market cycles reward patience. While sentiment is uncertain, consolidation often comes before expansion.
The edge belongs to investors who stay informed and think long-term because the biggest moves usually begin when conviction is quiet.
8
5
71
55.5k
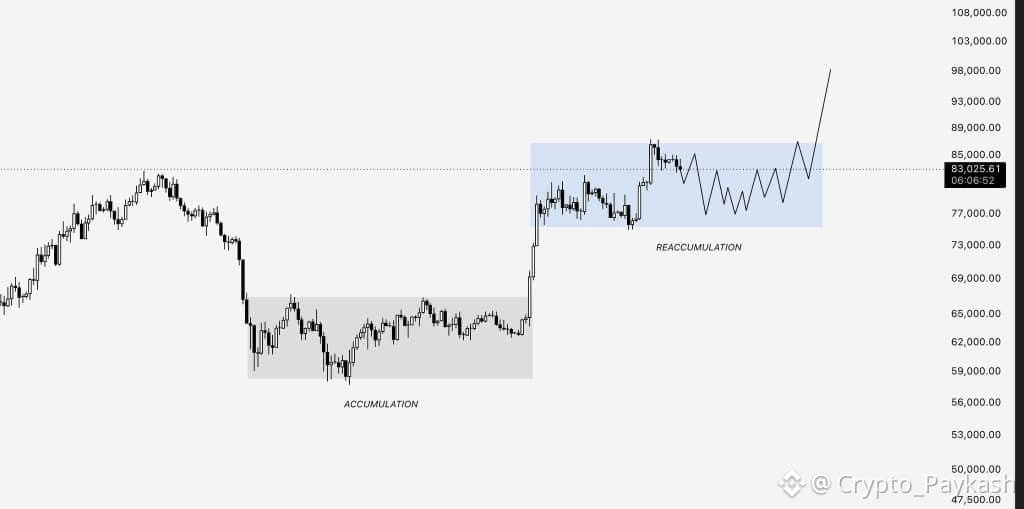
I think people are making this $BTC range way more complicated than it really is.
To me, this looks more like reaccumulation before the next move higher.
We already saw accumulation around the lows, followed by the first expansion. Now the market may simply be taking its time before the next phase.
That can mean pullbacks, failed breakouts and weeks of sideways price action. It doesn’t have to look perfect while it’s happening.
Every move toward the highs will have people thinking the next leg is starting. Then a pullback into support will have the same people wondering if the whole recovery was a trap.
That kind of chop can make you change your mind every few days while the bigger structure hasn’t really changed.
I still see this as a potential rebuilding phase for the recovery, with the eventual breakout potentially coming to the upside.
#SECChairWantsStockMarketsOnChain
I think people are making this $BTC range way more complicated than it really is.
To me, this looks more like reaccumulation before the next move higher.
We already saw accumulation around the lows, followed by the first expansion. Now the market may simply be taking its time before the next phase.
That can mean pullbacks, failed breakouts and weeks of sideways price action. It doesn’t have to look perfect while it’s happening.
Every move toward the highs will have people thinking the next leg is starting. Then a pullback into support will have the same people wondering if the whole recovery was a trap.
That kind of chop can make you change your mind every few days while the bigger structure hasn’t really changed.
I still see this as a potential rebuilding phase for the recovery, with the eventual breakout potentially coming to the upside.
#SECChairWantsStockMarketsOnChain
To me, this looks more like reaccumulation before the next move higher.
We already saw accumulation around the lows, followed by the first expansion. Now the market may simply be taking its time before the next phase.
That can mean pullbacks, failed breakouts and weeks of sideways price action. It doesn’t have to look perfect while it’s happening.
Every move toward the highs will have people thinking the next leg is starting. Then a pullback into support will have the same people wondering if the whole recovery was a trap.
That kind of chop can make you change your mind every few days while the bigger structure hasn’t really changed.
I still see this as a potential rebuilding phase for the recovery, with the eventual breakout potentially coming to the upside.
#SECChairWantsStockMarketsOnChain
81
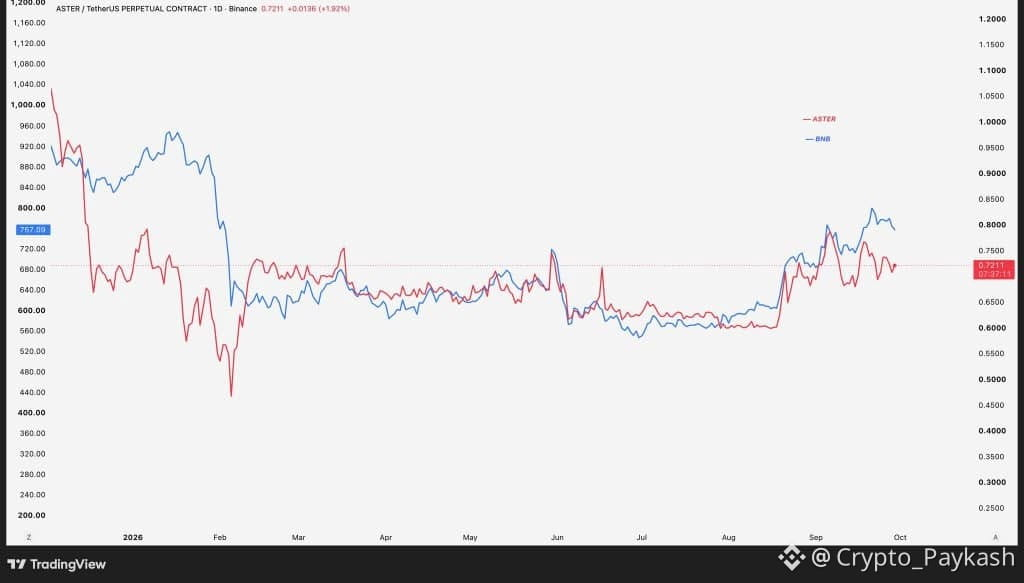
If ASTER is supposedly “going to zero” just because of its price action, then why isn’t the same logic being applied to $BNB ?
Put both charts side by side and the comparison gets interesting.
$ASTER had a much sharper sell-off earlier this year, but it also went from around $0.17 to $2.40 in just one month before that correction.
Since the initial flush, though, the price action has been surprisingly similar. Both have gone through declines, consolidation and attempts to recover.
Yet somehow, one chart is being treated as evidence that the project is finished, while the other is viewed as a normal market cycle.
If the entire bearish case for ASTER is simply that it dropped during a weak market, then the comparison deserves a closer look.
What makes similar price action a normal correction for one token but a supposed “trip to zero” for the other?
#EarningsSeason
If ASTER is supposedly “going to zero” just because of its price action, then why isn’t the same logic being applied to $BNB ?
Put both charts side by side and the comparison gets interesting.
$ASTER had a much sharper sell-off earlier this year, but it also went from around $0.17 to $2.40 in just one month before that correction.
Since the initial flush, though, the price action has been surprisingly similar. Both have gone through declines, consolidation and attempts to recover.
Yet somehow, one chart is being treated as evidence that the project is finished, while the other is viewed as a normal market cycle.
If the entire bearish case for ASTER is simply that it dropped during a weak market, then the comparison deserves a closer look.
What makes similar price action a normal correction for one token but a supposed “trip to zero” for the other?
#EarningsSeason
Put both charts side by side and the comparison gets interesting.
$ASTER had a much sharper sell-off earlier this year, but it also went from around $0.17 to $2.40 in just one month before that correction.
Since the initial flush, though, the price action has been surprisingly similar. Both have gone through declines, consolidation and attempts to recover.
Yet somehow, one chart is being treated as evidence that the project is finished, while the other is viewed as a normal market cycle.
If the entire bearish case for ASTER is simply that it dropped during a weak market, then the comparison deserves a closer look.
What makes similar price action a normal correction for one token but a supposed “trip to zero” for the other?
#EarningsSeason
98
🇰🇷 NEW: Kakao Pay Securities has signed agreements with $ONDO Finance and Dinari to explore bringing tokenized South Korean stocks to overseas investors.
Another interesting step toward putting Korean equities on-chain and making them more accessible to global markets.
🇰🇷 NEW: Kakao Pay Securities has signed agreements with $ONDO Finance and Dinari to explore bringing tokenized South Korean stocks to overseas investors.
Another interesting step toward putting Korean equities on-chain and making them more accessible to global markets.
Another interesting step toward putting Korean equities on-chain and making them more accessible to global markets.


57
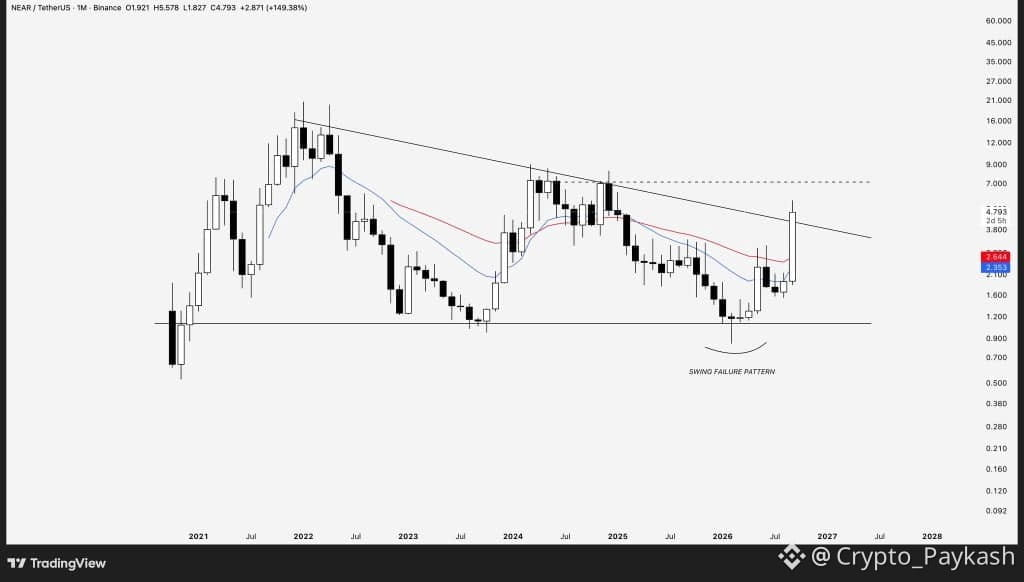
Look at the monthly chart on $NEAR and it’s hard to ignore what’s changed.
A monthly swing failure at the lows.
A break above a five-year downtrend.
Monthly EMAs reclaimed for the first time in 18 months.
That’s the reason I started getting bullish around $3.50.
As long as NEAR holds above that trendline, I’m letting the chart speak for itself. The structure is finally showing the kind of change bulls have been waiting years to see.
#StrategyAdds1666BTCHoldingsReach847666
Look at the monthly chart on $NEAR and it’s hard to ignore what’s changed.
A monthly swing failure at the lows.
A break above a five-year downtrend.
Monthly EMAs reclaimed for the first time in 18 months.
That’s the reason I started getting bullish around $3.50.
As long as NEAR holds above that trendline, I’m letting the chart speak for itself. The structure is finally showing the kind of change bulls have been waiting years to see.
#StrategyAdds1666BTCHoldingsReach847666
A monthly swing failure at the lows.
A break above a five-year downtrend.
Monthly EMAs reclaimed for the first time in 18 months.
That’s the reason I started getting bullish around $3.50.
As long as NEAR holds above that trendline, I’m letting the chart speak for itself. The structure is finally showing the kind of change bulls have been waiting years to see.
#StrategyAdds1666BTCHoldingsReach847666
3
631
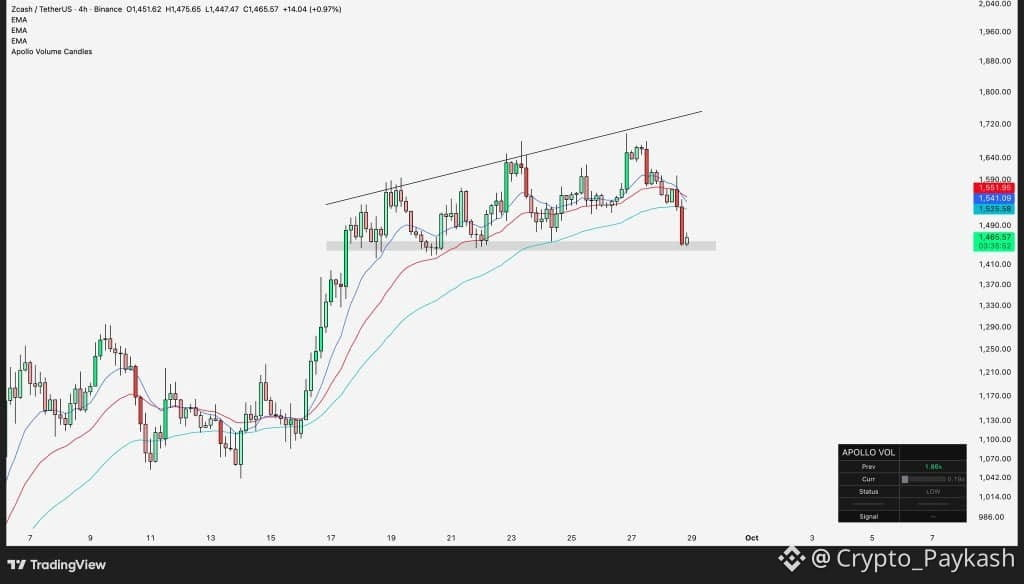
I’m still bullish on $ZEC, but I’m not going to ignore how important $1,420 is at this stage of price discovery.
I’ve been saying this all week.
As long as $1,420 holds, the local structure remains intact. If it breaks, I’d be watching for a deeper sweep toward $1,250 or even lower, regardless of how bullish I am on ZEC this cycle.
That’s when we’ll find out who actually wanted the dip.
Everyone says they’ll buy a correction while price is going up. But once the market starts dumping, the narrative changes quickly.
The people who thought they missed the move get the lower entry they were waiting for, then start waiting for an even lower one.
#StrategyAdds1666BTCHoldingsReach847666
I’m still bullish on $ZEC, but I’m not going to ignore how important $1,420 is at this stage of price discovery.
I’ve been saying this all week.
As long as $1,420 holds, the local structure remains intact. If it breaks, I’d be watching for a deeper sweep toward $1,250 or even lower, regardless of how bullish I am on ZEC this cycle.
That’s when we’ll find out who actually wanted the dip.
Everyone says they’ll buy a correction while price is going up. But once the market starts dumping, the narrative changes quickly.
The people who thought they missed the move get the lower entry they were waiting for, then start waiting for an even lower one.
#StrategyAdds1666BTCHoldingsReach847666
I’ve been saying this all week.
As long as $1,420 holds, the local structure remains intact. If it breaks, I’d be watching for a deeper sweep toward $1,250 or even lower, regardless of how bullish I am on ZEC this cycle.
That’s when we’ll find out who actually wanted the dip.
Everyone says they’ll buy a correction while price is going up. But once the market starts dumping, the narrative changes quickly.
The people who thought they missed the move get the lower entry they were waiting for, then start waiting for an even lower one.
#StrategyAdds1666BTCHoldingsReach847666
82
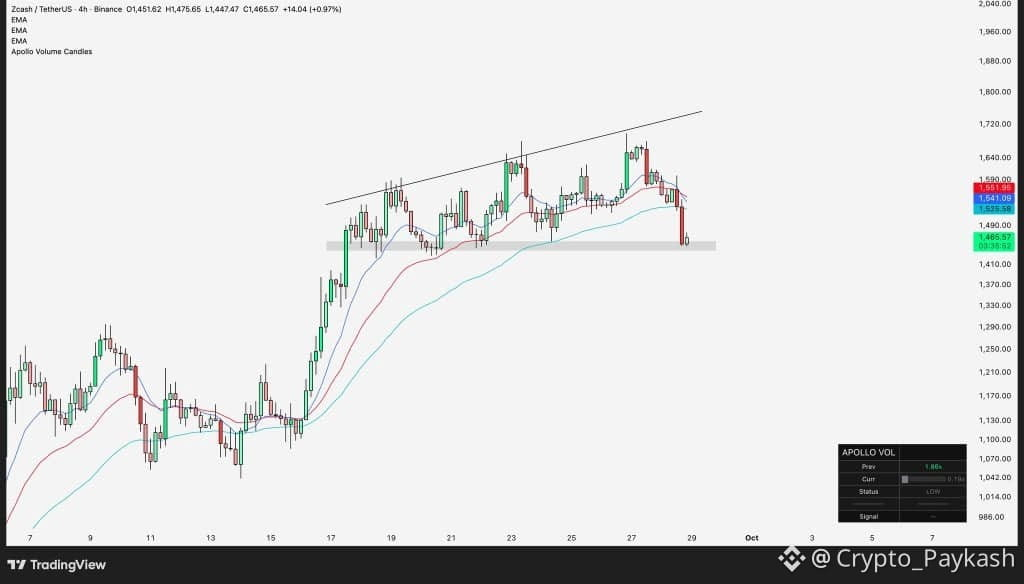
I’m still bullish on $ZEC, but I’m not going to ignore how important $1,420 is at this stage of price discovery.
I’ve been saying this all week.
As long as $1,420 holds, the local structure remains intact. If it breaks, I’d be watching for a deeper sweep toward $1,250 or even lower, regardless of how bullish I am on ZEC this cycle.
That’s when we’ll find out who actually wanted the dip.
Everyone says they’ll buy a correction while price is going up. But once the market starts dumping, the narrative changes quickly.
The people who thought they missed the move get the lower entry they were waiting for, then start waiting for an even lower one.
#StrategyAdds1666BTCHoldingsReach847666
I’m still bullish on $ZEC, but I’m not going to ignore how important $1,420 is at this stage of price discovery.
I’ve been saying this all week.
As long as $1,420 holds, the local structure remains intact. If it breaks, I’d be watching for a deeper sweep toward $1,250 or even lower, regardless of how bullish I am on ZEC this cycle.
That’s when we’ll find out who actually wanted the dip.
Everyone says they’ll buy a correction while price is going up. But once the market starts dumping, the narrative changes quickly.
The people who thought they missed the move get the lower entry they were waiting for, then start waiting for an even lower one.
#StrategyAdds1666BTCHoldingsReach847666
I’ve been saying this all week.
As long as $1,420 holds, the local structure remains intact. If it breaks, I’d be watching for a deeper sweep toward $1,250 or even lower, regardless of how bullish I am on ZEC this cycle.
That’s when we’ll find out who actually wanted the dip.
Everyone says they’ll buy a correction while price is going up. But once the market starts dumping, the narrative changes quickly.
The people who thought they missed the move get the lower entry they were waiting for, then start waiting for an even lower one.
#StrategyAdds1666BTCHoldingsReach847666
223
🇺🇸 Spot ETF flows were strong last week, with BTC, ETH, $SOL and XRP all recording net inflows.
BTC: $2.39B
ETH: $689.88M
SOL: $188.22M
$XRP : $75.59M
Another week of fresh capital flowing into the crypto ETF market. 📊
#FedProposesPaymentStablecoinRules
🇺🇸 Spot ETF flows were strong last week, with BTC, ETH, $SOL and XRP all recording net inflows.
BTC: $2.39B
ETH: $689.88M
SOL: $188.22M
$XRP : $75.59M
Another week of fresh capital flowing into the crypto ETF market. 📊
#FedProposesPaymentStablecoinRules
BTC: $2.39B
ETH: $689.88M
SOL: $188.22M
$XRP : $75.59M
Another week of fresh capital flowing into the crypto ETF market. 📊
#FedProposesPaymentStablecoinRules
90
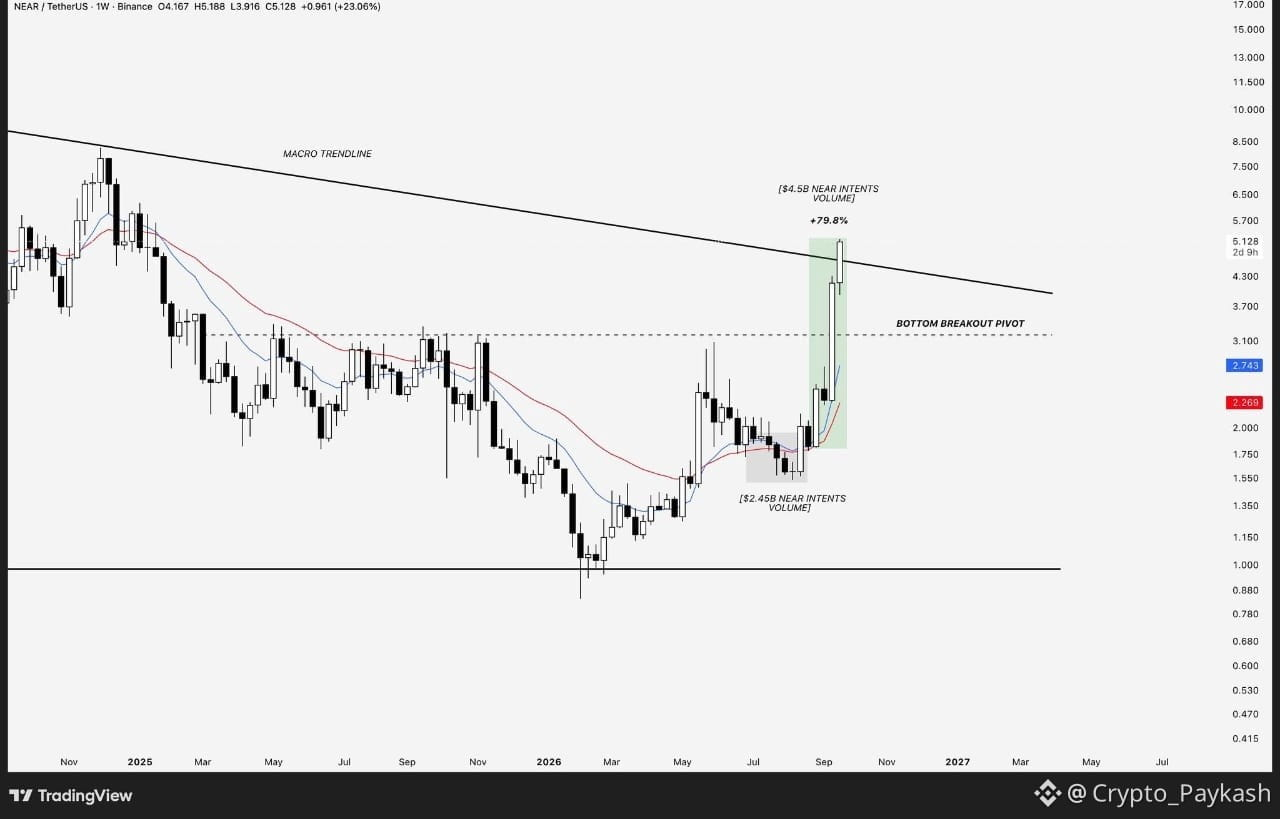
You don’t need to overcomplicate why $NEAR has been outperforming the market.
NEAR Intents turnover is up 80% over the past month, with nearly $5B in transactions processed in the last 30 days.
At the same time, the chart had already started showing signs of a bottom and broke out of its macro downtrend. That was the setup we were watching before the bigger move came.
Sometimes, the opportunity is right in front of you. Find a chart that has built a bottom.
Find a product people are actually using. Then study the asset closely and learn how it moves.
#SECSaysBuybacksUpgradesDontMakeTokenSecurity
You don’t need to overcomplicate why $NEAR has been outperforming the market.
NEAR Intents turnover is up 80% over the past month, with nearly $5B in transactions processed in the last 30 days.
At the same time, the chart had already started showing signs of a bottom and broke out of its macro downtrend. That was the setup we were watching before the bigger move came.
Sometimes, the opportunity is right in front of you. Find a chart that has built a bottom.
Find a product people are actually using. Then study the asset closely and learn how it moves.
#SECSaysBuybacksUpgradesDontMakeTokenSecurity
NEAR Intents turnover is up 80% over the past month, with nearly $5B in transactions processed in the last 30 days.
At the same time, the chart had already started showing signs of a bottom and broke out of its macro downtrend. That was the setup we were watching before the bigger move came.
Sometimes, the opportunity is right in front of you. Find a chart that has built a bottom.
Find a product people are actually using. Then study the asset closely and learn how it moves.
#SECSaysBuybacksUpgradesDontMakeTokenSecurity
56
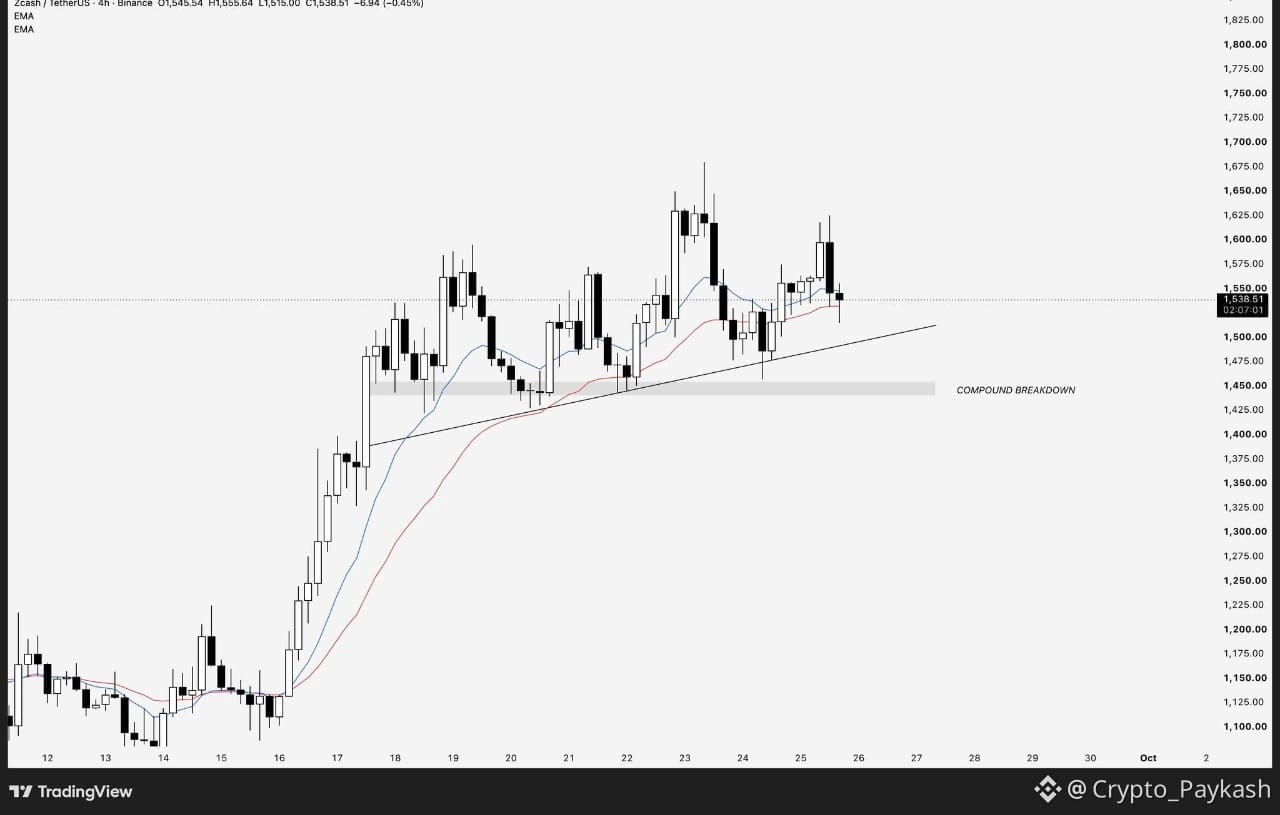
$ZEC has one key level to hold if this expansion is going to continue.
$1,420 is the level to watch.
As long as ZEC stays above it, the bullish structure remains intact and the move toward the highs can continue.
Lose $1,420, and we could see the first major structural breakdown since the rally started around $470.
That’s the level bulls really need to defend.
#SECCommissionerPeirceToLeaveOct2
$ZEC has one key level to hold if this expansion is going to continue.
$1,420 is the level to watch.
As long as ZEC stays above it, the bullish structure remains intact and the move toward the highs can continue.
Lose $1,420, and we could see the first major structural breakdown since the rally started around $470.
That’s the level bulls really need to defend.
#SECCommissionerPeirceToLeaveOct2
$1,420 is the level to watch.
As long as ZEC stays above it, the bullish structure remains intact and the move toward the highs can continue.
Lose $1,420, and we could see the first major structural breakdown since the rally started around $470.
That’s the level bulls really need to defend.
#SECCommissionerPeirceToLeaveOct2
210
🇺🇸 Spot ETF flows were positive across $BTC, $ETH, SOL and $XRP on Sept. 24.
BTC: +$190.65M
ETH: +$66.01M
SOL: +$32.81M
$XRP : +$14.89M
Another day of net inflows across the four assets.
#FedOctoberRateHikeOddsRiseTo69.7%
🇺🇸 Spot ETF flows were positive across $BTC, $ETH, SOL and $XRP on Sept. 24.
BTC: +$190.65M
ETH: +$66.01M
SOL: +$32.81M
$XRP : +$14.89M
Another day of net inflows across the four assets.
#FedOctoberRateHikeOddsRiseTo69.7%
BTC: +$190.65M
ETH: +$66.01M
SOL: +$32.81M
$XRP : +$14.89M
Another day of net inflows across the four assets.
#FedOctoberRateHikeOddsRiseTo69.7%

196
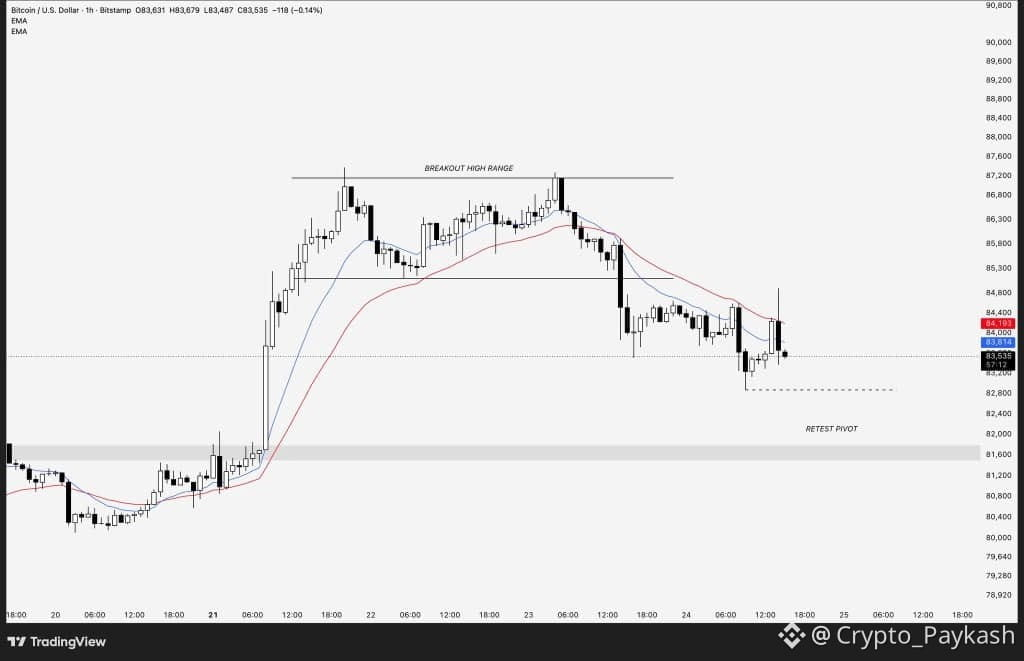
On the lower timeframes, $BTC is still struggling to reclaim the range highs.
For the upside to continue, getting back above $85K is the first key step.
As mentioned yesterday, $81K–$83K remains an important liquidity zone, and price has already started tapping into that area overnight. I’m watching $81.5K closely for a possible retest of the previous range breakout.
If that level holds, another attempt at the highs could follow.
If it breaks down, the market could open the door to a deeper move toward the $70Ks.
#FedOctoberRateHikeOddsRiseTo69.7%
On the lower timeframes, $BTC is still struggling to reclaim the range highs.
For the upside to continue, getting back above $85K is the first key step.
As mentioned yesterday, $81K–$83K remains an important liquidity zone, and price has already started tapping into that area overnight. I’m watching $81.5K closely for a possible retest of the previous range breakout.
If that level holds, another attempt at the highs could follow.
If it breaks down, the market could open the door to a deeper move toward the $70Ks.
#FedOctoberRateHikeOddsRiseTo69.7%
For the upside to continue, getting back above $85K is the first key step.
As mentioned yesterday, $81K–$83K remains an important liquidity zone, and price has already started tapping into that area overnight. I’m watching $81.5K closely for a possible retest of the previous range breakout.
If that level holds, another attempt at the highs could follow.
If it breaks down, the market could open the door to a deeper move toward the $70Ks.
#FedOctoberRateHikeOddsRiseTo69.7%
85
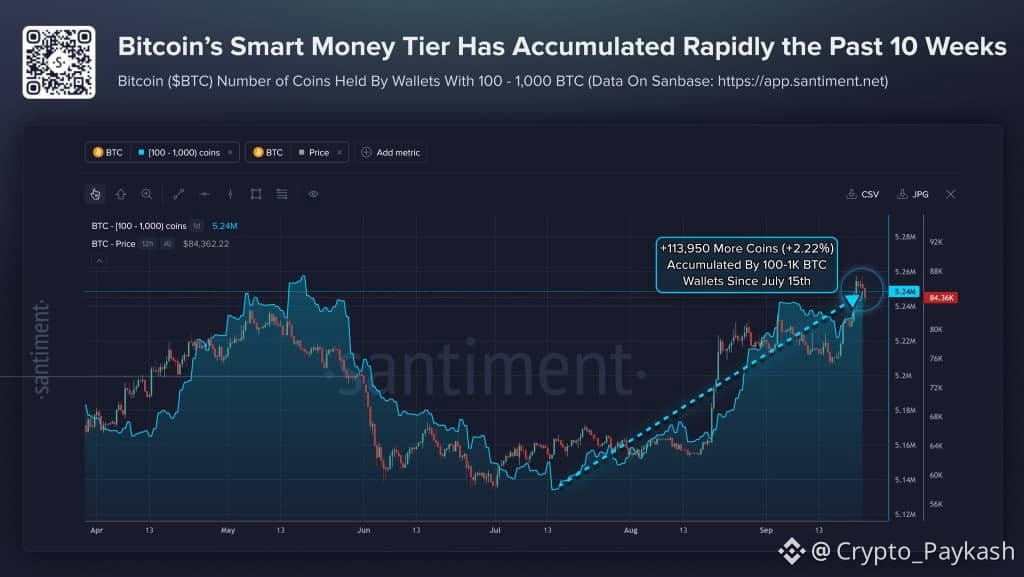
Bitcoin wallets holding between 100 and 1,000 BTC have added around 113,950 $BTC since mid-July, according to Santiment.
Their combined holdings now sit at roughly 5.24 million BTC.
That’s a notable increase in accumulation from this wallet group.
Bitcoin wallets holding between 100 and 1,000 BTC have added around 113,950 $BTC since mid-July, according to Santiment.
Their combined holdings now sit at roughly 5.24 million BTC.
That’s a notable increase in accumulation from this wallet group.
Their combined holdings now sit at roughly 5.24 million BTC.
That’s a notable increase in accumulation from this wallet group.
70
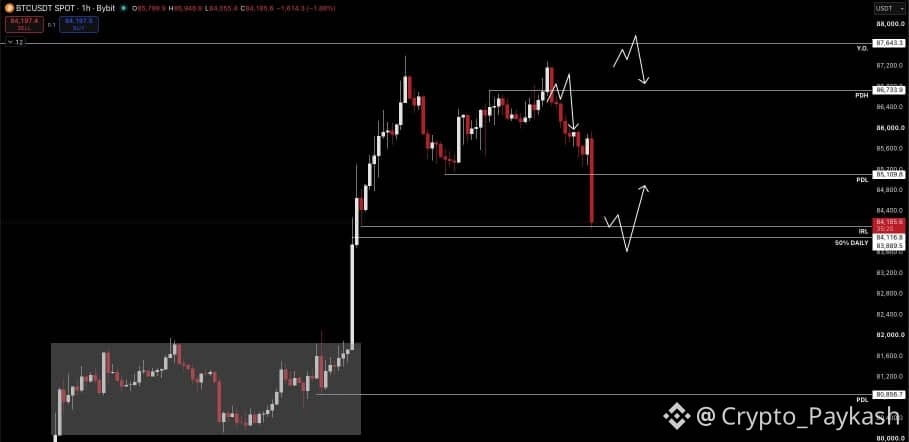
$BTC just printed a daily bearish engulfing candle as DXY and yields continue pushing higher.
As mentioned this morning, Bitcoin tried to hold the 85.1K PDL but couldn’t maintain it. Price is now approaching my first long POI around 84K.
It’s an aggressive setup, so I’d want to see 84K hold and a clear long trigger before considering an entry.
If that level fails, the next area I’m watching is around the top of the 82K range.
I missed the 86.8K short I mentioned yesterday, which would’ve been a solid RR setup. But that’s trading. You won’t catch every move.
Now it’s about seeing whether BTC can defend 84K or not.
#21SharesLaunchesEuropesFirstZcashETP
$BTC just printed a daily bearish engulfing candle as DXY and yields continue pushing higher.
As mentioned this morning, Bitcoin tried to hold the 85.1K PDL but couldn’t maintain it. Price is now approaching my first long POI around 84K.
It’s an aggressive setup, so I’d want to see 84K hold and a clear long trigger before considering an entry.
If that level fails, the next area I’m watching is around the top of the 82K range.
I missed the 86.8K short I mentioned yesterday, which would’ve been a solid RR setup. But that’s trading. You won’t catch every move.
Now it’s about seeing whether BTC can defend 84K or not.
#21SharesLaunchesEuropesFirstZcashETP
As mentioned this morning, Bitcoin tried to hold the 85.1K PDL but couldn’t maintain it. Price is now approaching my first long POI around 84K.
It’s an aggressive setup, so I’d want to see 84K hold and a clear long trigger before considering an entry.
If that level fails, the next area I’m watching is around the top of the 82K range.
I missed the 86.8K short I mentioned yesterday, which would’ve been a solid RR setup. But that’s trading. You won’t catch every move.
Now it’s about seeing whether BTC can defend 84K or not.
#21SharesLaunchesEuropesFirstZcashETP
1
85
🚨 LATEST: $META has been quietly using human contractors to handle some phone calls made through its new AI agent Muse, raising privacy concerns among employees, per Reuters.
#AIStocksWhatNext
🚨 LATEST: $META has been quietly using human contractors to handle some phone calls made through its new AI agent Muse, raising privacy concerns among employees, per Reuters.
#AIStocksWhatNext
#AIStocksWhatNext


134
⚡️ NEW: Ark Invest’s Cathie Wood believes a technology-driven productivity boom could push real GDP growth to 7% or higher while inflation continues to cool.
She also suggests investors may want to consider increasing their exposure to equities, with $BTC potentially benefiting from the same shift.
⚡️ NEW: Ark Invest’s Cathie Wood believes a technology-driven productivity boom could push real GDP growth to 7% or higher while inflation continues to cool.
She also suggests investors may want to consider increasing their exposure to equities, with $BTC potentially benefiting from the same shift.
She also suggests investors may want to consider increasing their exposure to equities, with $BTC potentially benefiting from the same shift.

70
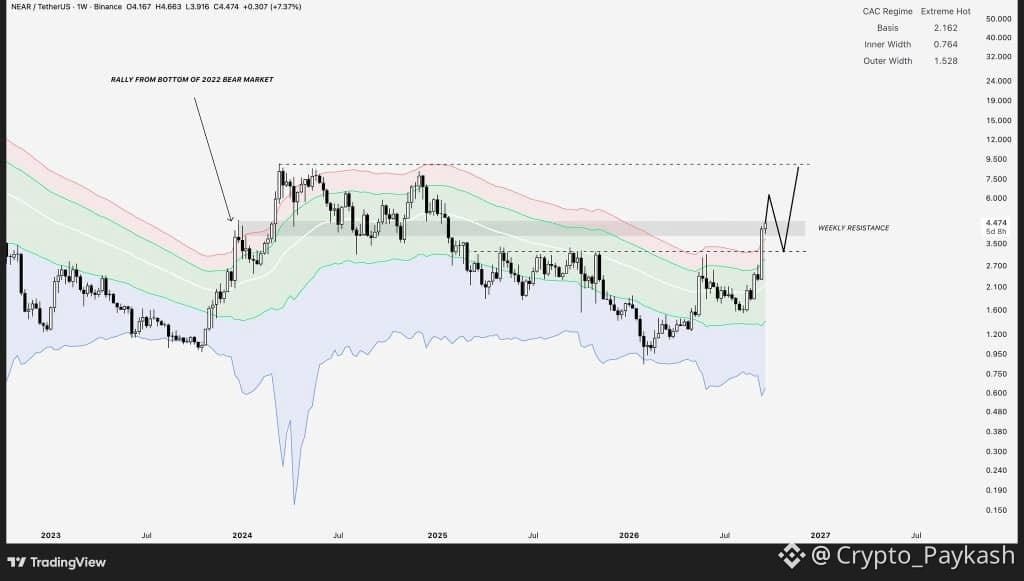
$NEAR is approaching an important weekly decision zone around $4.70.
A clean break above it could open the way toward $6–$7, but I wouldn’t expect the move to be straight up.
NEAR has moved quickly from the blue acceptance zone into a much hotter area. A pullback toward $3.30–$3.60 wouldn’t necessarily change the bigger setup. It could clear leverage, rebalance liquidity and give buyers a chance to show strength again.
For now, $4.70 is the key level to watch, while $3.30–$3.60 remains the main pullback zone.
Already positioned from $3.60 and up around 30%. Now we wait to see whether resistance breaks first or the market gives another entry lower.
$NEAR is approaching an important weekly decision zone around $4.70.
A clean break above it could open the way toward $6–$7, but I wouldn’t expect the move to be straight up.
NEAR has moved quickly from the blue acceptance zone into a much hotter area. A pullback toward $3.30–$3.60 wouldn’t necessarily change the bigger setup. It could clear leverage, rebalance liquidity and give buyers a chance to show strength again.
For now, $4.70 is the key level to watch, while $3.30–$3.60 remains the main pullback zone.
Already positioned from $3.60 and up around 30%. Now we wait to see whether resistance breaks first or the market gives another entry lower.
A clean break above it could open the way toward $6–$7, but I wouldn’t expect the move to be straight up.
NEAR has moved quickly from the blue acceptance zone into a much hotter area. A pullback toward $3.30–$3.60 wouldn’t necessarily change the bigger setup. It could clear leverage, rebalance liquidity and give buyers a chance to show strength again.
For now, $4.70 is the key level to watch, while $3.30–$3.60 remains the main pullback zone.
Already positioned from $3.60 and up around 30%. Now we wait to see whether resistance breaks first or the market gives another entry lower.
75
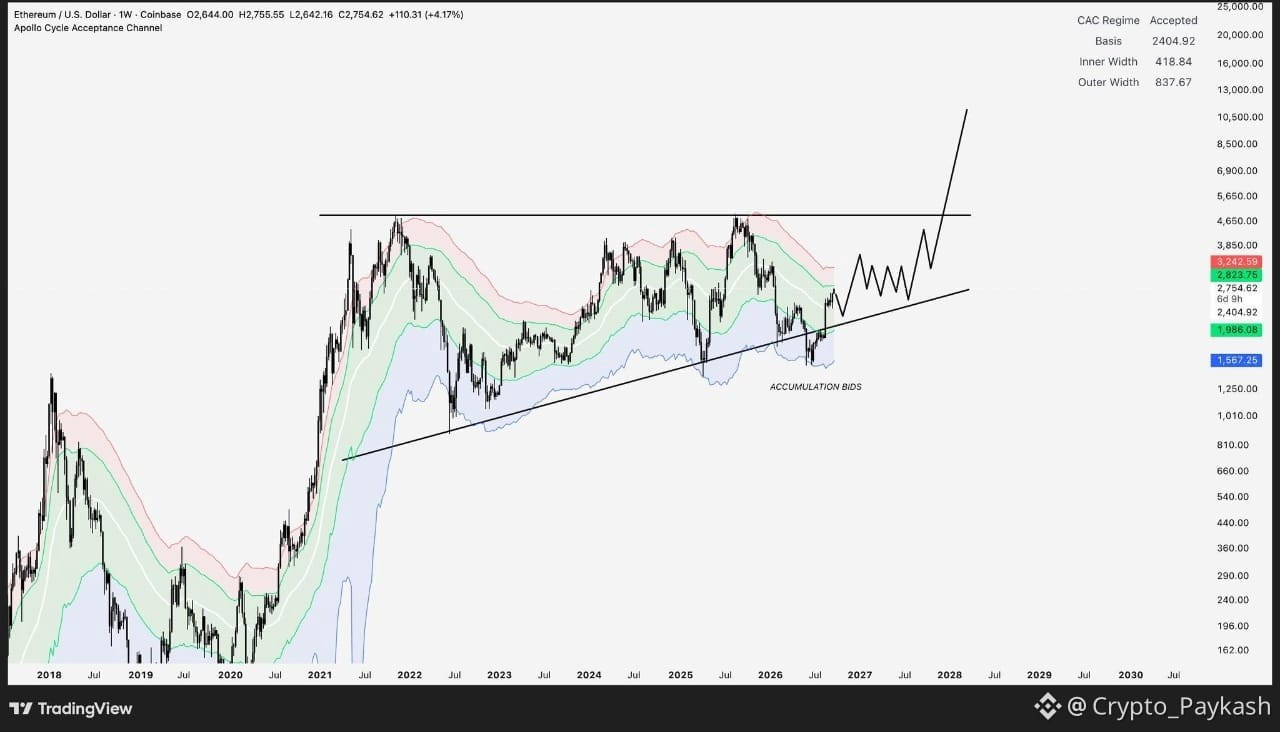
$ETH still has one of the cleanest macro setups among the major assets.
Back in April, I mapped out the structure I wanted to see: a return to the cycle acceptance zone, accumulation around the multi-year trendline, and eventually a move back above $2,500.
Six months later, Ethereum has followed that path pretty closely.
It may take some patience, but the next bigger expansion could eventually take ETH toward the $5,000 area.
For the second-largest asset in crypto, I still think sub-$3K levels deserve attention.
$ETH still has one of the cleanest macro setups among the major assets.
Back in April, I mapped out the structure I wanted to see: a return to the cycle acceptance zone, accumulation around the multi-year trendline, and eventually a move back above $2,500.
Six months later, Ethereum has followed that path pretty closely.
It may take some patience, but the next bigger expansion could eventually take ETH toward the $5,000 area.
For the second-largest asset in crypto, I still think sub-$3K levels deserve attention.
Back in April, I mapped out the structure I wanted to see: a return to the cycle acceptance zone, accumulation around the multi-year trendline, and eventually a move back above $2,500.
Six months later, Ethereum has followed that path pretty closely.
It may take some patience, but the next bigger expansion could eventually take ETH toward the $5,000 area.
For the second-largest asset in crypto, I still think sub-$3K levels deserve attention.
82
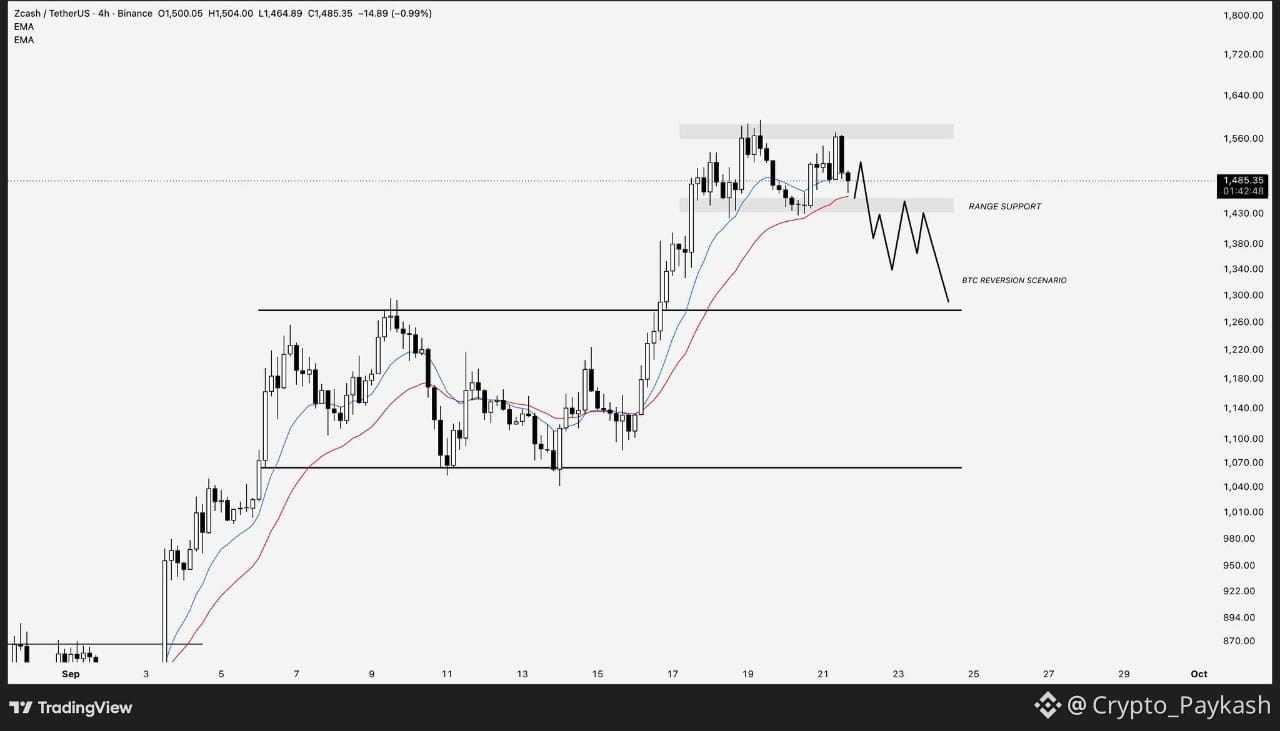
Funny how quickly the $ZEC narrative changes just because it didn’t follow $BTC higher for one day.
One day of underperformance shouldn’t erase how strong ZEC has been over the past six weeks. Over the last month alone, holding Zcash has outperformed Bitcoin by roughly 160%.
But no asset stays ahead forever. If the broader market pulls back and ZEC loses the $1,430 support, I’d be watching the $1,250 area as a potential liquidity zone.
After six weeks of expansion, a pullback could simply be the market giving buyers another chance to reload.
#CircleLaunchesInstitutionalBTCBackedBorrowing
Funny how quickly the $ZEC narrative changes just because it didn’t follow $BTC higher for one day.
One day of underperformance shouldn’t erase how strong ZEC has been over the past six weeks. Over the last month alone, holding Zcash has outperformed Bitcoin by roughly 160%.
But no asset stays ahead forever. If the broader market pulls back and ZEC loses the $1,430 support, I’d be watching the $1,250 area as a potential liquidity zone.
After six weeks of expansion, a pullback could simply be the market giving buyers another chance to reload.
#CircleLaunchesInstitutionalBTCBackedBorrowing
One day of underperformance shouldn’t erase how strong ZEC has been over the past six weeks. Over the last month alone, holding Zcash has outperformed Bitcoin by roughly 160%.
But no asset stays ahead forever. If the broader market pulls back and ZEC loses the $1,430 support, I’d be watching the $1,250 area as a potential liquidity zone.
After six weeks of expansion, a pullback could simply be the market giving buyers another chance to reload.
#CircleLaunchesInstitutionalBTCBackedBorrowing
85
Войдите, чтобы посмотреть больше материала
Присоединяйтесь к пользователям криптовалют по всему миру на Binance Square
⚡️ Получайте новейшую и полезную информацию о криптоактивах.
💬 Нам доверяет крупнейшая в мире криптобиржа.
👍 Получите достоверные аналитические данные от верифицированных создателей контента.
Эл. почта/номер телефона
В тренде
BinanceKZ
Просмотров: 25,238
70 обсуждают
Как я потерял 180 000 тенге на «менеджере Binance» из WhatsApp — и почему всё равно остался в крипте
phpdead
·Лайков: 6
·Просмотров: 2.4k
MetaMaskExitsLidoValidatorsAfterSecurityIncident
Просмотров: 4,670
222 обсуждают
MicronBeatsEarningsLiftsGuidance
Просмотров: 6,987
219 обсуждают