
Arslan Khan
651 Публикации

Arslan Khan
Отправить жалобу
Заблокировать пользователя
Crypto Analyst and Trader. Daily BTC, ETH, SOL and Altcoin Updates. Technical Analysis. Trade Smart. Manage Risk
Открытая сделка
Трейдер с частыми сделками
3.3 г
68 подписок(и/а)
206 подписчиков(а)
666 понравилось
Посты
Портфель
Все
Цитирования

·
--
Падение
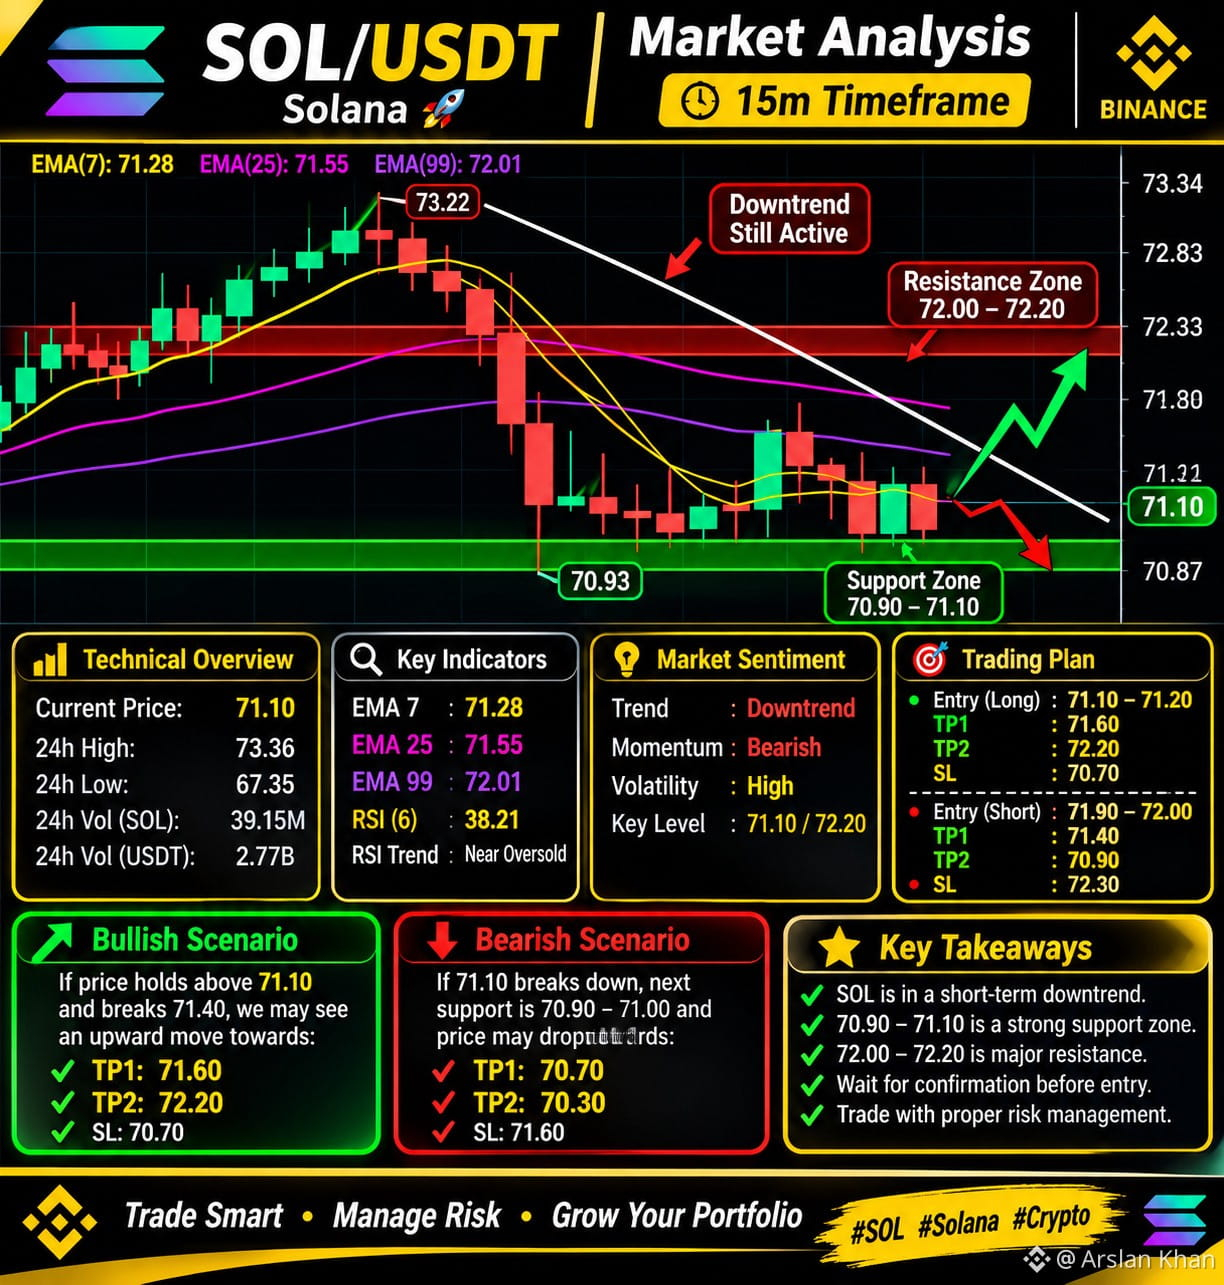
🚨 SOL/USDT – Detailed Technical Analysis | 15M Timeframe
📊 Current Market Overview
- Current Price: $71.10
- 24H High: $73.36
- 24H Low: $67.35
- 24H Change: -3.07%
🔍 Technical Analysis
SOL is currently showing short-term bearish momentum. The price is trading below all three major EMAs:
- EMA 7: $71.28
- EMA 25: $71.55
- EMA 99: $72.01
- RSI (6): 38.21
This indicates that sellers currently have the advantage. RSI is showing weak momentum, but a reversal confirmation is still needed.
🟢 Important Support Levels
- $71.10 – Immediate support
- $70.93 – Recent local low
- $70.70 – Next downside level
- $70.30 – Further bearish target
🔴 Important Resistance Levels
- $71.40 – First recovery level
- $71.55 – EMA 25 resistance
- $72.00 – $72.20 – Major resistance zone
- $72.83 – Higher resistance
📈 Bullish Scenario
If SOL holds above $71.10 and successfully breaks $71.40 with strong buying volume, a recovery towards these levels may become possible:
🎯 TP1: $71.60
🎯 TP2: $71.80
🎯 TP3: $72.20
📉 Bearish Scenario
If SOL loses the $71.10 support with a strong 15M candle close below it, further downside could follow.
🎯 TP1: $70.70
🎯 TP2: $70.30
⚠️ My Final Market View
The short-term trend remains bearish. Buyers need to reclaim $71.40 and overcome the EMA resistance before a stronger bullish recovery can be considered.
Don't rush into LONG or SHORT positions. Wait for candle confirmation, volume confirmation and proper risk management.
💡 Trade Smart. Stay Patient. Protect Your Capital.
What is your view on SOL?
Are we going to see a recovery or another downside move?
$SOL
{future}(SOLUSDT)
$BTC
{spot}(BTCUSDT)
#Solana #CryptoAnalysis #BinanceSquare #TradFiForBeginners #CryptoSelloffTriggersMultipleWhaleLiquidations
🚨 SOL/USDT – Detailed Technical Analysis | 15M Timeframe
📊 Current Market Overview
- Current Price: $71.10
- 24H High: $73.36
- 24H Low: $67.35
- 24H Change: -3.07%
🔍 Technical Analysis
SOL is currently showing short-term bearish momentum. The price is trading below all three major EMAs:
- EMA 7: $71.28
- EMA 25: $71.55
- EMA 99: $72.01
- RSI (6): 38.21
This indicates that sellers currently have the advantage. RSI is showing weak momentum, but a reversal confirmation is still needed.
🟢 Important Support Levels
- $71.10 – Immediate support
- $70.93 – Recent local low
- $70.70 – Next downside level
- $70.30 – Further bearish target
🔴 Important Resistance Levels
- $71.40 – First recovery level
- $71.55 – EMA 25 resistance
- $72.00 – $72.20 – Major resistance zone
- $72.83 – Higher resistance
📈 Bullish Scenario
If SOL holds above $71.10 and successfully breaks $71.40 with strong buying volume, a recovery towards these levels may become possible:
🎯 TP1: $71.60
🎯 TP2: $71.80
🎯 TP3: $72.20
📉 Bearish Scenario
If SOL loses the $71.10 support with a strong 15M candle close below it, further downside could follow.
🎯 TP1: $70.70
🎯 TP2: $70.30
⚠️ My Final Market View
The short-term trend remains bearish. Buyers need to reclaim $71.40 and overcome the EMA resistance before a stronger bullish recovery can be considered.
Don't rush into LONG or SHORT positions. Wait for candle confirmation, volume confirmation and proper risk management.
💡 Trade Smart. Stay Patient. Protect Your Capital.
What is your view on SOL?
Are we going to see a recovery or another downside move?
$SOL
$BTC
#Solana #CryptoAnalysis #BinanceSquare #TradFiForBeginners #CryptoSelloffTriggersMultipleWhaleLiquidations
📊 Current Market Overview
- Current Price: $71.10
- 24H High: $73.36
- 24H Low: $67.35
- 24H Change: -3.07%
🔍 Technical Analysis
SOL is currently showing short-term bearish momentum. The price is trading below all three major EMAs:
- EMA 7: $71.28
- EMA 25: $71.55
- EMA 99: $72.01
- RSI (6): 38.21
This indicates that sellers currently have the advantage. RSI is showing weak momentum, but a reversal confirmation is still needed.
🟢 Important Support Levels
- $71.10 – Immediate support
- $70.93 – Recent local low
- $70.70 – Next downside level
- $70.30 – Further bearish target
🔴 Important Resistance Levels
- $71.40 – First recovery level
- $71.55 – EMA 25 resistance
- $72.00 – $72.20 – Major resistance zone
- $72.83 – Higher resistance
📈 Bullish Scenario
If SOL holds above $71.10 and successfully breaks $71.40 with strong buying volume, a recovery towards these levels may become possible:
🎯 TP1: $71.60
🎯 TP2: $71.80
🎯 TP3: $72.20
📉 Bearish Scenario
If SOL loses the $71.10 support with a strong 15M candle close below it, further downside could follow.
🎯 TP1: $70.70
🎯 TP2: $70.30
⚠️ My Final Market View
The short-term trend remains bearish. Buyers need to reclaim $71.40 and overcome the EMA resistance before a stronger bullish recovery can be considered.
Don't rush into LONG or SHORT positions. Wait for candle confirmation, volume confirmation and proper risk management.
💡 Trade Smart. Stay Patient. Protect Your Capital.
What is your view on SOL?
Are we going to see a recovery or another downside move?
$SOL
$BTC
#Solana #CryptoAnalysis #BinanceSquare #TradFiForBeginners #CryptoSelloffTriggersMultipleWhaleLiquidations
1
1
209
·
--
Рост
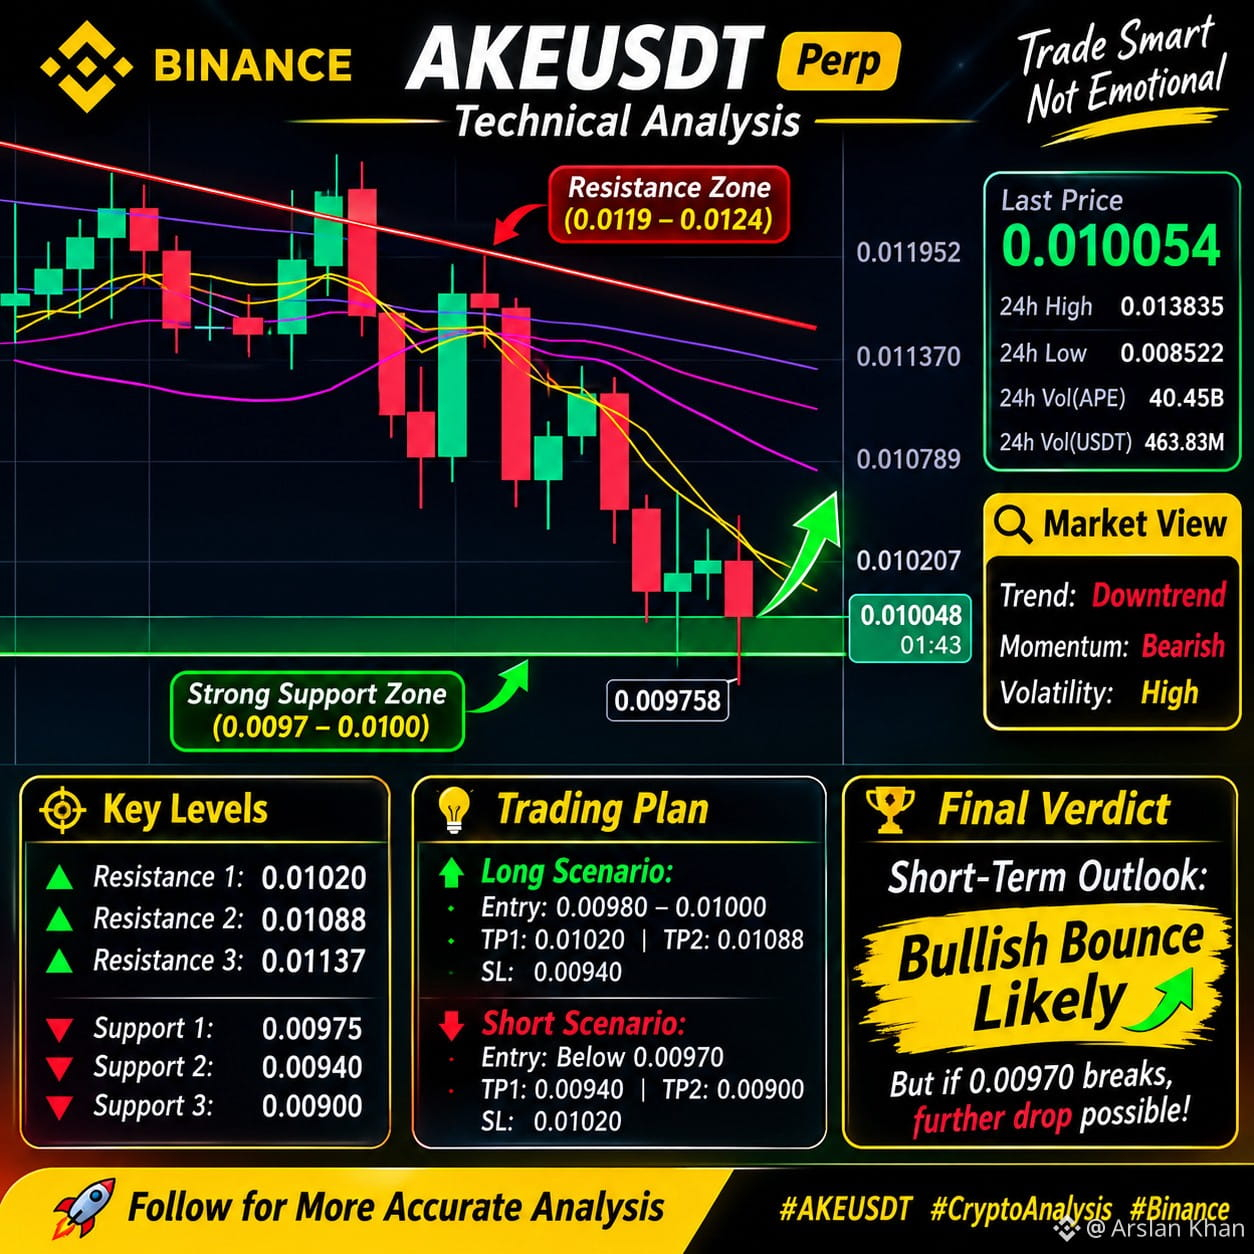
🚨 AKEUSDT – BEARS ARE STILL IN CONTROL!
AKE is showing strong bearish momentum on the 15-minute timeframe.
📊 Market Overview:
- Current Price: 0.010054
- 24H Change: -13.16%
- RSI(6): 29.39
- Trend: Bearish
🔴 Resistance Levels:
- 0.010445
- 0.011023
- 0.011456
🟢 Important Support:
- 0.009758
⚠️ My Analysis:
Price is trading below all major EMAs, indicating strong selling pressure. RSI is approaching oversold territory, so a temporary relief bounce is possible.
If support at 0.009758 breaks, further downside may follow. However, a strong recovery above 0.010445 could signal improving momentum.
🎯 Remember: Wait for confirmation. Don't chase the market. Always manage your risk.
What do you think? More downside or a potential bounce?
$AKE
{future}(AKEUSDT)
$BNB
{future}(BNBUSDT)
#AKEUSDT #Binance #CryptoAnalysis #WillFOMCMinutesReinforceRateHikeExpectations? #BitcoinActiveSupplyInProfitDropsBelow45%
🚨 AKEUSDT – BEARS ARE STILL IN CONTROL!
AKE is showing strong bearish momentum on the 15-minute timeframe.
📊 Market Overview:
- Current Price: 0.010054
- 24H Change: -13.16%
- RSI(6): 29.39
- Trend: Bearish
🔴 Resistance Levels:
- 0.010445
- 0.011023
- 0.011456
🟢 Important Support:
- 0.009758
⚠️ My Analysis:
Price is trading below all major EMAs, indicating strong selling pressure. RSI is approaching oversold territory, so a temporary relief bounce is possible.
If support at 0.009758 breaks, further downside may follow. However, a strong recovery above 0.010445 could signal improving momentum.
🎯 Remember: Wait for confirmation. Don't chase the market. Always manage your risk.
What do you think? More downside or a potential bounce?
$AKE
$BNB
#AKEUSDT #Binance #CryptoAnalysis #WillFOMCMinutesReinforceRateHikeExpectations? #BitcoinActiveSupplyInProfitDropsBelow45%
AKE is showing strong bearish momentum on the 15-minute timeframe.
📊 Market Overview:
- Current Price: 0.010054
- 24H Change: -13.16%
- RSI(6): 29.39
- Trend: Bearish
🔴 Resistance Levels:
- 0.010445
- 0.011023
- 0.011456
🟢 Important Support:
- 0.009758
⚠️ My Analysis:
Price is trading below all major EMAs, indicating strong selling pressure. RSI is approaching oversold territory, so a temporary relief bounce is possible.
If support at 0.009758 breaks, further downside may follow. However, a strong recovery above 0.010445 could signal improving momentum.
🎯 Remember: Wait for confirmation. Don't chase the market. Always manage your risk.
What do you think? More downside or a potential bounce?
$AKE
$BNB
#AKEUSDT #Binance #CryptoAnalysis #WillFOMCMinutesReinforceRateHikeExpectations? #BitcoinActiveSupplyInProfitDropsBelow45%
496
·
--
Рост
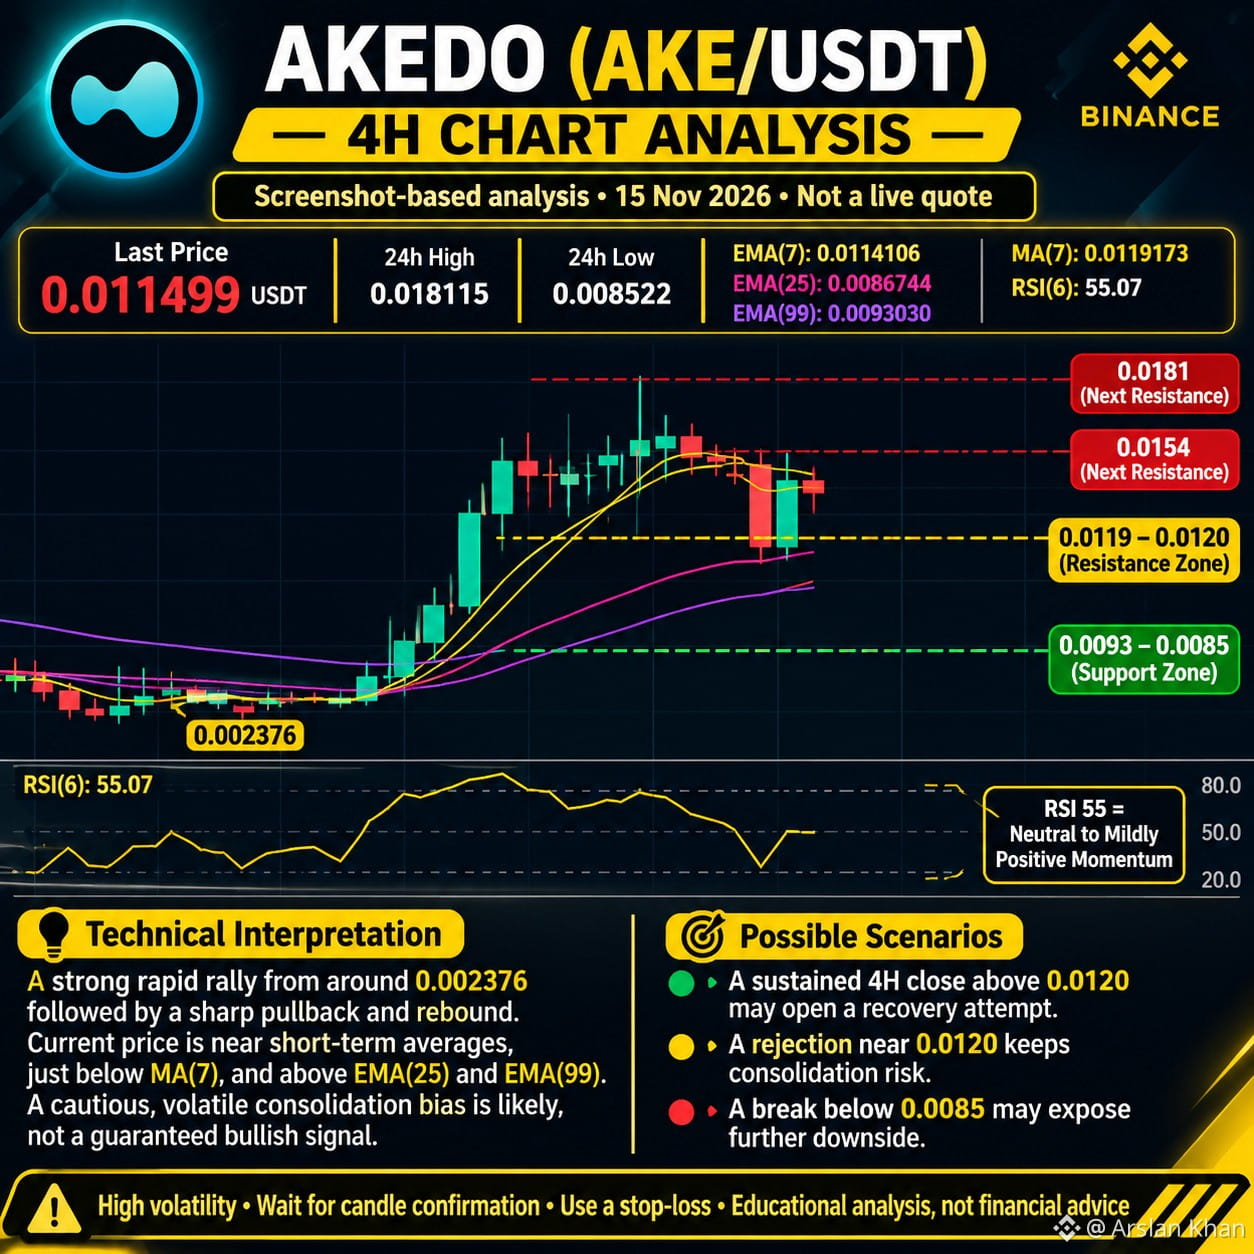
🚀 AKE (AKEDO) – IS ANOTHER BIG MOVE COMING?
AKE is attracting significant attention in the crypto market after an impressive rally.
📊 4H Technical Analysis
Current Price: $0.011499
🔴 Resistance 1: $0.0119–$0.0120 🔴 Resistance 2: $0.0154 🔴 Major Resistance: $0.0181
🟢 Support 1: $0.0093 🟢 Support 2: $0.0085
Market Structure:
AKE experienced a strong upward rally, followed by a sharp correction and a recovery bounce.
RSI (6) is around 55, showing neutral-to-positive short-term momentum.
Possible Scenarios:
🟢 Bullish: A confirmed 4H breakout above $0.0120 could open the door toward higher resistance levels.
🔴 Bearish: Rejection around $0.0120 could lead to another support retest.
⚠️ AKE is highly volatile. Avoid chasing pumps and always manage your risk.
What's your prediction for AKE?
🚀 BULLISH or 🐻 BEARISH?
$AKE
{future}(AKEUSDT)
#AKE #AKEDO #CryptoSelloffTriggersMultipleWhaleLiquidations #WhoWillSucceedJensenHuangatNvidia?
🚀 AKE (AKEDO) – IS ANOTHER BIG MOVE COMING?
AKE is attracting significant attention in the crypto market after an impressive rally.
📊 4H Technical Analysis
Current Price: $0.011499
🔴 Resistance 1: $0.0119–$0.0120 🔴 Resistance 2: $0.0154 🔴 Major Resistance: $0.0181
🟢 Support 1: $0.0093 🟢 Support 2: $0.0085
Market Structure:
AKE experienced a strong upward rally, followed by a sharp correction and a recovery bounce.
RSI (6) is around 55, showing neutral-to-positive short-term momentum.
Possible Scenarios:
🟢 Bullish: A confirmed 4H breakout above $0.0120 could open the door toward higher resistance levels.
🔴 Bearish: Rejection around $0.0120 could lead to another support retest.
⚠️ AKE is highly volatile. Avoid chasing pumps and always manage your risk.
What's your prediction for AKE?
🚀 BULLISH or 🐻 BEARISH?
$AKE
#AKE #AKEDO #CryptoSelloffTriggersMultipleWhaleLiquidations #WhoWillSucceedJensenHuangatNvidia?
AKE is attracting significant attention in the crypto market after an impressive rally.
📊 4H Technical Analysis
Current Price: $0.011499
🔴 Resistance 1: $0.0119–$0.0120 🔴 Resistance 2: $0.0154 🔴 Major Resistance: $0.0181
🟢 Support 1: $0.0093 🟢 Support 2: $0.0085
Market Structure:
AKE experienced a strong upward rally, followed by a sharp correction and a recovery bounce.
RSI (6) is around 55, showing neutral-to-positive short-term momentum.
Possible Scenarios:
🟢 Bullish: A confirmed 4H breakout above $0.0120 could open the door toward higher resistance levels.
🔴 Bearish: Rejection around $0.0120 could lead to another support retest.
⚠️ AKE is highly volatile. Avoid chasing pumps and always manage your risk.
What's your prediction for AKE?
🚀 BULLISH or 🐻 BEARISH?
$AKE
#AKE #AKEDO #CryptoSelloffTriggersMultipleWhaleLiquidations #WhoWillSucceedJensenHuangatNvidia?
1
1.2k
·
--
Рост
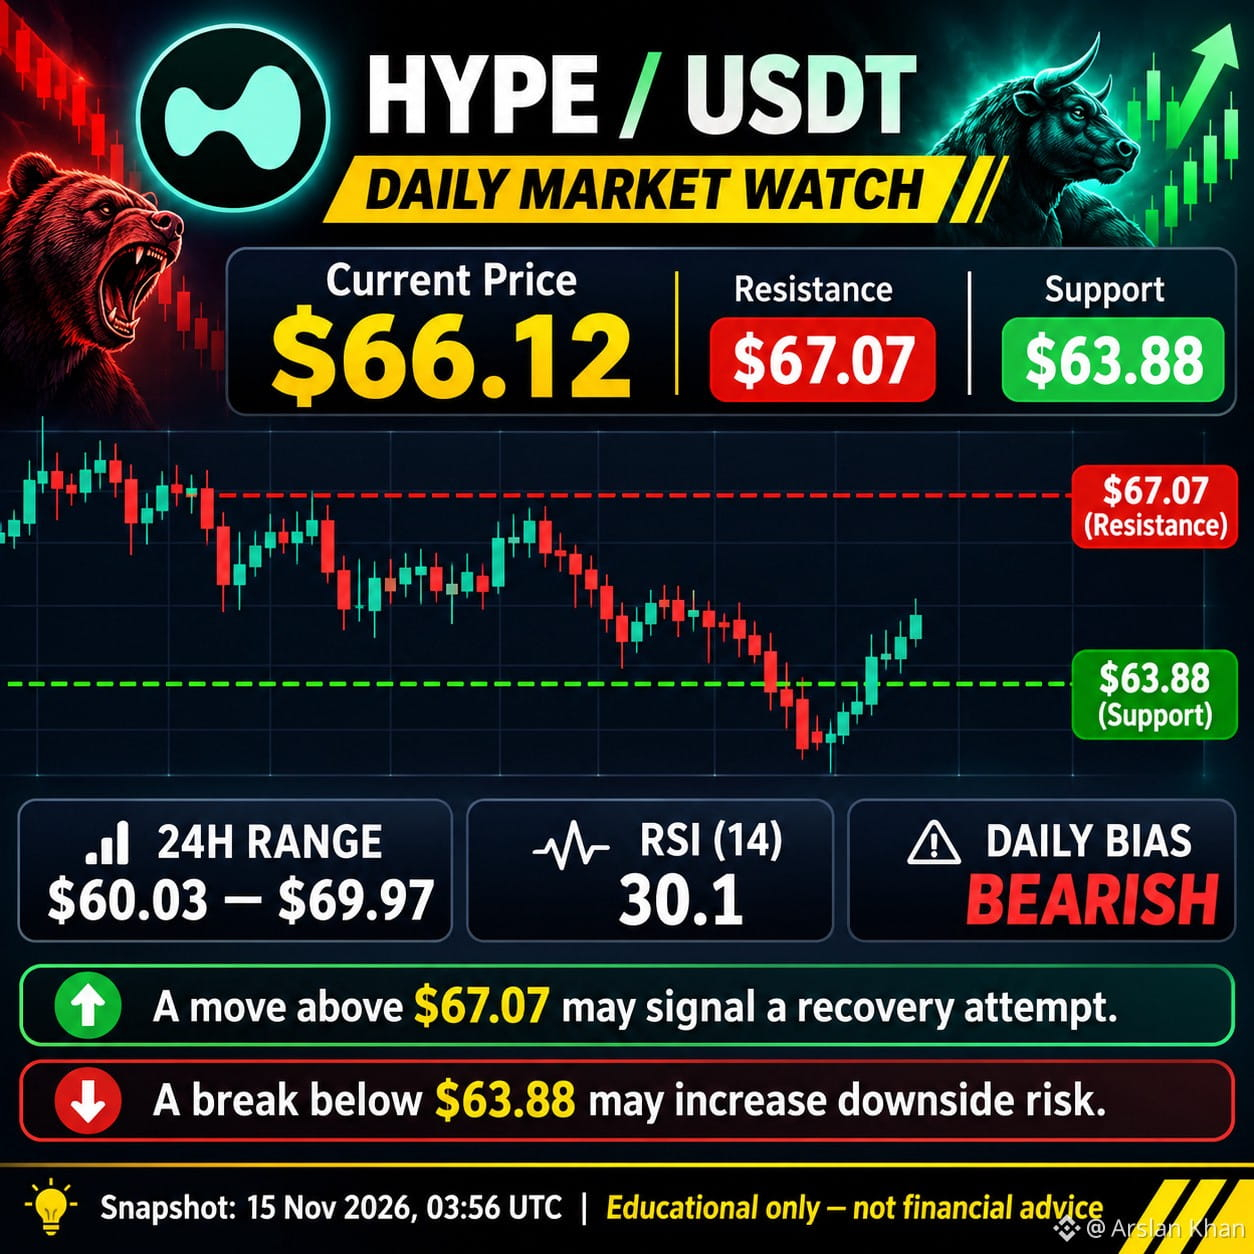
🔥 HYPE/USDT – DAILY MARKET ANALYSIS
📊 Key Market Levels:
- Current Price: $66.12
- Resistance: $67.07
- Support: $63.88
- RSI (14): 30.1
- Market Bias: Bearish
🔍 What to Watch Next?
🟢 Bullish Scenario: A confirmed breakout above $67.07 could signal a potential recovery.
🔴 Bearish Scenario: A breakdown below $63.88 could increase further downside pressure.
⚠️ RSI is near oversold territory, so a short-term relief bounce is also possible.
Trade Smart. Manage Risk. Never Chase the Market.
What's your view on HYPE? Bullish or Bearish? 👇
$HYPE
{spot}(HYPEUSDT)
$BTC
{spot}(BTCUSDT)
#Hyperliquid #BinanceSquare #CryptoSelloffTriggersMultipleWhaleLiquidations
🔥 HYPE/USDT – DAILY MARKET ANALYSIS
📊 Key Market Levels:
- Current Price: $66.12
- Resistance: $67.07
- Support: $63.88
- RSI (14): 30.1
- Market Bias: Bearish
🔍 What to Watch Next?
🟢 Bullish Scenario: A confirmed breakout above $67.07 could signal a potential recovery.
🔴 Bearish Scenario: A breakdown below $63.88 could increase further downside pressure.
⚠️ RSI is near oversold territory, so a short-term relief bounce is also possible.
Trade Smart. Manage Risk. Never Chase the Market.
What's your view on HYPE? Bullish or Bearish? 👇
$HYPE
$BTC
#Hyperliquid #BinanceSquare #CryptoSelloffTriggersMultipleWhaleLiquidations
📊 Key Market Levels:
- Current Price: $66.12
- Resistance: $67.07
- Support: $63.88
- RSI (14): 30.1
- Market Bias: Bearish
🔍 What to Watch Next?
🟢 Bullish Scenario: A confirmed breakout above $67.07 could signal a potential recovery.
🔴 Bearish Scenario: A breakdown below $63.88 could increase further downside pressure.
⚠️ RSI is near oversold territory, so a short-term relief bounce is also possible.
Trade Smart. Manage Risk. Never Chase the Market.
What's your view on HYPE? Bullish or Bearish? 👇
$HYPE
$BTC
#Hyperliquid #BinanceSquare #CryptoSelloffTriggersMultipleWhaleLiquidations
210
·
--
Рост
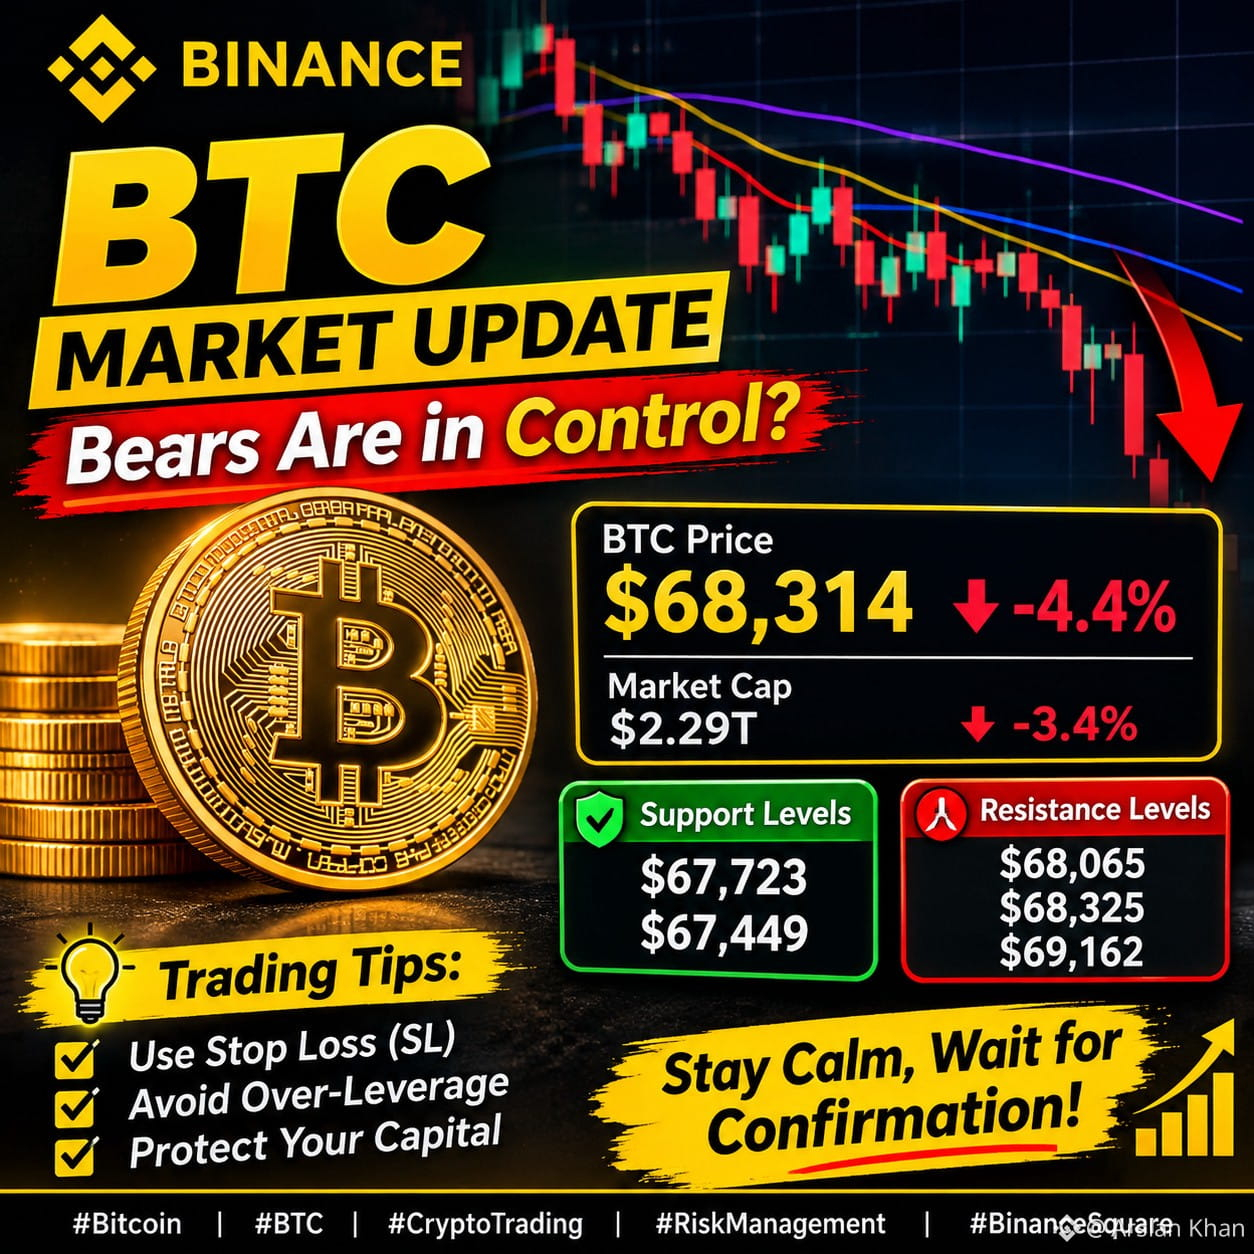
CRYPTO MARKET UPDATE: SELLING PRESSURE CONTINUES!
The crypto market closed under heavy selling pressure.
📊 Latest Binance market close:
BTC: $68,314 (-4.4%)
ETH: $1,930 (-4.4%)
Total crypto market cap: $2.29 trillion (-3.4%)
BTC weekly performance: -9.9%
What should traders watch next?
🔴 Can Bitcoin recover the $70,000 level?
🟢 Will buyers defend the recent lows?
⚠️ Volatility remains high. Avoid emotional
trades and wait for confirmation before entering the market.
What is your opinion? Is this a temporary correction or the beginning of a deeper market decline?
$BTC
{future}(BTCUSDT)
$ETH
{future}(ETHUSDT)
#BitcoinDunyamiz in #BTC C #Ethereum #ETH #CryptoMarket
CRYPTO MARKET UPDATE: SELLING PRESSURE CONTINUES!
The crypto market closed under heavy selling pressure.
📊 Latest Binance market close:
BTC: $68,314 (-4.4%)
ETH: $1,930 (-4.4%)
Total crypto market cap: $2.29 trillion (-3.4%)
BTC weekly performance: -9.9%
What should traders watch next?
🔴 Can Bitcoin recover the $70,000 level?
🟢 Will buyers defend the recent lows?
⚠️ Volatility remains high. Avoid emotional
trades and wait for confirmation before entering the market.
What is your opinion? Is this a temporary correction or the beginning of a deeper market decline?
$BTC
$ETH
#BitcoinDunyamiz in #BTC C #Ethereum #ETH #CryptoMarket
The crypto market closed under heavy selling pressure.
📊 Latest Binance market close:
BTC: $68,314 (-4.4%)
ETH: $1,930 (-4.4%)
Total crypto market cap: $2.29 trillion (-3.4%)
BTC weekly performance: -9.9%
What should traders watch next?
🔴 Can Bitcoin recover the $70,000 level?
🟢 Will buyers defend the recent lows?
⚠️ Volatility remains high. Avoid emotional
trades and wait for confirmation before entering the market.
What is your opinion? Is this a temporary correction or the beginning of a deeper market decline?
$BTC
$ETH
#BitcoinDunyamiz in #BTC C #Ethereum #ETH #CryptoMarket
73
·
--
Падение
🚨 BITCOIN (BTC) UPDATE – BEARS ARE IN CONTROL? 📉
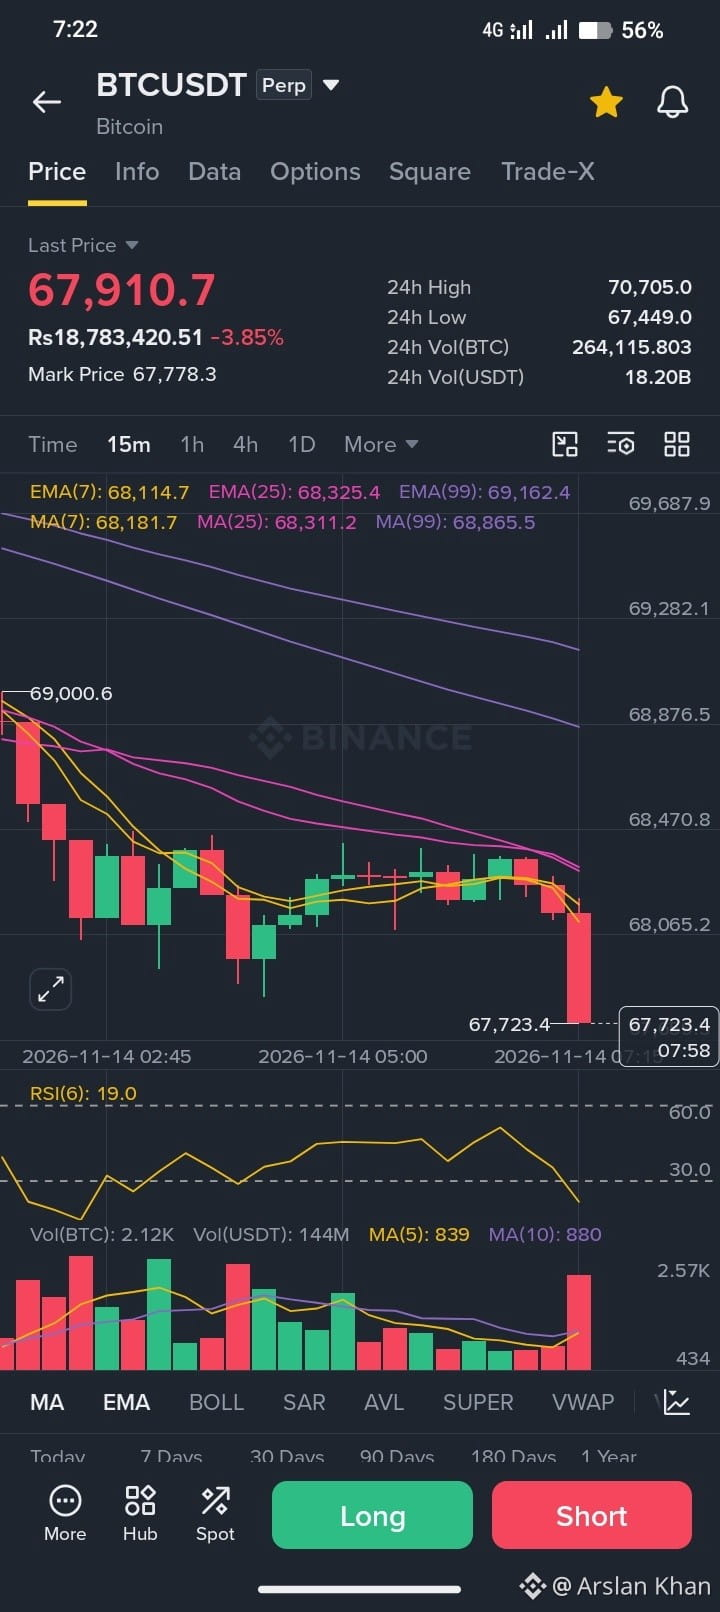
Bitcoin is showing strong selling pressure on the 15-minute timeframe.
🔴 Technical Overview:
Price: $67,910
24H Change: -3.85%
RSI (6): 19 – Oversold territory
EMA 7: $68,114
EMA 25: $68,325
EMA 99: $69,162
📊 Important Levels to Watch:
🟢 Support:
$67,723
$67,449
🔴 Resistance:
$68,065
$68,325
$69,162
My Market View:
BTC is currently under bearish pressure, with price trading below all major EMAs.
However, RSI is deeply oversold, so a short-term relief bounce or pullback is possible.
A breakdown below support could bring further downside, while reclaiming $68,325 may give buyers some strength.
⚠️ Don't chase the move. Wait for confirmation and manage your risk.
What do you think? Will BTC bounce back or continue falling?
$ETH
{future}(ETHUSDT)
$BTC
{future}(BTCUSDT)
#BTC☀️ #CryptoMarket #BinanceSquare #BTCUSDT #CryptoTrading
🚨 BITCOIN (BTC) UPDATE – BEARS ARE IN CONTROL? 📉
Bitcoin is showing strong selling pressure on the 15-minute timeframe.
🔴 Technical Overview:
Price: $67,910
24H Change: -3.85%
RSI (6): 19 – Oversold territory
EMA 7: $68,114
EMA 25: $68,325
EMA 99: $69,162
📊 Important Levels to Watch:
🟢 Support:
$67,723
$67,449
🔴 Resistance:
$68,065
$68,325
$69,162
My Market View:
BTC is currently under bearish pressure, with price trading below all major EMAs.
However, RSI is deeply oversold, so a short-term relief bounce or pullback is possible.
A breakdown below support could bring further downside, while reclaiming $68,325 may give buyers some strength.
⚠️ Don't chase the move. Wait for confirmation and manage your risk.
What do you think? Will BTC bounce back or continue falling?
$ETH
$BTC
#BTC☀️ #CryptoMarket #BinanceSquare #BTCUSDT #CryptoTrading
Bitcoin is showing strong selling pressure on the 15-minute timeframe.
🔴 Technical Overview:
Price: $67,910
24H Change: -3.85%
RSI (6): 19 – Oversold territory
EMA 7: $68,114
EMA 25: $68,325
EMA 99: $69,162
📊 Important Levels to Watch:
🟢 Support:
$67,723
$67,449
🔴 Resistance:
$68,065
$68,325
$69,162
My Market View:
BTC is currently under bearish pressure, with price trading below all major EMAs.
However, RSI is deeply oversold, so a short-term relief bounce or pullback is possible.
A breakdown below support could bring further downside, while reclaiming $68,325 may give buyers some strength.
⚠️ Don't chase the move. Wait for confirmation and manage your risk.
What do you think? Will BTC bounce back or continue falling?
$ETH
$BTC
#BTC☀️ #CryptoMarket #BinanceSquare #BTCUSDT #CryptoTrading
84
·
--
Падение
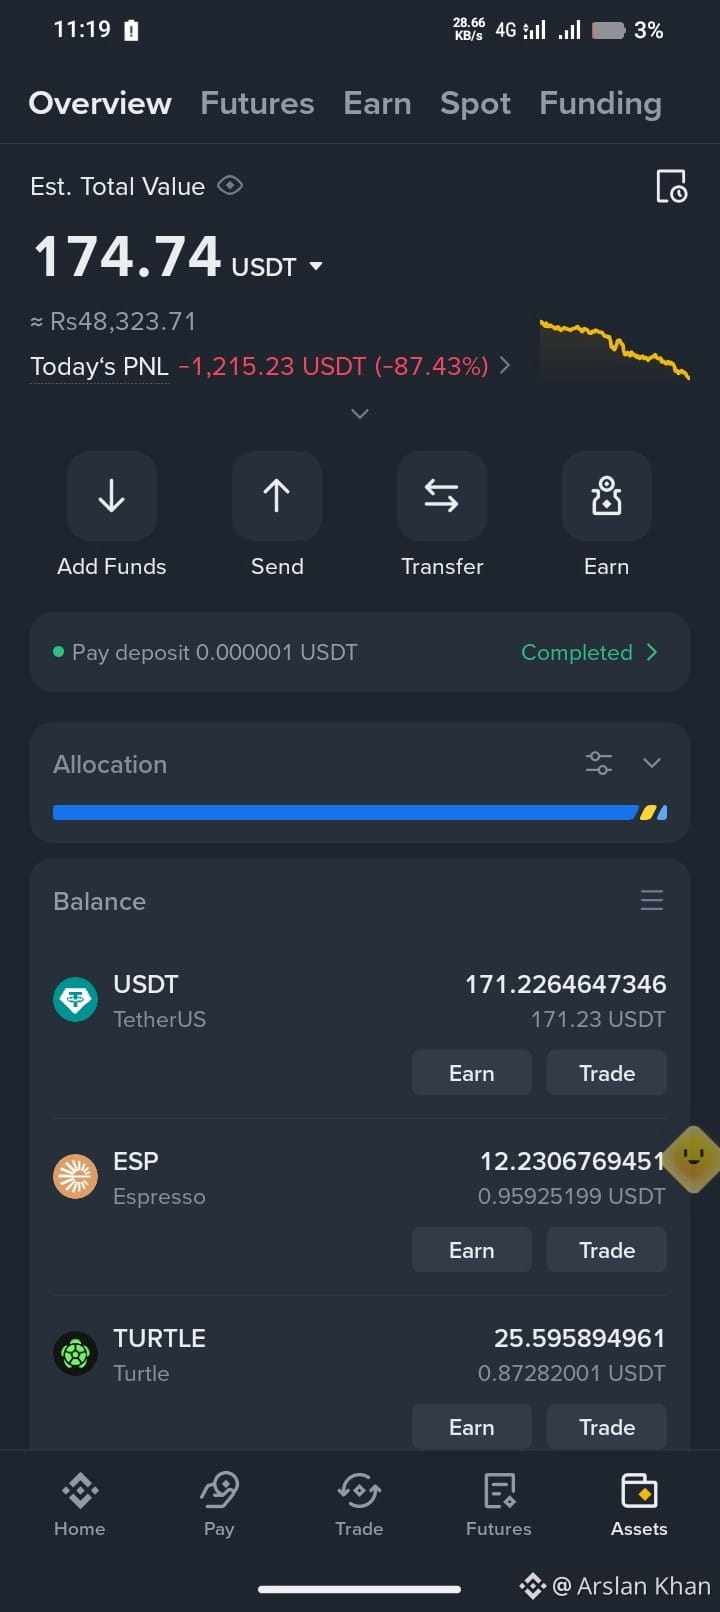
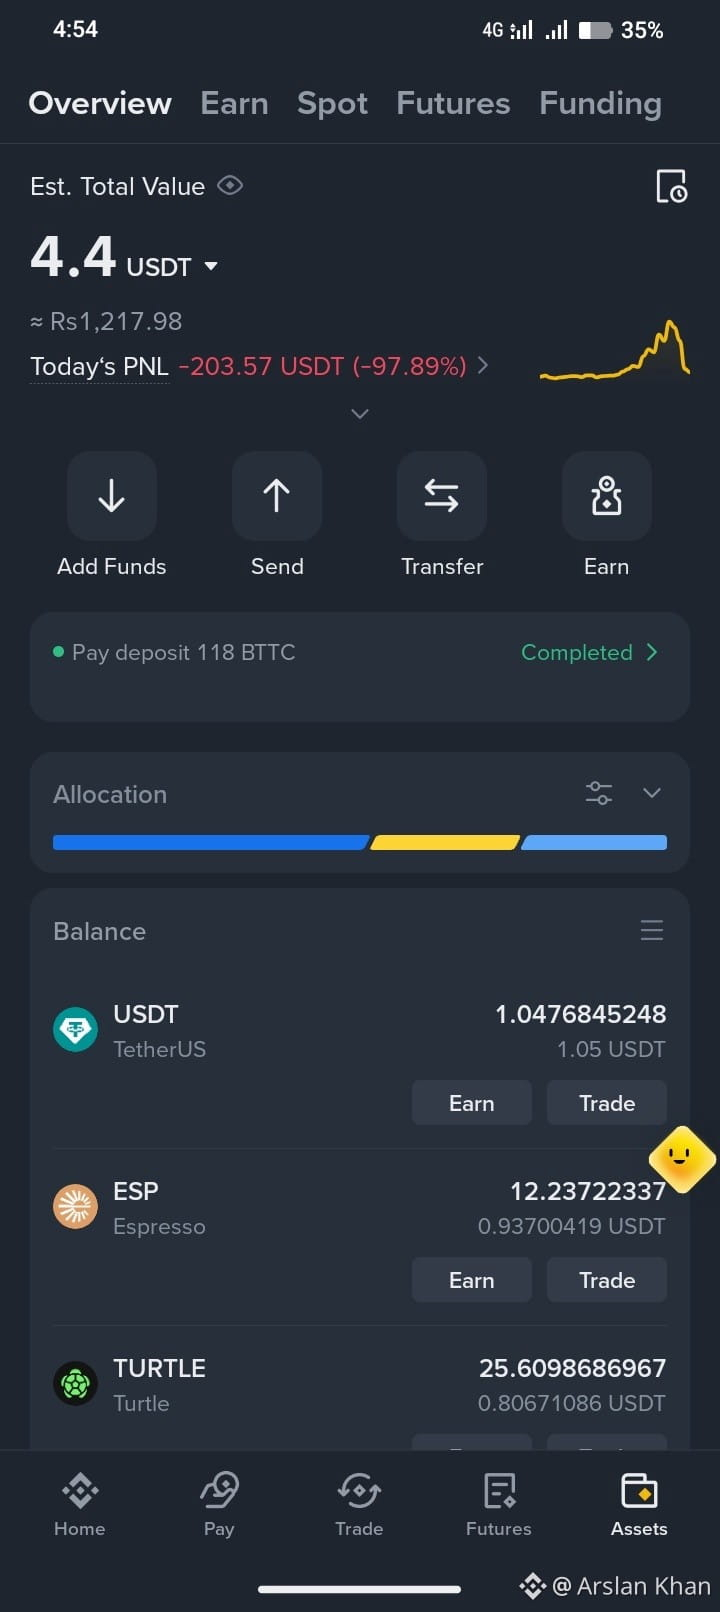
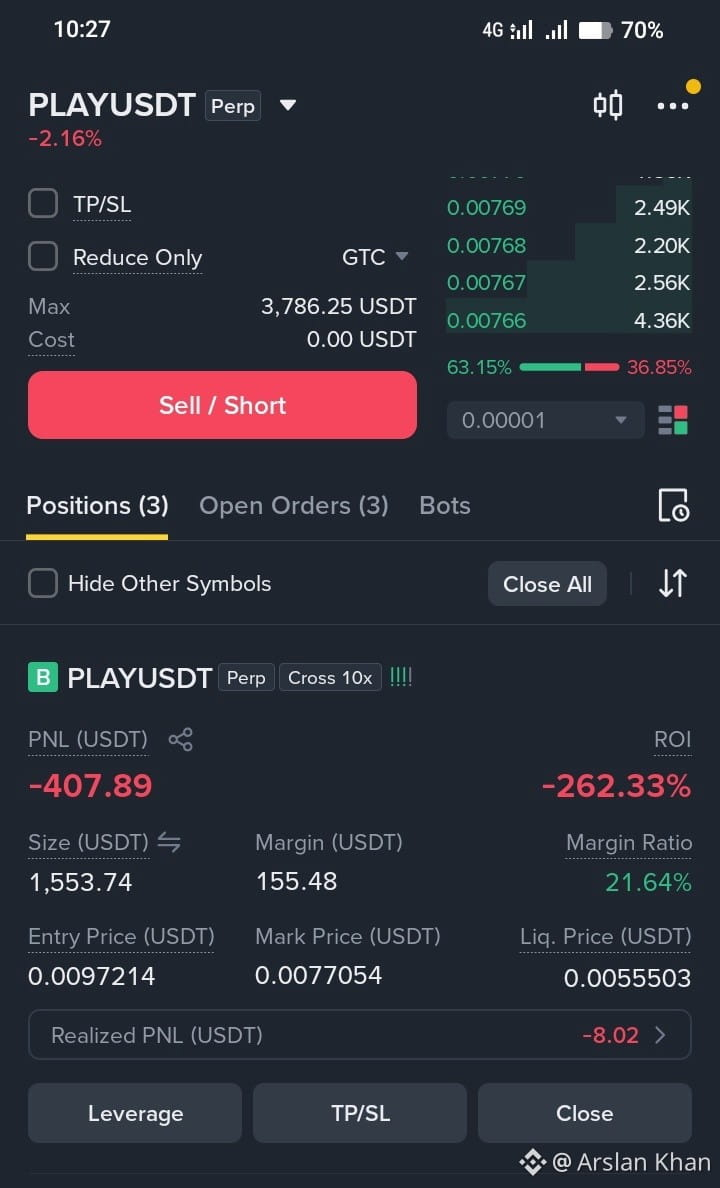
I'm in big trouble please tell me Hold or close🥹😓
$PLAY
#HotCPIDecemberHikePriced #BitcoinFiveWeeklyLosses
I'm in big trouble please tell me Hold or close🥹😓
$PLAY
#HotCPIDecemberHikePriced #BitcoinFiveWeeklyLosses
$PLAY
#HotCPIDecemberHikePriced #BitcoinFiveWeeklyLosses
24
1
15
17.3k
·
--
Рост
3
2
548
·
--
Падение
12
13
11.2k
·
--
Рост
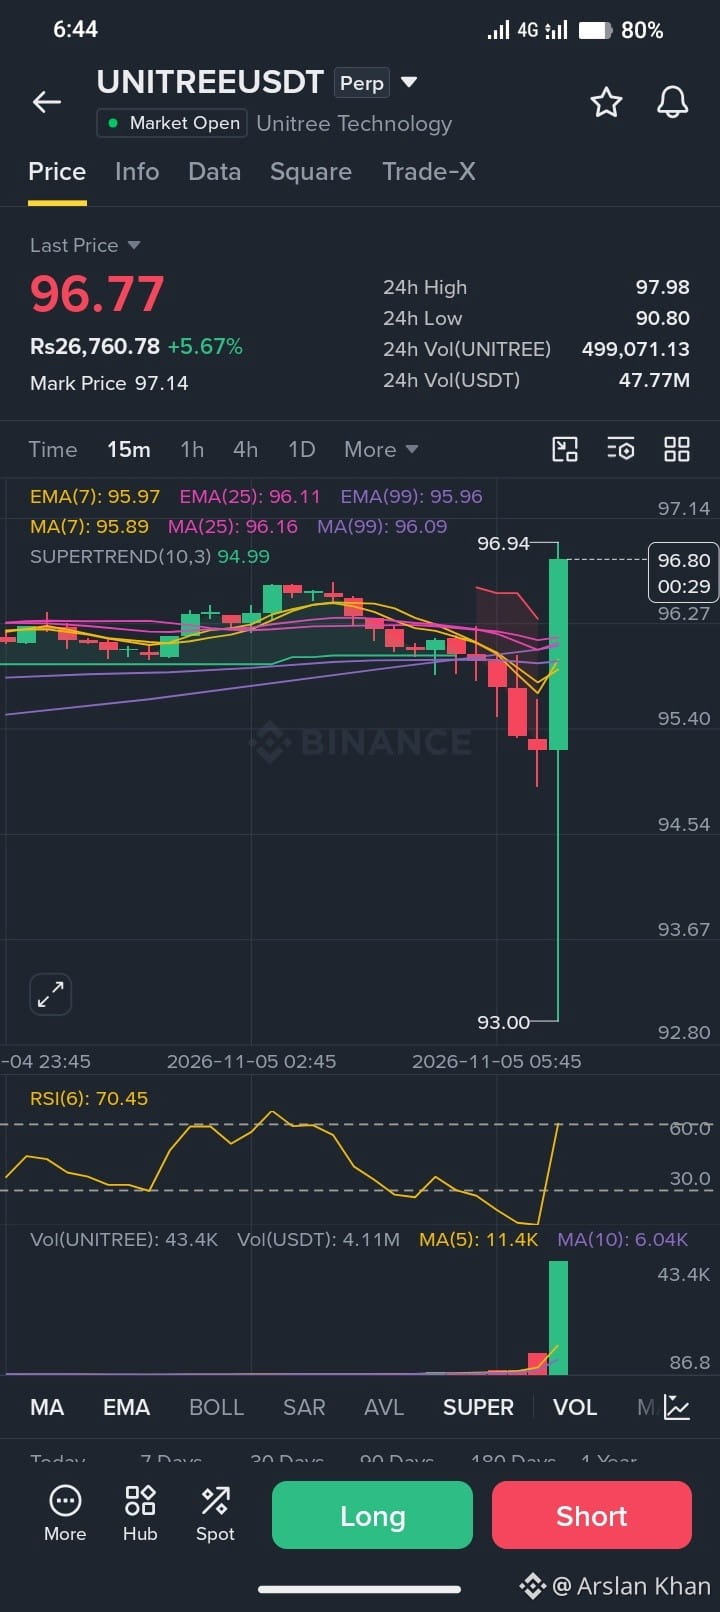
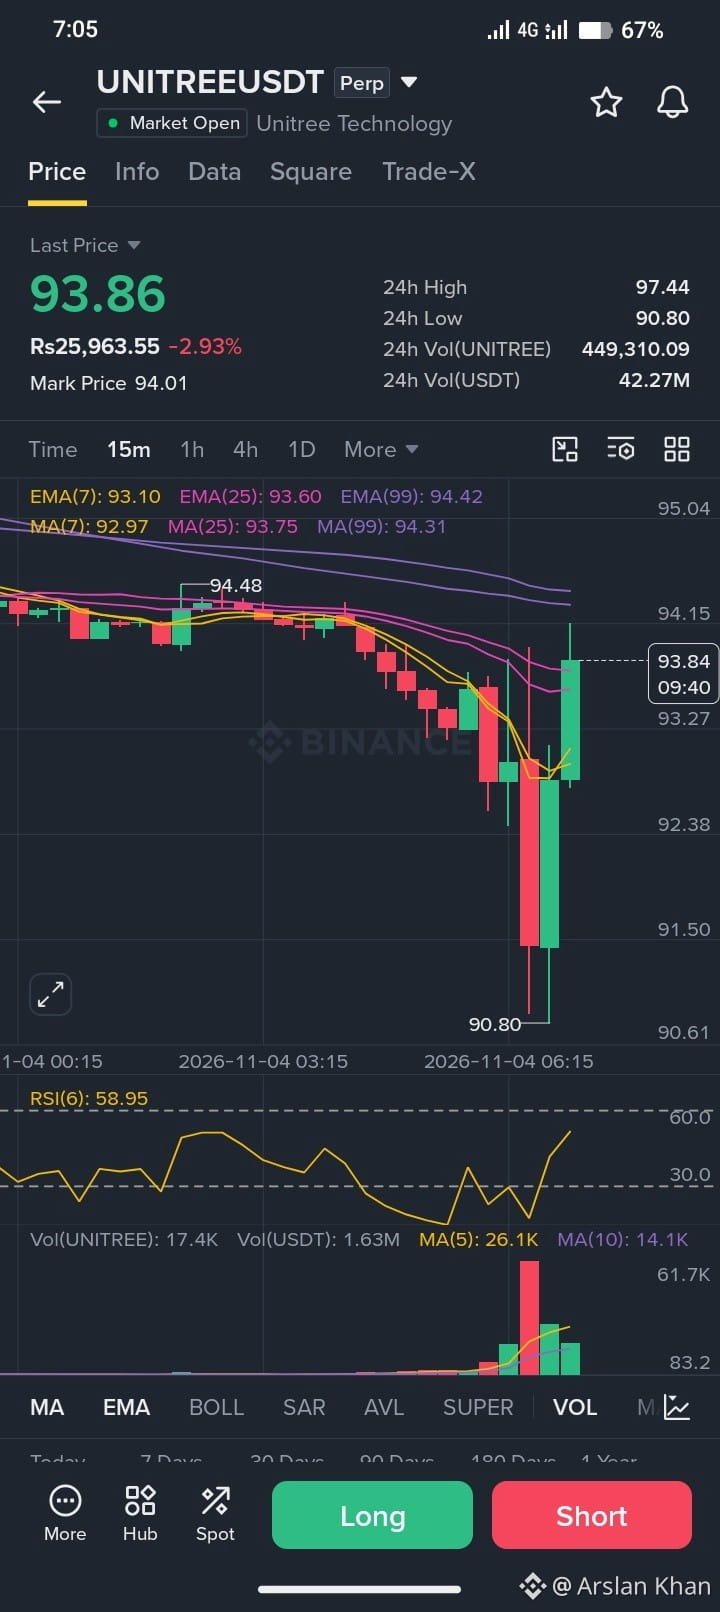
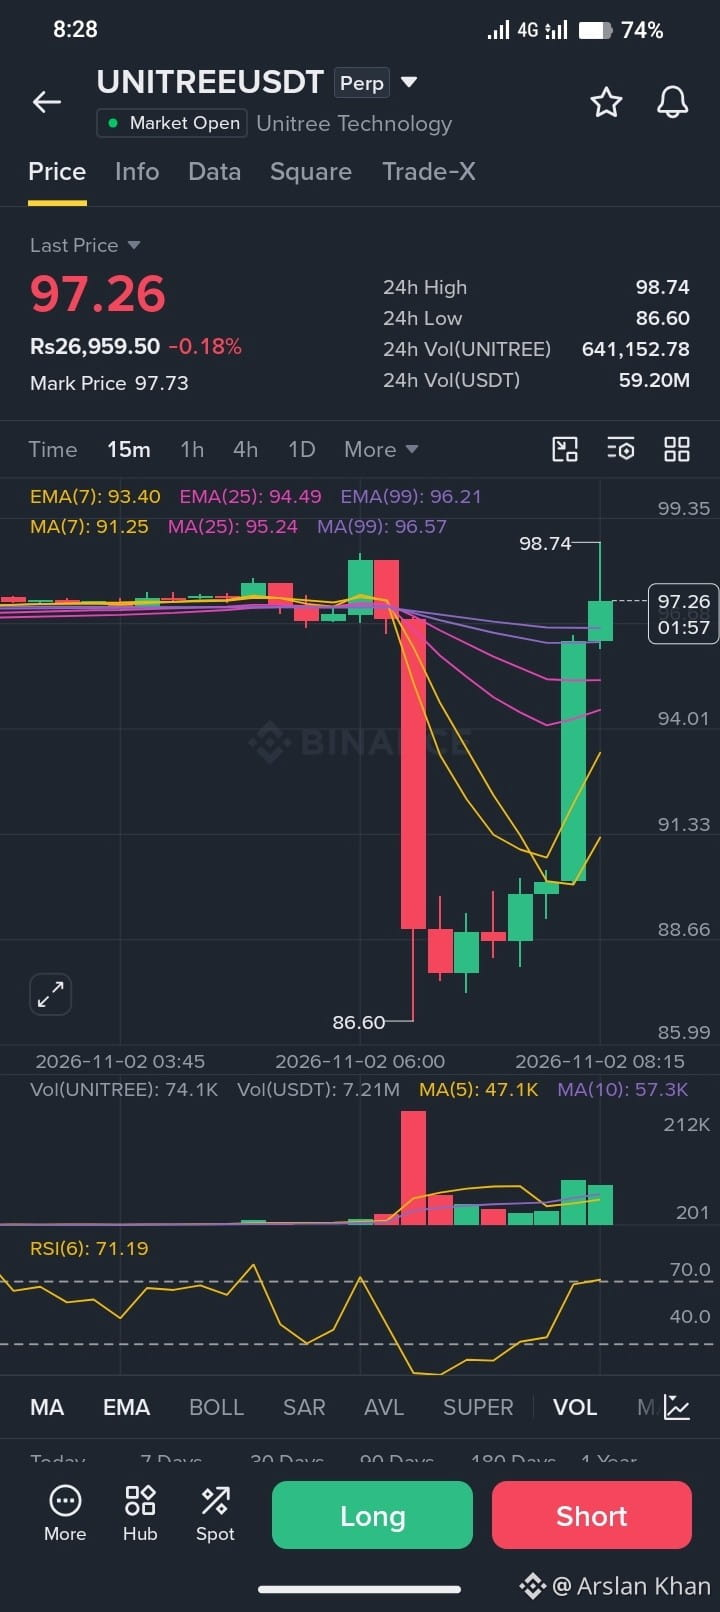
what the fuck can't understand this fucking Move $UNITREE #Binance98PercentReplenished
what the fuck can't understand this fucking Move $UNITREE #Binance98PercentReplenished
2
482
·
--
Падение
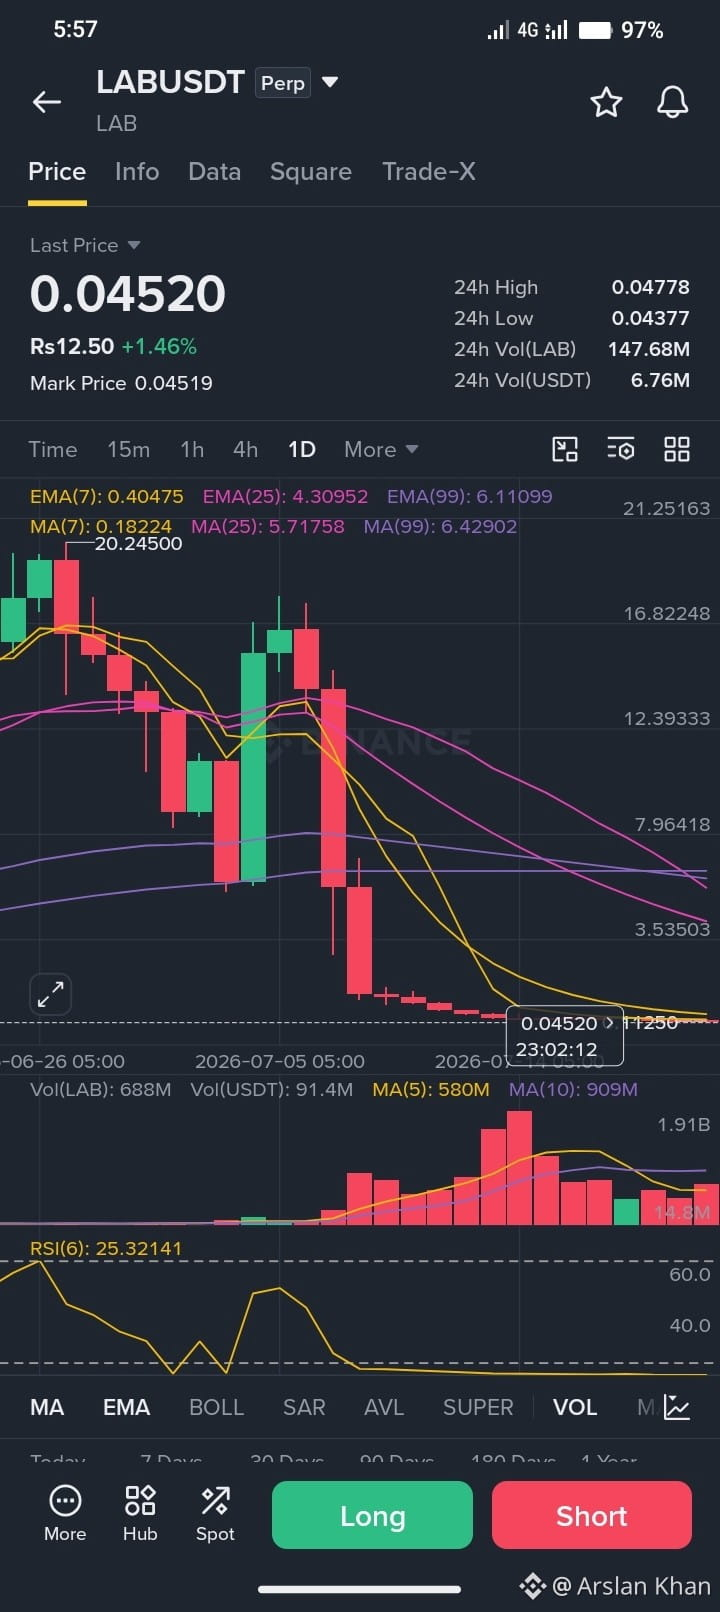
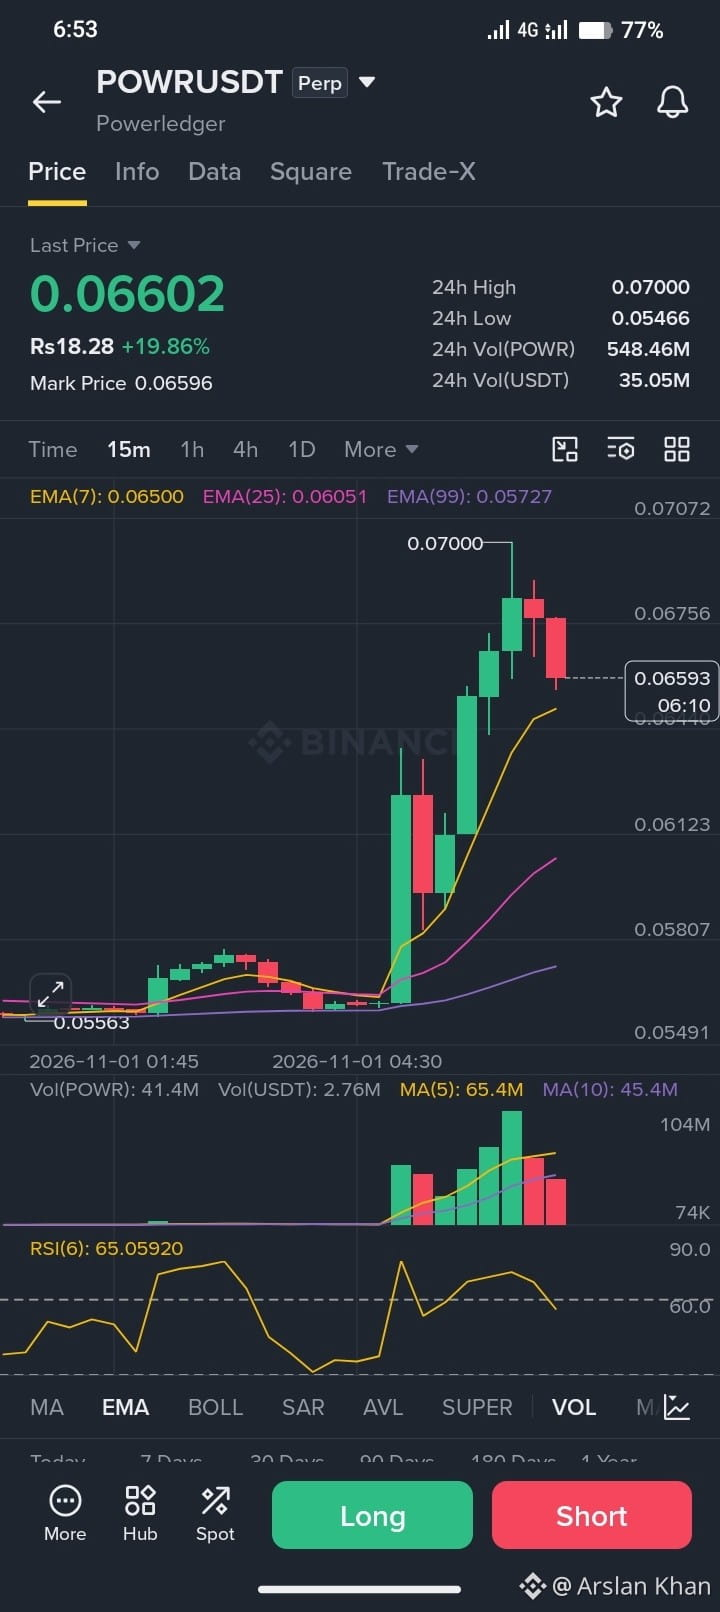
it's again fucking Move 🥹
#BinanceIncidentReport
it's again fucking Move 🥹
#BinanceIncidentReport
#BinanceIncidentReport
1
3
710
·
--
Рост
349
Войдите, чтобы посмотреть больше материала
Присоединяйтесь к пользователям криптовалют по всему миру на Binance Square
⚡️ Получайте новейшую и полезную информацию о криптоактивах.
💬 Нам доверяет крупнейшая в мире криптобиржа.
👍 Получите достоверные аналитические данные от верифицированных создателей контента.
Эл. почта/номер телефона
В тренде
CryptoSelloffTriggersMultipleWhaleLiquidations
Просмотров: 148,400
1,606 обсуждают
Crypto Liquidations Top $2B in 24 Hours as 329,000 Traders Are Wiped Out
Binance News
·Лайков: 39
·Просмотров: 46.7k
USSpotXRPETFsSeeLargestWeeklyOutflowIn8Months
Просмотров: 138,251
1,465 обсуждают
WillFOMCMinutesReinforceRateHikeExpectations?
Просмотров: 38,203
672 обсуждают