bitcoinactivesupplyinprofitdropsbelow45%

Cipher Onyx
·
--
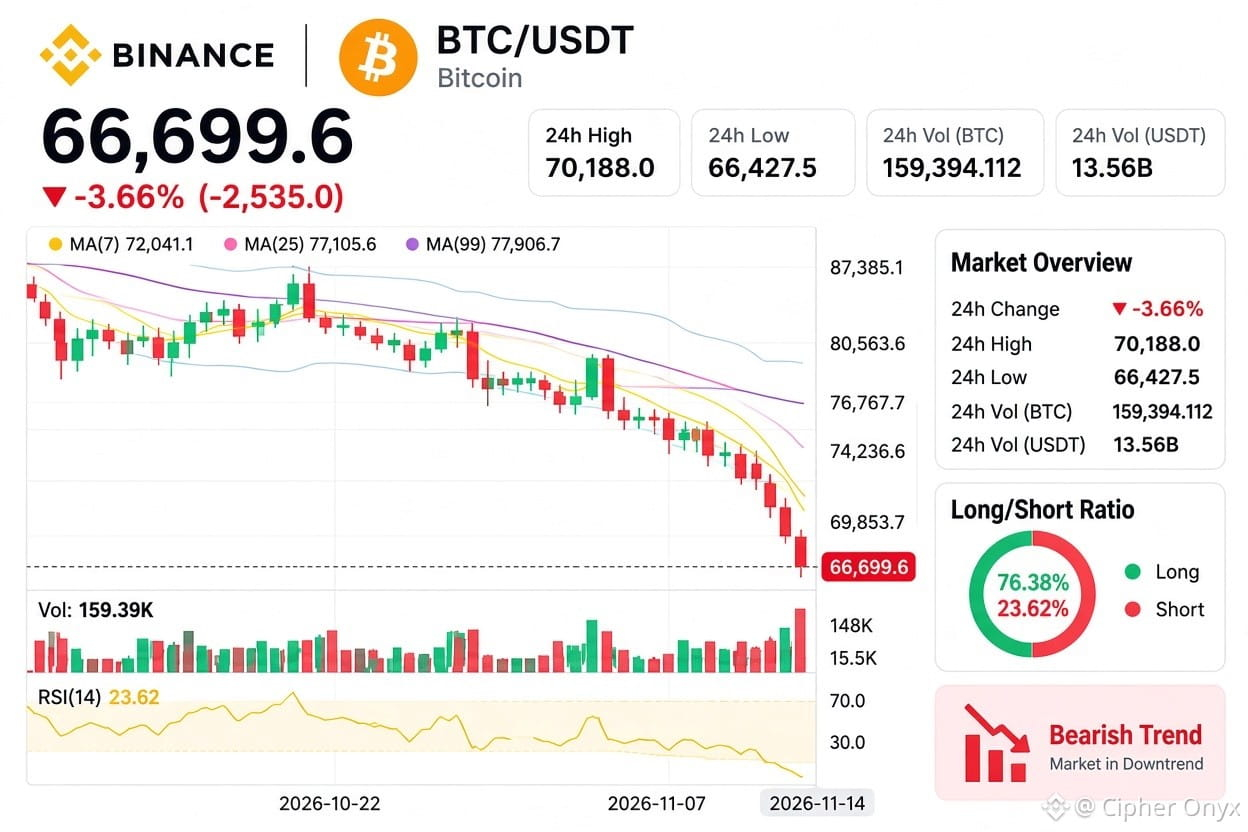
#BitcoinActiveSupplyInProfitDropsBelow45% Bitcoin's on-chain stress is rising. CryptoQuant's Darkfost reports that less than 45% of BTC's active supply is now in profit, so most recently moved coins are sitting at a loss. 📉 Market snapshot (Perp, 1D): • Price: ~$66,700 (-3.66%) • 24h range: $66,427 – $70,188 • 24h volume: ~199K BTC (~$13.5B) • Price is below MA(7), MA(25) and MA(99), a clear bearish structure ⚠️ Why it matters: When fewer holders are in profit, sentiment weakens and selling pressure can build. Historically, though, profit supply near the 40% zone has often appeared close to major market bottoms. 👀 Levels to watch: 🔴 Support: $66.4K (24h low). A break could trigger more panic selling. 🟢 Resistance: $70.2K, then the MA(7) near $72K. A reclaim would be the first sign of recovery. 🧨 Extra risk: The long/short ratio is ~76% long vs 24% short. With price falling, crowded longs could be hit by a liquidation cascade if support fails. 🔎 Bottom line: This is a stress signal, not a confirmed bottom. Read it alongside price action, volume and other on-chain data rather than on its own. 💬 Is this the zone where smart money starts accumulating, or is there more pain ahead? Drop your take below 👇 #BTC #OnChainAnalysis #CryptoMarket $BTC #BinanceSquare $BTC Not financial advice. Always DYOR and manage your risk. {future}(BTCUSDT)
#BitcoinActiveSupplyInProfitDropsBelow45%
Bitcoin's on-chain stress is rising. CryptoQuant's Darkfost reports that less than 45% of BTC's active supply is now in profit, so most recently moved coins are sitting at a loss.
📉 Market snapshot (Perp, 1D):
• Price: ~$66,700 (-3.66%)
• 24h range: $66,427 – $70,188
• 24h volume: ~199K BTC (~$13.5B)
• Price is below MA(7), MA(25) and MA(99), a clear bearish structure
⚠️ Why it matters:
When fewer holders are in profit, sentiment weakens and selling pressure can build. Historically, though, profit supply near the 40% zone has often appeared close to major market bottoms.
👀 Levels to watch:
🔴 Support: $66.4K (24h low). A break could trigger more panic selling.
🟢 Resistance: $70.2K, then the MA(7) near $72K. A reclaim would be the first sign of recovery.
🧨 Extra risk: The long/short ratio is ~76% long vs 24% short. With price falling, crowded longs could be hit by a liquidation cascade if support fails.
🔎 Bottom line: This is a stress signal, not a confirmed bottom. Read it alongside price action, volume and other on-chain data rather than on its own.
💬 Is this the zone where smart money starts accumulating, or is there more pain ahead? Drop your take below 👇
#BTC #OnChainAnalysis #CryptoMarket $BTC #BinanceSquare
$BTC
Not financial advice. Always DYOR and manage your risk.

⚠️ BITCOIN HOLDERS ARE UNDER PRESSURE — ACTIVE SUPPLY IN PROFIT FALLS BELOW 45% A worrying on-chain signal is emerging in the Bitcoin market. According to CryptoQuant contributor Darkfost, the share of Bitcoin's active supply currently sitting in profit has dropped below 45%, meaning more than half of the active supply analyzed is underwater. 🔥 Why does this matter? When fewer Bitcoin holders remain in profit, market sentiment can weaken and selling pressure may increase as investors face losses. But there is another side to this signal. Historically, when Bitcoin's profit supply approaches the 40% zone, major market corrections have sometimes moved closer to their bottoms. What comes next? 🔴 More downside could trigger additional panic selling. 🟢 A recovery could create an attractive accumulation opportunity if demand returns. This is not confirmation of a market bottom, but it is an important signal worth watching. Is Bitcoin approaching a major accumulation zone, or is more pain ahead? #bitcoinactivesupplyinprofitdropsbelow45% {spot}(BTCUSDT)
⚠️ BITCOIN HOLDERS ARE UNDER PRESSURE — ACTIVE SUPPLY IN PROFIT FALLS BELOW 45%

A worrying on-chain signal is emerging in the Bitcoin market. According to CryptoQuant contributor Darkfost, the share of Bitcoin's active supply currently sitting in profit has dropped below 45%, meaning more than half of the active supply analyzed is underwater.

🔥 Why does this matter?

When fewer Bitcoin holders remain in profit, market sentiment can weaken and selling pressure may increase as investors face losses.

But there is another side to this signal. Historically, when Bitcoin's profit supply approaches the 40% zone, major market corrections have sometimes moved closer to their bottoms.

What comes next?

🔴 More downside could trigger additional panic selling.

🟢 A recovery could create an attractive accumulation opportunity if demand returns.

This is not confirmation of a market bottom, but it is an important signal worth watching.

Is Bitcoin approaching a major accumulation zone, or is more pain ahead?

#bitcoinactivesupplyinprofitdropsbelow45%
#BitcoinActiveSupplyInProfitDropsBelow45% 🔴 Bitcoin’s Active Supply in Profit Drops Below 45% Bitcoin’s on-chain market structure is showing signs of growing pressure. Recent data indicates that less than 45% of BTC’s active supply is currently in profit, meaning a larger share of recently moved coins is now held at unrealized losses. 📉 This shift can weigh on market sentiment as more holders may become cautious during further price weakness. However, the metric is not necessarily a signal that a market bottom is already in place. Historically, the 40% area has been an important zone for this indicator, so traders will be watching closely to see whether profitable supply continues to decline or begins to recover. 🔎 Bottom line: The reading points to increasing market stress, but it should be viewed alongside price action, volume, and other on-chain indicators rather than in isolation. #Bitcoin #BTC #CryptoMarket #OnChainAnalysis $BTW $BULLA $KAVA {future}(KAVAUSDT) {future}(BULLAUSDT) {future}(BTWUSDT)
#BitcoinActiveSupplyInProfitDropsBelow45%
🔴 Bitcoin’s Active Supply in Profit Drops Below 45%

Bitcoin’s on-chain market structure is showing signs of growing pressure. Recent data indicates that less than 45% of BTC’s active supply is currently in profit, meaning a larger share of recently moved coins is now held at unrealized losses.

📉 This shift can weigh on market sentiment as more holders may become cautious during further price weakness. However, the metric is not necessarily a signal that a market bottom is already in place.

Historically, the 40% area has been an important zone for this indicator, so traders will be watching closely to see whether profitable supply continues to decline or begins to recover.

🔎 Bottom line: The reading points to increasing market stress, but it should be viewed alongside price action, volume, and other on-chain indicators rather than in isolation.

#Bitcoin #BTC #CryptoMarket #OnChainAnalysis

$BTW $BULLA $KAVA
·
--
Bearish
#bitcoinactivesupplyinprofitdropsbelow45% 🚨 Bitcoin Active Supply in Profit Drops Below 45% On-chain analyst Darkfost reports that less than 45% of Bitcoin’s active supply is currently in profit, after excluding coins that have not moved for more than 10 years. This means loss-held active supply has now surpassed profitable supply. For traders, this is an important sign of market stress. Historically, readings below 40% have often coincided with correction lows, although this metric alone cannot confirm that a bottom is in. The key point is that Bitcoin is approaching a historically significant zone, but 45% is not the same as the sub-40% level that has previously marked deeper pullback lows. Traders may therefore watch whether profitability continues to deteriorate or stabilizes from here. Bottom line: 📉 The data remains bearish from a profitability perspective, but it is also moving toward a zone that has historically attracted stronger bottom-fishing interest. Confirmation will require broader market and on-chain signals. #Bitcoin #BTC #BitcoinOnChain #CryptoMarket $BTW $BARD $PONS {future}(PONSUSDT) {future}(BARDUSDT) {future}(BTWUSDT)
#bitcoinactivesupplyinprofitdropsbelow45%
🚨 Bitcoin Active Supply in Profit Drops Below 45%
On-chain analyst Darkfost reports that less than 45% of Bitcoin’s active supply is currently in profit, after excluding coins that have not moved for more than 10 years. This means loss-held active supply has now surpassed profitable supply.
For traders, this is an important sign of market stress. Historically, readings below 40% have often coincided with correction lows, although this metric alone cannot confirm that a bottom is in.
The key point is that Bitcoin is approaching a historically significant zone, but 45% is not the same as the sub-40% level that has previously marked deeper pullback lows. Traders may therefore watch whether profitability continues to deteriorate or stabilizes from here.
Bottom line: 📉 The data remains bearish from a profitability perspective, but it is also moving toward a zone that has historically attracted stronger bottom-fishing interest. Confirmation will require broader market and on-chain signals.
#Bitcoin #BTC #BitcoinOnChain #CryptoMarket
$BTW $BARD $PONS
·
--
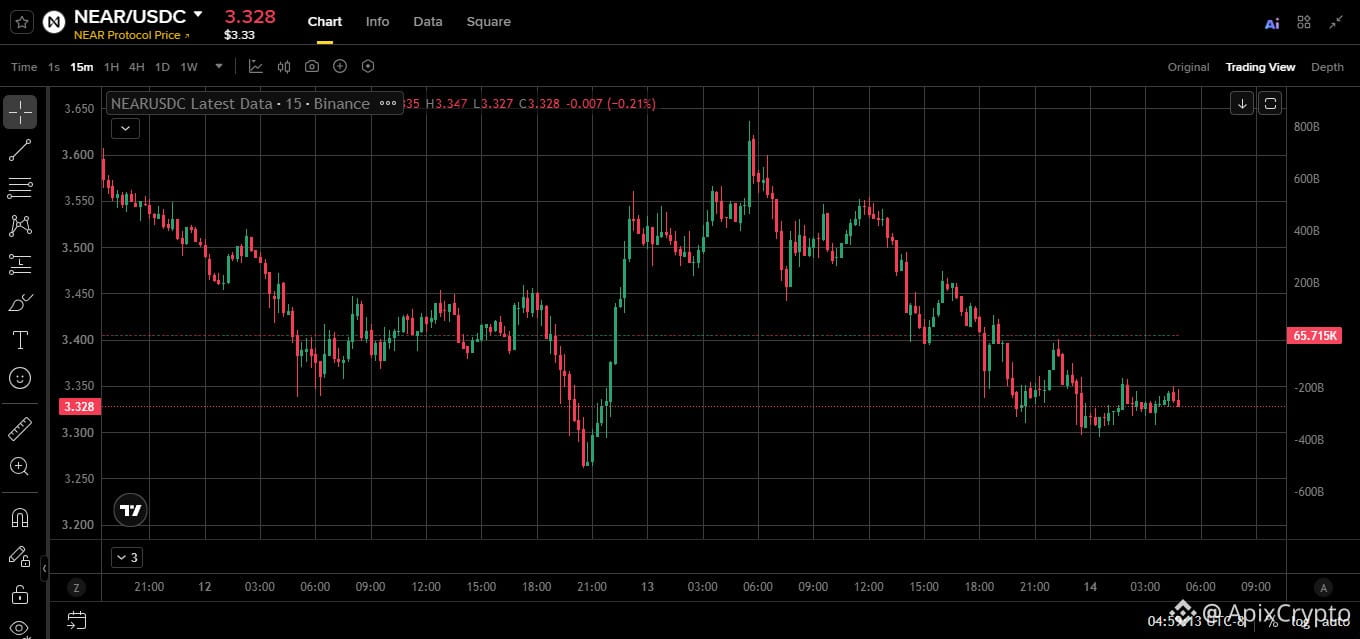
NEAR Protocol ($NEAR ) is trading near $3.31, down about 8% over the past week due to broader crypto market weakness. Key Takeaways Price Levels. NEAR is testing support near $3.35. A bounce requires reclaiming $3.42–$3.60, while a breakdown risks a drop toward $3.20.Technicals. The coin sits in oversold territory below its key moving averages on CoinMarketCap, suggesting a short-term relief bounce is possible if the broader market stabilizes.Recent Catalysts. NEAR Intents launched on Talos's institutional platform and governance approved cutting future token inflation, though macro "Extreme Fear" is currently holding prices down.#WhoWillSucceedJensenHuangatNvidia? #WhatWillDriveCryptoandStocks’NextRebound? #BitcoinActiveSupplyInProfitDropsBelow45% #BitcoinActiveSupplyInProfitDropsBelow45% {future}(NEARUSDT) {spot}(NEARUSDT)
NEAR Protocol ($NEAR ) is trading near $3.31, down about 8% over the past week due to broader crypto market weakness.

Key Takeaways
Price Levels. NEAR is testing support near $3.35. A bounce requires reclaiming $3.42–$3.60, while a breakdown risks a drop toward $3.20.Technicals. The coin sits in oversold territory below its key moving averages on CoinMarketCap, suggesting a short-term relief bounce is possible if the broader market stabilizes.Recent Catalysts. NEAR Intents launched on Talos's institutional platform and governance approved cutting future token inflation, though macro "Extreme Fear" is currently holding prices down.#WhoWillSucceedJensenHuangatNvidia? #WhatWillDriveCryptoandStocks’NextRebound? #BitcoinActiveSupplyInProfitDropsBelow45% #BitcoinActiveSupplyInProfitDropsBelow45%
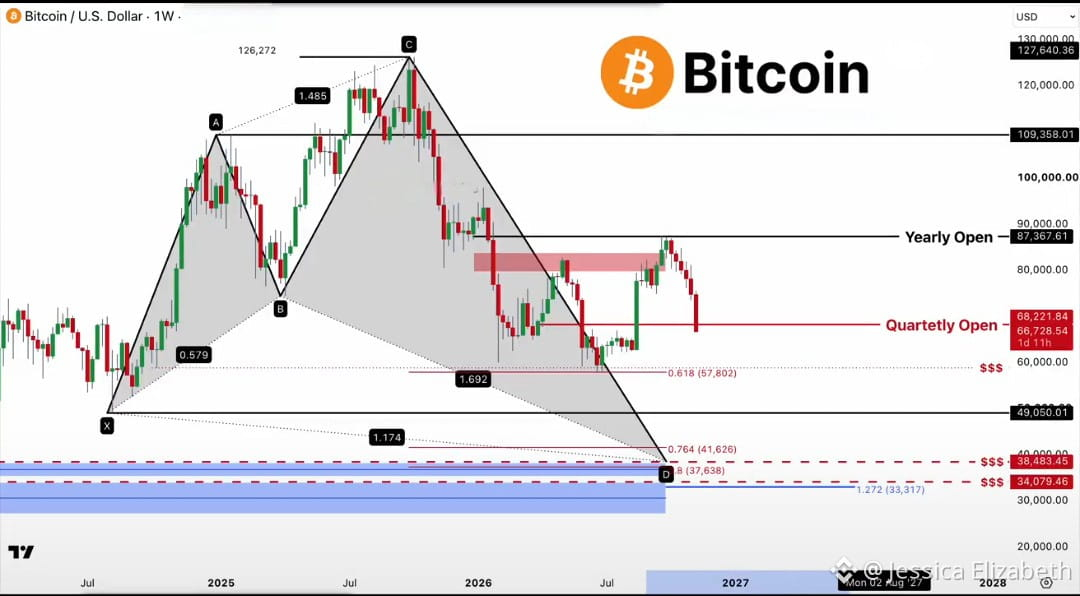
𝐒𝐓𝐎𝐏..... 𝐒𝐓𝐎𝐏..... 𝐒𝐓𝐎𝐏 🚨 $BTC EVERYTHING IS MUCH WORSE THAN YOU THINK!!! Look at $BTC. We got rejected from the Yearly Open. We lost the Quarterly Open. And November, historically one of Bitcoin's strongest months, is now pushing prices sharply lower. This is NOT the price action bulls wanted to see. But while panic spreads across the market, staying calm and following the key levels is more important than ever. Here's what I'm watching: 🔹 $63K–$65K: The major support zone where buyers need to step in. 🔹 $57.8K: The 0.618 Fibonacci level and current cycle low. BTC has traded inside the $63K–$65K range before, making it a critical area to watch for potential buyer demand. However, if this support breaks decisively, the downside could accelerate quickly. Don't get caught off guard. Protect your capital. Stay disciplined. PREPARE FOR THE WORST! ⚠️ #BTC #Bitcoin #CryptoMarket #Crypto #BitcoinActiveSupplyInProfitDropsBelow45%
𝐒𝐓𝐎𝐏..... 𝐒𝐓𝐎𝐏..... 𝐒𝐓𝐎𝐏 🚨
$BTC EVERYTHING IS MUCH WORSE THAN YOU THINK!!!

Look at $BTC .

We got rejected from the Yearly Open.

We lost the Quarterly Open.

And November, historically one of Bitcoin's strongest months, is now pushing prices sharply lower.

This is NOT the price action bulls wanted to see.

But while panic spreads across the market, staying calm and following the key levels is more important than ever.

Here's what I'm watching:

🔹 $63K–$65K: The major support zone where buyers need to step in.

🔹 $57.8K: The 0.618 Fibonacci level and current cycle low.

BTC has traded inside the $63K–$65K range before, making it a critical area to watch for potential buyer demand.

However, if this support breaks decisively, the downside could accelerate quickly.

Don't get caught off guard.

Protect your capital. Stay disciplined. PREPARE FOR THE WORST! ⚠️

#BTC #Bitcoin #CryptoMarket #Crypto
#BitcoinActiveSupplyInProfitDropsBelow45%
·
--
Bullish
F T S:
wow 🤑 nice prediction
Mitosis ($MITO ) is trading near $0.0067 to $0.0070, showing sharp short-term trading volume spikes after recently setting an all-time low around $0.00615 to $0.00621. Key Takeaways Price Levels. MITO is hovering just above key bottom support at $0.00615 to $0.00635. Bulls need a sustained move above immediate resistance near $0.0075 to $0.0085 to signal a broader recovery. Technicals. Despite recent short-term bounces on high volume, MITO remains in a steep long-term downtrend (down over 90% year-to-date), trading well below its 50-day ($0.0115) and 200-day ($0.0238) moving averages with a neutral-to-oversold daily RSI near 31–34 on CoinCodex.Fundamentals & Risks. While Mitosis operates as a cross-chain DeFi liquidity protocol, analysts on CoinMarketCap highlight major supply overhang risks—including roughly 745M tokens bridged to BNB Chain, upcoming token unlocks, and uncertainty around time-locked tMITO redemptions—that continue to weigh on sentiment. #WhoWillSucceedJensenHuangatNvidia? #WhatWillDriveCryptoandStocks’NextRebound? #BitcoinActiveSupplyInProfitDropsBelow45% #USPPIMissMayEaseBTCPressure {spot}(MITOUSDT)
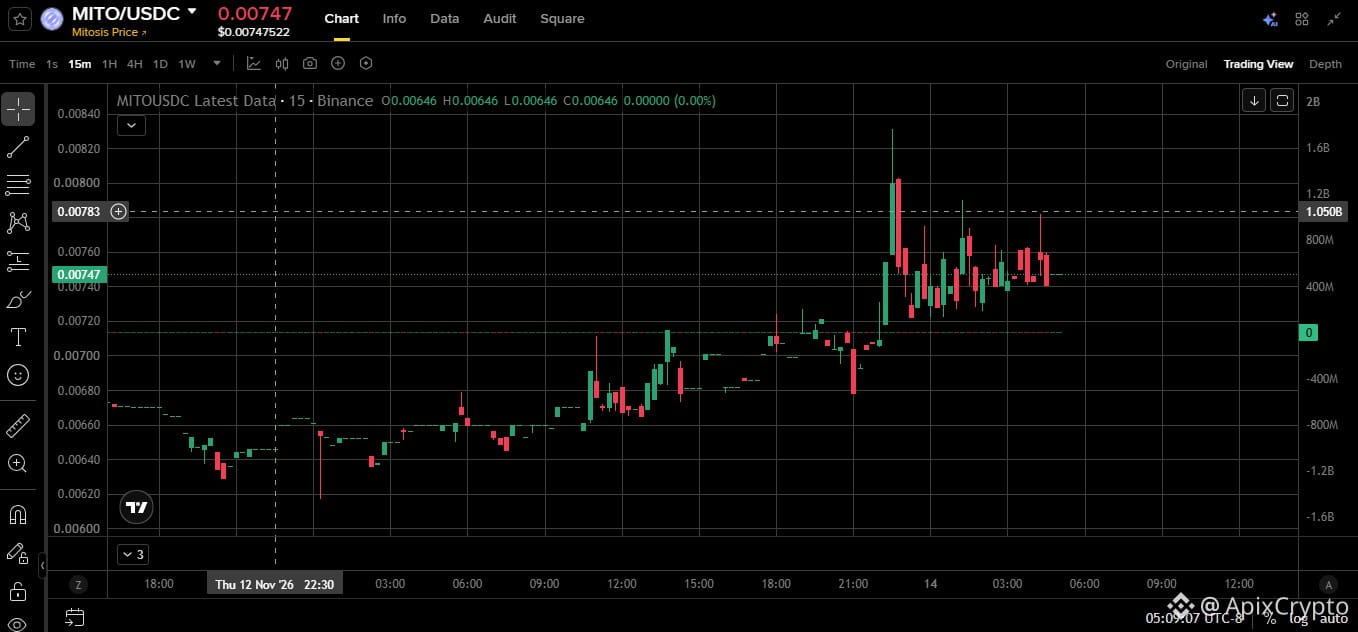
Mitosis ($MITO ) is trading near $0.0067 to $0.0070, showing sharp short-term trading volume spikes after recently setting an all-time low around $0.00615 to $0.00621.

Key Takeaways
Price Levels. MITO is hovering just above key bottom support at $0.00615 to $0.00635. Bulls need a sustained move above immediate resistance near $0.0075 to $0.0085 to signal a broader recovery. Technicals. Despite recent short-term bounces on high volume, MITO remains in a steep long-term downtrend (down over 90% year-to-date), trading well below its 50-day ($0.0115) and 200-day ($0.0238) moving averages with a neutral-to-oversold daily RSI near 31–34 on CoinCodex.Fundamentals & Risks. While Mitosis operates as a cross-chain DeFi liquidity protocol, analysts on CoinMarketCap highlight major supply overhang risks—including roughly 745M tokens bridged to BNB Chain, upcoming token unlocks, and uncertainty around time-locked tMITO redemptions—that continue to weigh on sentiment. #WhoWillSucceedJensenHuangatNvidia? #WhatWillDriveCryptoandStocks’NextRebound? #BitcoinActiveSupplyInProfitDropsBelow45% #USPPIMissMayEaseBTCPressure
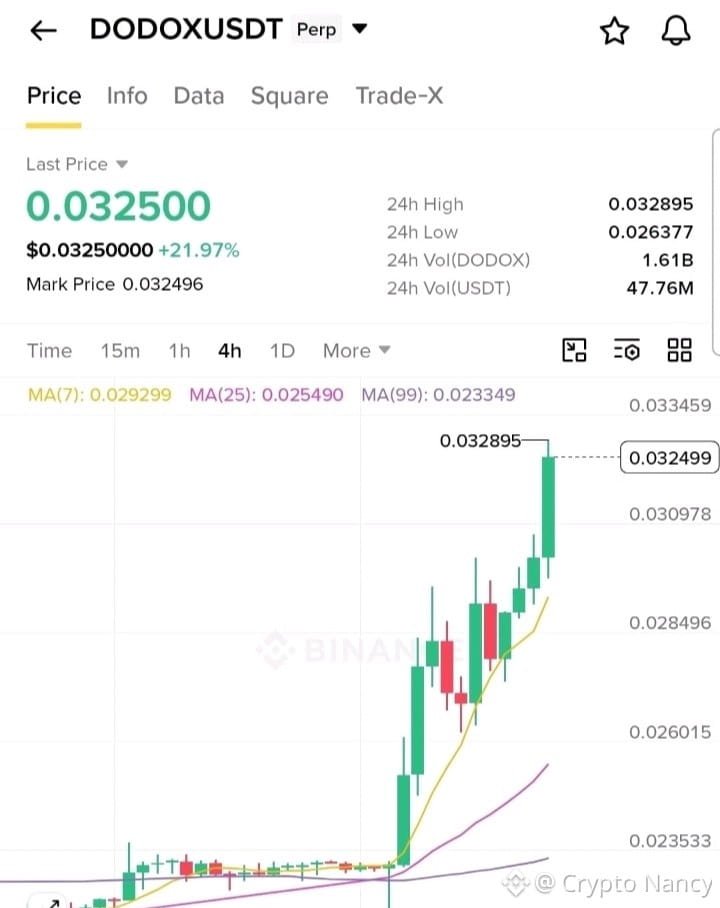
DODO ($DODO ) is trading near $0.029 to $0.035, surging roughly 20% to 25% over the past 24 hours and over 26% for the week on strong trading volume. Key Takeaways Price Levels. DODO broke out of its recent consolidation zone near $0.022 and is testing immediate resistance around $0.0317 to $0.0355. Key bottom support now sits near $0.0218 to $0.0230, which bulls need to defend on any pullback. Technicals. Daily moving averages show strong short-term buy momentum above the 50-day ($0.0213) and 200-day ($0.0193) averages on CoinCodex. However, the 14-day RSI has climbed above 75 into overbought territory, signaling a high risk of short-term profit-taking or consolidation.Market Drivers. The rally is primarily fueled by high spot trading volume (over $34M in 24 hours) and speculative momentum on CoinMarketCap rather than a major new protocol announcement, leaving it sensitive to broader market swings.#WhoWillSucceedJensenHuangatNvidia? {spot}(DODOUSDT) #WhatWillDriveCryptoandStocks’NextRebound? #BitcoinActiveSupplyInProfitDropsBelow45% #USPPIMissMayEaseBTCPressure
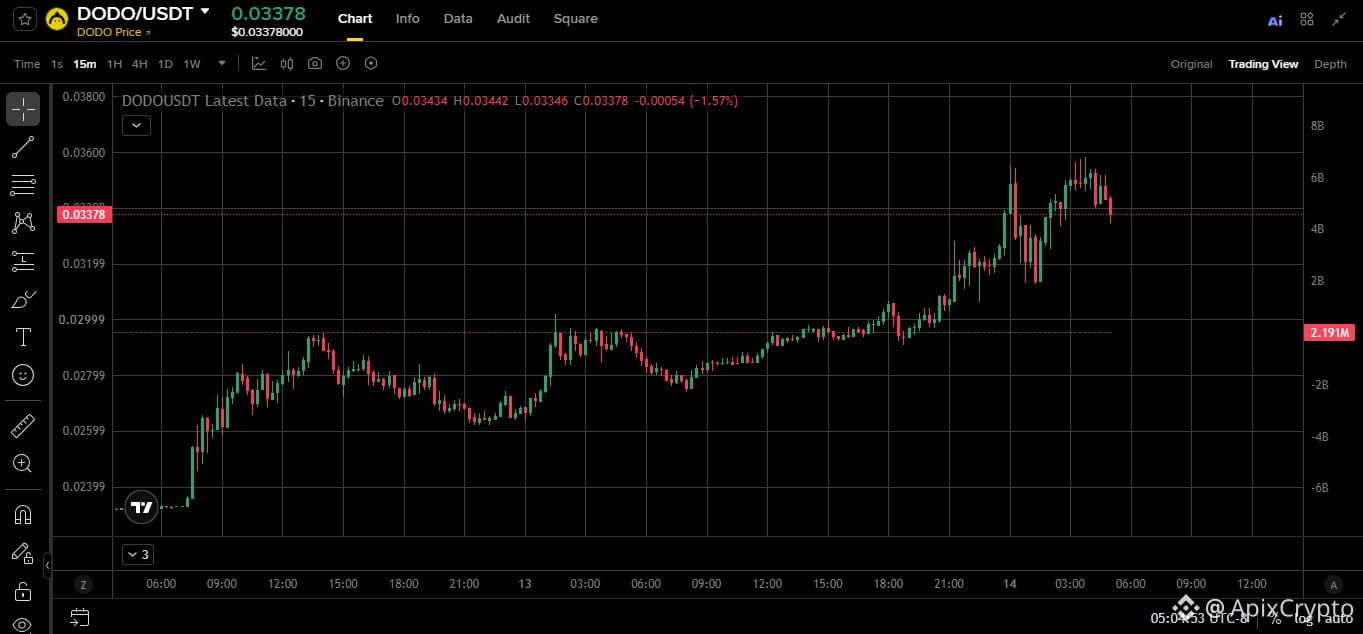
DODO ($DODO ) is trading near $0.029 to $0.035, surging roughly 20% to 25% over the past 24 hours and over 26% for the week on strong trading volume.
Key Takeaways
Price Levels. DODO broke out of its recent consolidation zone near $0.022 and is testing immediate resistance around $0.0317 to $0.0355. Key bottom support now sits near $0.0218 to $0.0230, which bulls need to defend on any pullback. Technicals. Daily moving averages show strong short-term buy momentum above the 50-day ($0.0213) and 200-day ($0.0193) averages on CoinCodex. However, the 14-day RSI has climbed above 75 into overbought territory, signaling a high risk of short-term profit-taking or consolidation.Market Drivers. The rally is primarily fueled by high spot trading volume (over $34M in 24 hours) and speculative momentum on CoinMarketCap rather than a major new protocol announcement, leaving it sensitive to broader market swings.#WhoWillSucceedJensenHuangatNvidia?
#WhatWillDriveCryptoandStocks’NextRebound? #BitcoinActiveSupplyInProfitDropsBelow45% #USPPIMissMayEaseBTCPressure
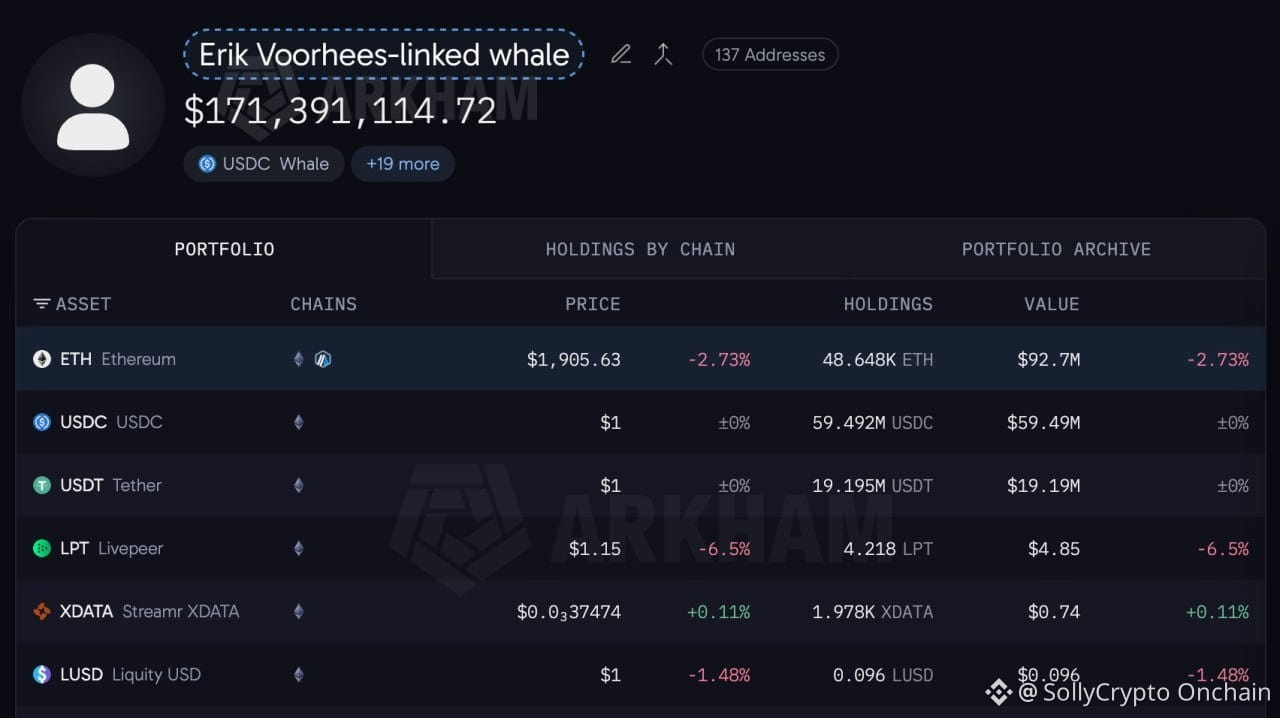
ERIK VOORHEES DEPLOYS $97M TO SCOOP UP 48,647 ETH ON THE DIP — SMART MONEY BOTTOM PUMP OR LIQUIDITY TRAP? Heavy OG capital rotation just hit Ethereum order books right as $ETH trades below the $2,000 psychological threshold. On-chain tracking confirms that multiple wallets linked to early Bitcoin pioneer and ShapeShift founder Erik Voorhees (@ErikVoorhees) spent $97 million over the past four days to accumulate 48,647 $ETH at an average entry of $1,994. Even more importantly for short-term order book liquidity, these same addresses still hold $78.68 million in dry powder stablecoins—leaving massive buy-side firepower ready for further dips. This should lean as a bullish accumulation signal for $ETH as early crypto veterans deploy nine-figure liquidity into retail panic. Here is the exact detail retail traders miss: elite OGs like Erik Voorhees do not chase vertical green candles or ape into high-leverage perps. Instead, they execute multi-day, multi-wallet spot TWAP accumulation right around major psychological levels ($1,994 average) while keeping nearly 45% of their stablecoin stack ($78.68M) in reserve. That remaining stablecoin cushion acts as a structural bid wall underneath the market, absorbing forced liquidations without revealing their full order size on public centralized order books. The real structural danger for retail traders is aping into over-leveraged $ETH longs simply because a crypto OG bought spot. Spot whales with $78.68M in dry powder can comfortably scale into another 10% drawdown, whereas leveraged retail accounts get wiped out on routine liquidity sweeps before any real reversal takes off. Do you think Erik Voorhees's $97M buying spree marks a major floor for $ETH, or will his remaining $78.68M in stablecoins get tested at lower support? Track the entity cluster directly on-chain—this is the entity ID, use it wisely: 45a48cc7-3301-4842-b57f-b4d32fb6370a #WhatWillDriveCryptoandStocks’NextRebound? #BitcoinActiveSupplyInProfitDropsBelow45%
ERIK VOORHEES DEPLOYS $97M TO SCOOP UP 48,647 ETH ON THE DIP — SMART MONEY BOTTOM PUMP OR LIQUIDITY TRAP?

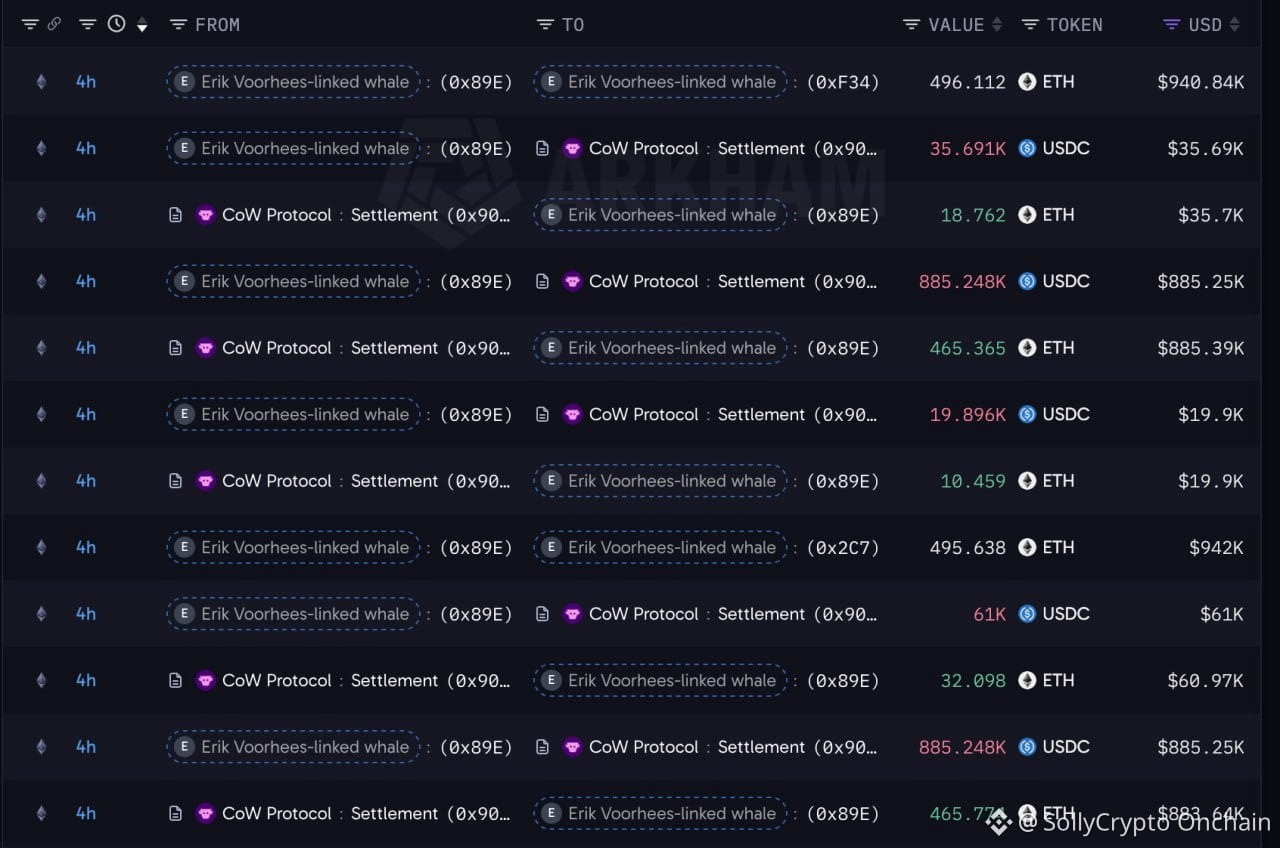
Heavy OG capital rotation just hit Ethereum order books right as $ETH trades below the $2,000 psychological threshold.
On-chain tracking confirms that multiple wallets linked to early Bitcoin pioneer and ShapeShift founder Erik Voorhees (@ErikVoorhees) spent $97 million over the past four days to accumulate 48,647 $ETH at an average entry of $1,994. Even more importantly for short-term order book liquidity, these same addresses still hold $78.68 million in dry powder stablecoins—leaving massive buy-side firepower ready for further dips.
This should lean as a bullish accumulation signal for $ETH as early crypto veterans deploy nine-figure liquidity into retail panic.
Here is the exact detail retail traders miss: elite OGs like Erik Voorhees do not chase vertical green candles or ape into high-leverage perps. Instead, they execute multi-day, multi-wallet spot TWAP accumulation right around major psychological levels ($1,994 average) while keeping nearly 45% of their stablecoin stack ($78.68M) in reserve. That remaining stablecoin cushion acts as a structural bid wall underneath the market, absorbing forced liquidations without revealing their full order size on public centralized order books.
The real structural danger for retail traders is aping into over-leveraged $ETH longs simply because a crypto OG bought spot. Spot whales with $78.68M in dry powder can comfortably scale into another 10% drawdown, whereas leveraged retail accounts get wiped out on routine liquidity sweeps before any real reversal takes off.
Do you think Erik Voorhees's $97M buying spree marks a major floor for $ETH, or will his remaining $78.68M in stablecoins get tested at lower support?
Track the entity cluster directly on-chain—this is the entity ID, use it wisely:

45a48cc7-3301-4842-b57f-b4d32fb6370a

#WhatWillDriveCryptoandStocks’NextRebound? #BitcoinActiveSupplyInProfitDropsBelow45%
SollyCrypto Onchain
·
--
Bullish
FRESH WHALES SCOOP UP $3.49M IN ETH ACROSS GATE AND DEX SWAPS — SMART MONEY BOTTOM PUMP OR LIQUIDITY TRAP?

Quiet spot accumulation is hitting Ethereum order books right as $ETH trades below the $1,900 psychological mark.
On-chain tracking confirms two separate fresh whale wallets just deployed nearly $3.5 million into spot $ETH within the last hour:
Wallet 0x47FD: Withdrew roughly $2 million in $ETH from Gate across four separate transactions over the past hour, led by a single $698K tranche.
Wallet 0xa9f5: Swapped 1.5 million USDT on-chain for 786.16 $ETH (~$1.49 million) at an average execution near $1,895 and immediately moved the tokens into a fresh wallet.
This should lean as a bullish accumulation signal for $ETH as deep-pocketed spot buyers absorb panic-driven liquidity below $1,900.
Here is the exact detail retail traders miss: while retail sentiment sits deep in extreme fear following recent Foundation-linked sales, sophisticated whales split entries across both centralized exchange withdrawals and direct DEX swaps to minimize slippage and hide their footprint. Moving newly acquired $ETH immediately into fresh self-custody wallets removes liquid supply from active order books without triggering upside price spikes during entry.
The real structural danger for retail traders is aping into high-leverage long perps just because spot whales are accumulating. Spot buyers running zero leverage can comfortably weather another 5%–10% volatility sweep, whereas over-leveraged retail accounts routinely get liquidated before real spot demand lifts price back above $2,000.
Do you think these fresh whale wallets are catching the exact bottom below $1,900, or is another liquidity sweep coming first?
Track both whale wallets directly on-chain—these are the addresses, use them wisely:

0x47FD4717Dd483589ad74d260D26619478383737e
0xa9f5bc32bb16c17bcd81d502d5b4d16044dc3e5d

#WhatWillDriveCryptoandStocks’NextRebound?
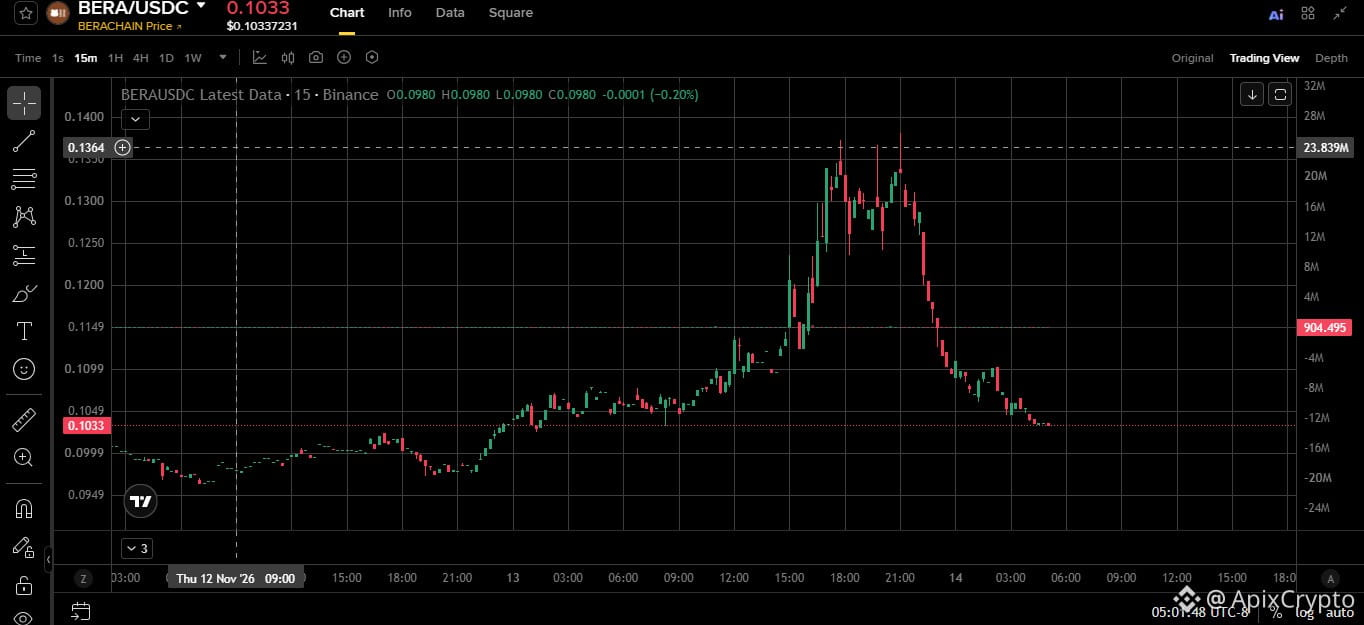
Berachain ($BERA ) is trading near $0.131 to $0.133, surging over 26% in the past 24 hours as one of the top-performing Layer-1 tokens despite a broader market downturn. Key Takeaways Price Levels. BERA recently bounced off an all-time low near $0.096. Holding above the $0.10 to $0.11 support zone keeps short-term momentum alive toward resistance near $0.14 to $0.15.Technicals. Following a sharp 30-day drop of over 40%, BERA entered deeply oversold territory (14-day RSI near 25.4) on CoinMarketCap, fueling today's relief rally even as it remains below its 200-day moving average. Fundamentals & Catalysts. While Berachain recently gained cross-chain support via the OlympusDAO Chainlink CCIP bridge and revamped its Proof-of-Liquidity rewards, ongoing monthly token unlocks and lower network TVL continue to create long-term dilution headwinds.#WhoWillSucceedJensenHuangatNvidia? #WhatWillDriveCryptoandStocks’NextRebound? #BitcoinActiveSupplyInProfitDropsBelow45% #USPPIMissMayEaseBTCPressure {future}(BERAUSDT) {spot}(BERAUSDT)
Berachain ($BERA ) is trading near $0.131 to $0.133, surging over 26% in the past 24 hours as one of the top-performing Layer-1 tokens despite a broader market downturn.

Key Takeaways
Price Levels. BERA recently bounced off an all-time low near $0.096. Holding above the $0.10 to $0.11 support zone keeps short-term momentum alive toward resistance near $0.14 to $0.15.Technicals. Following a sharp 30-day drop of over 40%, BERA entered deeply oversold territory (14-day RSI near 25.4) on CoinMarketCap, fueling today's relief rally even as it remains below its 200-day moving average. Fundamentals & Catalysts. While Berachain recently gained cross-chain support via the OlympusDAO Chainlink CCIP bridge and revamped its Proof-of-Liquidity rewards, ongoing monthly token unlocks and lower network TVL continue to create long-term dilution headwinds.#WhoWillSucceedJensenHuangatNvidia? #WhatWillDriveCryptoandStocks’NextRebound? #BitcoinActiveSupplyInProfitDropsBelow45% #USPPIMissMayEaseBTCPressure
Log in to explore more content
Join global crypto users on Binance Square
⚡️ Get latest and useful information about crypto.
💬 Trusted by the world’s largest crypto exchange.
👍 Discover real insights from verified creators.
Email / Phone number