

#tradingstats
tradingstats
Просмотров: 39,032
56 обсуждают
Популярные
Новые

·
--
Updated 2026-09-26, community-wide trading
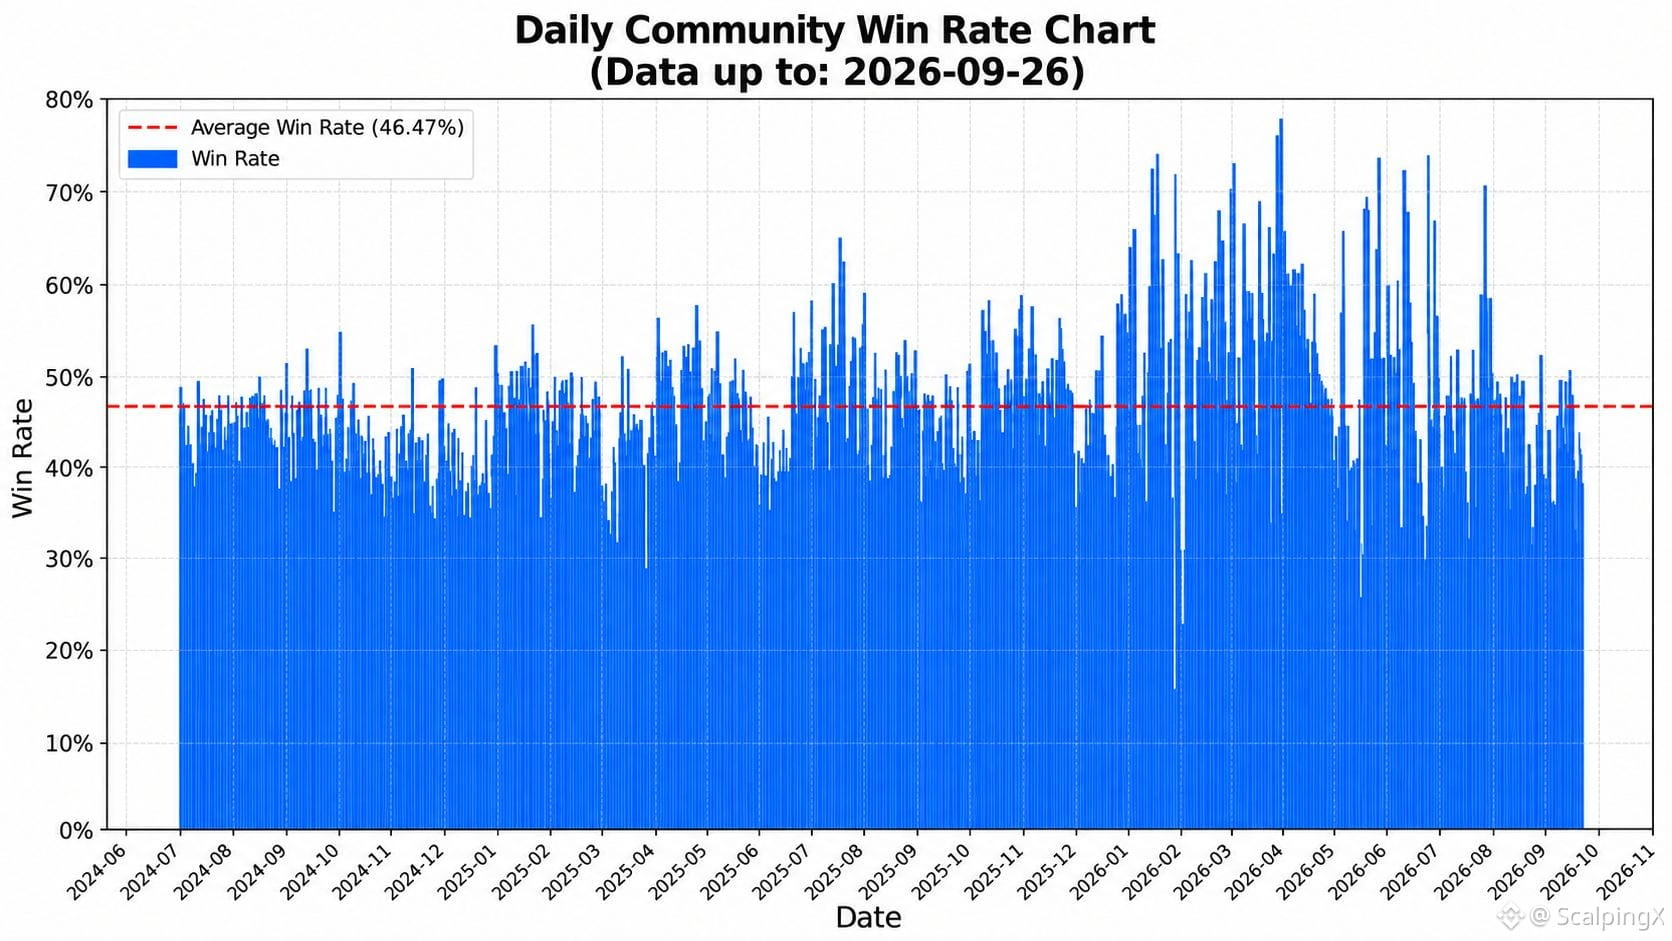
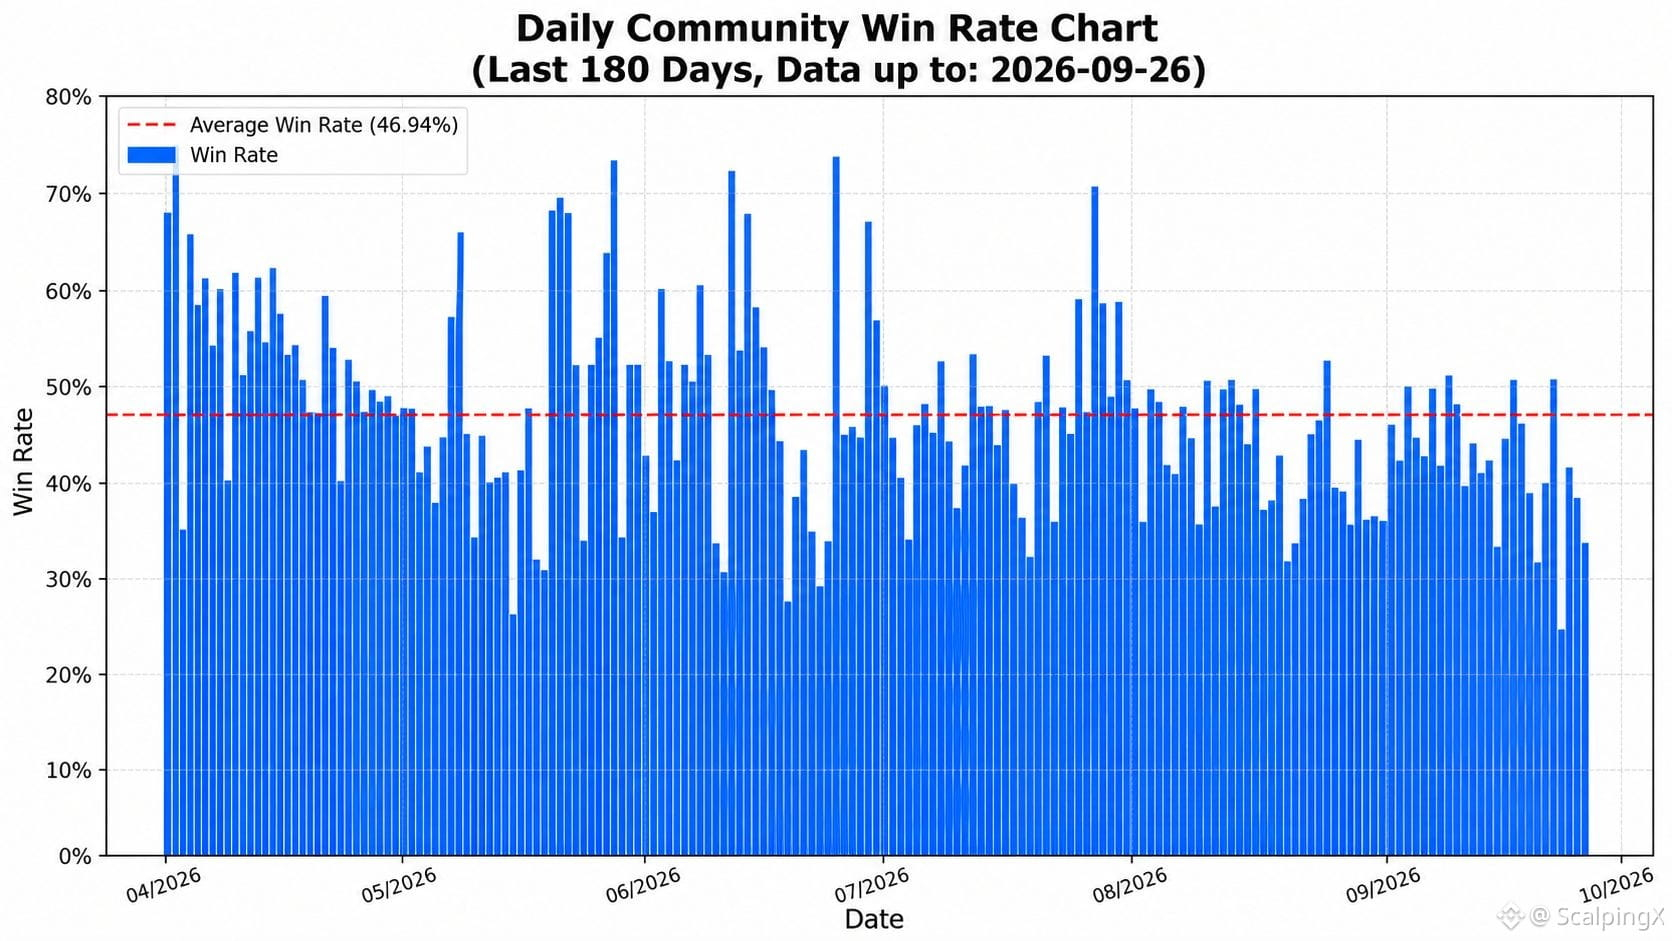
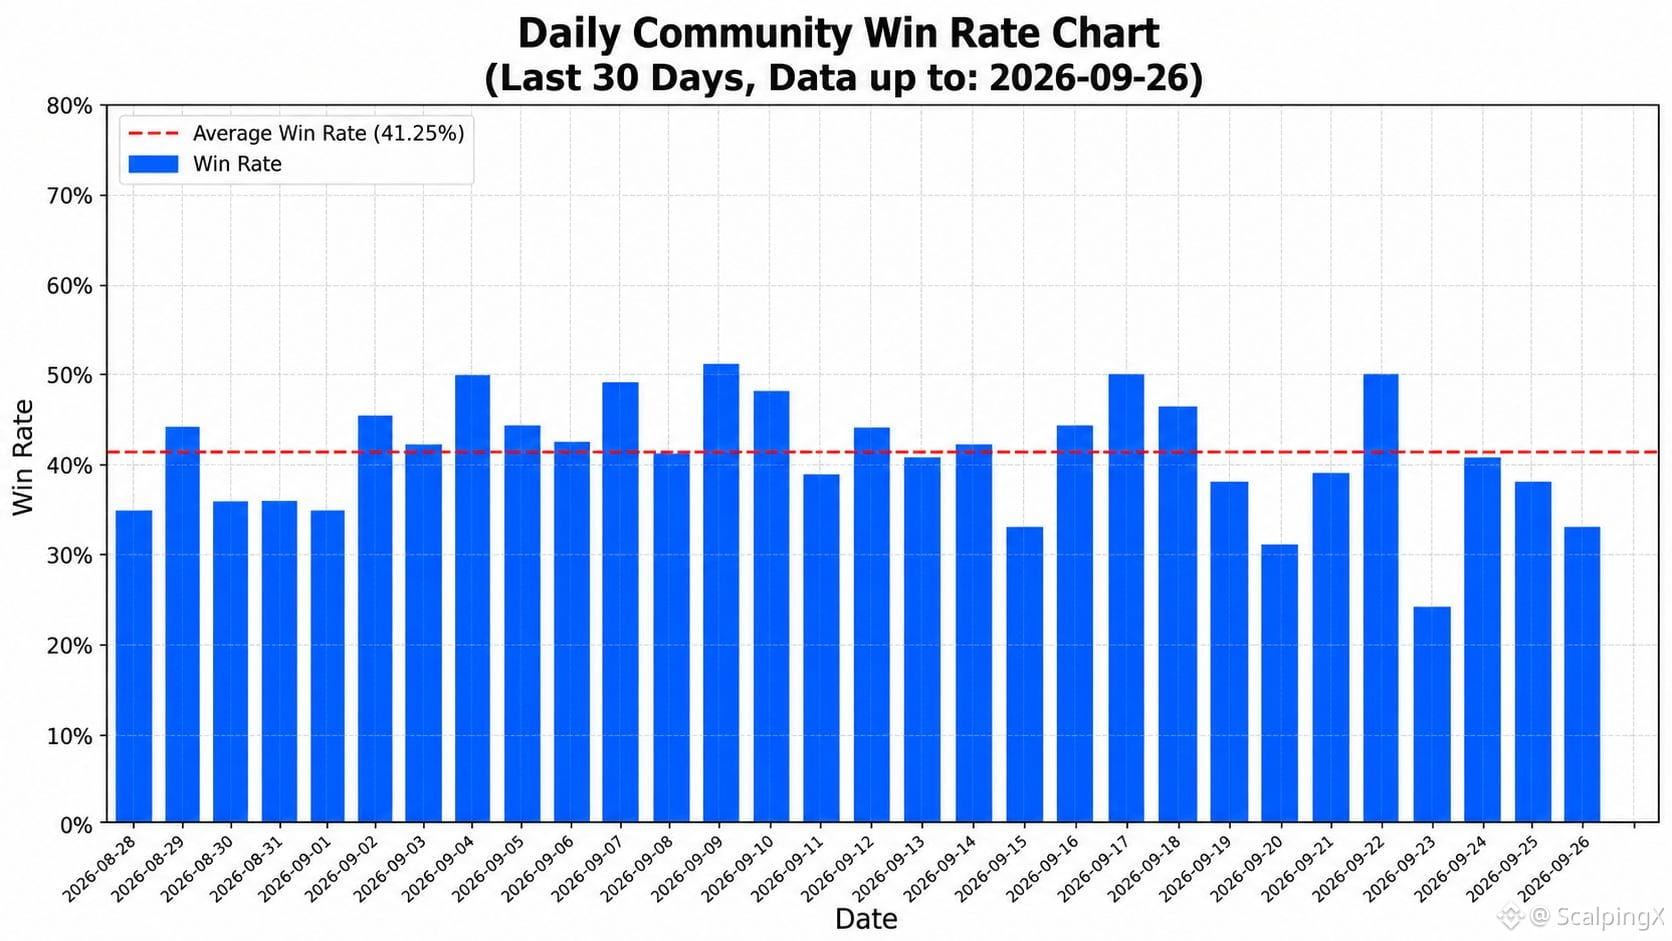
📊 The average win rate is 46.47%
🏆 The highest daily win rate was 78.08% on 2026-04-01. The lowest was 15.69% on 2026-01-25
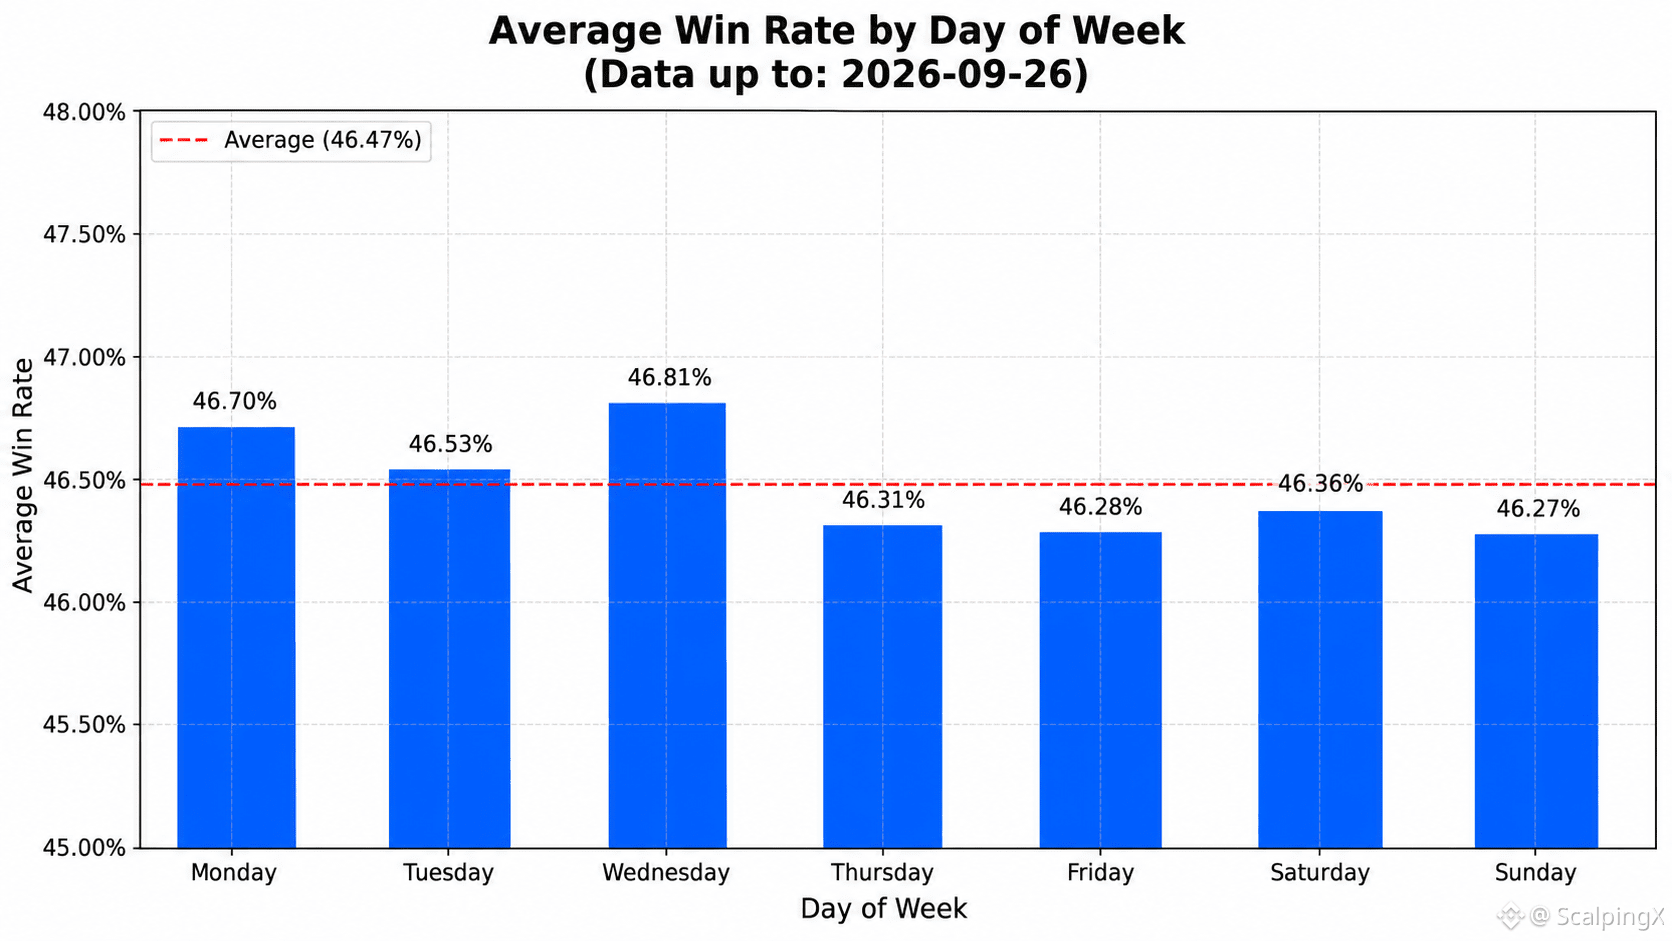
📅 Wednesday has the highest average win rate at 46.81%. Sunday has the lowest average win rate at 46.27%
⏱️ The highest 7-day average win rate was 63.27% for the period ending 2026-04-05. The lowest was 35.60% for the period ending 2026-06-24
⚖️ There were 377 days with a win rate above the overall average and 439 days with a win rate at or below the average
📈 There were 224 days with a win rate above 50%, 436 days between 40% and 50%, and 156 days below 40%
#TradingStats $GRAM
Updated 2026-09-26, community-wide trading
📊 The average win rate is 46.47%
🏆 The highest daily win rate was 78.08% on 2026-04-01. The lowest was 15.69% on 2026-01-25
📅 Wednesday has the highest average win rate at 46.81%. Sunday has the lowest average win rate at 46.27%
⏱️ The highest 7-day average win rate was 63.27% for the period ending 2026-04-05. The lowest was 35.60% for the period ending 2026-06-24
⚖️ There were 377 days with a win rate above the overall average and 439 days with a win rate at or below the average
📈 There were 224 days with a win rate above 50%, 436 days between 40% and 50%, and 156 days below 40%
#TradingStats $GRAM
📊 The average win rate is 46.47%
🏆 The highest daily win rate was 78.08% on 2026-04-01. The lowest was 15.69% on 2026-01-25
📅 Wednesday has the highest average win rate at 46.81%. Sunday has the lowest average win rate at 46.27%
⏱️ The highest 7-day average win rate was 63.27% for the period ending 2026-04-05. The lowest was 35.60% for the period ending 2026-06-24
⚖️ There were 377 days with a win rate above the overall average and 439 days with a win rate at or below the average
📈 There were 224 days with a win rate above 50%, 436 days between 40% and 50%, and 156 days below 40%
#TradingStats $GRAM
125
·
--
Рост
Updated 2026-09-12, community-wide trading
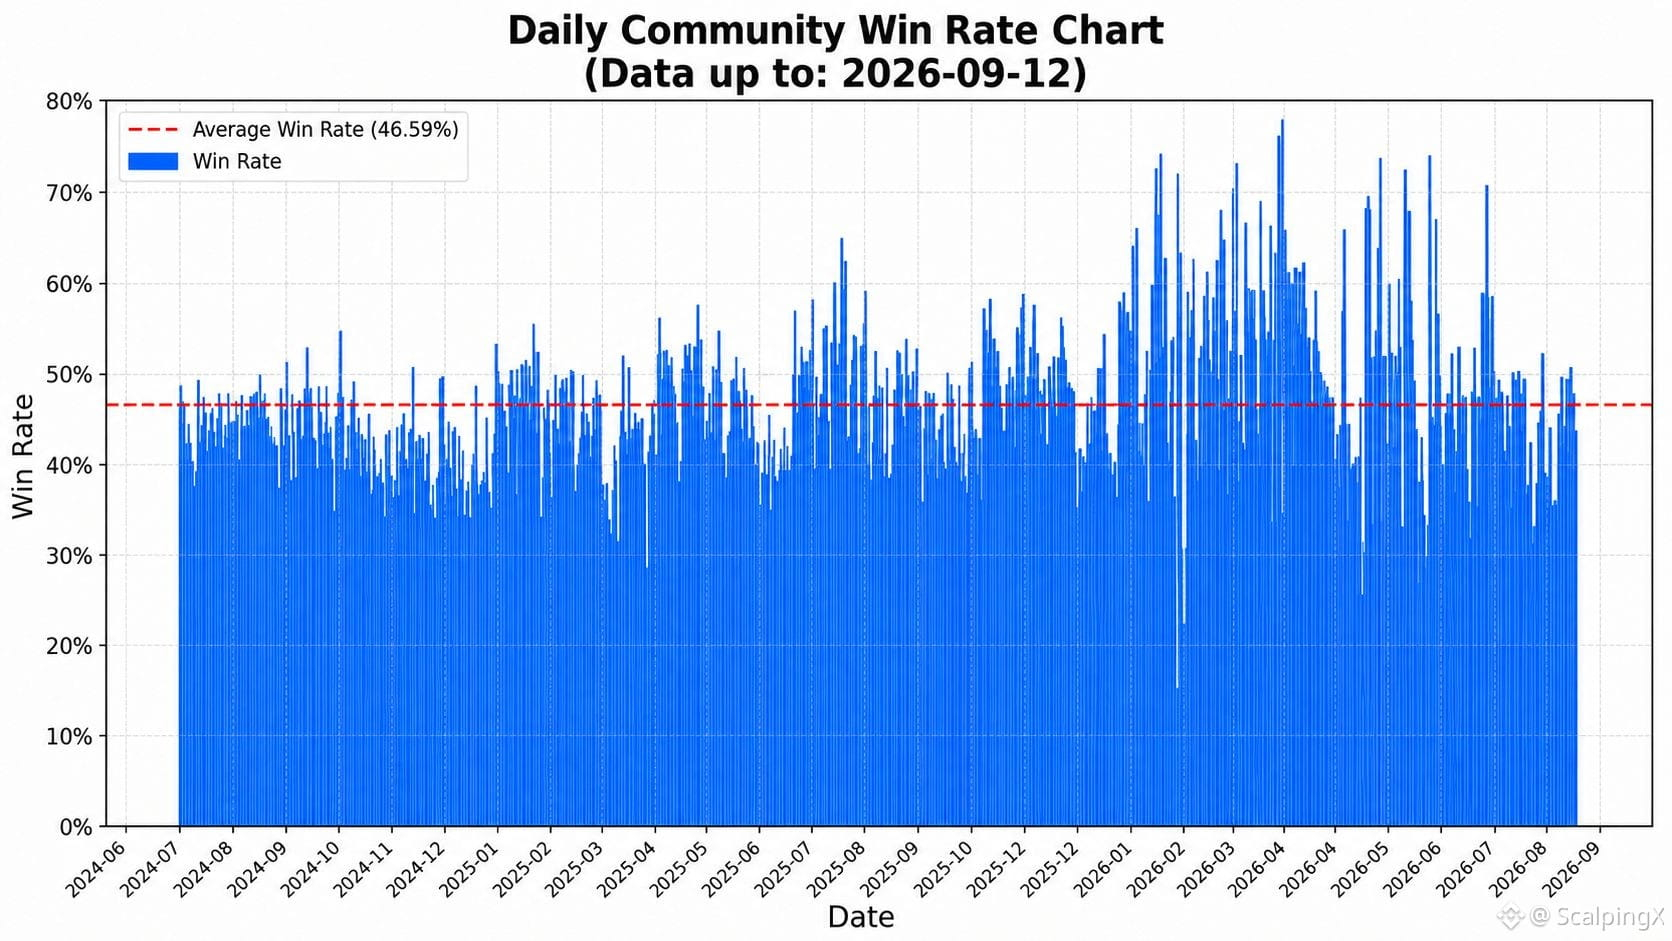
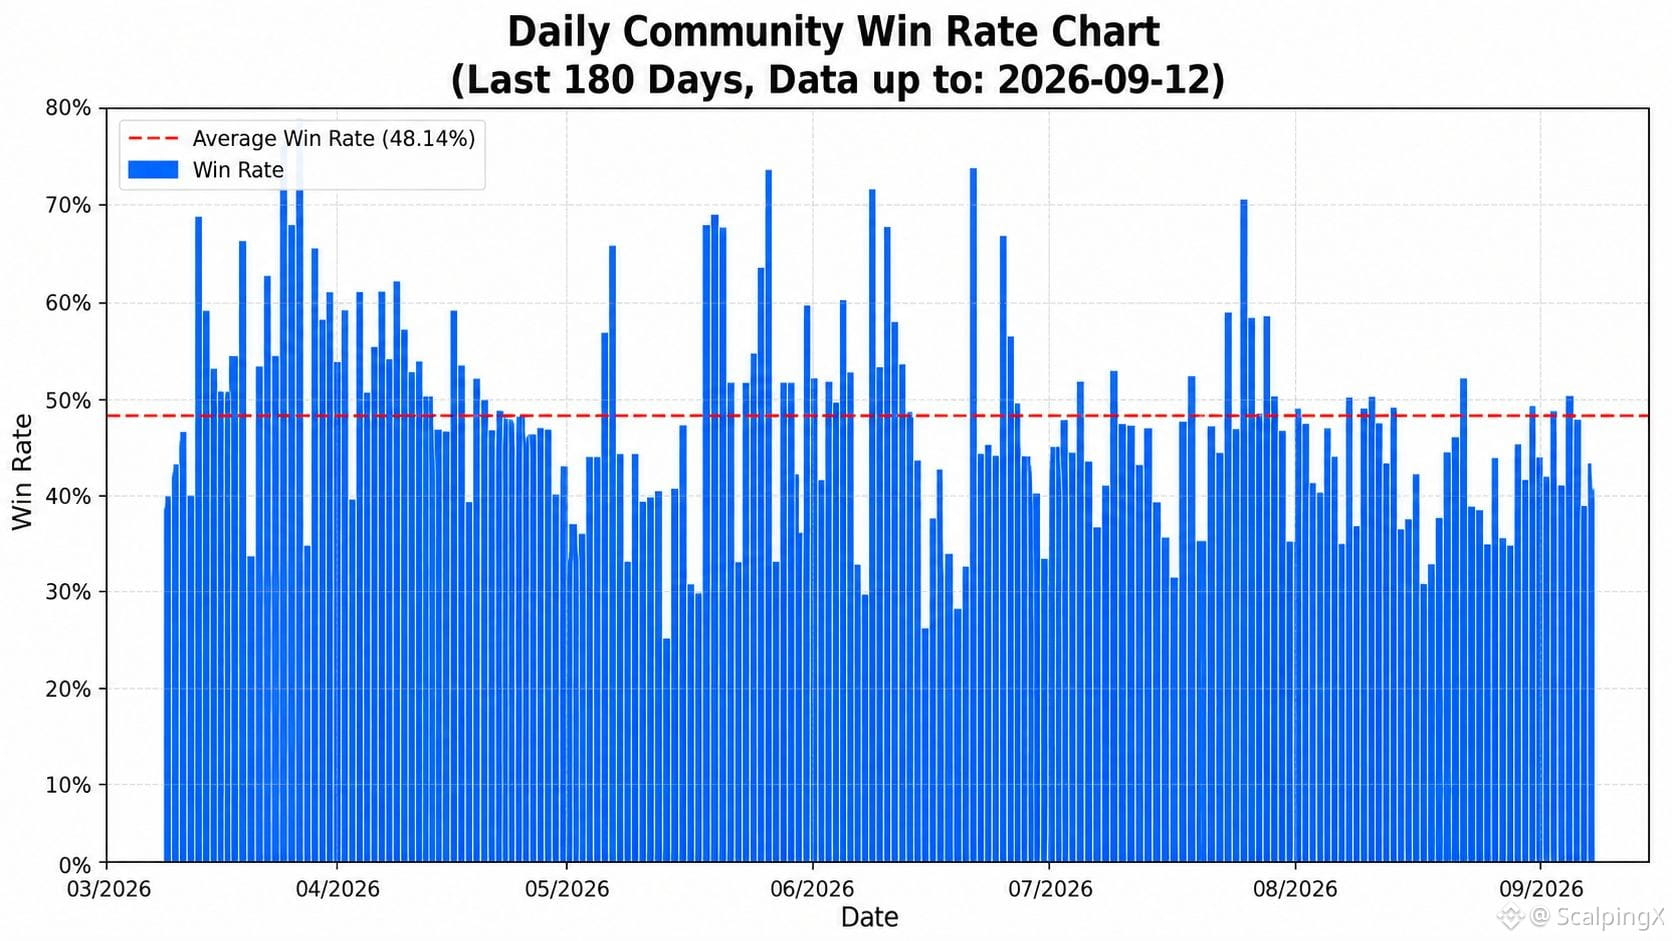
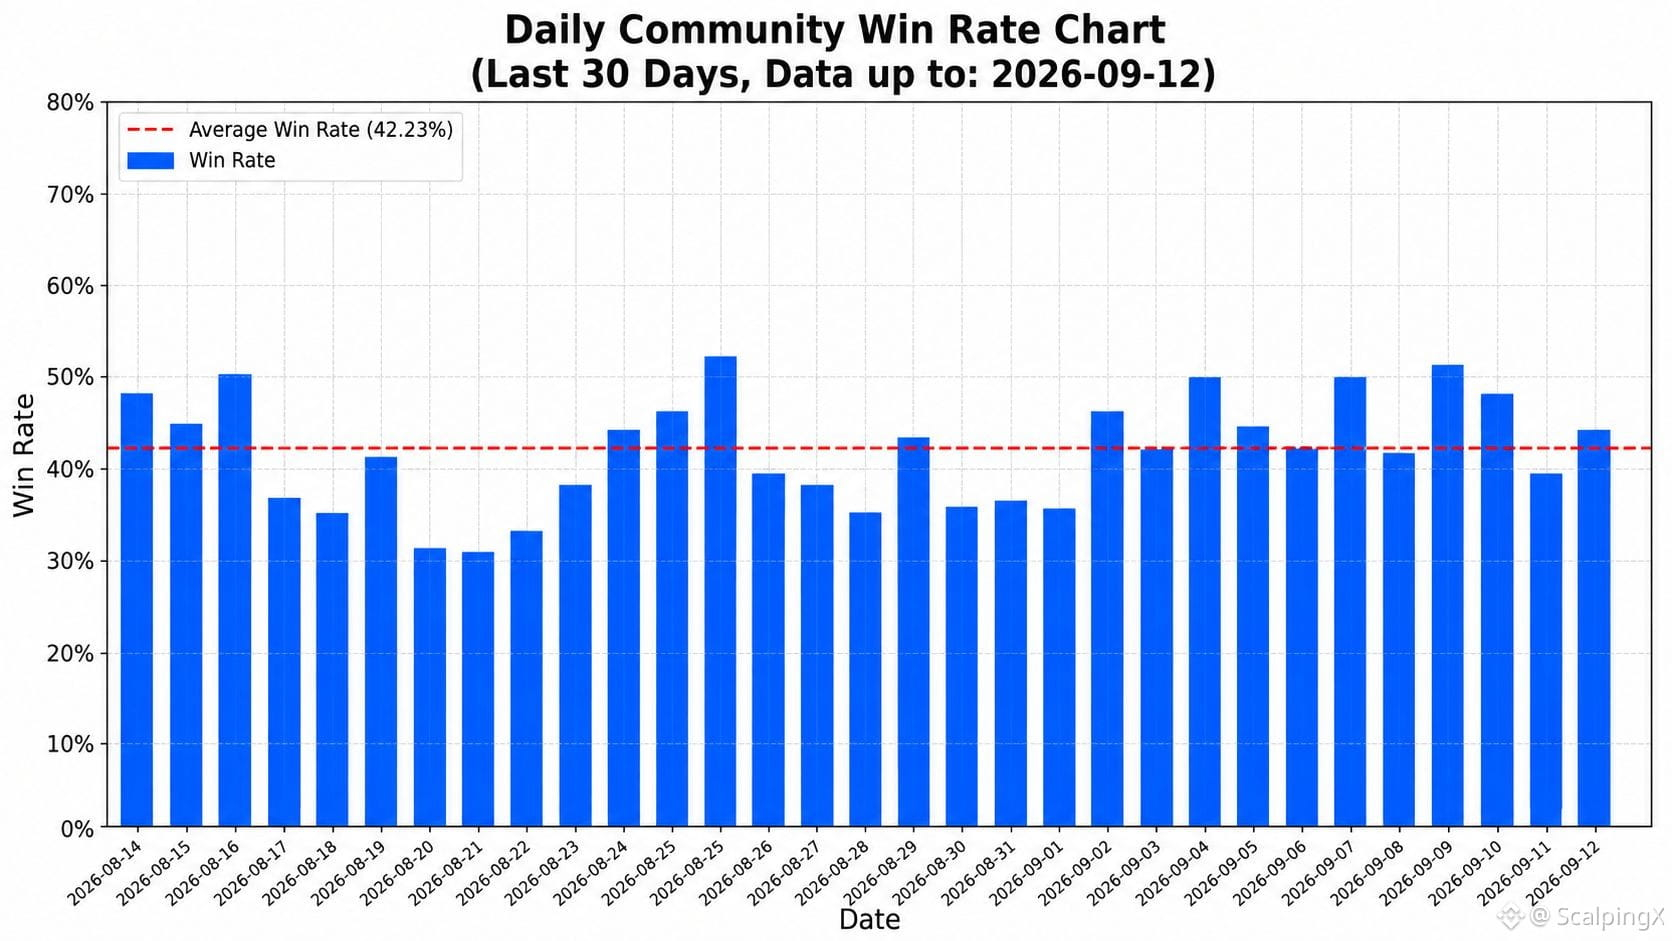
📊 The average win rate is 46.59%.
🏆 The highest daily win rate was recorded on 2026-04-01 at 78.08%. The lowest was recorded on 2026-01-25 at 15.69%.
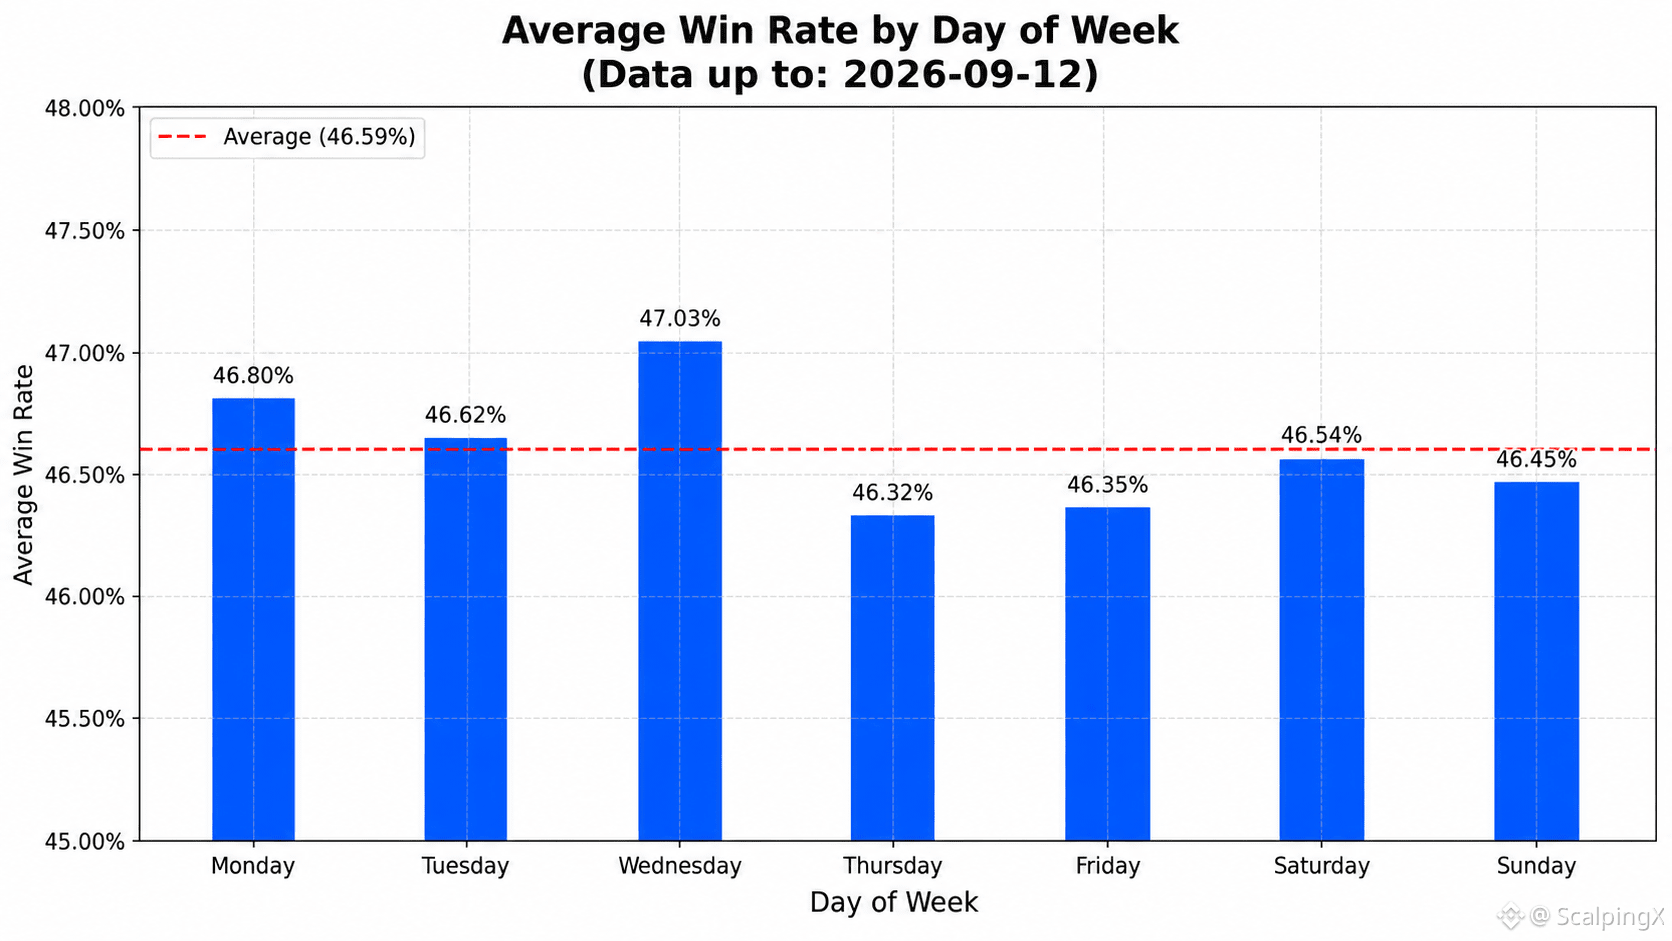
📅 Wednesday has the highest average win rate at 47.03%, while Thursday has the lowest at 46.32%.
⏱️ The highest 7-day average win rate was 63.27% for the period ending on 2026-04-05. The lowest was 35.60% for the period ending on 2026-06-24.
⚖️ There were 373 days with a win rate above the overall average, while 429 days were at or below the average.
📈 There were 222 days with a win rate above 50%, 431 days with a win rate between 40% and 50%, and 149 days with a win rate below 40%.
#TradingStats $IOST
Updated 2026-09-12, community-wide trading
📊 The average win rate is 46.59%.
🏆 The highest daily win rate was recorded on 2026-04-01 at 78.08%. The lowest was recorded on 2026-01-25 at 15.69%.
📅 Wednesday has the highest average win rate at 47.03%, while Thursday has the lowest at 46.32%.
⏱️ The highest 7-day average win rate was 63.27% for the period ending on 2026-04-05. The lowest was 35.60% for the period ending on 2026-06-24.
⚖️ There were 373 days with a win rate above the overall average, while 429 days were at or below the average.
📈 There were 222 days with a win rate above 50%, 431 days with a win rate between 40% and 50%, and 149 days with a win rate below 40%.
#TradingStats $IOST
📊 The average win rate is 46.59%.
🏆 The highest daily win rate was recorded on 2026-04-01 at 78.08%. The lowest was recorded on 2026-01-25 at 15.69%.
📅 Wednesday has the highest average win rate at 47.03%, while Thursday has the lowest at 46.32%.
⏱️ The highest 7-day average win rate was 63.27% for the period ending on 2026-04-05. The lowest was 35.60% for the period ending on 2026-06-24.
⚖️ There were 373 days with a win rate above the overall average, while 429 days were at or below the average.
📈 There were 222 days with a win rate above 50%, 431 days with a win rate between 40% and 50%, and 149 days with a win rate below 40%.
#TradingStats $IOST
229
·
--
Рост
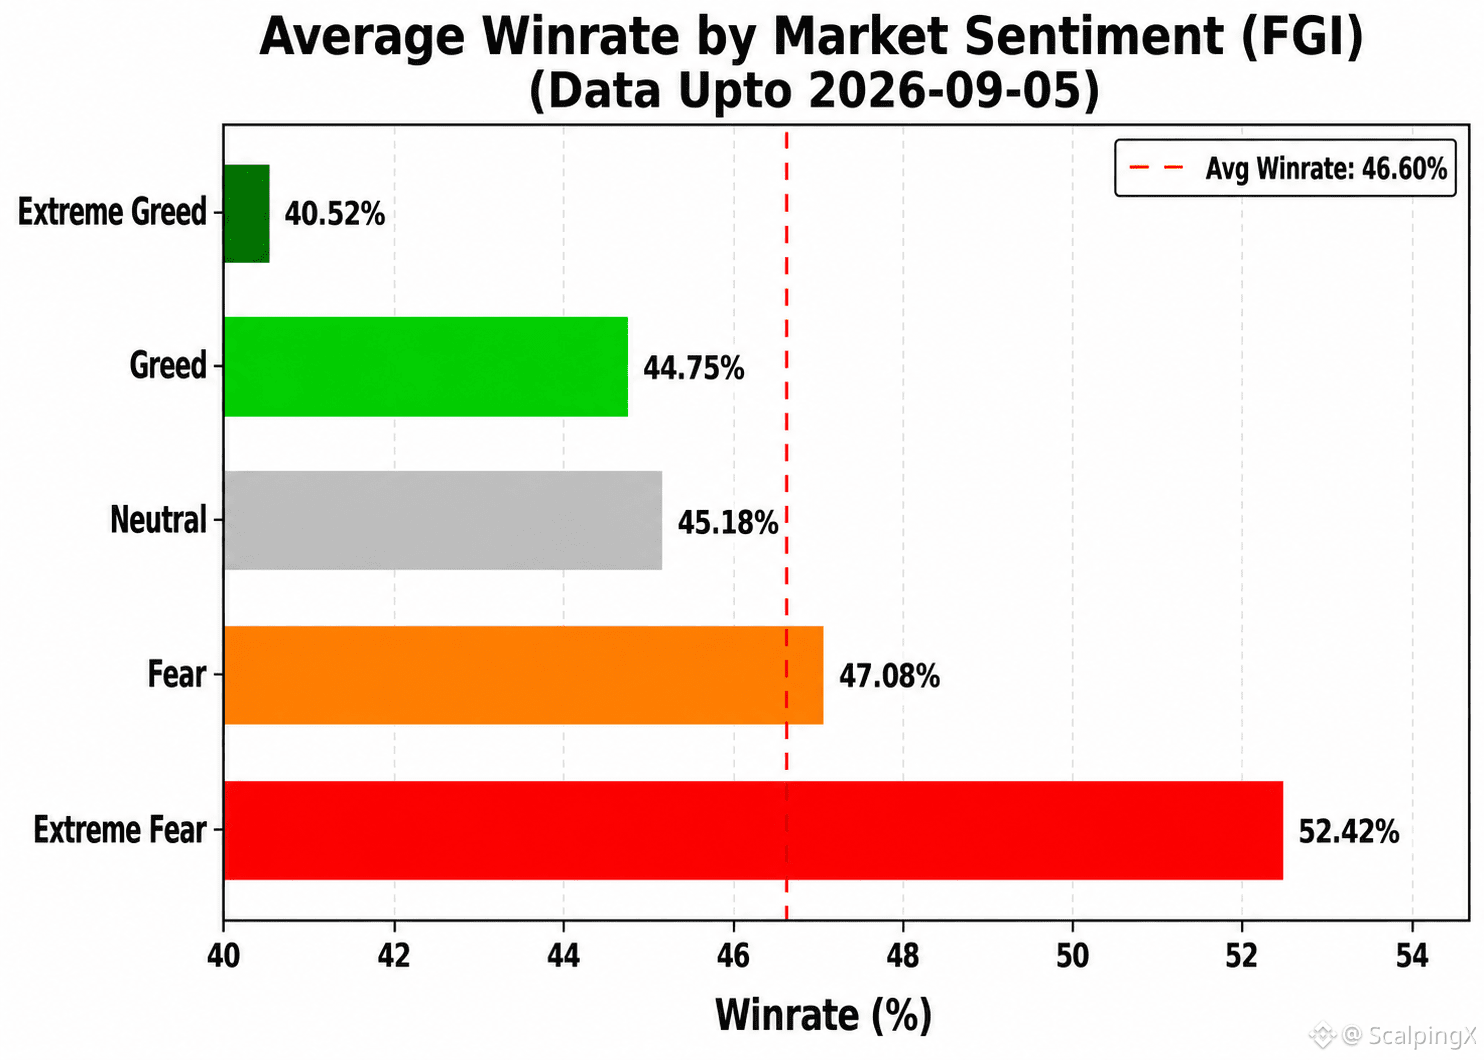
📊 TRADING PERFORMANCE & MARKET SENTIMENT INDEX (FGI) REPORT – UPDATED 2026-09-05
The latest statistics show that the correlation between the FGI and Win Rate remains weak and continues to lean negative, at r ≈ -0.293. This suggests that FGI is not suitable as a standalone tool for determining order entries, but it can still be useful for risk assessment. Trading performance generally tends to weaken as market sentiment moves into extreme optimism, making FGI more suitable as an early risk-warning indicator rather than a signal for expanding profit targets.
Below is a summary of Win Rate (WR), minimum breakeven R:R, and the number of recorded days (n) across sentiment zones:
🤑 Extreme Greed (≥80): WR 40.5% • R:R=1:1.47 • n=25
🤤 Greed (60–80): WR 44.7% • R:R=1:1.23 • n=232
😐 Neutral (40–60): WR 45.2% • R:R=1:1.21 • n=152
😰 Fear (20–40): WR 47.1% • R:R=1:1.12 • n=271
😱 Extreme Fear (<20): WR 52.4% • R:R=1:0.91 • n=115
Share of days with performance above the overall average of 46.60% by sentiment zone:
🤑 Extreme Greed: 8.0%
🤤 Greed: 35.3%
😐 Neutral: 38.8%
😰 Fear: 55.0%
😱 Extreme Fear: 67.8%
➤ Scalpers can use FGI as a guide for adjusting expected profit targets when entering trades:
📈 When FGI is high, expected profit targets may need to be increased to maintain a sufficiently large R:R and compensate for the lower win rate.
📉 When FGI is low, expected profit targets can be reduced to improve capital turnover and make profit realization easier.
#TradingStats $BTC $SOL $BNB
📊 TRADING PERFORMANCE & MARKET SENTIMENT INDEX (FGI) REPORT – UPDATED 2026-09-05
The latest statistics show that the correlation between the FGI and Win Rate remains weak and continues to lean negative, at r ≈ -0.293. This suggests that FGI is not suitable as a standalone tool for determining order entries, but it can still be useful for risk assessment. Trading performance generally tends to weaken as market sentiment moves into extreme optimism, making FGI more suitable as an early risk-warning indicator rather than a signal for expanding profit targets.
Below is a summary of Win Rate (WR), minimum breakeven R:R, and the number of recorded days (n) across sentiment zones:
🤑 Extreme Greed (≥80): WR 40.5% • R:R=1:1.47 • n=25
🤤 Greed (60–80): WR 44.7% • R:R=1:1.23 • n=232
😐 Neutral (40–60): WR 45.2% • R:R=1:1.21 • n=152
😰 Fear (20–40): WR 47.1% • R:R=1:1.12 • n=271
😱 Extreme Fear (<20): WR 52.4% • R:R=1:0.91 • n=115
Share of days with performance above the overall average of 46.60% by sentiment zone:
🤑 Extreme Greed: 8.0%
🤤 Greed: 35.3%
😐 Neutral: 38.8%
😰 Fear: 55.0%
😱 Extreme Fear: 67.8%
➤ Scalpers can use FGI as a guide for adjusting expected profit targets when entering trades:
📈 When FGI is high, expected profit targets may need to be increased to maintain a sufficiently large R:R and compensate for the lower win rate.
📉 When FGI is low, expected profit targets can be reduced to improve capital turnover and make profit realization easier.
#TradingStats $BTC $SOL $BNB
The latest statistics show that the correlation between the FGI and Win Rate remains weak and continues to lean negative, at r ≈ -0.293. This suggests that FGI is not suitable as a standalone tool for determining order entries, but it can still be useful for risk assessment. Trading performance generally tends to weaken as market sentiment moves into extreme optimism, making FGI more suitable as an early risk-warning indicator rather than a signal for expanding profit targets.
Below is a summary of Win Rate (WR), minimum breakeven R:R, and the number of recorded days (n) across sentiment zones:
🤑 Extreme Greed (≥80): WR 40.5% • R:R=1:1.47 • n=25
🤤 Greed (60–80): WR 44.7% • R:R=1:1.23 • n=232
😐 Neutral (40–60): WR 45.2% • R:R=1:1.21 • n=152
😰 Fear (20–40): WR 47.1% • R:R=1:1.12 • n=271
😱 Extreme Fear (<20): WR 52.4% • R:R=1:0.91 • n=115
Share of days with performance above the overall average of 46.60% by sentiment zone:
🤑 Extreme Greed: 8.0%
🤤 Greed: 35.3%
😐 Neutral: 38.8%
😰 Fear: 55.0%
😱 Extreme Fear: 67.8%
➤ Scalpers can use FGI as a guide for adjusting expected profit targets when entering trades:
📈 When FGI is high, expected profit targets may need to be increased to maintain a sufficiently large R:R and compensate for the lower win rate.
📉 When FGI is low, expected profit targets can be reduced to improve capital turnover and make profit realization easier.
#TradingStats $BTC $SOL $BNB
108
·
--
Рост
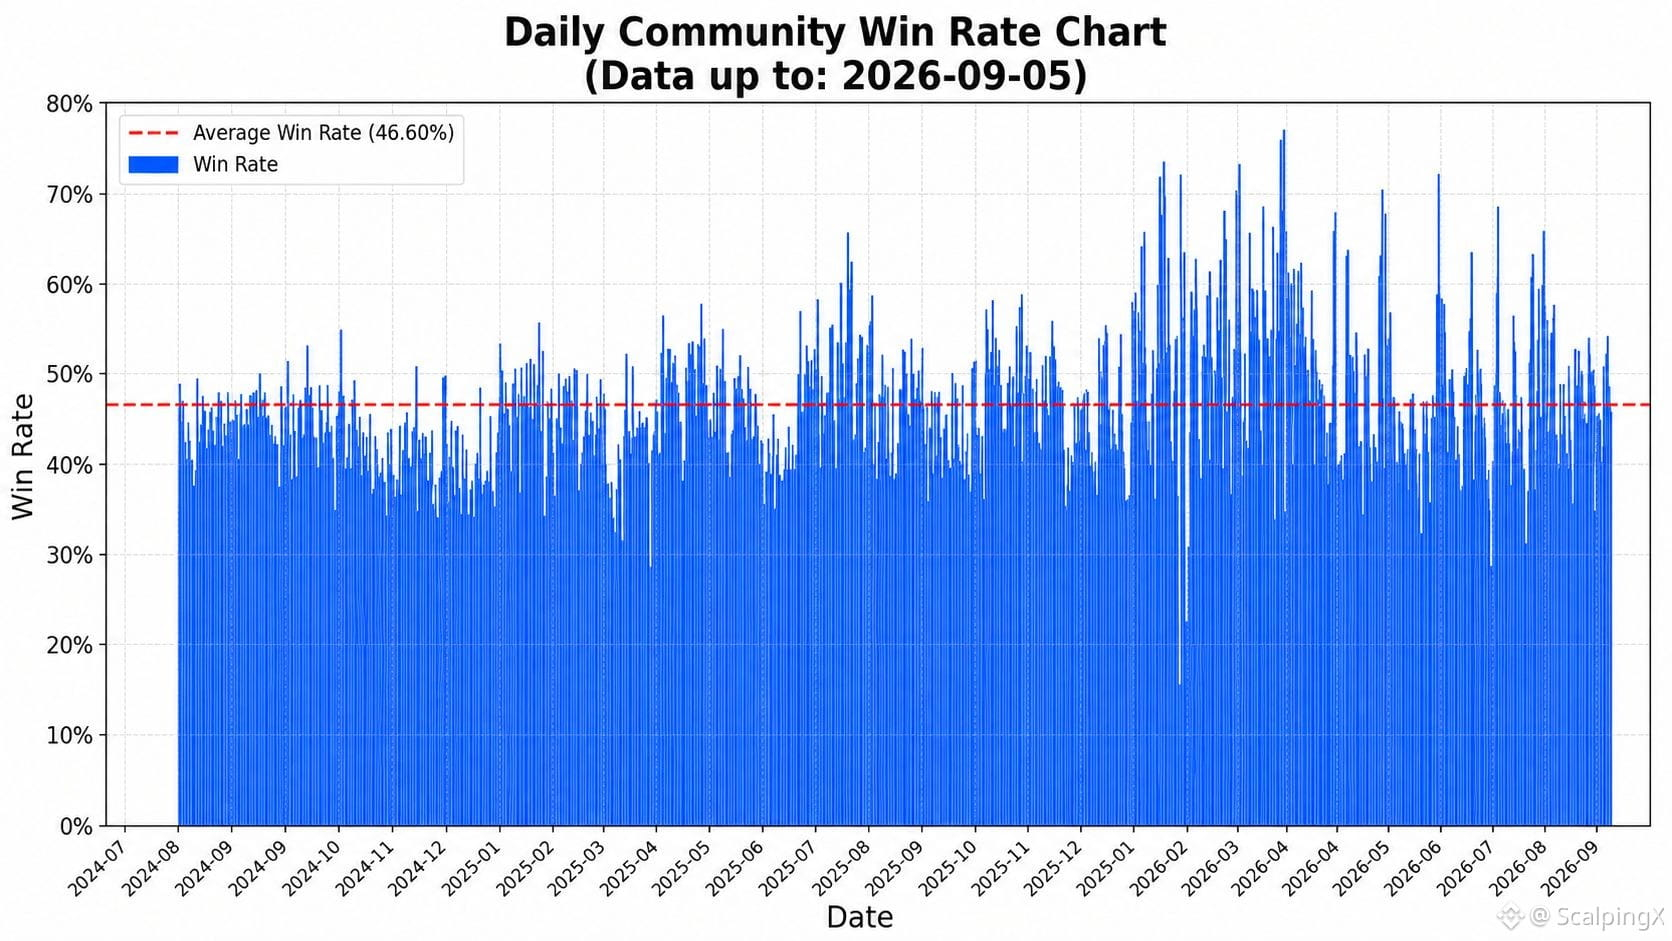
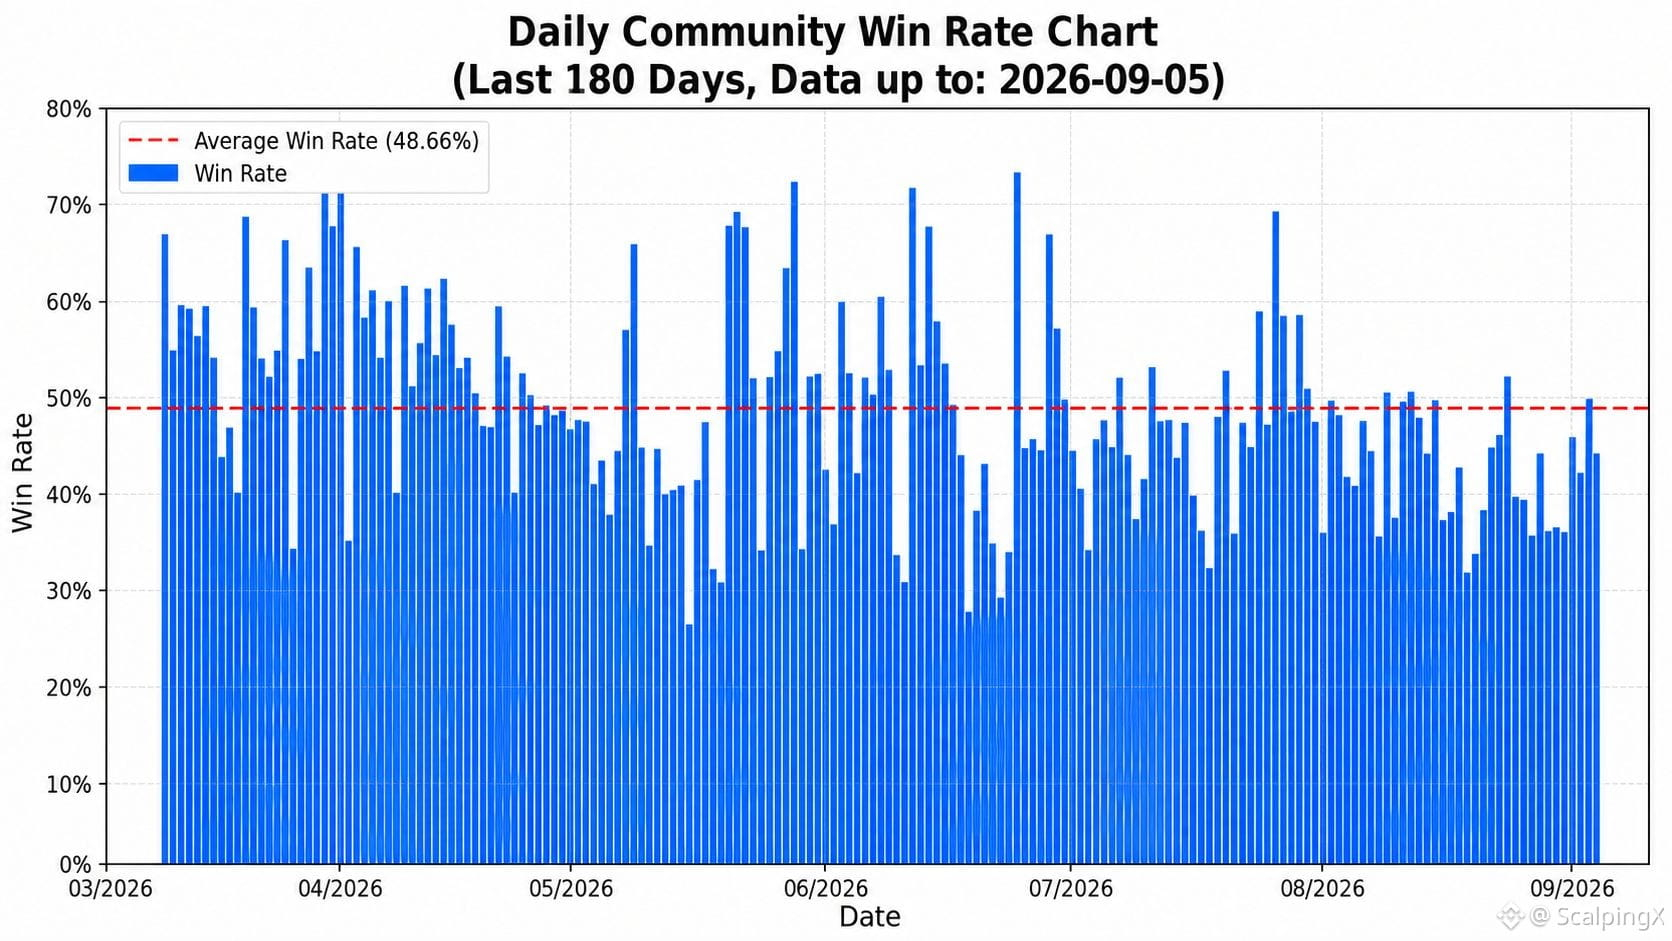
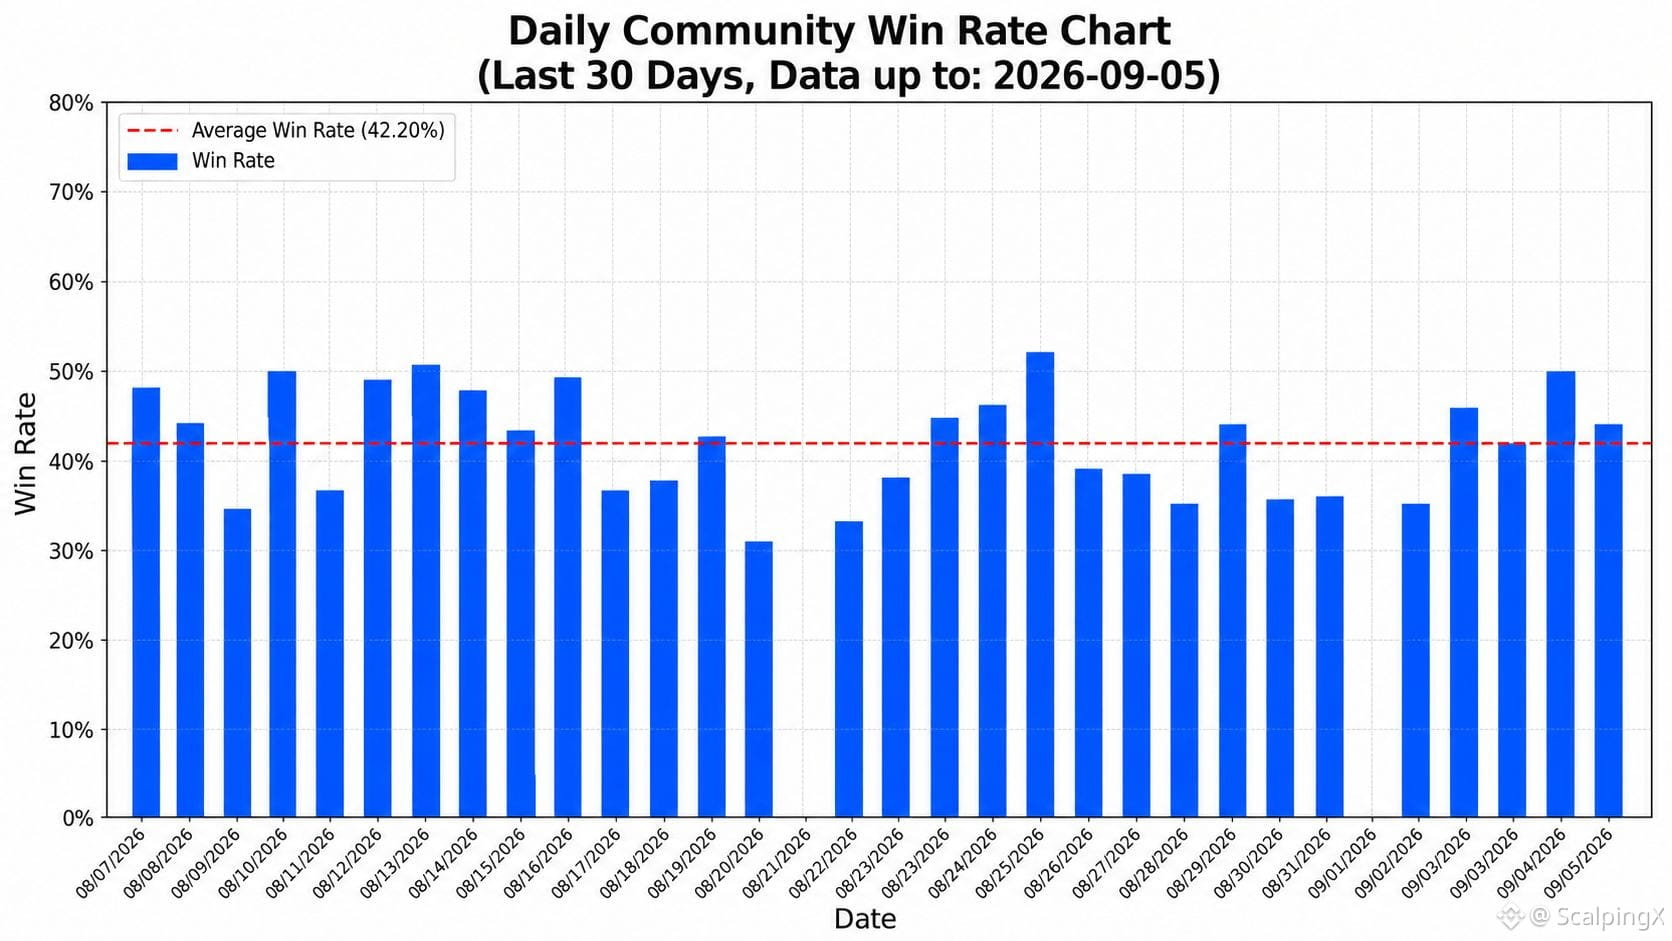
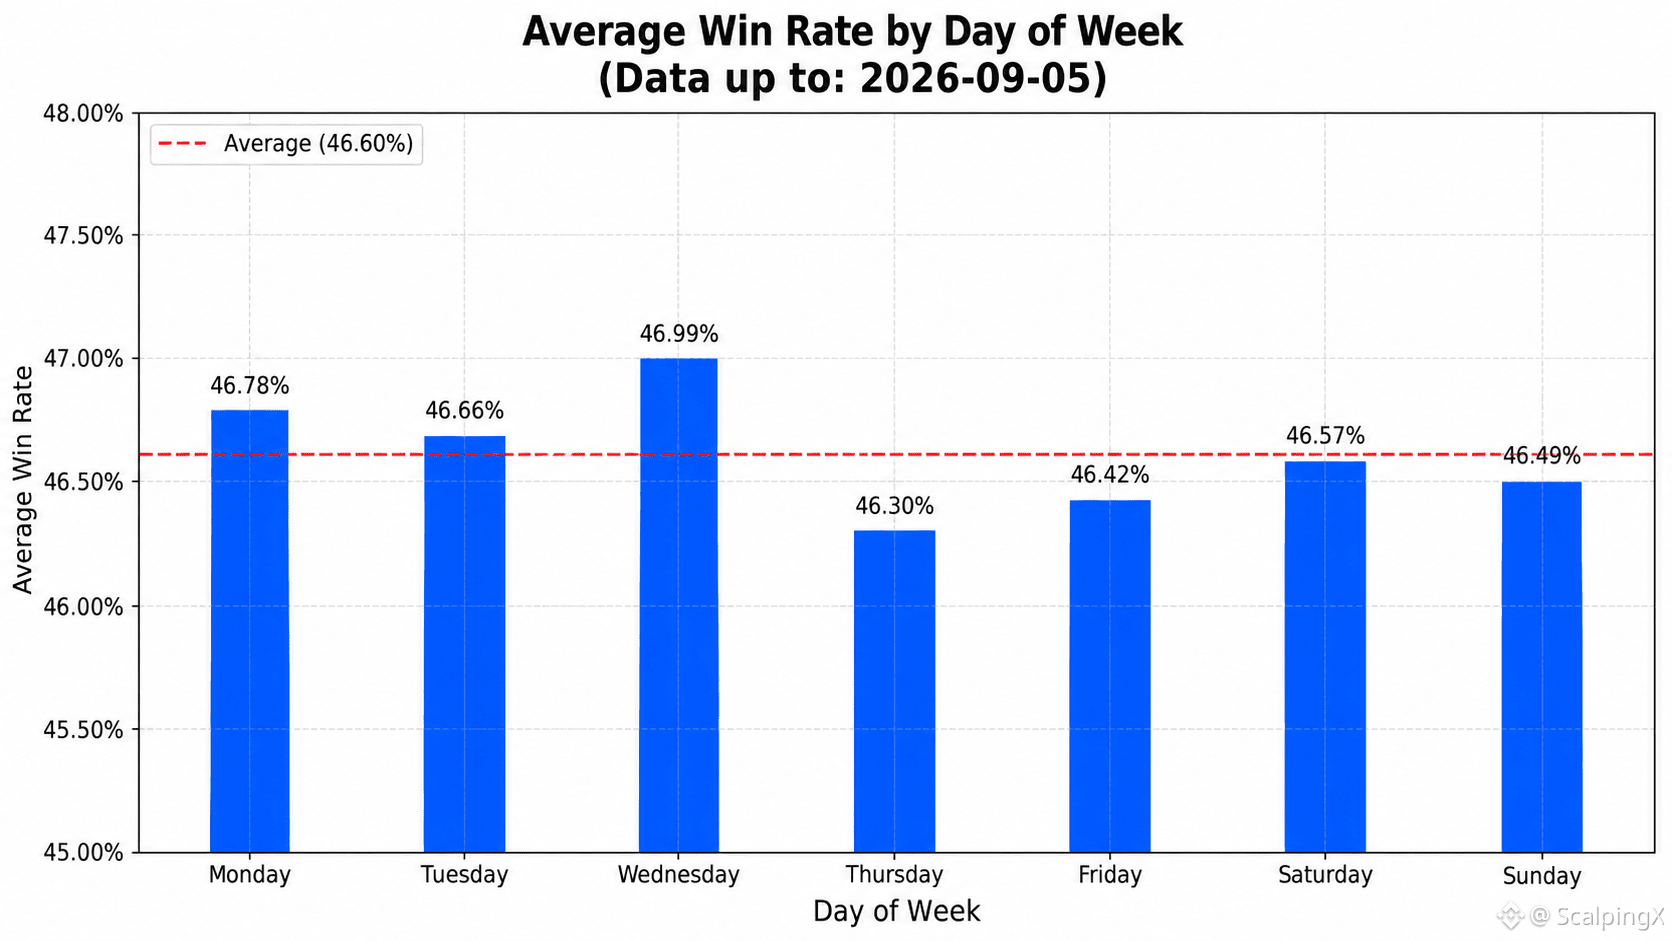
Updated as of 2026-09-05, based on trading data from the entire community:
📊 The average win rate is 46.60%
🏆 The highest daily win rate was recorded on 2026-04-01 at 78.08%. The lowest was recorded on 2026-01-25 at 15.69%
📅 Wednesday has the highest average win rate by weekday at 46.99%. Thursday has the lowest at 46.30%
⏱️ The best 7-day period ended on 2026-04-05 with an average win rate of 63.27%. The weakest 7-day period ended on 2026-06-24 at 35.60%
⚖️ There were 370 days with a win rate above the overall average, while 425 days were at or below the average
📈 There were 221 days with a win rate above 50%, 426 days between 40% and 50%, and 148 days below 40%
#TradingStats $BTC $GRAM $SOL
Updated as of 2026-09-05, based on trading data from the entire community:
📊 The average win rate is 46.60%
🏆 The highest daily win rate was recorded on 2026-04-01 at 78.08%. The lowest was recorded on 2026-01-25 at 15.69%
📅 Wednesday has the highest average win rate by weekday at 46.99%. Thursday has the lowest at 46.30%
⏱️ The best 7-day period ended on 2026-04-05 with an average win rate of 63.27%. The weakest 7-day period ended on 2026-06-24 at 35.60%
⚖️ There were 370 days with a win rate above the overall average, while 425 days were at or below the average
📈 There were 221 days with a win rate above 50%, 426 days between 40% and 50%, and 148 days below 40%
#TradingStats $BTC $GRAM $SOL
📊 The average win rate is 46.60%
🏆 The highest daily win rate was recorded on 2026-04-01 at 78.08%. The lowest was recorded on 2026-01-25 at 15.69%
📅 Wednesday has the highest average win rate by weekday at 46.99%. Thursday has the lowest at 46.30%
⏱️ The best 7-day period ended on 2026-04-05 with an average win rate of 63.27%. The weakest 7-day period ended on 2026-06-24 at 35.60%
⚖️ There were 370 days with a win rate above the overall average, while 425 days were at or below the average
📈 There were 221 days with a win rate above 50%, 426 days between 40% and 50%, and 148 days below 40%
#TradingStats $BTC $GRAM $SOL
272
·
--
Рост
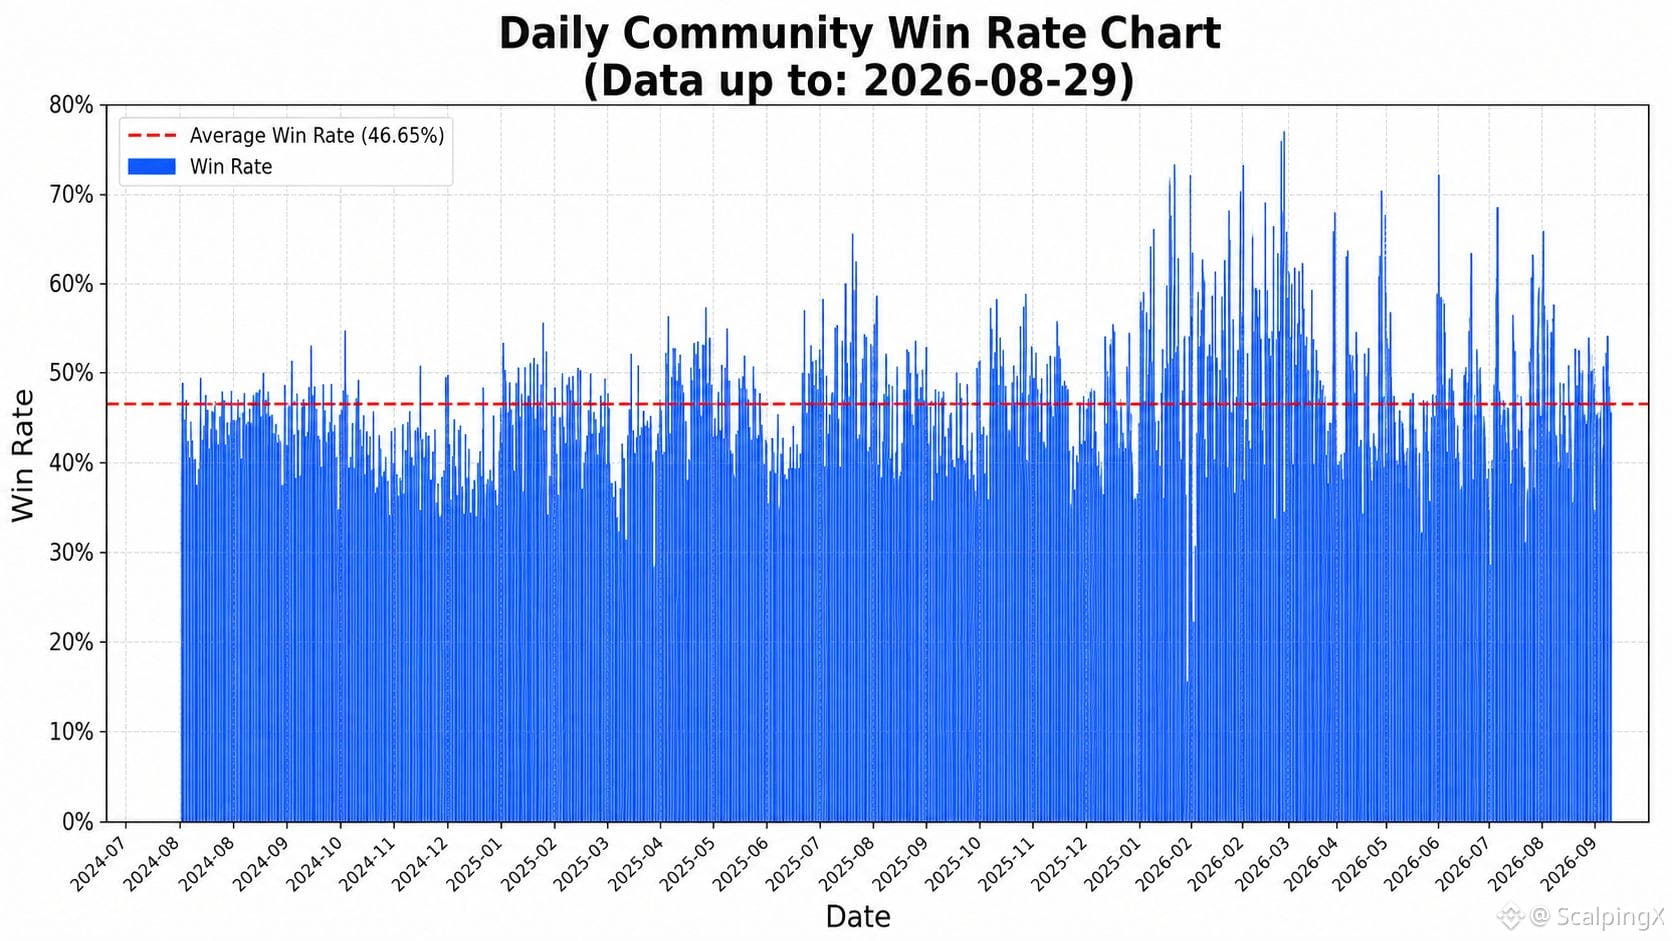
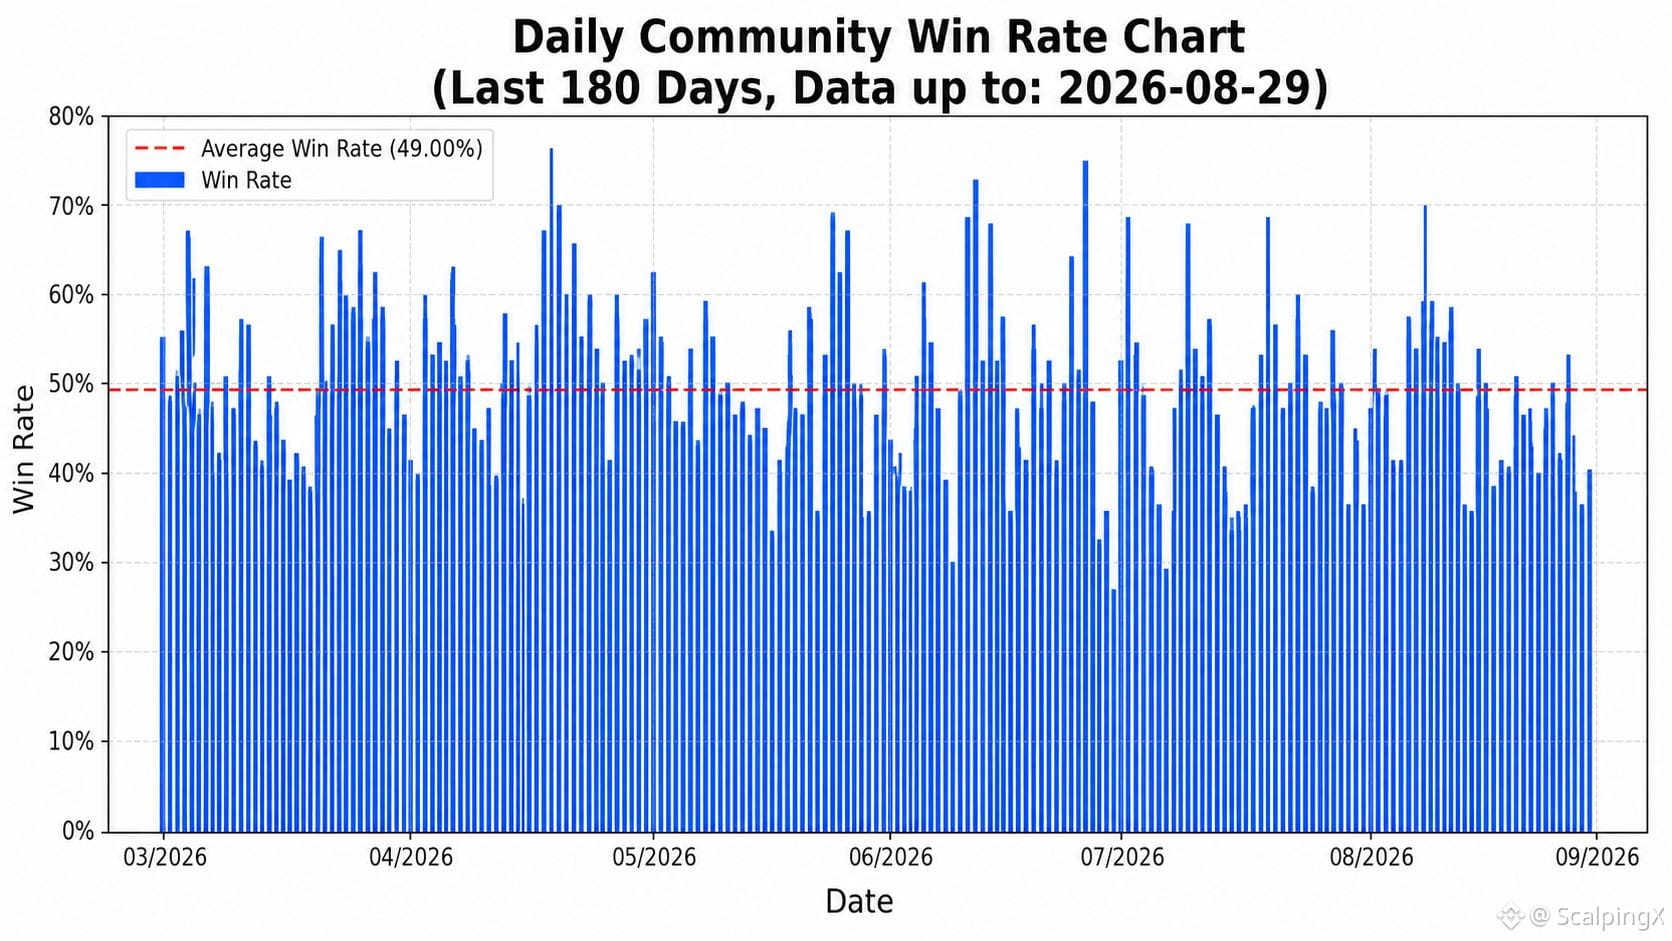
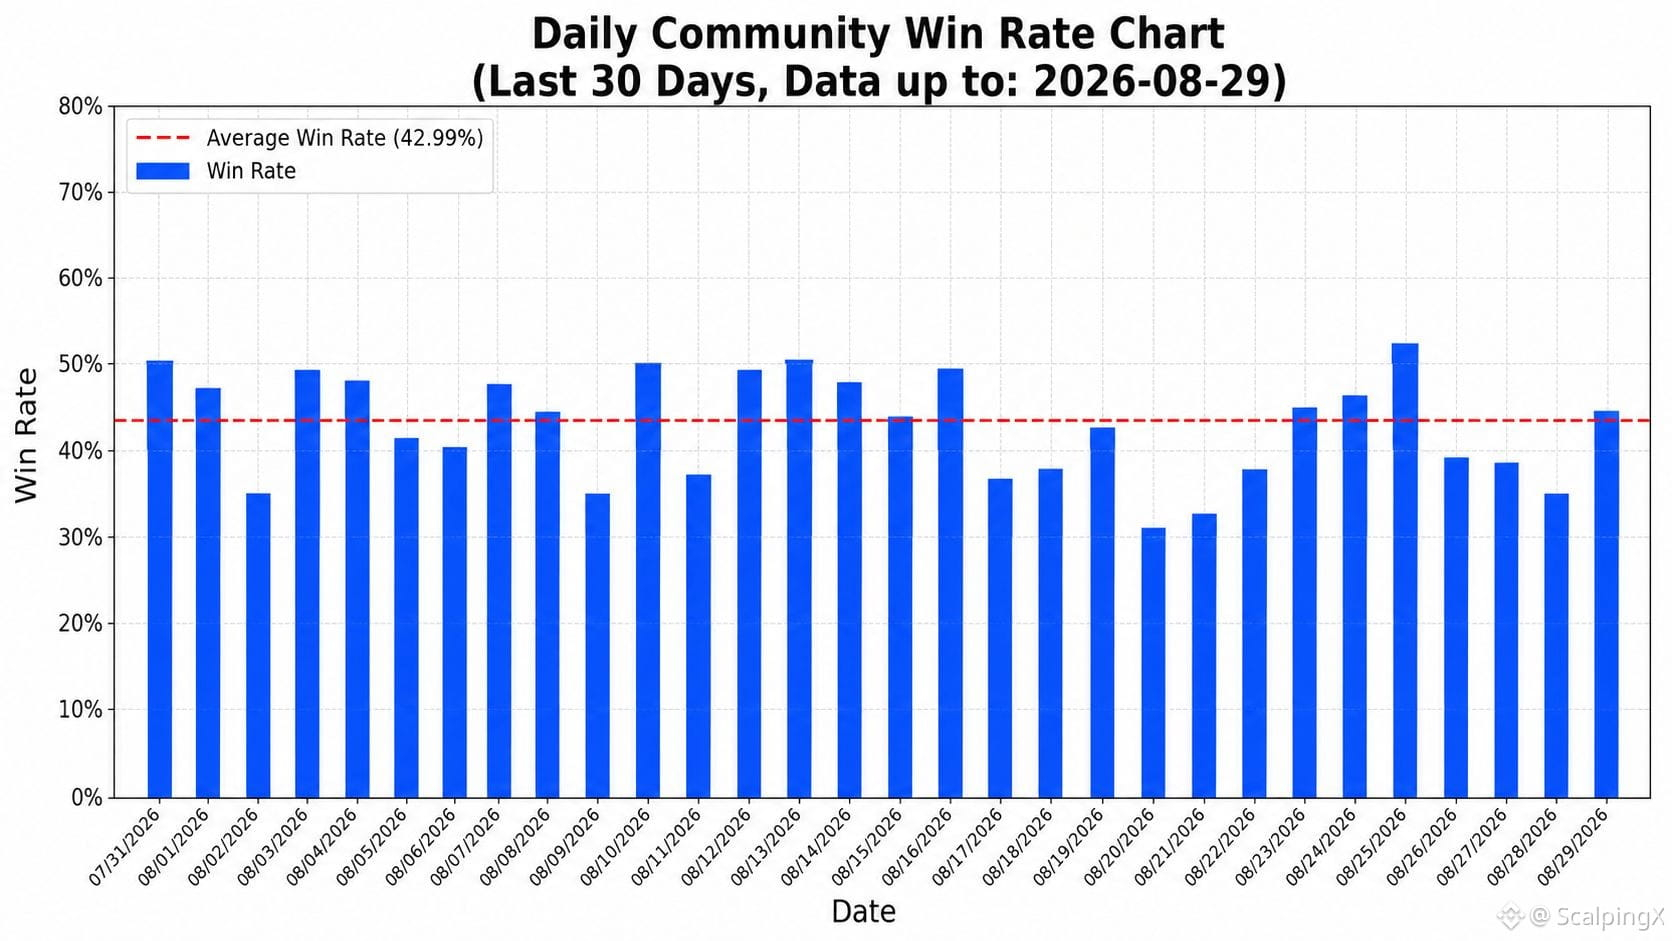
Updated 2026-08-29, based on community-wide trading
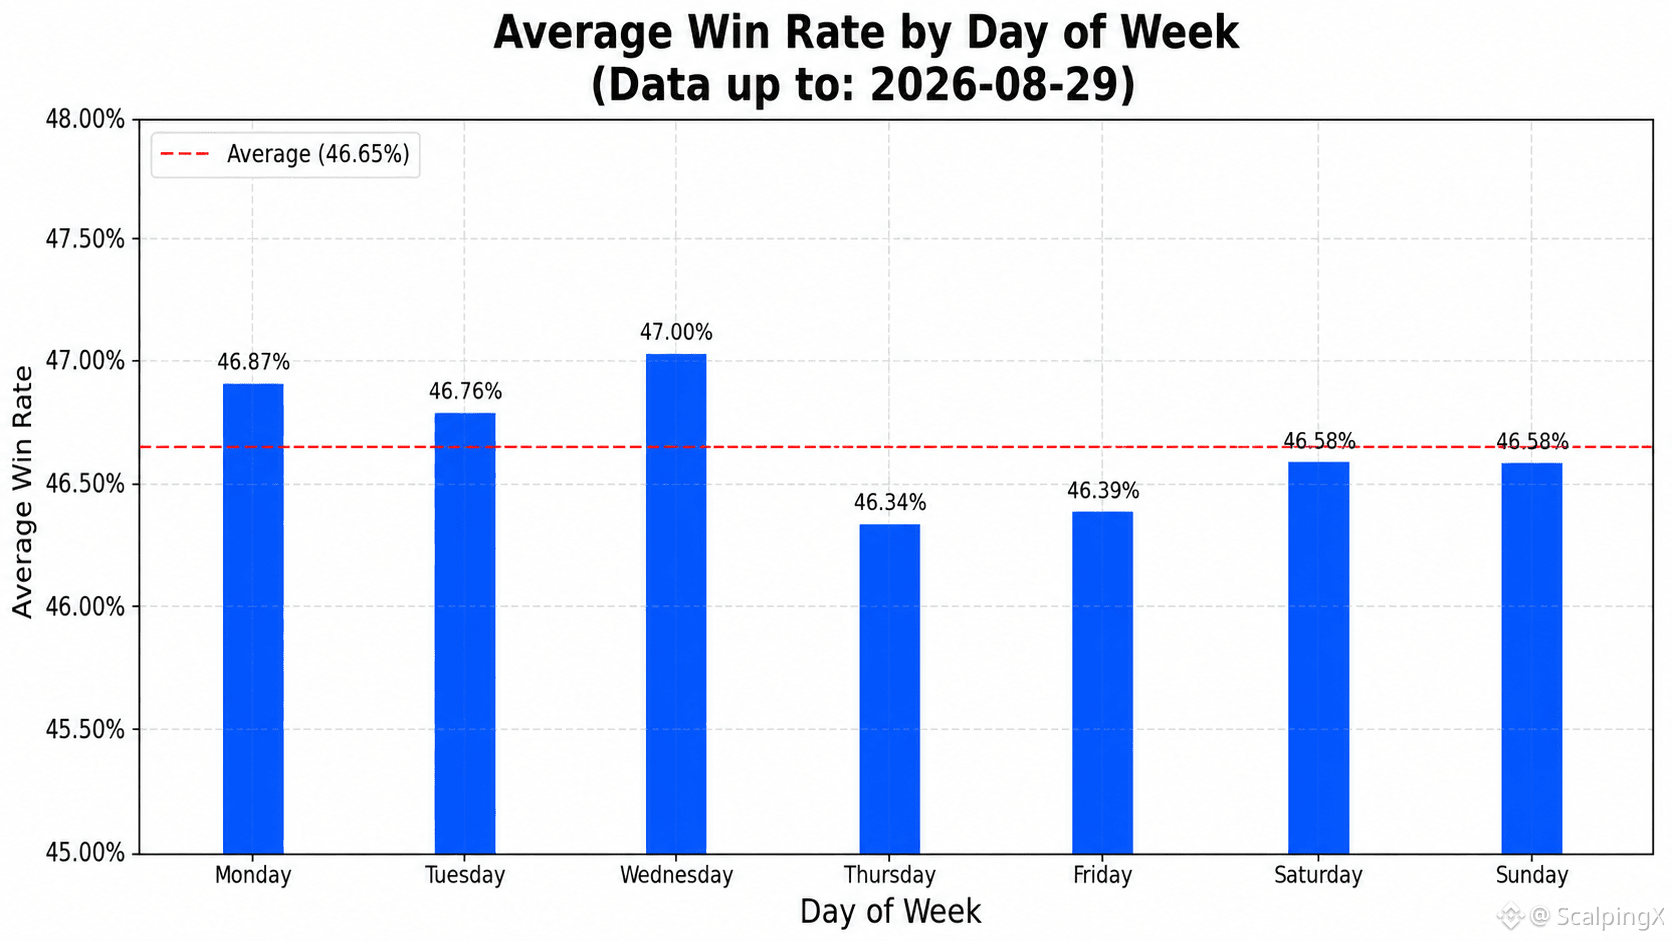
📊 The average win rate is 46.65%
🏆 The highest daily win rate was recorded on 2026-04-01 at 78.08%. The lowest was recorded on 2026-01-25 at 15.69%
📅 Wednesday has the highest average win rate at 47.00%. Thursday has the lowest average win rate at 46.34%
⏱️ The strongest 7-day period ended on 2026-04-05 with an average win rate of 63.27%. The weakest 7-day period ended on 2026-06-24 with an average win rate of 35.60%
⚖️ The number of days with a win rate above the overall average is 368. The number of days with a win rate at or below the overall average is 420
📈 The number of days with a win rate above 50% is 221. The number of days with a win rate between 40% and 50% is 422. The number of days with a win rate below 40% is 145
#TradingStats $BTC $ETH $SOL
Updated 2026-08-29, based on community-wide trading
📊 The average win rate is 46.65%
🏆 The highest daily win rate was recorded on 2026-04-01 at 78.08%. The lowest was recorded on 2026-01-25 at 15.69%
📅 Wednesday has the highest average win rate at 47.00%. Thursday has the lowest average win rate at 46.34%
⏱️ The strongest 7-day period ended on 2026-04-05 with an average win rate of 63.27%. The weakest 7-day period ended on 2026-06-24 with an average win rate of 35.60%
⚖️ The number of days with a win rate above the overall average is 368. The number of days with a win rate at or below the overall average is 420
📈 The number of days with a win rate above 50% is 221. The number of days with a win rate between 40% and 50% is 422. The number of days with a win rate below 40% is 145
#TradingStats $BTC $ETH $SOL
📊 The average win rate is 46.65%
🏆 The highest daily win rate was recorded on 2026-04-01 at 78.08%. The lowest was recorded on 2026-01-25 at 15.69%
📅 Wednesday has the highest average win rate at 47.00%. Thursday has the lowest average win rate at 46.34%
⏱️ The strongest 7-day period ended on 2026-04-05 with an average win rate of 63.27%. The weakest 7-day period ended on 2026-06-24 with an average win rate of 35.60%
⚖️ The number of days with a win rate above the overall average is 368. The number of days with a win rate at or below the overall average is 420
📈 The number of days with a win rate above 50% is 221. The number of days with a win rate between 40% and 50% is 422. The number of days with a win rate below 40% is 145
#TradingStats $BTC $ETH $SOL
1
97
·
--
Рост
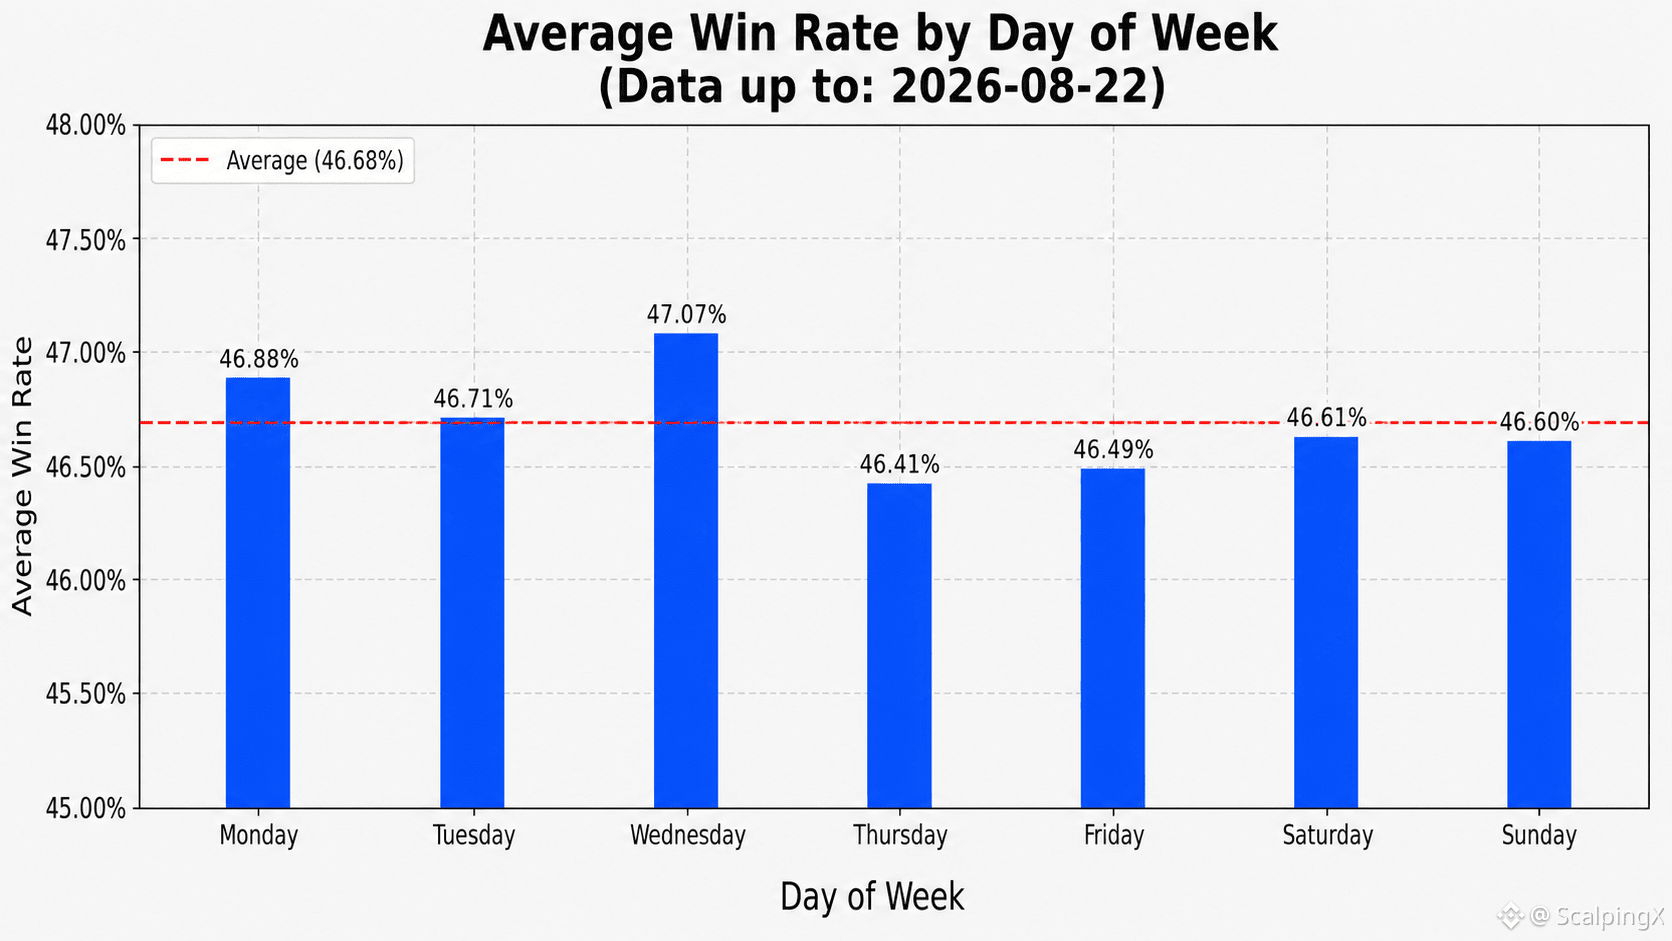
Updated 2026-08-22, community-wide trading
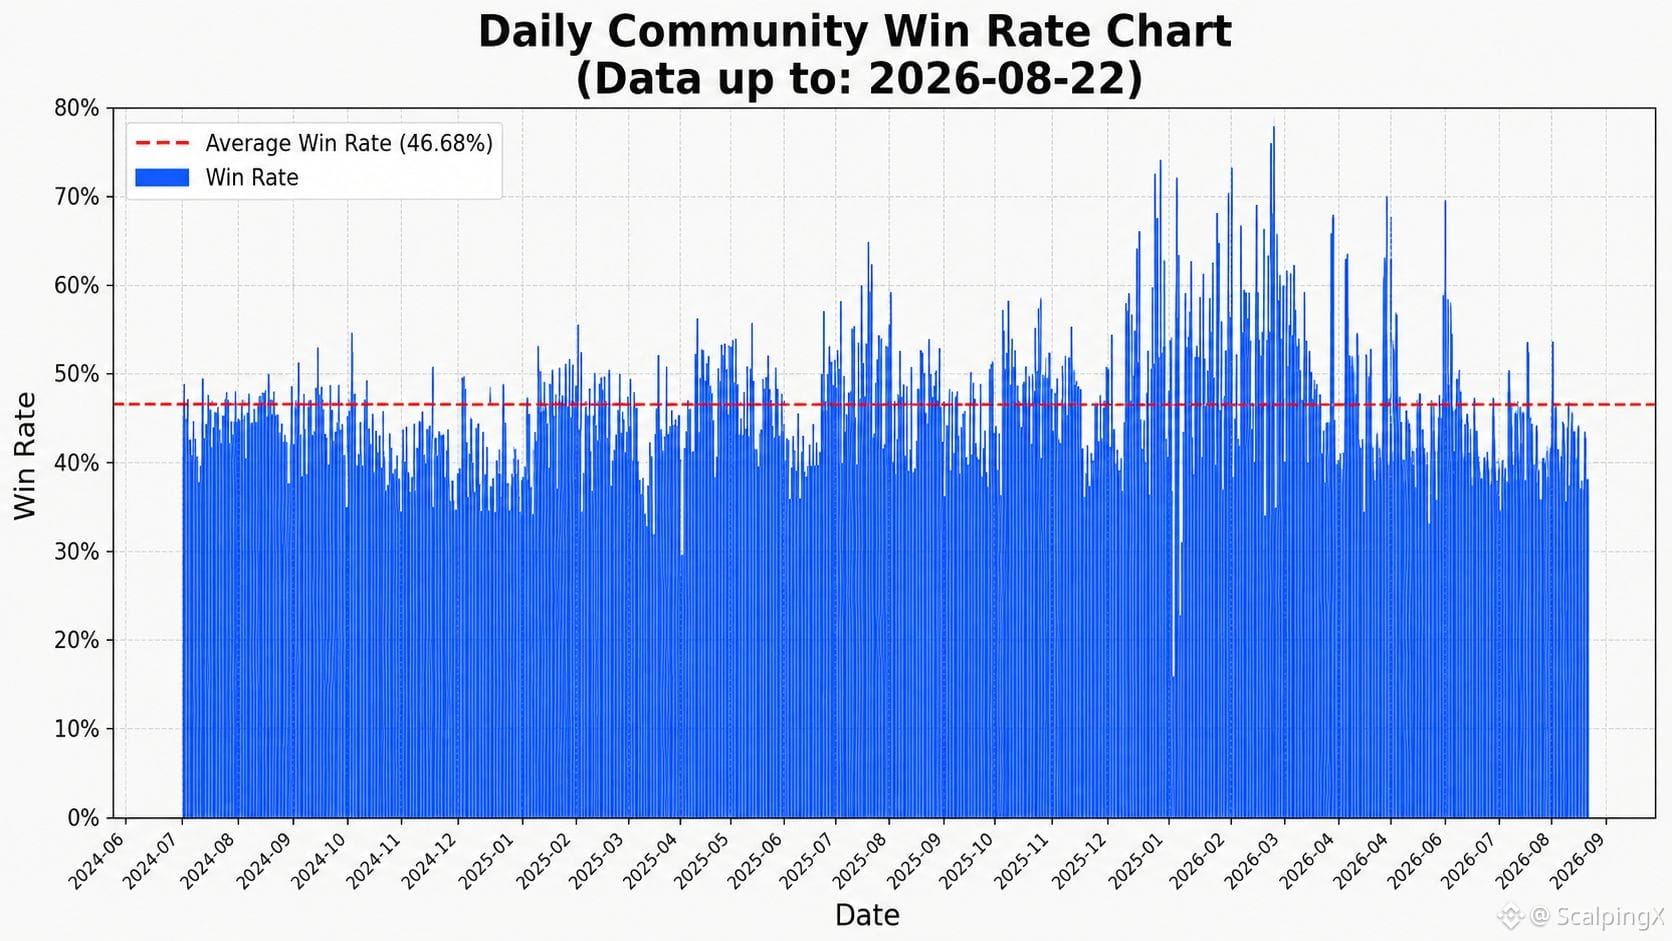
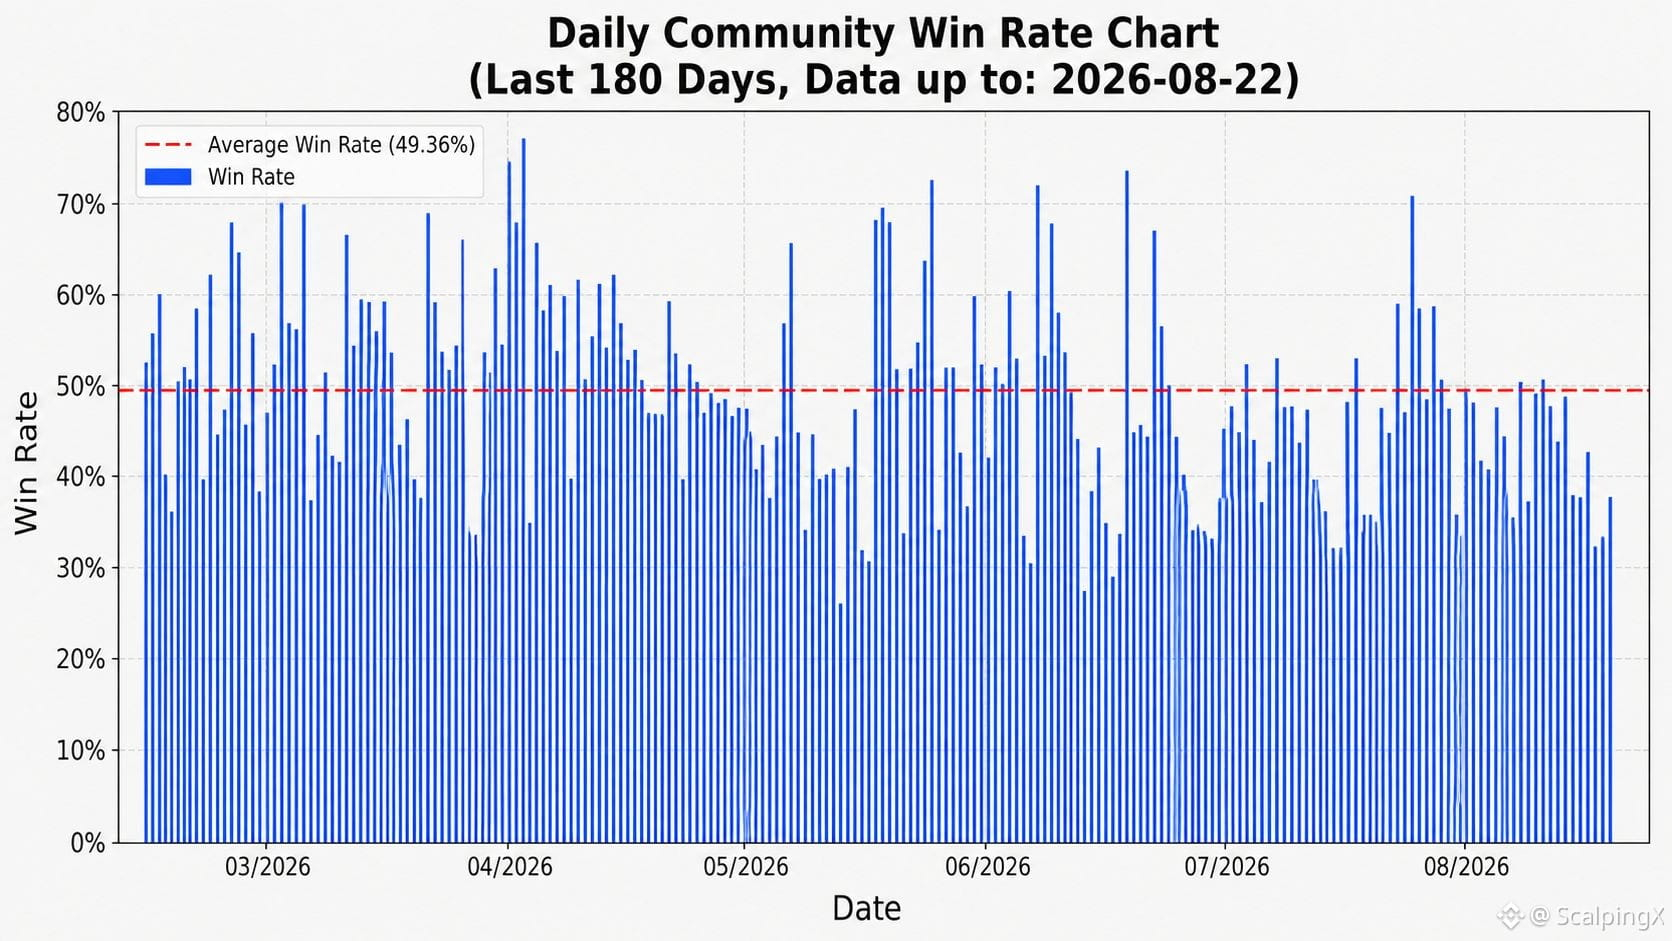
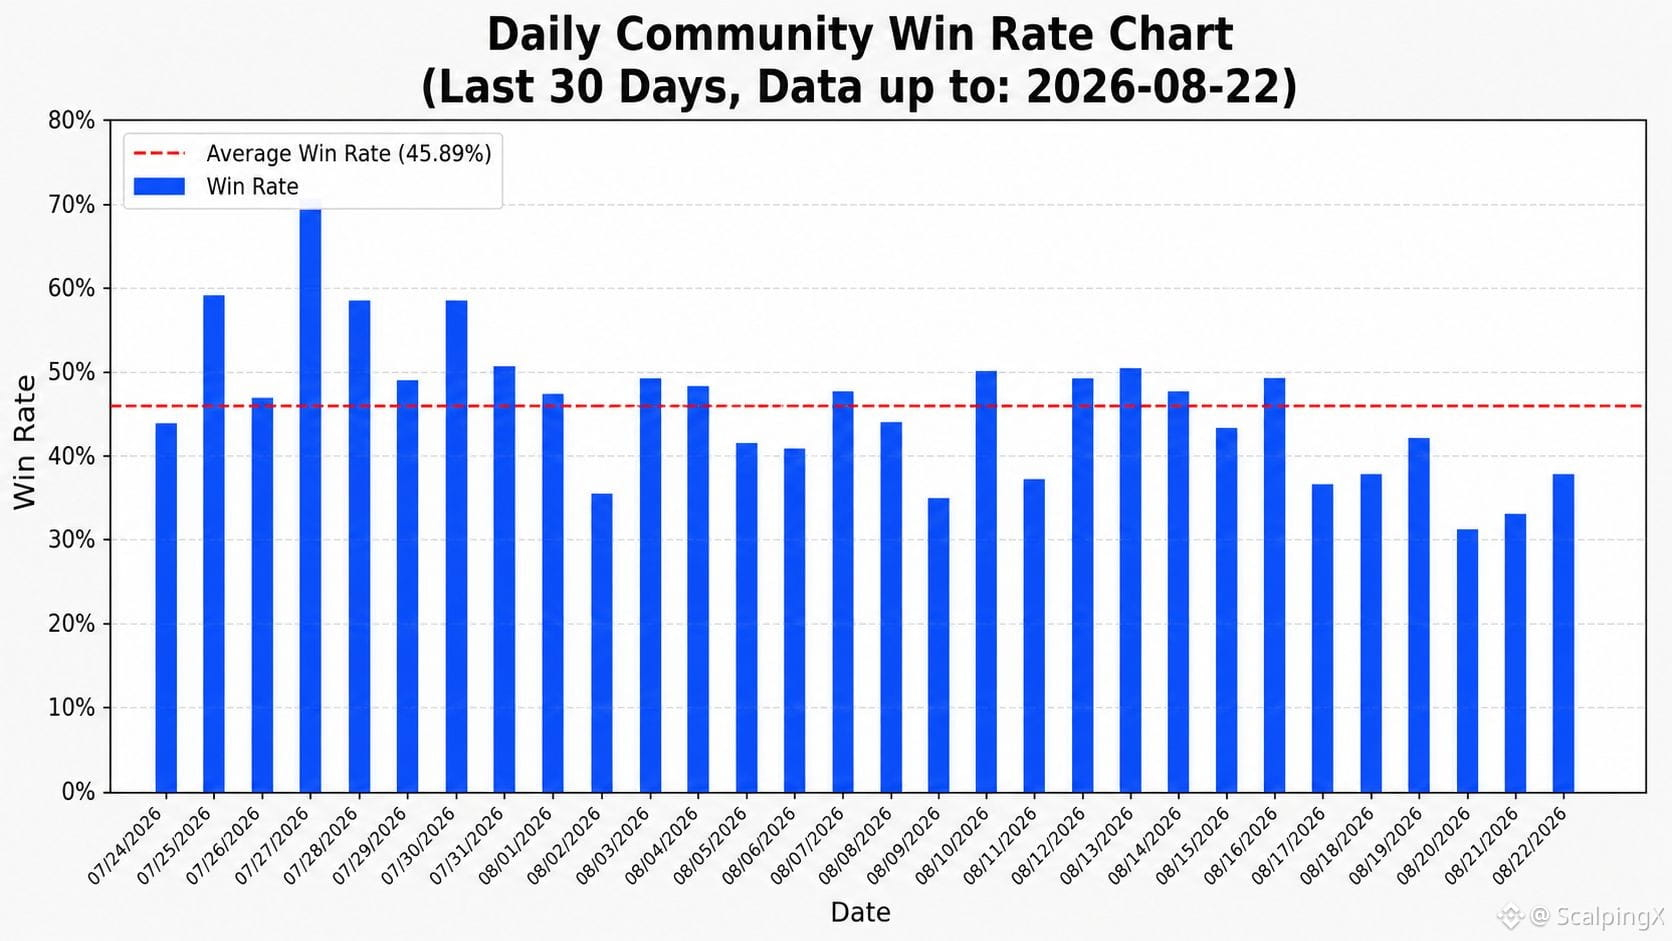
📊 The average win rate is 46.68%
🏆 The highest daily win rate was 78.08% on 2026-04-01. The lowest daily win rate was 15.69% on 2026-01-25
📅 Wednesday has the highest average win rate at 47.07%. Thursday has the lowest average win rate at 46.41%
⏱️ The best 7-day period ended on 2026-04-05 with an average win rate of 63.27%. The weakest 7-day period ended on 2026-06-24 with 35.60%
⚖️ There were 366 days with a win rate above the overall average, while 415 days were at or below the average
📈 There were 220 days with a win rate above 50%, 419 days between 40% and 50%, and 142 days below 40%
#TradingStats $METAB $POL $MOVR
Updated 2026-08-22, community-wide trading
📊 The average win rate is 46.68%
🏆 The highest daily win rate was 78.08% on 2026-04-01. The lowest daily win rate was 15.69% on 2026-01-25
📅 Wednesday has the highest average win rate at 47.07%. Thursday has the lowest average win rate at 46.41%
⏱️ The best 7-day period ended on 2026-04-05 with an average win rate of 63.27%. The weakest 7-day period ended on 2026-06-24 with 35.60%
⚖️ There were 366 days with a win rate above the overall average, while 415 days were at or below the average
📈 There were 220 days with a win rate above 50%, 419 days between 40% and 50%, and 142 days below 40%
#TradingStats $METAB $POL $MOVR
📊 The average win rate is 46.68%
🏆 The highest daily win rate was 78.08% on 2026-04-01. The lowest daily win rate was 15.69% on 2026-01-25
📅 Wednesday has the highest average win rate at 47.07%. Thursday has the lowest average win rate at 46.41%
⏱️ The best 7-day period ended on 2026-04-05 with an average win rate of 63.27%. The weakest 7-day period ended on 2026-06-24 with 35.60%
⚖️ There were 366 days with a win rate above the overall average, while 415 days were at or below the average
📈 There were 220 days with a win rate above 50%, 419 days between 40% and 50%, and 142 days below 40%
#TradingStats $METAB $POL $MOVR
287
·
--
Рост
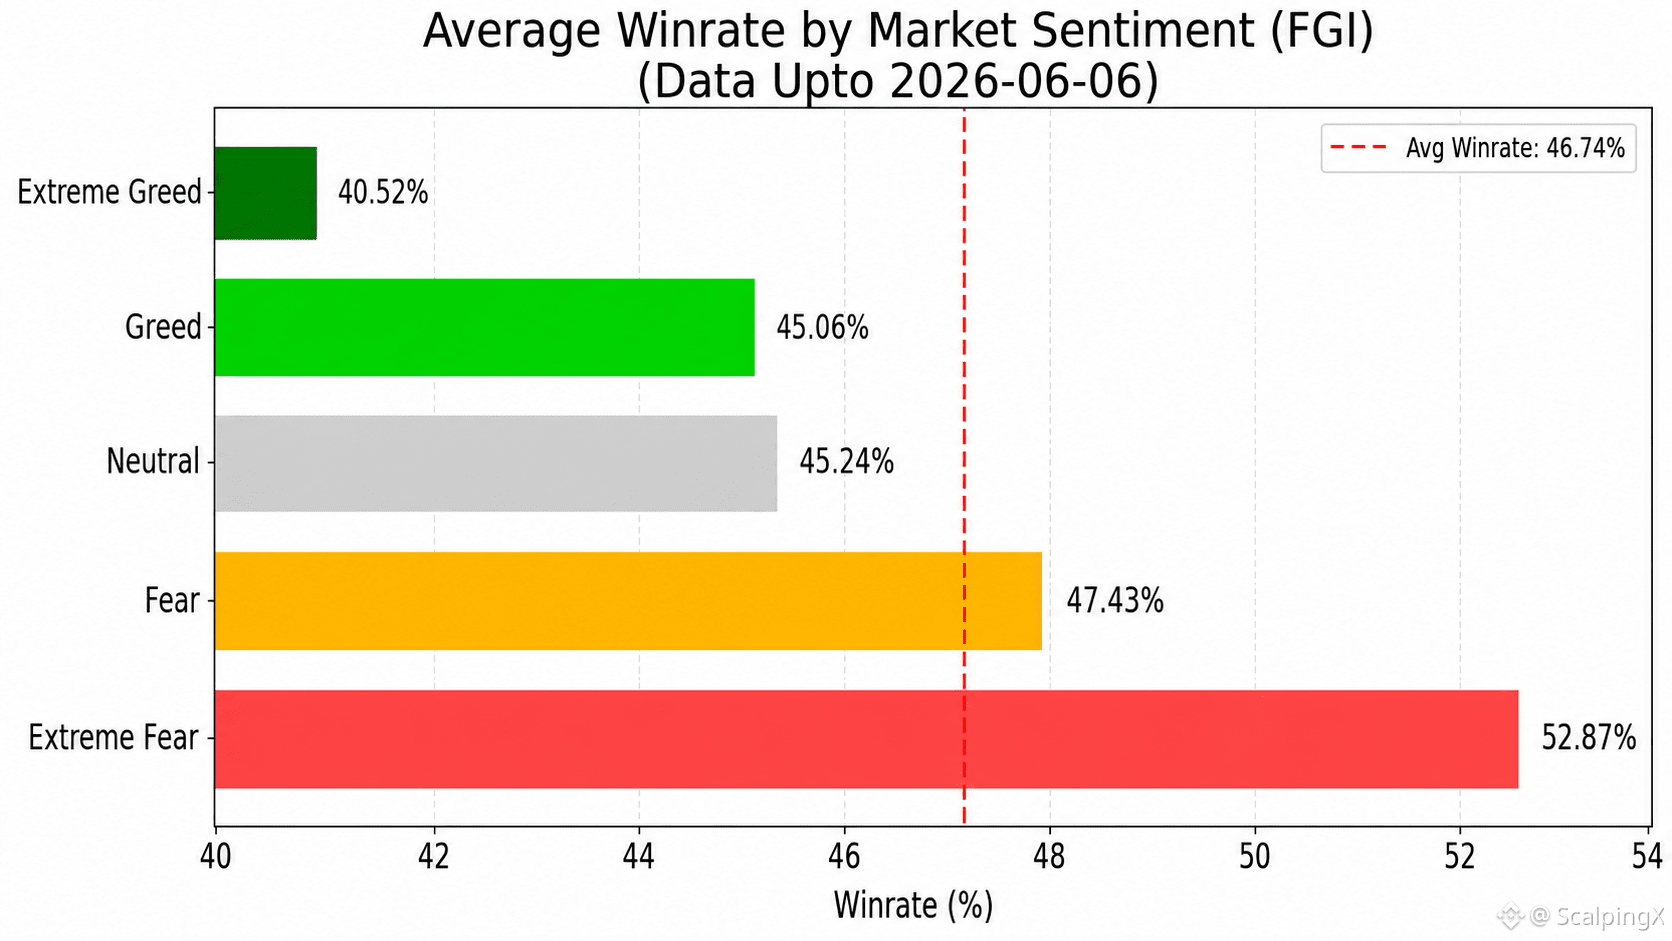
📊 TRADING PERFORMANCE & FEAR AND GREED INDEX (FGI) REPORT – UPDATED 06/06/2026
The latest statistical data shows that the correlation between FGI and Winrate remains low and continues to lean negative (r ~ -0.315). This further supports the view that FGI is not suitable as a tool for predicting price direction or identifying trade entries, but it still has practical value in measuring order risk. Overall, trading performance tends to weaken when market sentiment enters an extreme euphoric phase, so FGI is more useful as an early risk-warning signal rather than a signal for expanding profit expectations.
Below is a summary of Winrate (WR), minimum breakeven R:R, and the number of recorded days (n) across each sentiment zone:
🤑 Extreme Greed (≥80): WR 40.5% • R:R=1:1.47 • n=25
🤤 Greed (60–80): WR 45.1% • R:R=1:1.22 • n=215
😐 Neutral (40–60): WR 45.2% • R:R=1:1.21 • n=150
😨 Fear (20–40): WR 47.4% • R:R=1:1.11 • n=218
😱 Extreme Fear (<20): WR 52.9% • R:R=1:0.89 • n=96
Percentage of days with performance above the average level (46.74%) by sentiment zone:
🤑 Extreme Greed: 8.0%
🤤 Greed: 36.3%
😐 Neutral: 38.0%
😨 Fear: 54.1%
😱 Extreme Fear: 70.8%
➤ Scalpers can use FGI as a guide to adjust expected profit targets when entering trades:
📈 When FGI is high, traders need to raise their expected profit target to maintain a strong enough R:R, helping offset the risk of a lower win rate.
📉 When FGI is low, traders can reduce their expected profit target to increase capital turnover speed and make profit realization easier.
#TradingStats #MarketSentiment $BTC $ETH $TON
📊 TRADING PERFORMANCE & FEAR AND GREED INDEX (FGI) REPORT – UPDATED 06/06/2026
The latest statistical data shows that the correlation between FGI and Winrate remains low and continues to lean negative (r ~ -0.315). This further supports the view that FGI is not suitable as a tool for predicting price direction or identifying trade entries, but it still has practical value in measuring order risk. Overall, trading performance tends to weaken when market sentiment enters an extreme euphoric phase, so FGI is more useful as an early risk-warning signal rather than a signal for expanding profit expectations.
Below is a summary of Winrate (WR), minimum breakeven R:R, and the number of recorded days (n) across each sentiment zone:
🤑 Extreme Greed (≥80): WR 40.5% • R:R=1:1.47 • n=25
🤤 Greed (60–80): WR 45.1% • R:R=1:1.22 • n=215
😐 Neutral (40–60): WR 45.2% • R:R=1:1.21 • n=150
😨 Fear (20–40): WR 47.4% • R:R=1:1.11 • n=218
😱 Extreme Fear (<20): WR 52.9% • R:R=1:0.89 • n=96
Percentage of days with performance above the average level (46.74%) by sentiment zone:
🤑 Extreme Greed: 8.0%
🤤 Greed: 36.3%
😐 Neutral: 38.0%
😨 Fear: 54.1%
😱 Extreme Fear: 70.8%
➤ Scalpers can use FGI as a guide to adjust expected profit targets when entering trades:
📈 When FGI is high, traders need to raise their expected profit target to maintain a strong enough R:R, helping offset the risk of a lower win rate.
📉 When FGI is low, traders can reduce their expected profit target to increase capital turnover speed and make profit realization easier.
#TradingStats #MarketSentiment $BTC $ETH $TON
The latest statistical data shows that the correlation between FGI and Winrate remains low and continues to lean negative (r ~ -0.315). This further supports the view that FGI is not suitable as a tool for predicting price direction or identifying trade entries, but it still has practical value in measuring order risk. Overall, trading performance tends to weaken when market sentiment enters an extreme euphoric phase, so FGI is more useful as an early risk-warning signal rather than a signal for expanding profit expectations.
Below is a summary of Winrate (WR), minimum breakeven R:R, and the number of recorded days (n) across each sentiment zone:
🤑 Extreme Greed (≥80): WR 40.5% • R:R=1:1.47 • n=25
🤤 Greed (60–80): WR 45.1% • R:R=1:1.22 • n=215
😐 Neutral (40–60): WR 45.2% • R:R=1:1.21 • n=150
😨 Fear (20–40): WR 47.4% • R:R=1:1.11 • n=218
😱 Extreme Fear (<20): WR 52.9% • R:R=1:0.89 • n=96
Percentage of days with performance above the average level (46.74%) by sentiment zone:
🤑 Extreme Greed: 8.0%
🤤 Greed: 36.3%
😐 Neutral: 38.0%
😨 Fear: 54.1%
😱 Extreme Fear: 70.8%
➤ Scalpers can use FGI as a guide to adjust expected profit targets when entering trades:
📈 When FGI is high, traders need to raise their expected profit target to maintain a strong enough R:R, helping offset the risk of a lower win rate.
📉 When FGI is low, traders can reduce their expected profit target to increase capital turnover speed and make profit realization easier.
#TradingStats #MarketSentiment $BTC $ETH $TON
209

·
--
$MEME 63% OF TRADERS ARE LOSING MONEY — HERE IS THE REAL DATA 📊
63% of traders on the top 50 meme tokens are underwater, while only 37% hold profitable positions. Among 164,538 traders, just 46 people made over $1 million — but 5 lost more than $10 million each. The distribution is brutally asymmetric.
This is not a market of equal opportunity. The numbers confirm what structure traders already know: chasing hype without a liquidity-based edge leads to consistent capital destruction. The data speaks for itself.
What is the one metric you check before entering a meme token?
Not financial advice. Always manage your risk.
#MEME #TradingStats #MarketAnalysis #Crypto
⚡
$MEME 63% OF TRADERS ARE LOSING MONEY — HERE IS THE REAL DATA 📊
63% of traders on the top 50 meme tokens are underwater, while only 37% hold profitable positions. Among 164,538 traders, just 46 people made over $1 million — but 5 lost more than $10 million each. The distribution is brutally asymmetric.
This is not a market of equal opportunity. The numbers confirm what structure traders already know: chasing hype without a liquidity-based edge leads to consistent capital destruction. The data speaks for itself.
What is the one metric you check before entering a meme token?
Not financial advice. Always manage your risk.
#MEME #TradingStats #MarketAnalysis #Crypto
⚡
63% of traders on the top 50 meme tokens are underwater, while only 37% hold profitable positions. Among 164,538 traders, just 46 people made over $1 million — but 5 lost more than $10 million each. The distribution is brutally asymmetric.
This is not a market of equal opportunity. The numbers confirm what structure traders already know: chasing hype without a liquidity-based edge leads to consistent capital destruction. The data speaks for itself.
What is the one metric you check before entering a meme token?
Not financial advice. Always manage your risk.
#MEME #TradingStats #MarketAnalysis #Crypto
⚡
56
·
--
Рост
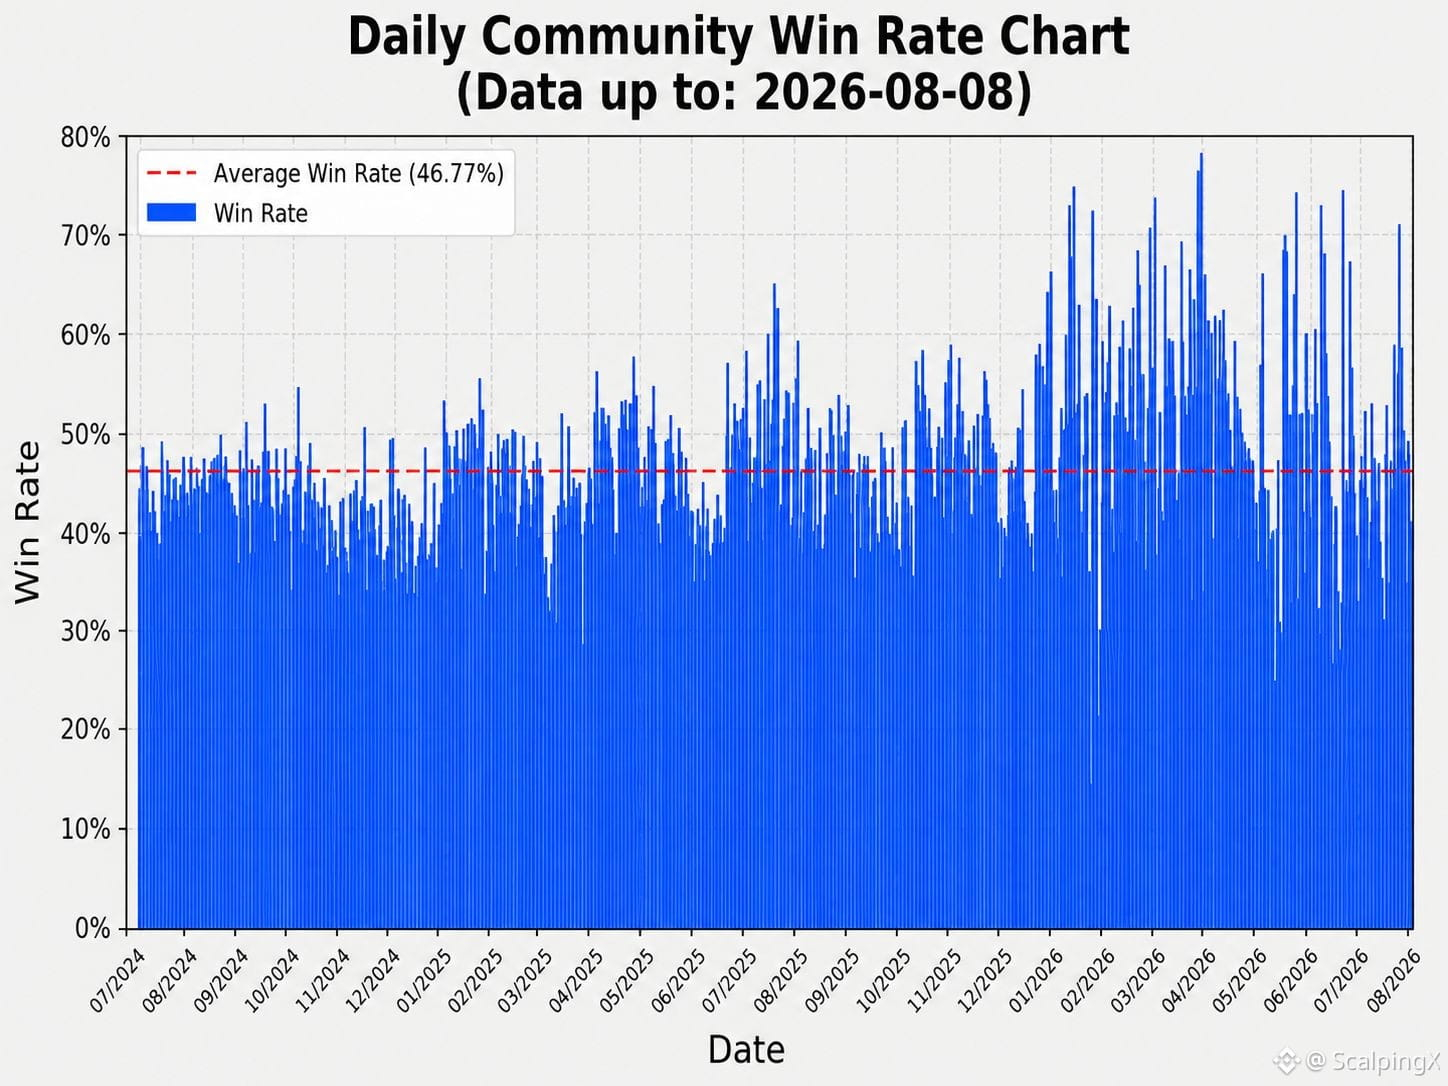
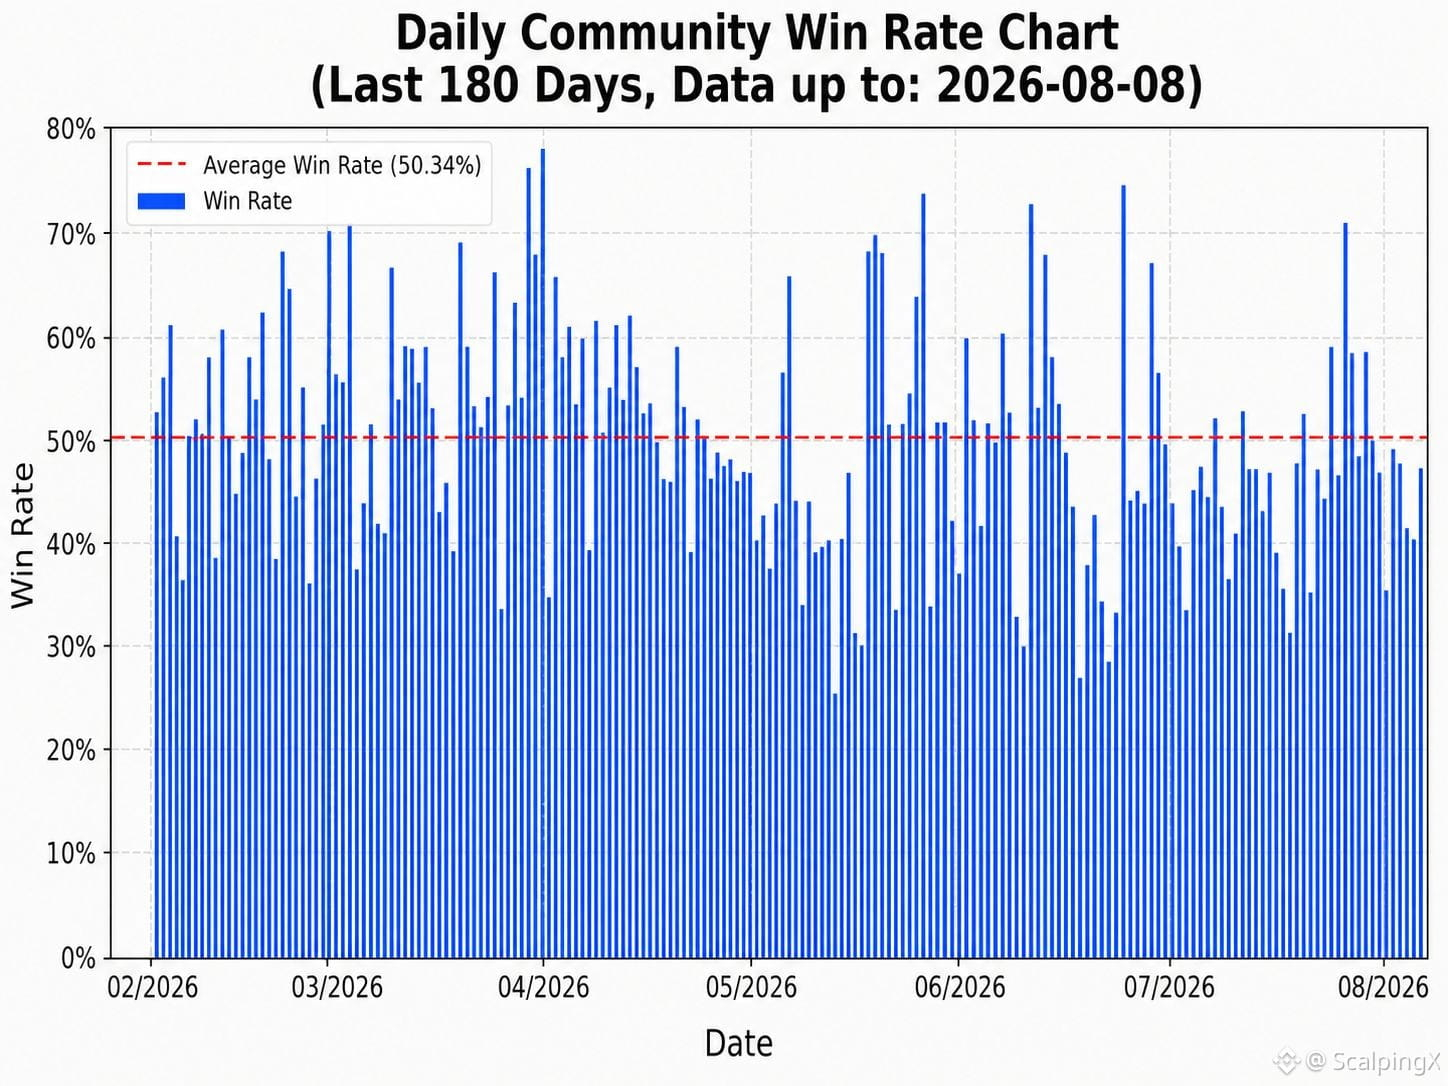
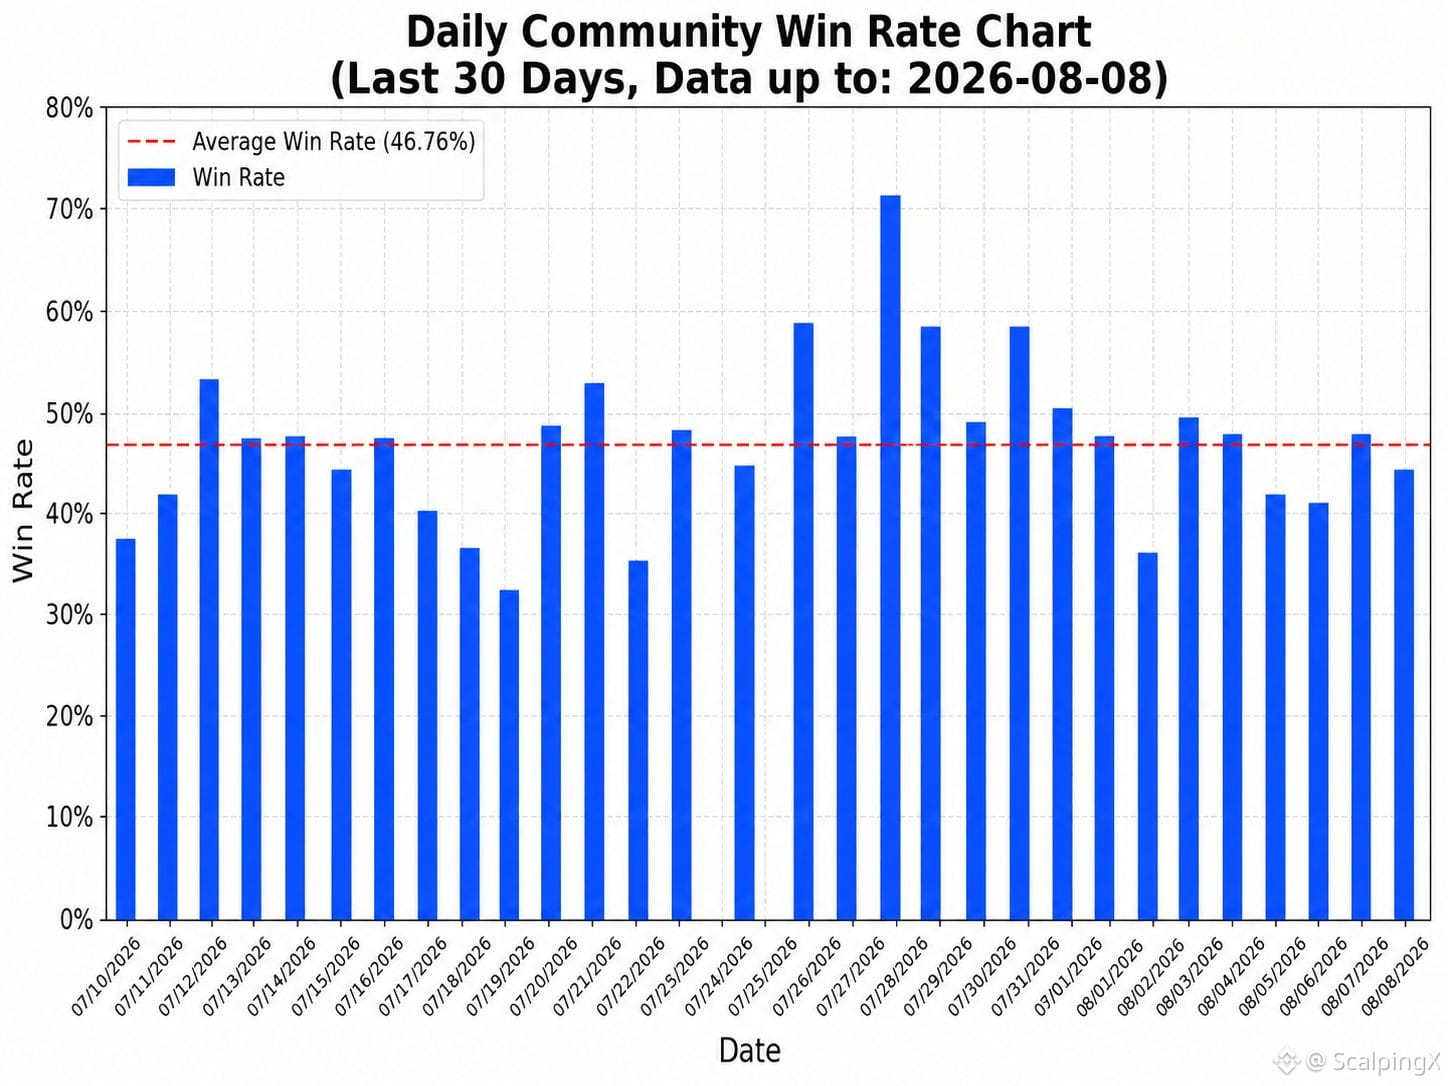
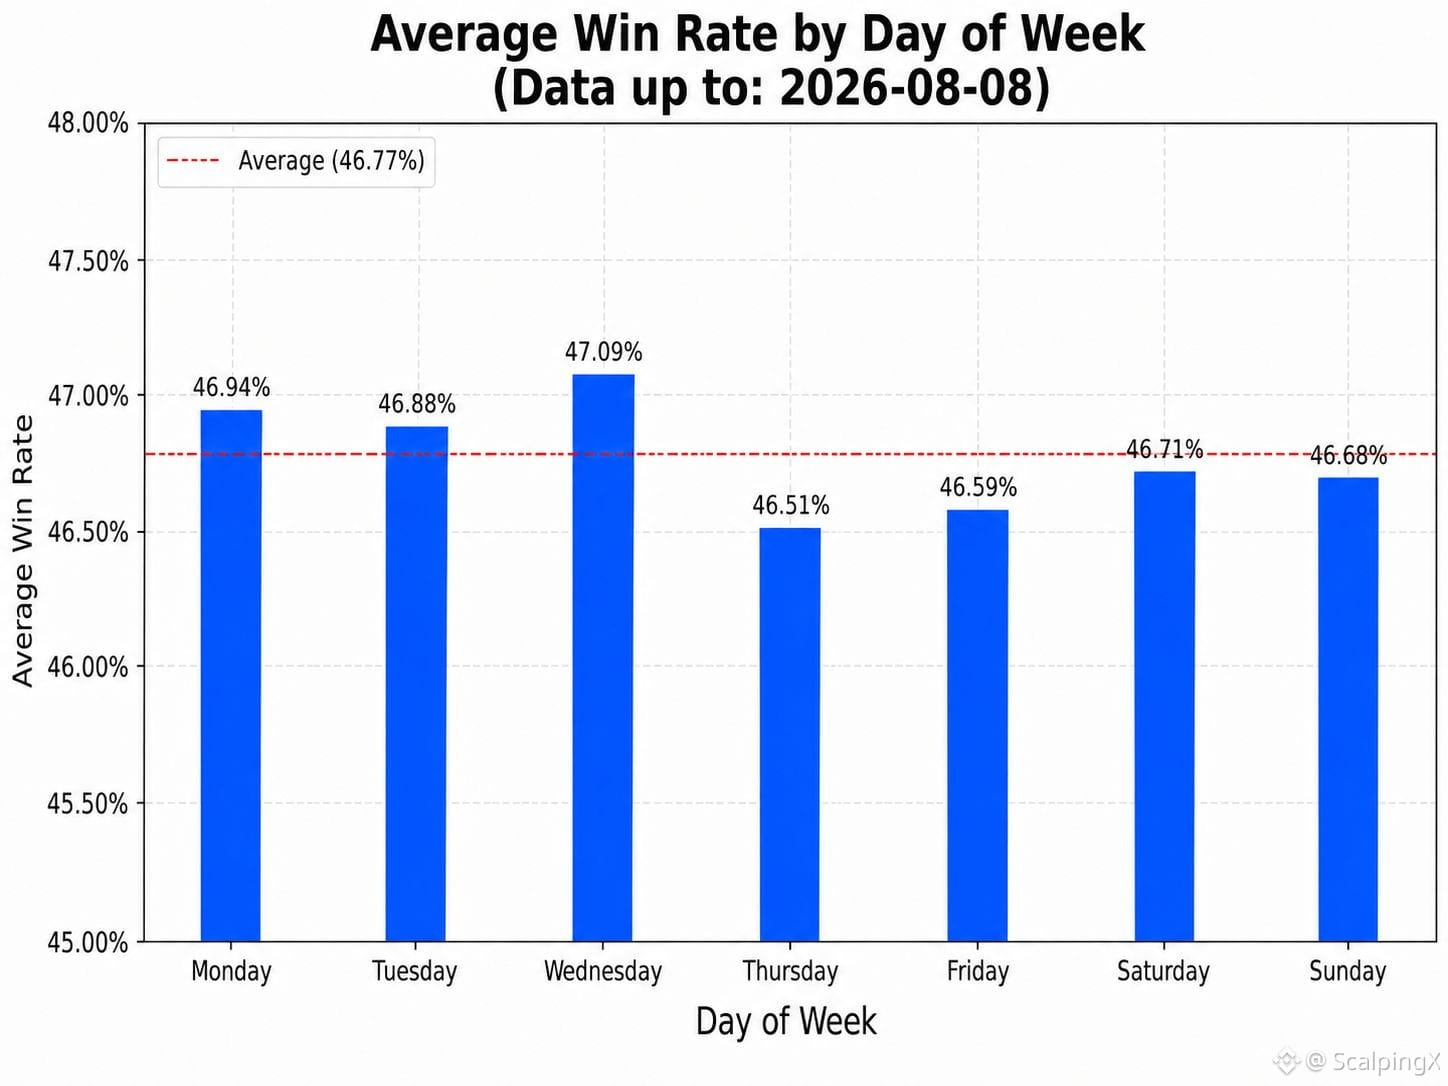
Updated 2026-08-08, community-wide trading
📊 The average win rate is 46.77%
🏆 The highest daily win rate was 78.08% on 2026-04-01. The lowest daily win rate was 15.69% on 2026-01-25
📅 The day of the week with the highest average win rate is Wednesday at 47.09%. The lowest is Thursday at 46.51%
⏱️ The best 7-day period ended on 2026-04-05, with an average win rate of 63.27%. The worst 7-day period ended on 2026-06-24, with 35.60%
⚖️ There were 355 days with a win rate above the overall average and 412 days with a win rate at or below the average
📈 There were 218 days with a win rate above 50%, 414 days between 40%–50%, and 135 days below 40%
#TradingStats $BNB $NVDAB $AAPLB
Updated 2026-08-08, community-wide trading
📊 The average win rate is 46.77%
🏆 The highest daily win rate was 78.08% on 2026-04-01. The lowest daily win rate was 15.69% on 2026-01-25
📅 The day of the week with the highest average win rate is Wednesday at 47.09%. The lowest is Thursday at 46.51%
⏱️ The best 7-day period ended on 2026-04-05, with an average win rate of 63.27%. The worst 7-day period ended on 2026-06-24, with 35.60%
⚖️ There were 355 days with a win rate above the overall average and 412 days with a win rate at or below the average
📈 There were 218 days with a win rate above 50%, 414 days between 40%–50%, and 135 days below 40%
#TradingStats $BNB $NVDAB $AAPLB
📊 The average win rate is 46.77%
🏆 The highest daily win rate was 78.08% on 2026-04-01. The lowest daily win rate was 15.69% on 2026-01-25
📅 The day of the week with the highest average win rate is Wednesday at 47.09%. The lowest is Thursday at 46.51%
⏱️ The best 7-day period ended on 2026-04-05, with an average win rate of 63.27%. The worst 7-day period ended on 2026-06-24, with 35.60%
⚖️ There were 355 days with a win rate above the overall average and 412 days with a win rate at or below the average
📈 There were 218 days with a win rate above 50%, 414 days between 40%–50%, and 135 days below 40%
#TradingStats $BNB $NVDAB $AAPLB
63
·
--
Рост
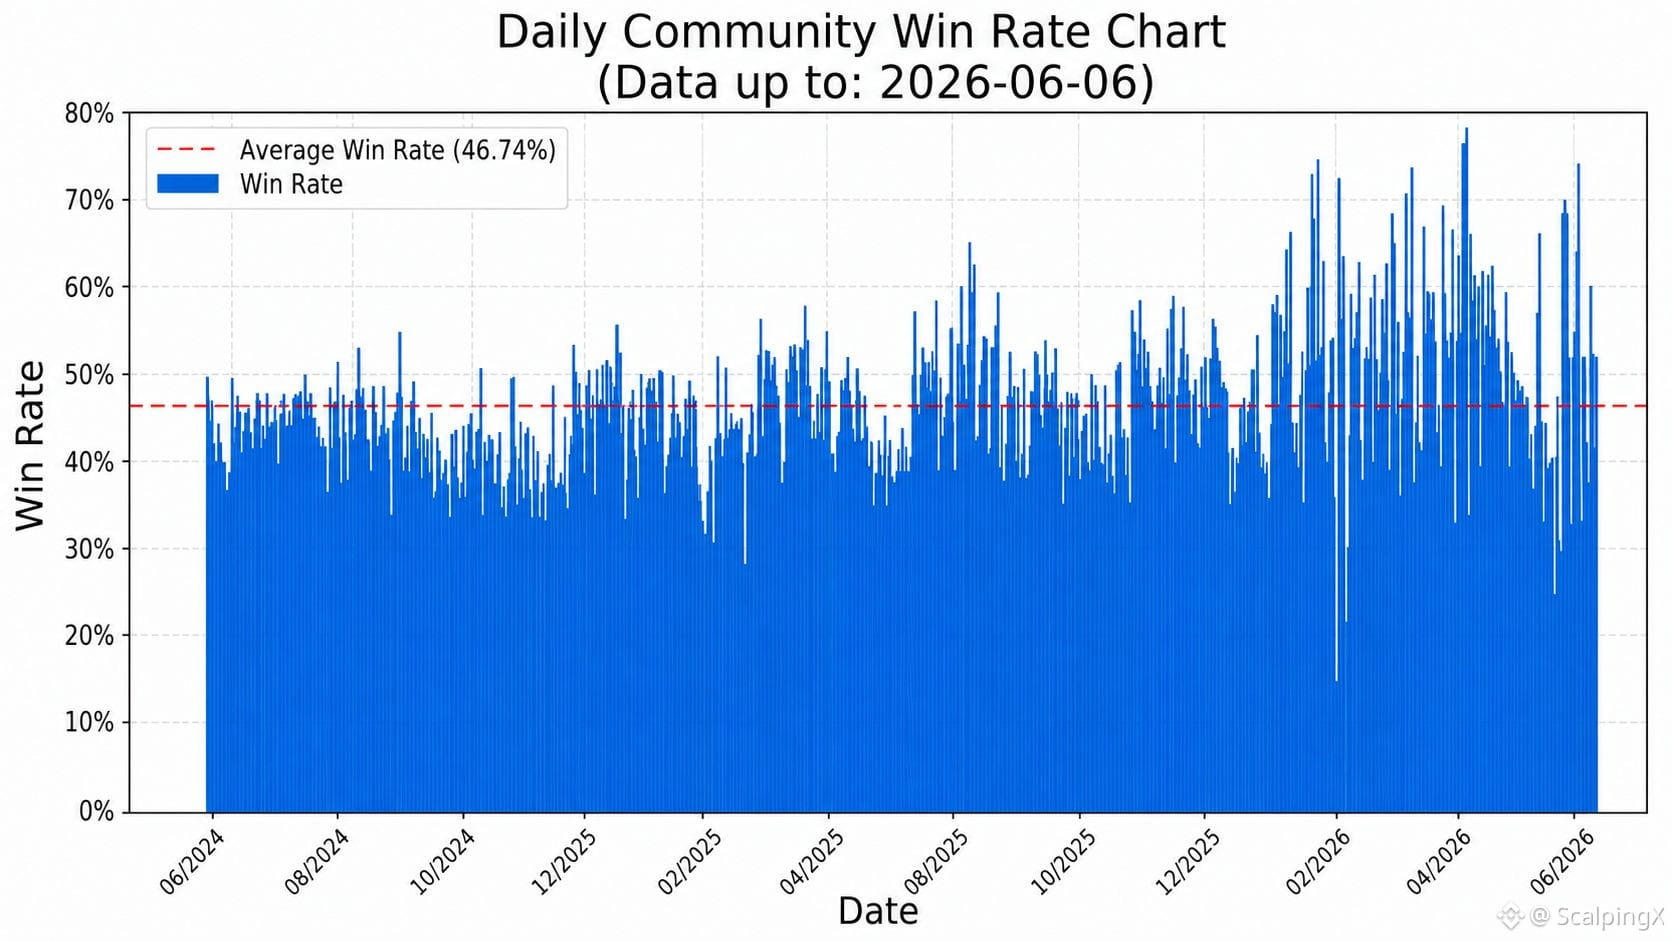
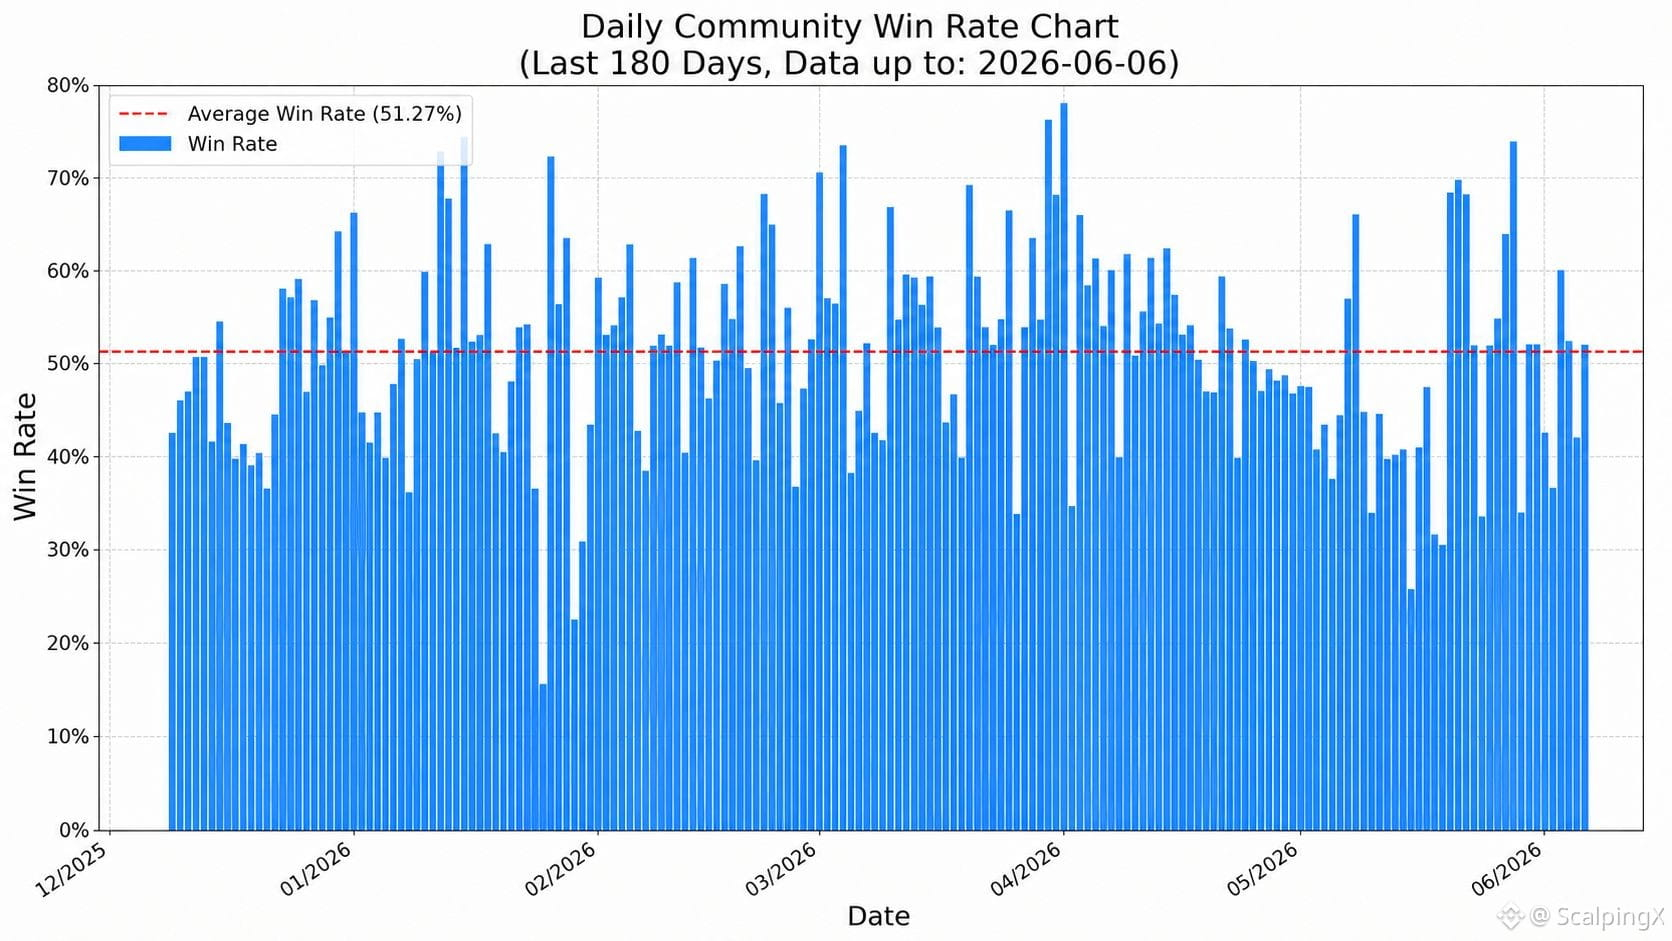
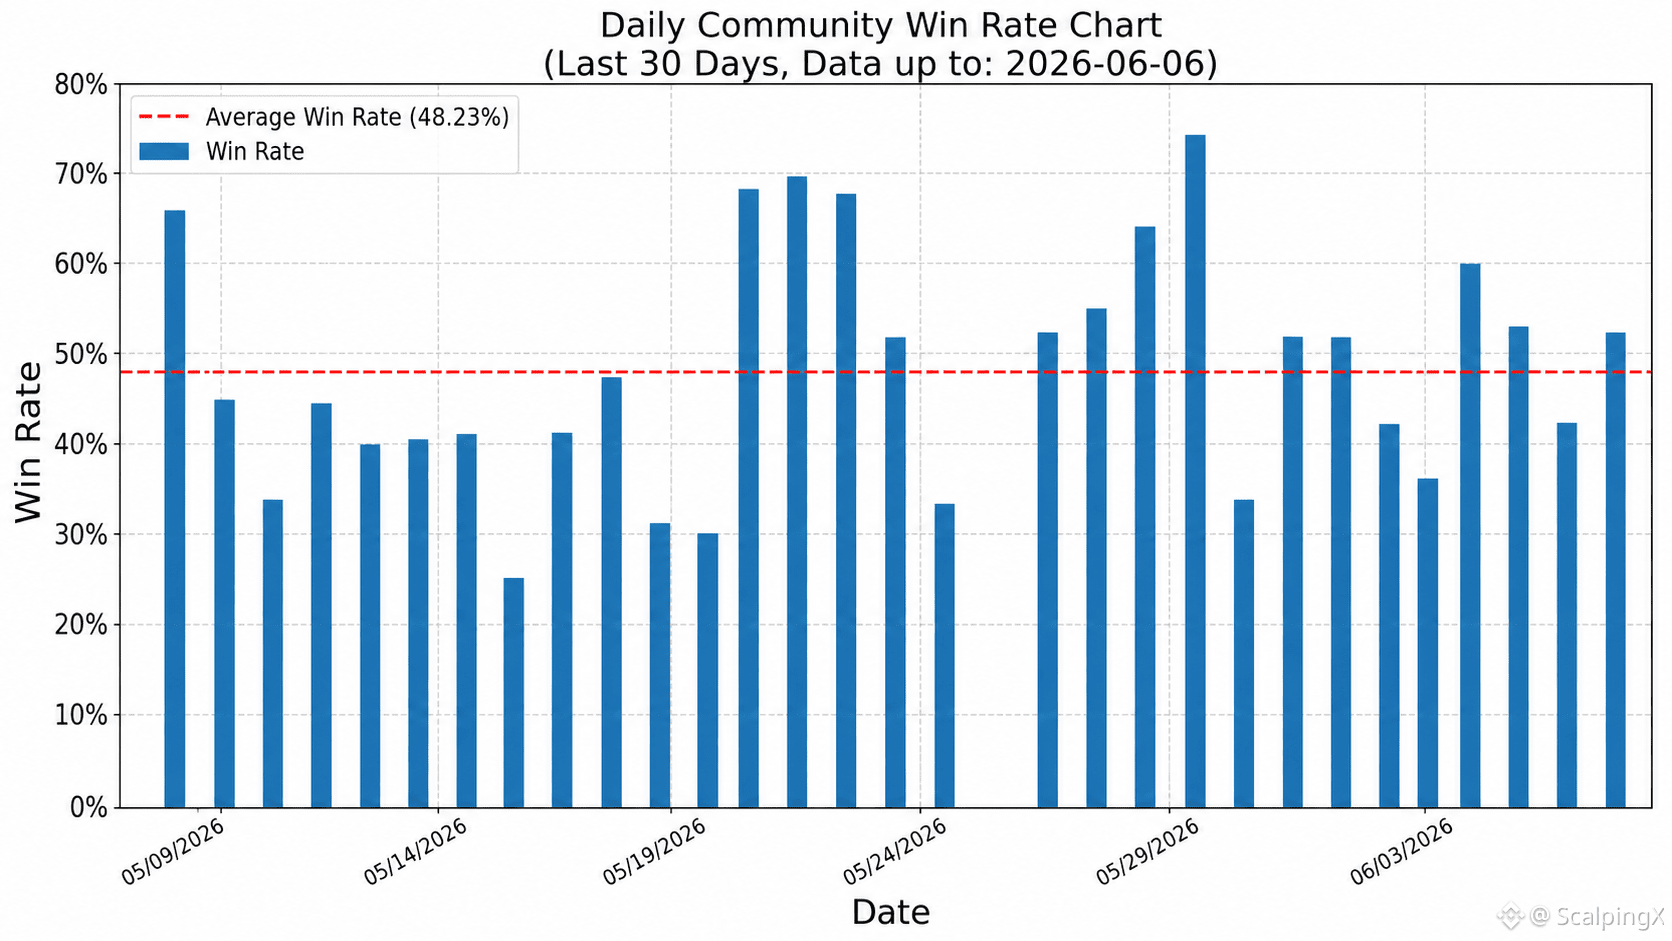
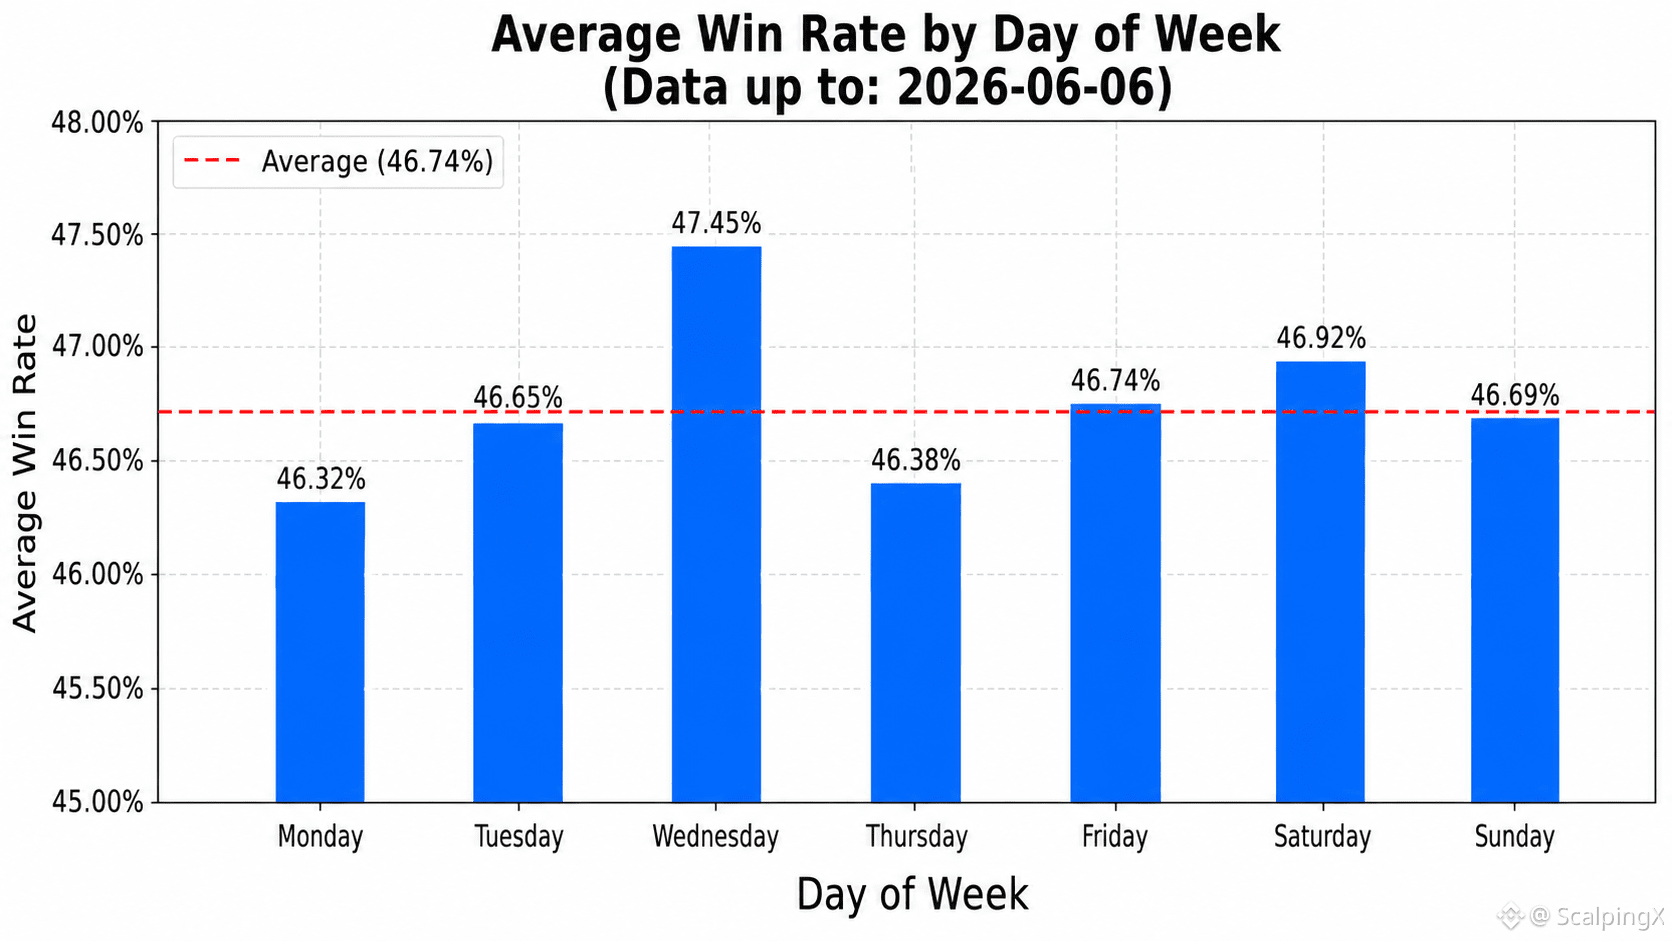
Updated as of 2026-06-06, community-wide trading
📊 The average win rate is 46.74%
🏆 The highest win-rate day was 2026-04-01 at 78.08%. The lowest win-rate day was 2026-01-25 at 15.69%
📅 The weekday with the highest average win rate is Wednesday at 47.45%. The weekday with the lowest average win rate is Monday at 46.32%
⏱️ The strongest 7-day period ended on 2026-04-05 with an average win rate of 63.27%. The weakest 7-day period ended on 2025-03-12 with 36.64%
⚖️ The number of days with a win rate above average is 323. The number of days with a win rate equal to or below average is 381
📈 The number of days with a win rate above 50% is 199. The number of days with a win rate from 40% to 50% is 384. The number of days with a win rate below 40% is 121
#TradingStats #CommunityData $BTC $ETH $SOL
Updated as of 2026-06-06, community-wide trading
📊 The average win rate is 46.74%
🏆 The highest win-rate day was 2026-04-01 at 78.08%. The lowest win-rate day was 2026-01-25 at 15.69%
📅 The weekday with the highest average win rate is Wednesday at 47.45%. The weekday with the lowest average win rate is Monday at 46.32%
⏱️ The strongest 7-day period ended on 2026-04-05 with an average win rate of 63.27%. The weakest 7-day period ended on 2025-03-12 with 36.64%
⚖️ The number of days with a win rate above average is 323. The number of days with a win rate equal to or below average is 381
📈 The number of days with a win rate above 50% is 199. The number of days with a win rate from 40% to 50% is 384. The number of days with a win rate below 40% is 121
#TradingStats #CommunityData $BTC $ETH $SOL
📊 The average win rate is 46.74%
🏆 The highest win-rate day was 2026-04-01 at 78.08%. The lowest win-rate day was 2026-01-25 at 15.69%
📅 The weekday with the highest average win rate is Wednesday at 47.45%. The weekday with the lowest average win rate is Monday at 46.32%
⏱️ The strongest 7-day period ended on 2026-04-05 with an average win rate of 63.27%. The weakest 7-day period ended on 2025-03-12 with 36.64%
⚖️ The number of days with a win rate above average is 323. The number of days with a win rate equal to or below average is 381
📈 The number of days with a win rate above 50% is 199. The number of days with a win rate from 40% to 50% is 384. The number of days with a win rate below 40% is 121
#TradingStats #CommunityData $BTC $ETH $SOL
172
·
--
Рост
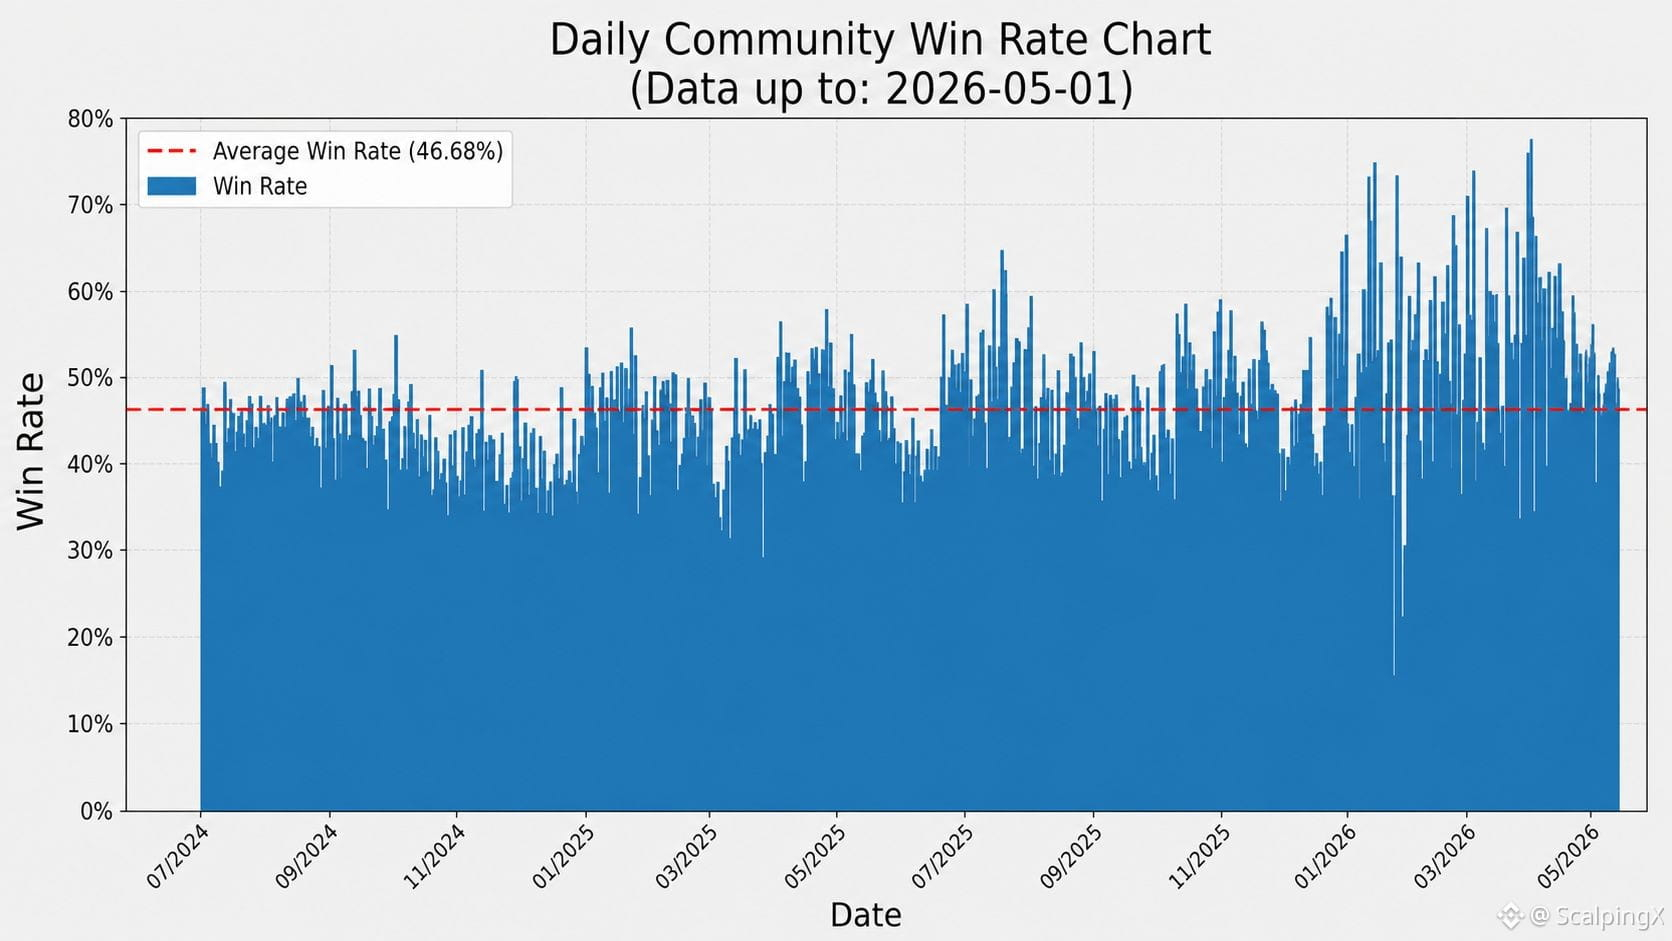
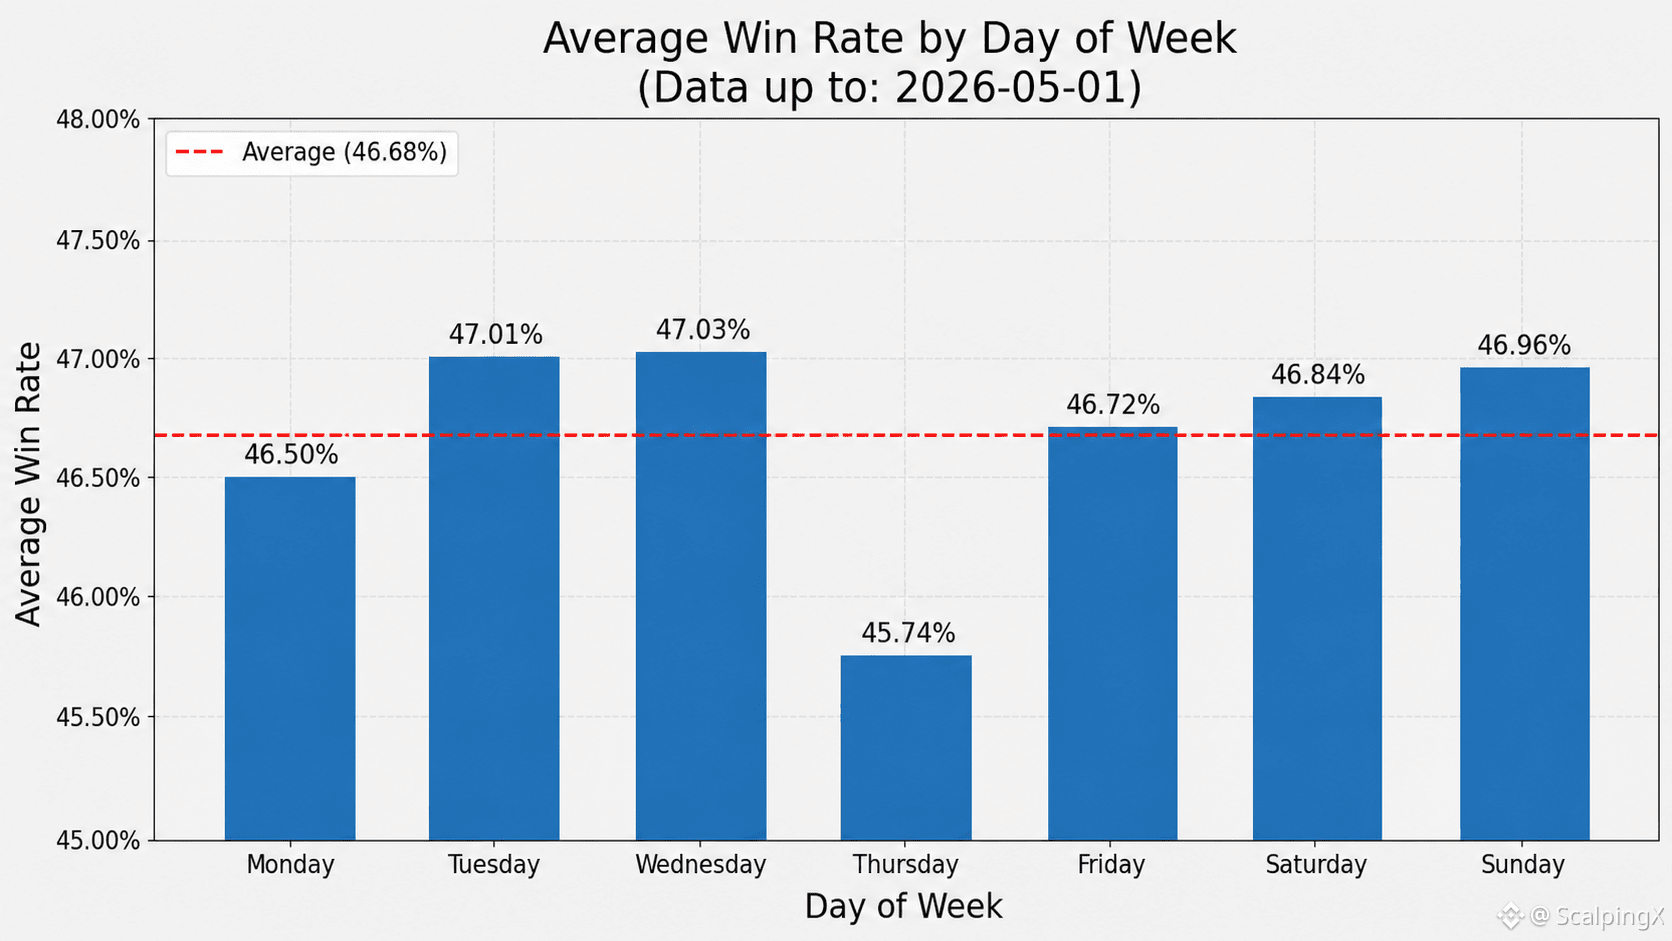
Updated 2026-05-01, community-wide trading data:
📊 The average win rate is 46.68%
🏆 The day with the highest win rate was 2026-04-01 at 78.08%. The day with the lowest win rate was 2026-01-25 at 15.69%
📅 The weekday with the highest average win rate was Wednesday at 47.03%. The weekday with the lowest average win rate was Thursday at 45.74%
⏱️ The 7-day period with the highest average win rate ended on 2026-04-05 at 63.27%. The lowest 7-day period ended on 2025-03-12 at 36.64%
⚖️ The number of days with a win rate above the average was 310. The number of days with a win rate below or equal to the average was 358
📈 The number of days with a win rate above 50% was 184. The number of days with a win rate between 40%–50% was 372. The number of days with a win rate below 40% was 112
#TradingStats #MarketInsights $DOGE $SEI $S
Updated 2026-05-01, community-wide trading data:
📊 The average win rate is 46.68%
🏆 The day with the highest win rate was 2026-04-01 at 78.08%. The day with the lowest win rate was 2026-01-25 at 15.69%
📅 The weekday with the highest average win rate was Wednesday at 47.03%. The weekday with the lowest average win rate was Thursday at 45.74%
⏱️ The 7-day period with the highest average win rate ended on 2026-04-05 at 63.27%. The lowest 7-day period ended on 2025-03-12 at 36.64%
⚖️ The number of days with a win rate above the average was 310. The number of days with a win rate below or equal to the average was 358
📈 The number of days with a win rate above 50% was 184. The number of days with a win rate between 40%–50% was 372. The number of days with a win rate below 40% was 112
#TradingStats #MarketInsights $DOGE $SEI $S
📊 The average win rate is 46.68%
🏆 The day with the highest win rate was 2026-04-01 at 78.08%. The day with the lowest win rate was 2026-01-25 at 15.69%
📅 The weekday with the highest average win rate was Wednesday at 47.03%. The weekday with the lowest average win rate was Thursday at 45.74%
⏱️ The 7-day period with the highest average win rate ended on 2026-04-05 at 63.27%. The lowest 7-day period ended on 2025-03-12 at 36.64%
⚖️ The number of days with a win rate above the average was 310. The number of days with a win rate below or equal to the average was 358
📈 The number of days with a win rate above 50% was 184. The number of days with a win rate between 40%–50% was 372. The number of days with a win rate below 40% was 112
#TradingStats #MarketInsights $DOGE $SEI $S
1
420
·
--
Рост
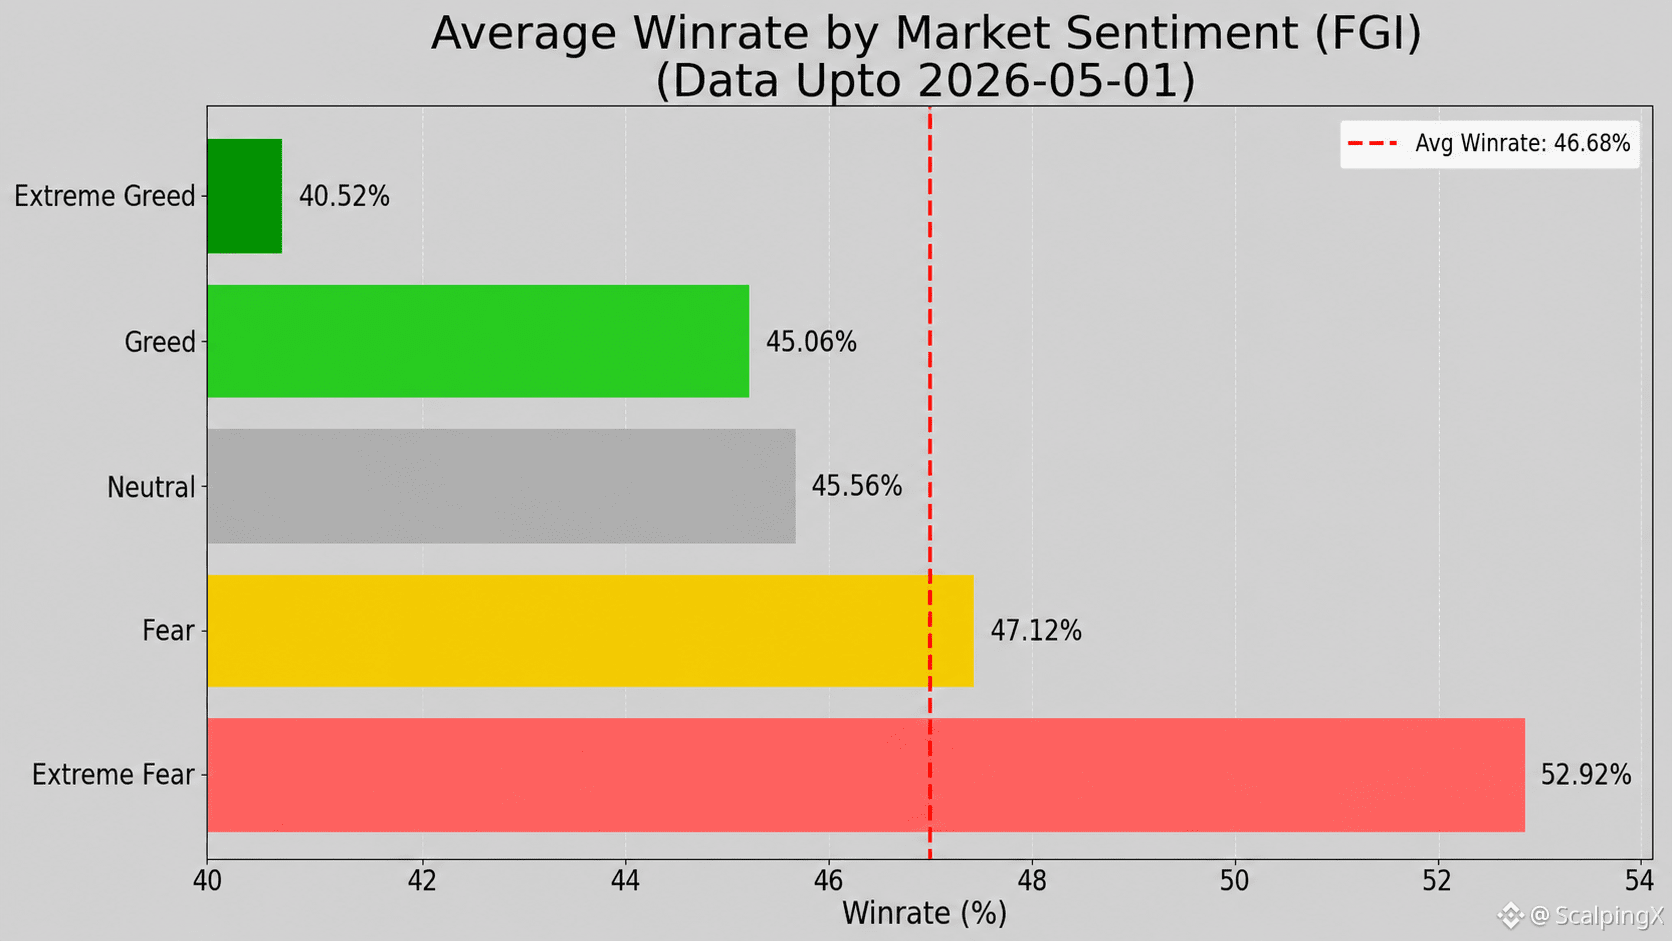
📊 TRADING PERFORMANCE & MARKET SENTIMENT INDEX (FGI) REPORT – UPDATED 2026-05-01
The latest statistical data shows that the correlation coefficient between FGI and Win Rate remains low and continues to lean negative (r ~ -0.326). This further reinforces that FGI is not suitable as a tool for forecasting price trends or identifying entry points, but it still has practical value in quantifying trade risk. Overall, trading performance tends to weaken when market sentiment enters extreme excitement, so FGI is better used as an early risk-warning signal rather than a signal for expanding profit expectations.
Below is a summary of Win Rate (WR), minimum breakeven R:R, and the number of recorded days (n) across sentiment zones for reference:
🤑 Extreme Greed (≥80): WR 40.5% • R:R=1:1.47 • n=25
🤤 Greed (60–80): WR 45.1% • R:R=1:1.22 • n=215
😐 Neutral (40–60): WR 45.6% • R:R=1:1.19 • n=140
😨 Fear (20–40): WR 47.1% • R:R=1:1.12 • n=196
😱 Extreme Fear (<20): WR 52.9% • R:R=1:0.89 • n=92
Percentage of days with performance above the average level (46.68%) by sentiment zone:
🤑 Extreme Greed: 8.0%
🤤 Greed: 36.3%
😐 Neutral: 40.7%
😨 Fear: 55.1%
😱 Extreme Fear: 70.7%
➤ Scalping traders can use FGI as a guide to adjust profit expectations when entering trades:
📈 When FGI is high, profit expectations need to be higher to ensure a strong enough R:R, helping offset the risk of a lower win rate.
📉 When FGI is low, profit expectations can be reduced to improve capital turnover speed and make profit-taking easier.
#TradingStats #MarketInsights $BTC $SOL $XRP
📊 TRADING PERFORMANCE & MARKET SENTIMENT INDEX (FGI) REPORT – UPDATED 2026-05-01
The latest statistical data shows that the correlation coefficient between FGI and Win Rate remains low and continues to lean negative (r ~ -0.326). This further reinforces that FGI is not suitable as a tool for forecasting price trends or identifying entry points, but it still has practical value in quantifying trade risk. Overall, trading performance tends to weaken when market sentiment enters extreme excitement, so FGI is better used as an early risk-warning signal rather than a signal for expanding profit expectations.
Below is a summary of Win Rate (WR), minimum breakeven R:R, and the number of recorded days (n) across sentiment zones for reference:
🤑 Extreme Greed (≥80): WR 40.5% • R:R=1:1.47 • n=25
🤤 Greed (60–80): WR 45.1% • R:R=1:1.22 • n=215
😐 Neutral (40–60): WR 45.6% • R:R=1:1.19 • n=140
😨 Fear (20–40): WR 47.1% • R:R=1:1.12 • n=196
😱 Extreme Fear (<20): WR 52.9% • R:R=1:0.89 • n=92
Percentage of days with performance above the average level (46.68%) by sentiment zone:
🤑 Extreme Greed: 8.0%
🤤 Greed: 36.3%
😐 Neutral: 40.7%
😨 Fear: 55.1%
😱 Extreme Fear: 70.7%
➤ Scalping traders can use FGI as a guide to adjust profit expectations when entering trades:
📈 When FGI is high, profit expectations need to be higher to ensure a strong enough R:R, helping offset the risk of a lower win rate.
📉 When FGI is low, profit expectations can be reduced to improve capital turnover speed and make profit-taking easier.
#TradingStats #MarketInsights $BTC $SOL $XRP
The latest statistical data shows that the correlation coefficient between FGI and Win Rate remains low and continues to lean negative (r ~ -0.326). This further reinforces that FGI is not suitable as a tool for forecasting price trends or identifying entry points, but it still has practical value in quantifying trade risk. Overall, trading performance tends to weaken when market sentiment enters extreme excitement, so FGI is better used as an early risk-warning signal rather than a signal for expanding profit expectations.
Below is a summary of Win Rate (WR), minimum breakeven R:R, and the number of recorded days (n) across sentiment zones for reference:
🤑 Extreme Greed (≥80): WR 40.5% • R:R=1:1.47 • n=25
🤤 Greed (60–80): WR 45.1% • R:R=1:1.22 • n=215
😐 Neutral (40–60): WR 45.6% • R:R=1:1.19 • n=140
😨 Fear (20–40): WR 47.1% • R:R=1:1.12 • n=196
😱 Extreme Fear (<20): WR 52.9% • R:R=1:0.89 • n=92
Percentage of days with performance above the average level (46.68%) by sentiment zone:
🤑 Extreme Greed: 8.0%
🤤 Greed: 36.3%
😐 Neutral: 40.7%
😨 Fear: 55.1%
😱 Extreme Fear: 70.7%
➤ Scalping traders can use FGI as a guide to adjust profit expectations when entering trades:
📈 When FGI is high, profit expectations need to be higher to ensure a strong enough R:R, helping offset the risk of a lower win rate.
📉 When FGI is low, profit expectations can be reduced to improve capital turnover speed and make profit-taking easier.
#TradingStats #MarketInsights $BTC $SOL $XRP
1
1
58
·
--
$BTC THE ODDS: LESS THAN 0.02% SURVIVE A DECADE OF TRADING 📊
Out of 50 million daily active crypto users, fewer than 10,000 have maintained consistent profitability for 10 straight years. That is a staggering 0.02% survival rate. Even among those who turned a profit in year one, over 92% lose money in year two.
The numbers confirm that leverage is a fast track to ruin. The source data notes that even 2x leverage can lead to an account wipeout within one year. Perpetual futures traders face constant funding pressure and volatility.
The only cohort that consistently lasts a decade? Spot holders who avoid liquidations entirely. Which style aligns with your risk tolerance — spot accumulation or derivatives trading?
Not financial advice. Always manage your risk.
#BTC #TradingStats #RiskManagement #SpotTrading #CryptoEducation
🎯
$BTC THE ODDS: LESS THAN 0.02% SURVIVE A DECADE OF TRADING 📊
Out of 50 million daily active crypto users, fewer than 10,000 have maintained consistent profitability for 10 straight years. That is a staggering 0.02% survival rate. Even among those who turned a profit in year one, over 92% lose money in year two.
The numbers confirm that leverage is a fast track to ruin. The source data notes that even 2x leverage can lead to an account wipeout within one year. Perpetual futures traders face constant funding pressure and volatility.
The only cohort that consistently lasts a decade? Spot holders who avoid liquidations entirely. Which style aligns with your risk tolerance — spot accumulation or derivatives trading?
Not financial advice. Always manage your risk.
#BTC #TradingStats #RiskManagement #SpotTrading #CryptoEducation
🎯
Out of 50 million daily active crypto users, fewer than 10,000 have maintained consistent profitability for 10 straight years. That is a staggering 0.02% survival rate. Even among those who turned a profit in year one, over 92% lose money in year two.
The numbers confirm that leverage is a fast track to ruin. The source data notes that even 2x leverage can lead to an account wipeout within one year. Perpetual futures traders face constant funding pressure and volatility.
The only cohort that consistently lasts a decade? Spot holders who avoid liquidations entirely. Which style aligns with your risk tolerance — spot accumulation or derivatives trading?
Not financial advice. Always manage your risk.
#BTC #TradingStats #RiskManagement #SpotTrading #CryptoEducation
🎯
29
Войдите, чтобы посмотреть больше материала
Присоединяйтесь к пользователям криптовалют по всему миру на Binance Square
⚡️ Получайте новейшую и полезную информацию о криптоактивах.
💬 Нам доверяет крупнейшая в мире криптобиржа.
👍 Получите достоверные аналитические данные от верифицированных создателей контента.
Эл. почта/номер телефона
В тренде
1
#BinanceKZ
Просмотров: 12,129
66 обсуждают
2
#EarningsSeason
Просмотров: 348,387
2,646 обсуждают
3
#BitwiseLaunchesFirstSpotNEARETF
Просмотров: 35,616
606 обсуждают
4
#USJobOpeningsFallToFiveMonthLow
Просмотров: 43,093
458 обсуждают
5
#ECBToTestAIAgentsInDigitalEuroPayments
Просмотров: 30,407
564 обсуждают
6
#JapanFSABacksFourthStablecoinTradeSettlementPilot
Просмотров: 35,102
597 обсуждают
7
#BitgetHackerFailsToMoveStolenFunds
Просмотров: 51,058
648 обсуждают
8
#BitMineETHHoldingsTop6Million
Просмотров: 40,849
727 обсуждают
9
#StrategyAdds1666BTCHoldingsReach847666
Просмотров: 33,260
507 обсуждают
10
#NvidiaApproves$150BBuyback
Просмотров: 5,748
76 обсуждают