
#sp500
sp500
Просмотров: 717,490
2,390 обсуждают
Популярные
Новые

·
--
Рост
S&P 500 Buyers Are Fighting Back
⠀
The S&P 500 came under heavy pressure after NVIDIA CEO Jensen Huang’s resignation triggered fresh uncertainty across AI-related stocks.
But what caught my attention was the recovery.
Despite NVIDIA’s weakness, strength in other semiconductor names and sectors helped the index recover much of its early losses.
⠀
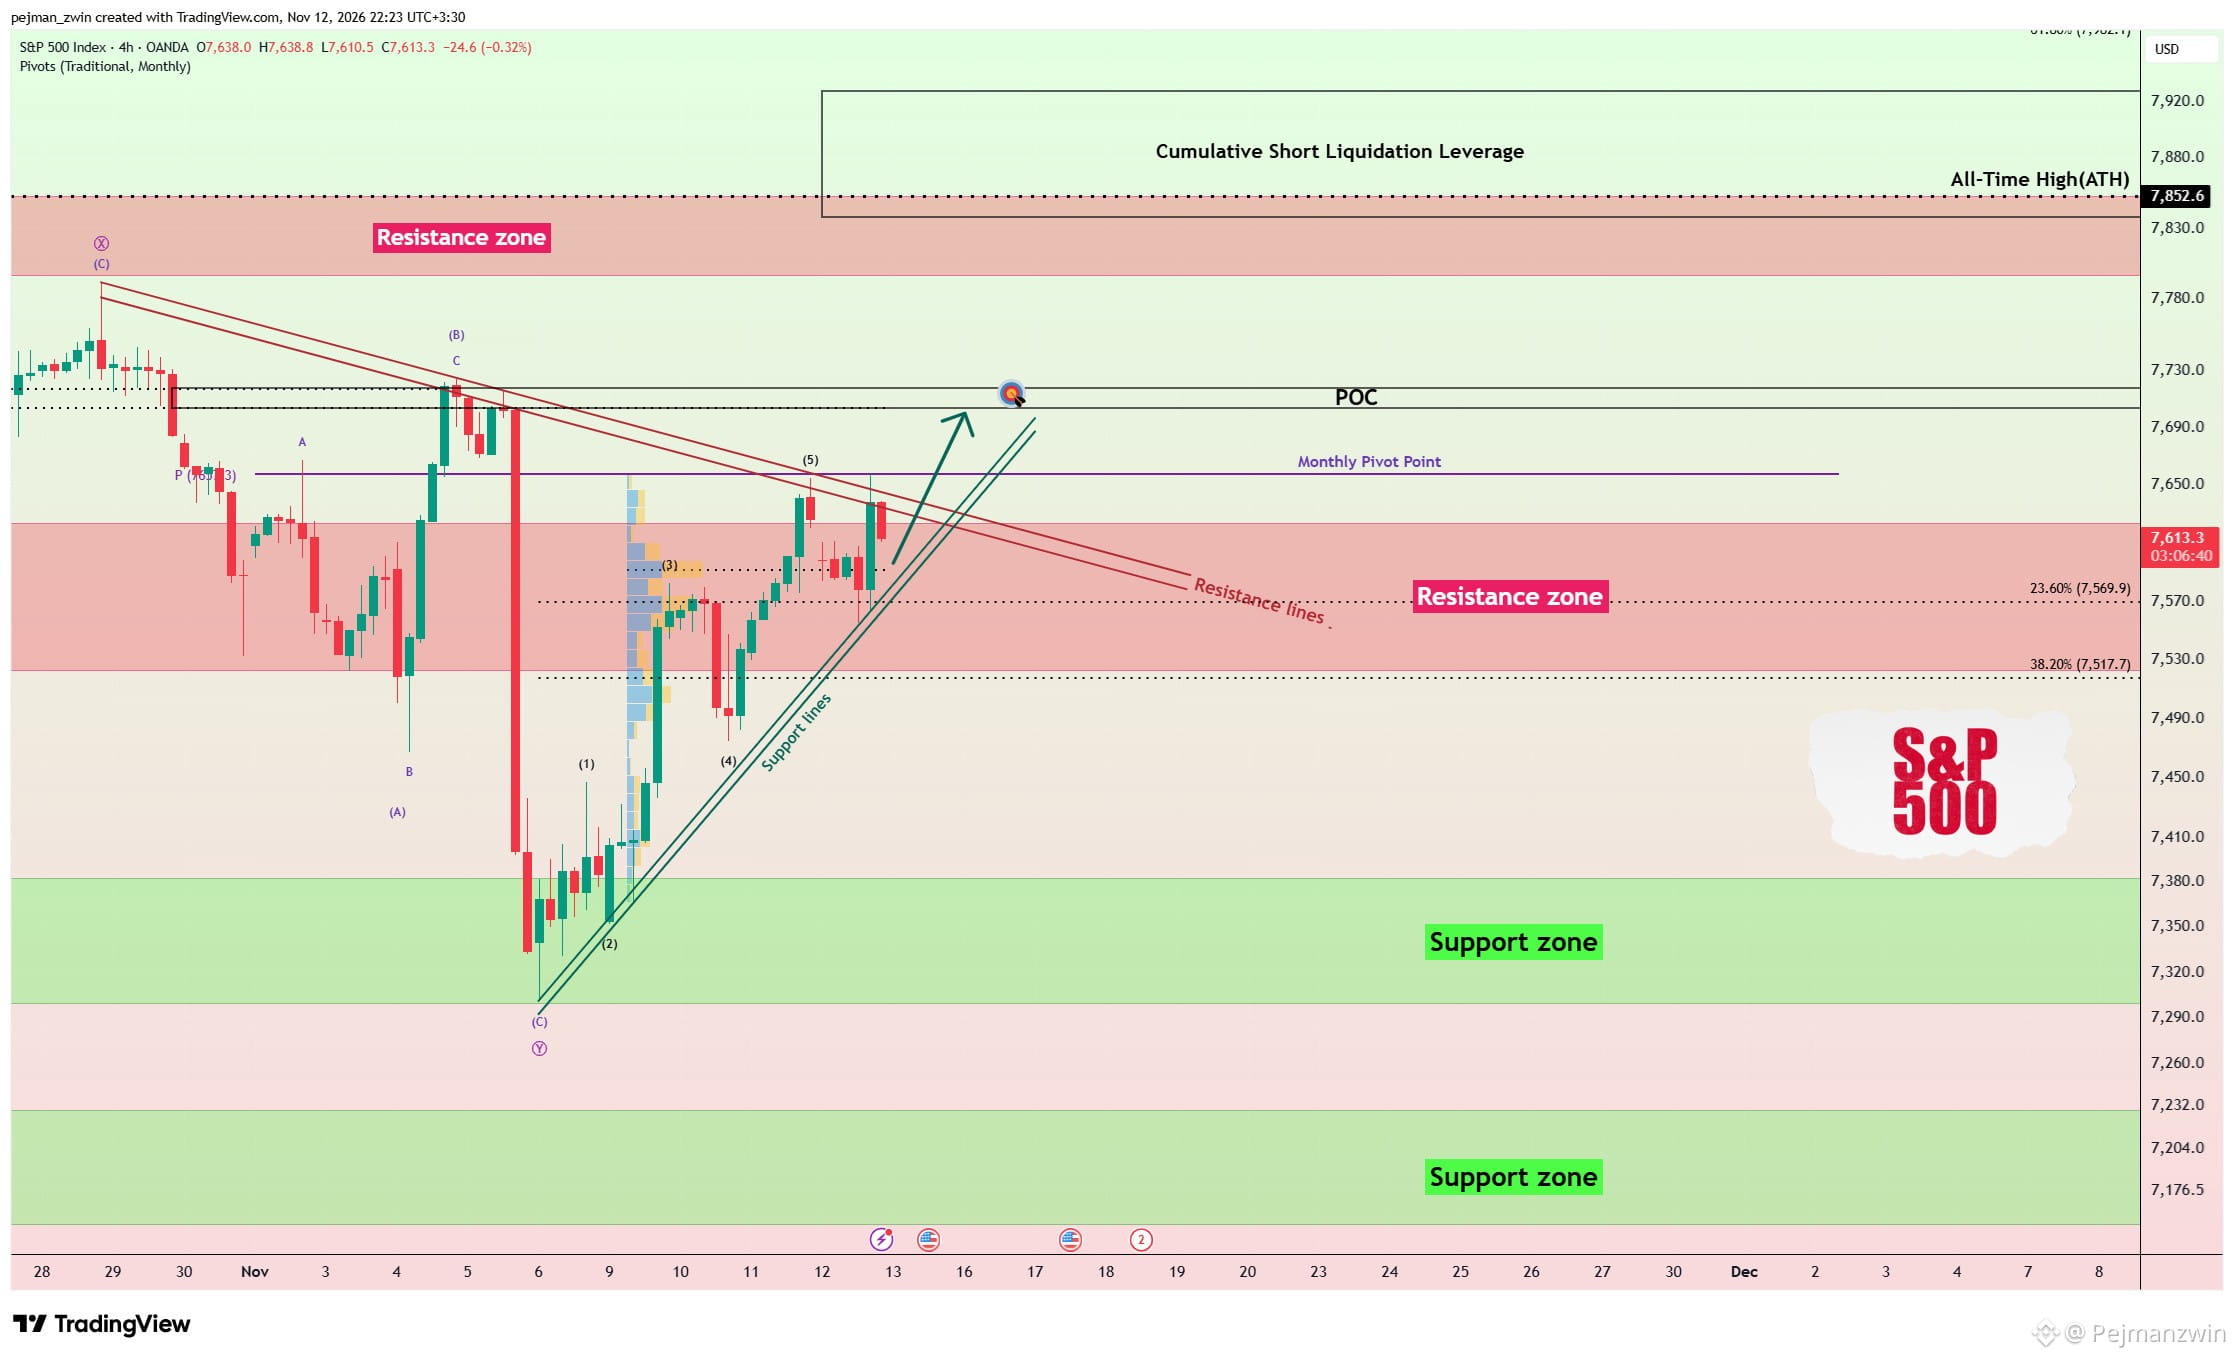
Technically, the S&P 500 is now challenging its Monthly Pivot Point and attempting to break above key Resistance Lines.
From an Elliott Wave perspective, the recent five-wave Impulsive Structure may be complete, so a short corrective move is still possible before another bullish leg.
⠀
As long as buyers defend the key $7,591 area, I’m watching for a move toward ($7,703-$7,716).
A clean breakout above that zone could reopen the path toward new highs.
⠀
My setup:
TP: $7,703
SL: $7,530
⠀
Bitcoin and Ethereum could also react strongly if U.S. equities make another sharp move, especially while broader risk sentiment remains fragile.
⠀
Which level comes first?
🟢 $7,703
🔴 $7,530
#SP500
S&P 500 Buyers Are Fighting Back
⠀
The S&P 500 came under heavy pressure after NVIDIA CEO Jensen Huang’s resignation triggered fresh uncertainty across AI-related stocks.
But what caught my attention was the recovery.
Despite NVIDIA’s weakness, strength in other semiconductor names and sectors helped the index recover much of its early losses.
⠀
Technically, the S&P 500 is now challenging its Monthly Pivot Point and attempting to break above key Resistance Lines.
From an Elliott Wave perspective, the recent five-wave Impulsive Structure may be complete, so a short corrective move is still possible before another bullish leg.
⠀
As long as buyers defend the key $7,591 area, I’m watching for a move toward ($7,703-$7,716).
A clean breakout above that zone could reopen the path toward new highs.
⠀
My setup:
TP: $7,703
SL: $7,530
⠀
Bitcoin and Ethereum could also react strongly if U.S. equities make another sharp move, especially while broader risk sentiment remains fragile.
⠀
Which level comes first?
🟢 $7,703
🔴 $7,530
#SP500
⠀
The S&P 500 came under heavy pressure after NVIDIA CEO Jensen Huang’s resignation triggered fresh uncertainty across AI-related stocks.
But what caught my attention was the recovery.
Despite NVIDIA’s weakness, strength in other semiconductor names and sectors helped the index recover much of its early losses.
⠀
Technically, the S&P 500 is now challenging its Monthly Pivot Point and attempting to break above key Resistance Lines.
From an Elliott Wave perspective, the recent five-wave Impulsive Structure may be complete, so a short corrective move is still possible before another bullish leg.
⠀
As long as buyers defend the key $7,591 area, I’m watching for a move toward ($7,703-$7,716).
A clean breakout above that zone could reopen the path toward new highs.
⠀
My setup:
TP: $7,703
SL: $7,530
⠀
Bitcoin and Ethereum could also react strongly if U.S. equities make another sharp move, especially while broader risk sentiment remains fragile.
⠀
Which level comes first?
🟢 $7,703
🔴 $7,530
#SP500
Abu Fahadأ:
💛
2
2
308
·
--
S&P 500 Today & Crypto Link |
📅 Nov 12, 2026
✅ Quick overview
S&P 500 is the main US stock index. Right now BTC still has positive correlation with S&P 500. When S&P 500 moves sharply, crypto on Binance usually follows.
✅ Today’s macro picture
S&P 500 is muted / slightly down, pressured by hot CPI inflation worries and strong US Dollar. Risk sentiment is cautious.
- If S&P 500 drops further → BTC, ETH, altcoins tend to sell off
- If S&P 500 bounces back → crypto can get relief rally
- Small caps (AGT, JCT) move more violently than BTC when S&P swings
✅ Why traders watch S&P 500
Big institutional funds trade both stocks and crypto. When they cut risk in equities, they also reduce crypto positions, triggering futures liquidations on Binance.
✅ Scenarios
🟢 S&P 500 green = risk on, better chance for BTC to hold $74K support
🔴 S&P 500 red = risk off, altcoins will face heavier selling pressure
✅ Trader tip
Watch S&P futures before US market open. It is one of the top macro signals together with CPI, DXY and oil price.
High leverage is dangerous when S&P turns volatile.
⚠️ Not financial advice, DYOR.
#SP500 #BTC #CryptoMacro #BinanceTrading
S&P 500 Today & Crypto Link |
📅 Nov 12, 2026
✅ Quick overview
S&P 500 is the main US stock index. Right now BTC still has positive correlation with S&P 500. When S&P 500 moves sharply, crypto on Binance usually follows.
✅ Today’s macro picture
S&P 500 is muted / slightly down, pressured by hot CPI inflation worries and strong US Dollar. Risk sentiment is cautious.
- If S&P 500 drops further → BTC, ETH, altcoins tend to sell off
- If S&P 500 bounces back → crypto can get relief rally
- Small caps (AGT, JCT) move more violently than BTC when S&P swings
✅ Why traders watch S&P 500
Big institutional funds trade both stocks and crypto. When they cut risk in equities, they also reduce crypto positions, triggering futures liquidations on Binance.
✅ Scenarios
🟢 S&P 500 green = risk on, better chance for BTC to hold $74K support
🔴 S&P 500 red = risk off, altcoins will face heavier selling pressure
✅ Trader tip
Watch S&P futures before US market open. It is one of the top macro signals together with CPI, DXY and oil price.
High leverage is dangerous when S&P turns volatile.
⚠️ Not financial advice, DYOR.
#SP500 #BTC #CryptoMacro #BinanceTrading
📅 Nov 12, 2026
✅ Quick overview
S&P 500 is the main US stock index. Right now BTC still has positive correlation with S&P 500. When S&P 500 moves sharply, crypto on Binance usually follows.
✅ Today’s macro picture
S&P 500 is muted / slightly down, pressured by hot CPI inflation worries and strong US Dollar. Risk sentiment is cautious.
- If S&P 500 drops further → BTC, ETH, altcoins tend to sell off
- If S&P 500 bounces back → crypto can get relief rally
- Small caps (AGT, JCT) move more violently than BTC when S&P swings
✅ Why traders watch S&P 500
Big institutional funds trade both stocks and crypto. When they cut risk in equities, they also reduce crypto positions, triggering futures liquidations on Binance.
✅ Scenarios
🟢 S&P 500 green = risk on, better chance for BTC to hold $74K support
🔴 S&P 500 red = risk off, altcoins will face heavier selling pressure
✅ Trader tip
Watch S&P futures before US market open. It is one of the top macro signals together with CPI, DXY and oil price.
High leverage is dangerous when S&P turns volatile.
⚠️ Not financial advice, DYOR.
#SP500 #BTC #CryptoMacro #BinanceTrading
28

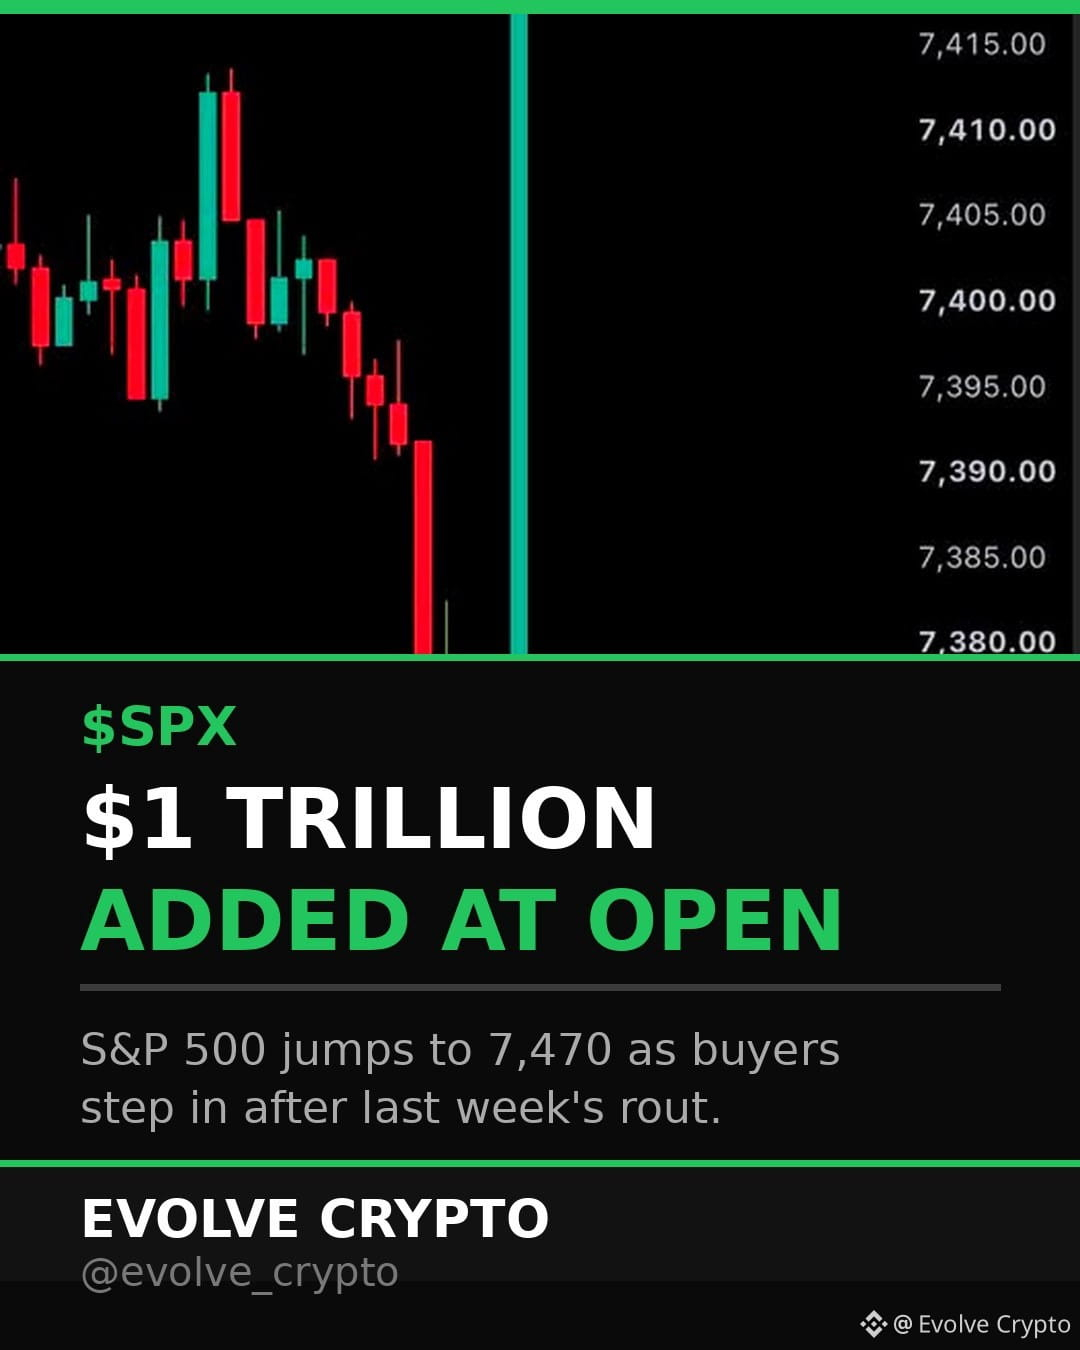
JUST IN: 🇺🇸 US stocks added $1 trillion in market value at the open, with the S&P 500 jumping to 7,470 as buyers stepped in after last week's $3 trillion sell-off.
The rebound comes even as Nvidia slides on its CEO probe — the wider market is buying the dip.
#StockMarket #SP500 #Crypto
DYOR. This is not financial advice.
JUST IN: 🇺🇸 US stocks added $1 trillion in market value at the open, with the S&P 500 jumping to 7,470 as buyers stepped in after last week's $3 trillion sell-off.
The rebound comes even as Nvidia slides on its CEO probe — the wider market is buying the dip.
#StockMarket #SP500 #Crypto
DYOR. This is not financial advice.
The rebound comes even as Nvidia slides on its CEO probe — the wider market is buying the dip.
#StockMarket #SP500 #Crypto
DYOR. This is not financial advice.
7

·
--
Статья
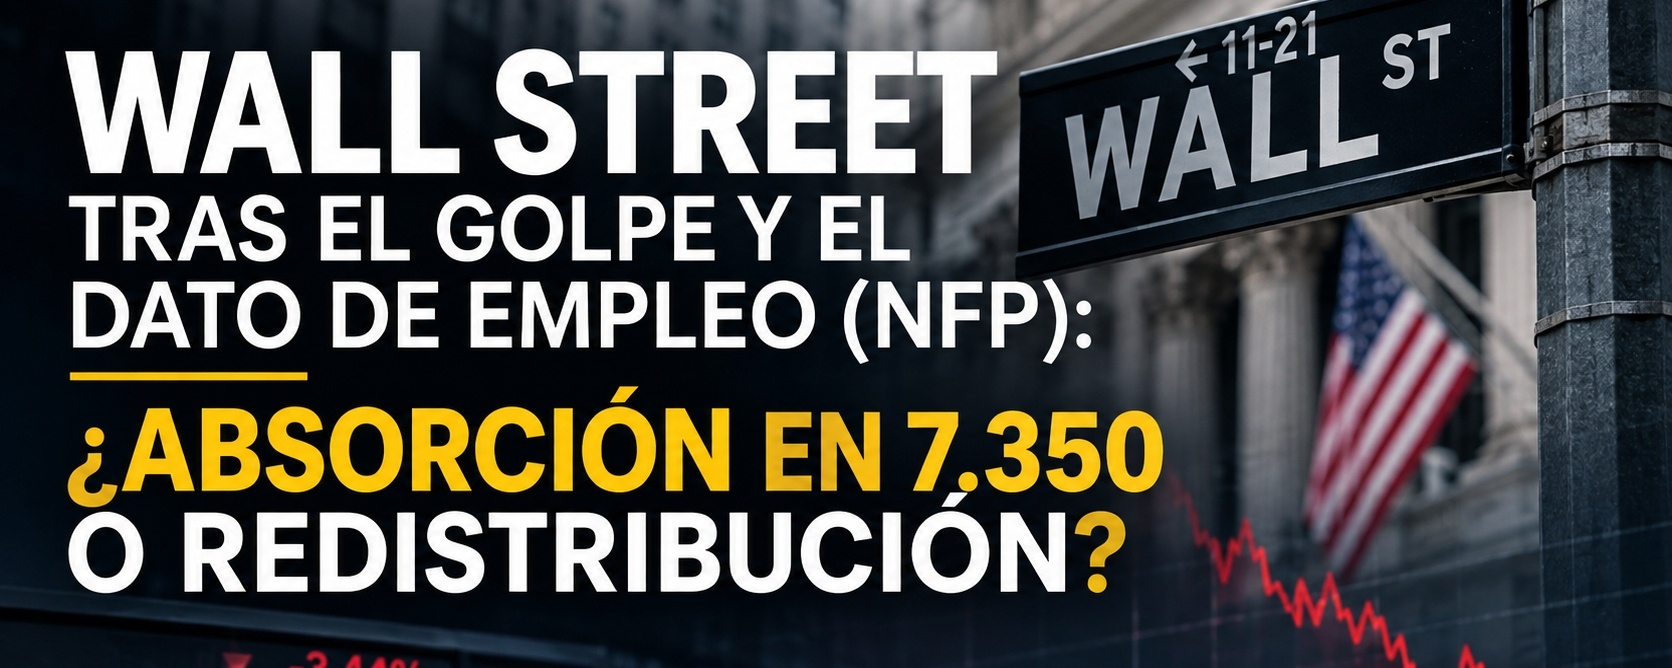
WALL STREET TRAS EL GOLPE Y EL DATO DE EMPLEO (NFP): ¿ABSORCIÓN EN 7.350 O REDISTRIBUCIÓN?La liquidación del jueves en Wall Street —la peor desde abril de 2025, con el Dow Jones perdiendo 1.833 puntos (-3,44 %), el S&P 500 cayendo un 4,36 % hasta 7.353,73, el Nasdaq un 5,52 %, los chips casi un 12 %, los 11 sectores en rojo y el Nikkei japonés hundiéndose hoy un 6 %— acaba de chocar este viernes con un informe de empleo mucho más fuerte de lo esperado.
1. Qué dejó el NFP de octubre hoy viernes:
- Nóminas no agrícolas: +165.000 empleos frente a los 65.000–70.000 estimados por el consenso.
- Revisiones al alza: +84.000 puestos adicionales sumados entre agosto (revisado a 186.000) y septiembre (revisado de 29.000 a 60.000).
- Tasa de desempleo: baja una décima hasta el 4,1 %.
- Presión salarial: los ingresos medios por hora subieron un 0,4 % mensual (vs 0,3 % est.) y un 3,1 % interanual.
2. Impacto inmediato en bonos, liquidez y cripto:
Tal como anticipaba en mi análisis previo al dato, la firmeza laboral deja a la Reserva Federal sin argumentos para relajar las condiciones financieras mientras la inflación sigue sobre la meta del 2 %. Tras el reporte, el rendimiento del bono a 10 años repuntó más de 6 puntos básicos desde el 4,83 %, mientras los bonos a 20 y 30 años siguen clavados por encima del 5 %. Ese salto en los rendimientos fortaleció al dólar y enfrió al oro y a Bitcoin ($BTC), mientras en la energía los contactos diplomáticos entre EE. UU. e Irán con mediación de Catar moderan el crudo cerca de los 100 dólares en Brent y 90 en WTI.
En el plano corporativo, un coste del dinero tan exigente explica por qué el mercado castiga a quienes necesitan diluir al accionista o endeudarse para financiar centros de datos —como Oracle ($ORCL) con su operación de 20.000 millones de dólares— y protege a quienes generan efectivo inmediato, como Apple ($AAPL) con 28.000 millones en flujo de caja operativo, mientras Tesla ($TSLA) recorta progresivamente el Cybertruck en Texas hacia 2027 para priorizar el Cybercab.
3. Lectura técnica de flujo de órdenes en el S&P 500:
El cierre de ayer en 7.353,73 ejecutó una toma de liquidez exacta sobre el bloque de órdenes de demanda situado entre 7.350 y 7.400 puntos. El rebote intradía que vemos hoy entre 7.353 y 7.469 responde inicialmente a cierres de cortos y al relleno de la ineficiencia de precio (desequilibrio o vacío de liquidez) que dejó la caída vertical del jueves.
La clave operativa ahora está en distinguir entre acumulación real y redistribución: si el precio sube a mitigar los bloques de oferta dejados entre 7.470 y 7.550 pero el volumen comprador se agota y los semiconductores siguen débiles, las carteras institucionales utilizarán ese rebote para descargar inventario. Una perforación posterior del bloque de 7.350 habilitaría la búsqueda directa de la liquidez inferior en los 7.000–6.900 puntos.
¿Ven defensa compradora real en el bloque de 7.350 o simple mitigación de desequilibrios antes de buscar los 7.000 puntos?
$BTC $ORCL $AAPL #SP500 #WallStreet #NFP #Trading #Macroeconomics
WALL STREET TRAS EL GOLPE Y EL DATO DE EMPLEO (NFP): ¿ABSORCIÓN EN 7.350 O REDISTRIBUCIÓN?
La liquidación del jueves en Wall Street —la peor desde abril de 2025, con el Dow Jones perdiendo 1.833 puntos (-3,44 %), el S&P 500 cayendo un 4,36 % hasta 7.353,73, el Nasdaq un 5,52 %, los chips casi un 12 %, los 11 sectores en rojo y el Nikkei japonés hundiéndose hoy un 6 %— acaba de chocar este viernes con un informe de empleo mucho más fuerte de lo esperado.
1. Qué dejó el NFP de octubre hoy viernes:
- Nóminas no agrícolas: +165.000 empleos frente a los 65.000–70.000 estimados por el consenso.
- Revisiones al alza: +84.000 puestos adicionales sumados entre agosto (revisado a 186.000) y septiembre (revisado de 29.000 a 60.000).
- Tasa de desempleo: baja una décima hasta el 4,1 %.
- Presión salarial: los ingresos medios por hora subieron un 0,4 % mensual (vs 0,3 % est.) y un 3,1 % interanual.
2. Impacto inmediato en bonos, liquidez y cripto:
Tal como anticipaba en mi análisis previo al dato, la firmeza laboral deja a la Reserva Federal sin argumentos para relajar las condiciones financieras mientras la inflación sigue sobre la meta del 2 %. Tras el reporte, el rendimiento del bono a 10 años repuntó más de 6 puntos básicos desde el 4,83 %, mientras los bonos a 20 y 30 años siguen clavados por encima del 5 %. Ese salto en los rendimientos fortaleció al dólar y enfrió al oro y a Bitcoin ($BTC ), mientras en la energía los contactos diplomáticos entre EE. UU. e Irán con mediación de Catar moderan el crudo cerca de los 100 dólares en Brent y 90 en WTI.
En el plano corporativo, un coste del dinero tan exigente explica por qué el mercado castiga a quienes necesitan diluir al accionista o endeudarse para financiar centros de datos —como Oracle ($ORCL ) con su operación de 20.000 millones de dólares— y protege a quienes generan efectivo inmediato, como Apple ($AAPL ) con 28.000 millones en flujo de caja operativo, mientras Tesla ($TSLA) recorta progresivamente el Cybertruck en Texas hacia 2027 para priorizar el Cybercab.
3. Lectura técnica de flujo de órdenes en el S&P 500:
El cierre de ayer en 7.353,73 ejecutó una toma de liquidez exacta sobre el bloque de órdenes de demanda situado entre 7.350 y 7.400 puntos. El rebote intradía que vemos hoy entre 7.353 y 7.469 responde inicialmente a cierres de cortos y al relleno de la ineficiencia de precio (desequilibrio o vacío de liquidez) que dejó la caída vertical del jueves.
La clave operativa ahora está en distinguir entre acumulación real y redistribución: si el precio sube a mitigar los bloques de oferta dejados entre 7.470 y 7.550 pero el volumen comprador se agota y los semiconductores siguen débiles, las carteras institucionales utilizarán ese rebote para descargar inventario. Una perforación posterior del bloque de 7.350 habilitaría la búsqueda directa de la liquidez inferior en los 7.000–6.900 puntos.
¿Ven defensa compradora real en el bloque de 7.350 o simple mitigación de desequilibrios antes de buscar los 7.000 puntos?
$BTC $ORCL $AAPL #SP500 #WallStreet #NFP #Trading #Macroeconomics
1. Qué dejó el NFP de octubre hoy viernes:
- Nóminas no agrícolas: +165.000 empleos frente a los 65.000–70.000 estimados por el consenso.
- Revisiones al alza: +84.000 puestos adicionales sumados entre agosto (revisado a 186.000) y septiembre (revisado de 29.000 a 60.000).
- Tasa de desempleo: baja una décima hasta el 4,1 %.
- Presión salarial: los ingresos medios por hora subieron un 0,4 % mensual (vs 0,3 % est.) y un 3,1 % interanual.
2. Impacto inmediato en bonos, liquidez y cripto:
Tal como anticipaba en mi análisis previo al dato, la firmeza laboral deja a la Reserva Federal sin argumentos para relajar las condiciones financieras mientras la inflación sigue sobre la meta del 2 %. Tras el reporte, el rendimiento del bono a 10 años repuntó más de 6 puntos básicos desde el 4,83 %, mientras los bonos a 20 y 30 años siguen clavados por encima del 5 %. Ese salto en los rendimientos fortaleció al dólar y enfrió al oro y a Bitcoin ($BTC ), mientras en la energía los contactos diplomáticos entre EE. UU. e Irán con mediación de Catar moderan el crudo cerca de los 100 dólares en Brent y 90 en WTI.
En el plano corporativo, un coste del dinero tan exigente explica por qué el mercado castiga a quienes necesitan diluir al accionista o endeudarse para financiar centros de datos —como Oracle ($ORCL ) con su operación de 20.000 millones de dólares— y protege a quienes generan efectivo inmediato, como Apple ($AAPL ) con 28.000 millones en flujo de caja operativo, mientras Tesla ($TSLA) recorta progresivamente el Cybertruck en Texas hacia 2027 para priorizar el Cybercab.
3. Lectura técnica de flujo de órdenes en el S&P 500:
El cierre de ayer en 7.353,73 ejecutó una toma de liquidez exacta sobre el bloque de órdenes de demanda situado entre 7.350 y 7.400 puntos. El rebote intradía que vemos hoy entre 7.353 y 7.469 responde inicialmente a cierres de cortos y al relleno de la ineficiencia de precio (desequilibrio o vacío de liquidez) que dejó la caída vertical del jueves.
La clave operativa ahora está en distinguir entre acumulación real y redistribución: si el precio sube a mitigar los bloques de oferta dejados entre 7.470 y 7.550 pero el volumen comprador se agota y los semiconductores siguen débiles, las carteras institucionales utilizarán ese rebote para descargar inventario. Una perforación posterior del bloque de 7.350 habilitaría la búsqueda directa de la liquidez inferior en los 7.000–6.900 puntos.
¿Ven defensa compradora real en el bloque de 7.350 o simple mitigación de desequilibrios antes de buscar los 7.000 puntos?
$BTC $ORCL $AAPL #SP500 #WallStreet #NFP #Trading #Macroeconomics
222

·
--
Проверено
🚨 ¡PÁNICO TOTAL! WALL STREET SE DERRUMBA 😱
¡ALERTA MUNDIAL, mi gente! Esto NO es broma.
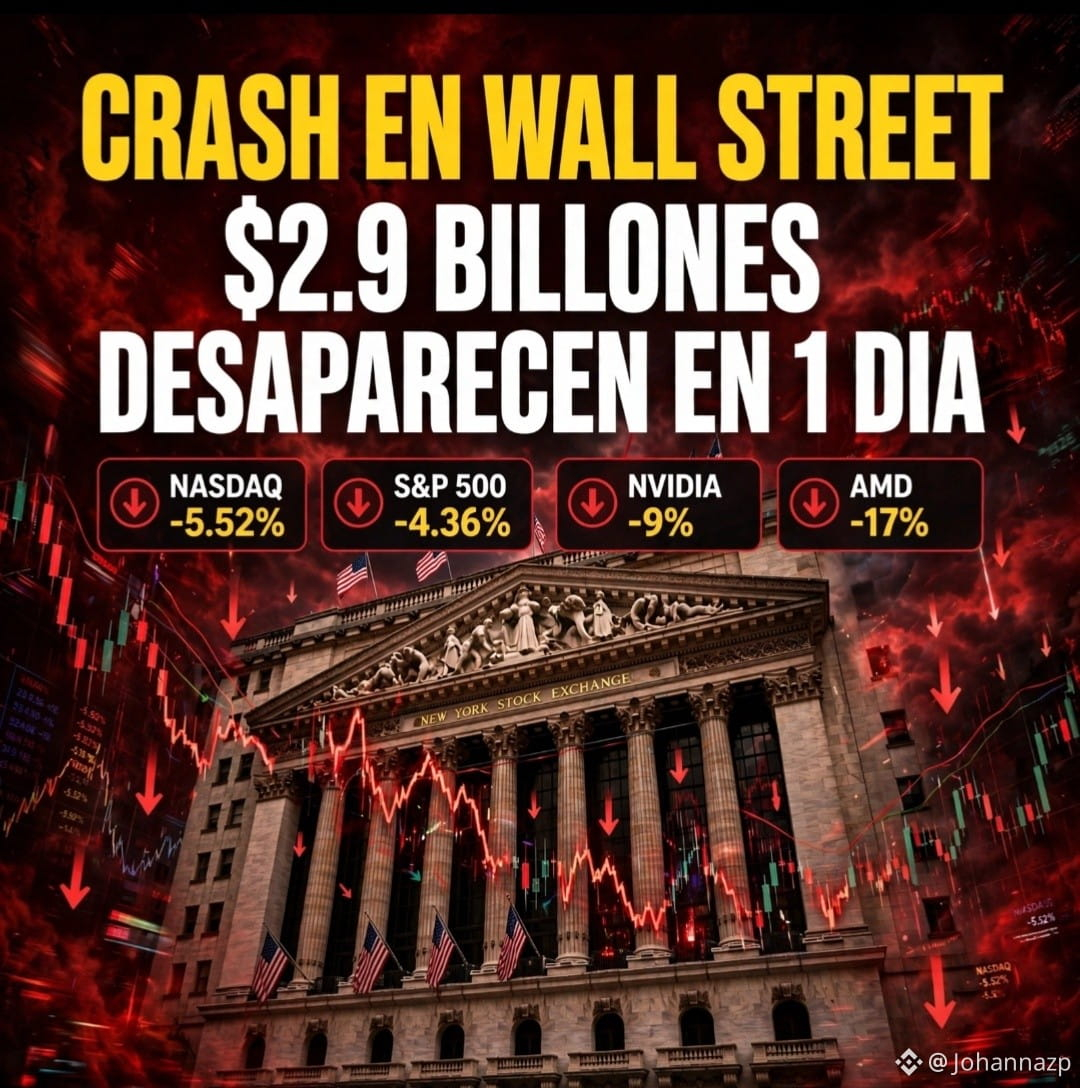
Ayer Wall Street vivió una masacre. En solo horas, se evaporaron $2.9 BILLONES de dólares. ¡Billones, mi gente!
📉 Nasdaq: -5.52%
📉 S&P 500: -4.36%
📉 Dow Jones: -3.44%
¿Y las de IA? DESTRUIDAS:
🔴 AMD -17%
🔴 Micron -17%
🔴 Sandisk -22%
🔴 Nvidia -9%
Dicen que fue por pánico por la IA y las regulaciones... ¿Pero tú qué crees?
¿Esto fue solo pánico exagerado o es el INICIO DEL CRASH GRANDE? 👀
Comenta 👇
¿COMPRAS LA CAÍDA O ESPERAS?
#Crash #WallStreet #NASDAQ #SP500
🚨 ¡PÁNICO TOTAL! WALL STREET SE DERRUMBA 😱
¡ALERTA MUNDIAL, mi gente! Esto NO es broma.
Ayer Wall Street vivió una masacre. En solo horas, se evaporaron $2.9 BILLONES de dólares. ¡Billones, mi gente!
📉 Nasdaq: -5.52%
📉 S&P 500: -4.36%
📉 Dow Jones: -3.44%
¿Y las de IA? DESTRUIDAS:
🔴 AMD -17%
🔴 Micron -17%
🔴 Sandisk -22%
🔴 Nvidia -9%
Dicen que fue por pánico por la IA y las regulaciones... ¿Pero tú qué crees?
¿Esto fue solo pánico exagerado o es el INICIO DEL CRASH GRANDE? 👀
Comenta 👇
¿COMPRAS LA CAÍDA O ESPERAS?
#Crash #WallStreet #NASDAQ #SP500
¡ALERTA MUNDIAL, mi gente! Esto NO es broma.
Ayer Wall Street vivió una masacre. En solo horas, se evaporaron $2.9 BILLONES de dólares. ¡Billones, mi gente!
📉 Nasdaq: -5.52%
📉 S&P 500: -4.36%
📉 Dow Jones: -3.44%
¿Y las de IA? DESTRUIDAS:
🔴 AMD -17%
🔴 Micron -17%
🔴 Sandisk -22%
🔴 Nvidia -9%
Dicen que fue por pánico por la IA y las regulaciones... ¿Pero tú qué crees?
¿Esto fue solo pánico exagerado o es el INICIO DEL CRASH GRANDE? 👀
Comenta 👇
¿COMPRAS LA CAÍDA O ESPERAS?
#Crash #WallStreet #NASDAQ #SP500
AudrelysR:
si todos siguen llevándose por noticias así nunca ahorraran en cripto 2 o 100 billones es nada para wall street métase eso en la cabeza hoy se pierde so mañana ganan el doble
4
1
12
13.3k


·
--
Проверено
¿Es el fin de la narrativa de la IA?
El S&P 500 sufre una sangría histórica de 2.9 billones de dólares tras una ola masiva de liquidaciones
Pérdida récord de capitalización
El #SP500 evaporó aproximadamente 2.9 billones de dólares en un solo día, registrando la mayor destrucción de valor de mercado intradía de la historia.
Caídas no vistas desde el pánico del COVID:
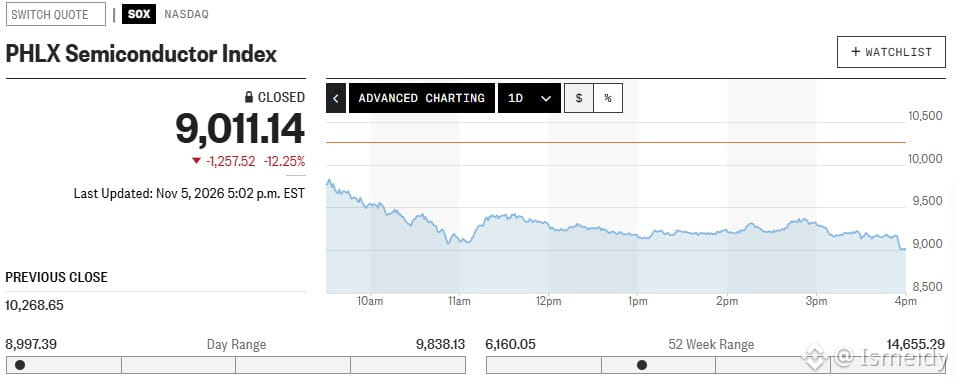
El Índice de Semiconductores PHLX (SOX) se desplomó un 12,25% (-1.257,52 puntos) cerrando en 9.011,14, su peor jornada desde marzo de 2020.
El S&P 500 Tecnológico cayó un 7,3% y el Nasdaq-100 (NDX) cedió un 6,4%, rompiendo niveles clave de soporte.
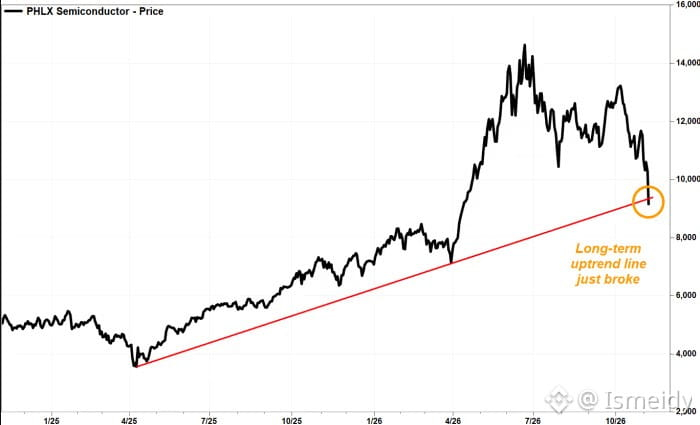
Ruptura de tendencia y factor político: La victoria contundente de los demócratas en las elecciones de mitad de mandato encendió las alarmas por posibles regulaciones severas o paralizaciones en la construcción de centros de datos de IA. Gráficamente, el índice SOX rompió a la baja la línea de tendencia alcista de largo plazo que sostenía al mercado desde abril de 2025.
Efecto cascada y liquidaciones forzadas (Margin Calls): La corrección desencadenó un "desapalancamiento masivo". Los fondos de cobertura y traders apalancados sufrieron llamadas de margen que los obligaron a vender masivamente posiciones no solo en tech, sino también en sectores defensivos (salud y consumo básico) para cubrir pérdidas.
Explosión del índice del miedo (VIX): El índice de volatilidad Cboe se disparó un impresionante 69,7%, marcando su mayor incremento en dos años y reflejando una clara fase de pánico y rendición en el mercado general.
#IA #CryptoNews
$SPYB
{spot}(SPYBUSDT)
$QQQB
{spot}(QQQBUSDT)
$TSMB
{spot}(TSMBUSDT)
¿Es el fin de la narrativa de la IA?
El S&P 500 sufre una sangría histórica de 2.9 billones de dólares tras una ola masiva de liquidaciones
Pérdida récord de capitalización
El #SP500 evaporó aproximadamente 2.9 billones de dólares en un solo día, registrando la mayor destrucción de valor de mercado intradía de la historia.
Caídas no vistas desde el pánico del COVID:
El Índice de Semiconductores PHLX (SOX) se desplomó un 12,25% (-1.257,52 puntos) cerrando en 9.011,14, su peor jornada desde marzo de 2020.
El S&P 500 Tecnológico cayó un 7,3% y el Nasdaq-100 (NDX) cedió un 6,4%, rompiendo niveles clave de soporte.
Ruptura de tendencia y factor político: La victoria contundente de los demócratas en las elecciones de mitad de mandato encendió las alarmas por posibles regulaciones severas o paralizaciones en la construcción de centros de datos de IA. Gráficamente, el índice SOX rompió a la baja la línea de tendencia alcista de largo plazo que sostenía al mercado desde abril de 2025.
Efecto cascada y liquidaciones forzadas (Margin Calls): La corrección desencadenó un "desapalancamiento masivo". Los fondos de cobertura y traders apalancados sufrieron llamadas de margen que los obligaron a vender masivamente posiciones no solo en tech, sino también en sectores defensivos (salud y consumo básico) para cubrir pérdidas.
Explosión del índice del miedo (VIX): El índice de volatilidad Cboe se disparó un impresionante 69,7%, marcando su mayor incremento en dos años y reflejando una clara fase de pánico y rendición en el mercado general.
#IA #CryptoNews
$SPYB
$QQQB
$TSMB
El S&P 500 sufre una sangría histórica de 2.9 billones de dólares tras una ola masiva de liquidaciones
Pérdida récord de capitalización
El #SP500 evaporó aproximadamente 2.9 billones de dólares en un solo día, registrando la mayor destrucción de valor de mercado intradía de la historia.
Caídas no vistas desde el pánico del COVID:
El Índice de Semiconductores PHLX (SOX) se desplomó un 12,25% (-1.257,52 puntos) cerrando en 9.011,14, su peor jornada desde marzo de 2020.
El S&P 500 Tecnológico cayó un 7,3% y el Nasdaq-100 (NDX) cedió un 6,4%, rompiendo niveles clave de soporte.
Ruptura de tendencia y factor político: La victoria contundente de los demócratas en las elecciones de mitad de mandato encendió las alarmas por posibles regulaciones severas o paralizaciones en la construcción de centros de datos de IA. Gráficamente, el índice SOX rompió a la baja la línea de tendencia alcista de largo plazo que sostenía al mercado desde abril de 2025.
Efecto cascada y liquidaciones forzadas (Margin Calls): La corrección desencadenó un "desapalancamiento masivo". Los fondos de cobertura y traders apalancados sufrieron llamadas de margen que los obligaron a vender masivamente posiciones no solo en tech, sino también en sectores defensivos (salud y consumo básico) para cubrir pérdidas.
Explosión del índice del miedo (VIX): El índice de volatilidad Cboe se disparó un impresionante 69,7%, marcando su mayor incremento en dos años y reflejando una clara fase de pánico y rendición en el mercado general.
#IA #CryptoNews
$SPYB
$QQQB
$TSMB
5
2k

·
--
Падение
🚨 TECH STOCKS ARE GETTING DESTROYED! THE BEAR MARKET IS SPREADING. 📉
Wall Street is facing massive pressure, with major technology and crypto-related stocks suffering huge declines.
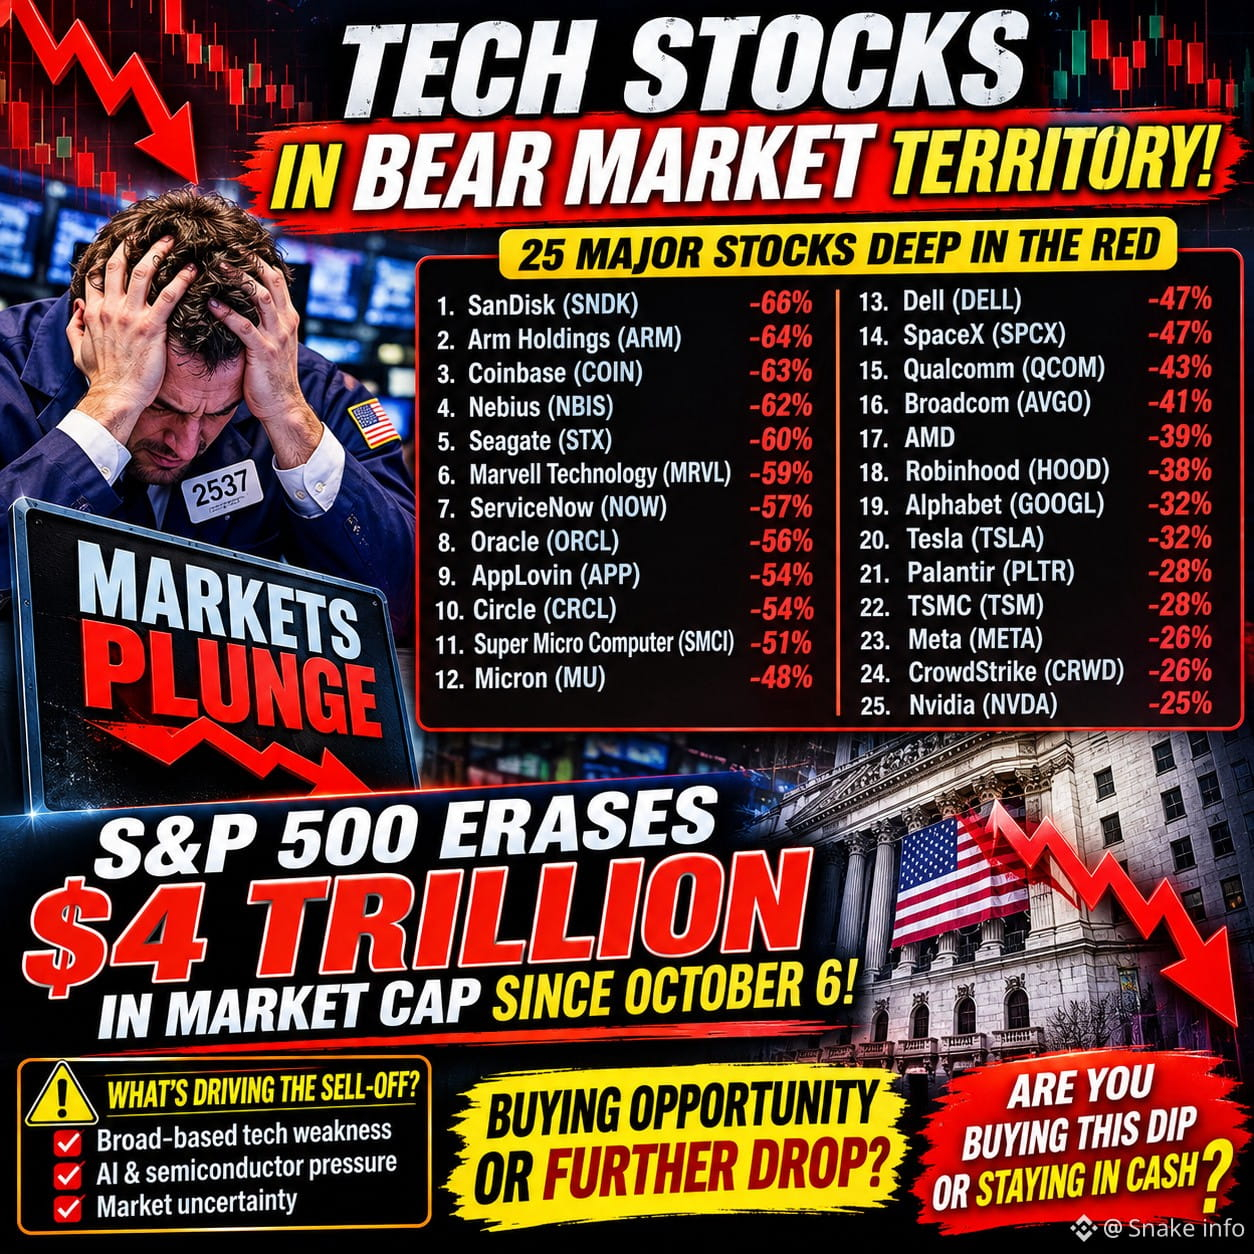
🔥 25 Major Stocks Deep in the Red:
🔻 SNDK (SanDisk): -66%
🔻 ARM (Arm Holdings): -64%
🔻 COIN (Coinbase): -63%
🔻 NBIS (Nebius): -62%
🔻 STX (Seagate): -60%
🔻 MRVL (Marvell): -59%
🔻 NOW (ServiceNow): -57%
🔻 ORCL (Oracle): -56%
🔻 APP (AppLovin): -54%
🔻 CRCL (Circle): -54%
🔻 SMCI (Super Micro): -51%
🔻 MU (Micron): -48%
🔻 DELL (Dell): -47%
🔻 SPCX (SpaceX): -47%
🔻 QCOM (Qualcomm): -43%
🔻 AVGO (Broadcom): -41%
🔻 AMD: -39%
🔻 HOOD (Robinhood): -38%
🔻 GOOGL (Alphabet): -32%
🔻 TSLA (Tesla): -32%
🔻 PLTR (Palantir): -28%
🔻 TSM (TSMC): -28%
🔻 META (Meta): -26%
🔻 CRWD (CrowdStrike): -26%
🔻 NVDA (Nvidia): -25%
💥 THE BIGGER PICTURE:
The S&P 500 has reportedly erased approximately $4 TRILLION in market capitalization since October 6.
⚠️ This is no longer just about one or two struggling companies. Selling pressure is spreading across semiconductors, AI, software, crypto-related stocks, and major technology companies.
📊 What Traders Should Watch:
Institutional buying and selling
Semiconductor sector recovery
Nasdaq and S&P 500 support levels
Bitcoin's reaction to US market weakness
🔥 BIG QUESTION:
Is this a major buying opportunity, or are we witnessing the beginning of a deeper tech market bear market?
Are you buying this dip or staying in cash? 👇
#StockMarket #TechStocks #NASDAQ #SP500
Not financial advice. DYOR.
CLICK TO BELOW TRADE👇
$TSLA $SPCX $GOOGL
{future}(GOOGLUSDT)
{future}(SPCXUSDT)
{future}(TSLAUSDT)
🚨 TECH STOCKS ARE GETTING DESTROYED! THE BEAR MARKET IS SPREADING. 📉
Wall Street is facing massive pressure, with major technology and crypto-related stocks suffering huge declines.
🔥 25 Major Stocks Deep in the Red:
🔻 SNDK (SanDisk): -66%
🔻 ARM (Arm Holdings): -64%
🔻 COIN (Coinbase): -63%
🔻 NBIS (Nebius): -62%
🔻 STX (Seagate): -60%
🔻 MRVL (Marvell): -59%
🔻 NOW (ServiceNow): -57%
🔻 ORCL (Oracle): -56%
🔻 APP (AppLovin): -54%
🔻 CRCL (Circle): -54%
🔻 SMCI (Super Micro): -51%
🔻 MU (Micron): -48%
🔻 DELL (Dell): -47%
🔻 SPCX (SpaceX): -47%
🔻 QCOM (Qualcomm): -43%
🔻 AVGO (Broadcom): -41%
🔻 AMD: -39%
🔻 HOOD (Robinhood): -38%
🔻 GOOGL (Alphabet): -32%
🔻 TSLA (Tesla): -32%
🔻 PLTR (Palantir): -28%
🔻 TSM (TSMC): -28%
🔻 META (Meta): -26%
🔻 CRWD (CrowdStrike): -26%
🔻 NVDA (Nvidia): -25%
💥 THE BIGGER PICTURE:
The S&P 500 has reportedly erased approximately $4 TRILLION in market capitalization since October 6.
⚠️ This is no longer just about one or two struggling companies. Selling pressure is spreading across semiconductors, AI, software, crypto-related stocks, and major technology companies.
📊 What Traders Should Watch:
Institutional buying and selling
Semiconductor sector recovery
Nasdaq and S&P 500 support levels
Bitcoin's reaction to US market weakness
🔥 BIG QUESTION:
Is this a major buying opportunity, or are we witnessing the beginning of a deeper tech market bear market?
Are you buying this dip or staying in cash? 👇
#StockMarket #TechStocks #NASDAQ #SP500
Not financial advice. DYOR.
CLICK TO BELOW TRADE👇
$TSLA $SPCX $GOOGL
Wall Street is facing massive pressure, with major technology and crypto-related stocks suffering huge declines.
🔥 25 Major Stocks Deep in the Red:
🔻 SNDK (SanDisk): -66%
🔻 ARM (Arm Holdings): -64%
🔻 COIN (Coinbase): -63%
🔻 NBIS (Nebius): -62%
🔻 STX (Seagate): -60%
🔻 MRVL (Marvell): -59%
🔻 NOW (ServiceNow): -57%
🔻 ORCL (Oracle): -56%
🔻 APP (AppLovin): -54%
🔻 CRCL (Circle): -54%
🔻 SMCI (Super Micro): -51%
🔻 MU (Micron): -48%
🔻 DELL (Dell): -47%
🔻 SPCX (SpaceX): -47%
🔻 QCOM (Qualcomm): -43%
🔻 AVGO (Broadcom): -41%
🔻 AMD: -39%
🔻 HOOD (Robinhood): -38%
🔻 GOOGL (Alphabet): -32%
🔻 TSLA (Tesla): -32%
🔻 PLTR (Palantir): -28%
🔻 TSM (TSMC): -28%
🔻 META (Meta): -26%
🔻 CRWD (CrowdStrike): -26%
🔻 NVDA (Nvidia): -25%
💥 THE BIGGER PICTURE:
The S&P 500 has reportedly erased approximately $4 TRILLION in market capitalization since October 6.
⚠️ This is no longer just about one or two struggling companies. Selling pressure is spreading across semiconductors, AI, software, crypto-related stocks, and major technology companies.
📊 What Traders Should Watch:
Institutional buying and selling
Semiconductor sector recovery
Nasdaq and S&P 500 support levels
Bitcoin's reaction to US market weakness
🔥 BIG QUESTION:
Is this a major buying opportunity, or are we witnessing the beginning of a deeper tech market bear market?
Are you buying this dip or staying in cash? 👇
#StockMarket #TechStocks #NASDAQ #SP500
Not financial advice. DYOR.
CLICK TO BELOW TRADE👇
$TSLA $SPCX $GOOGL
366
·
--
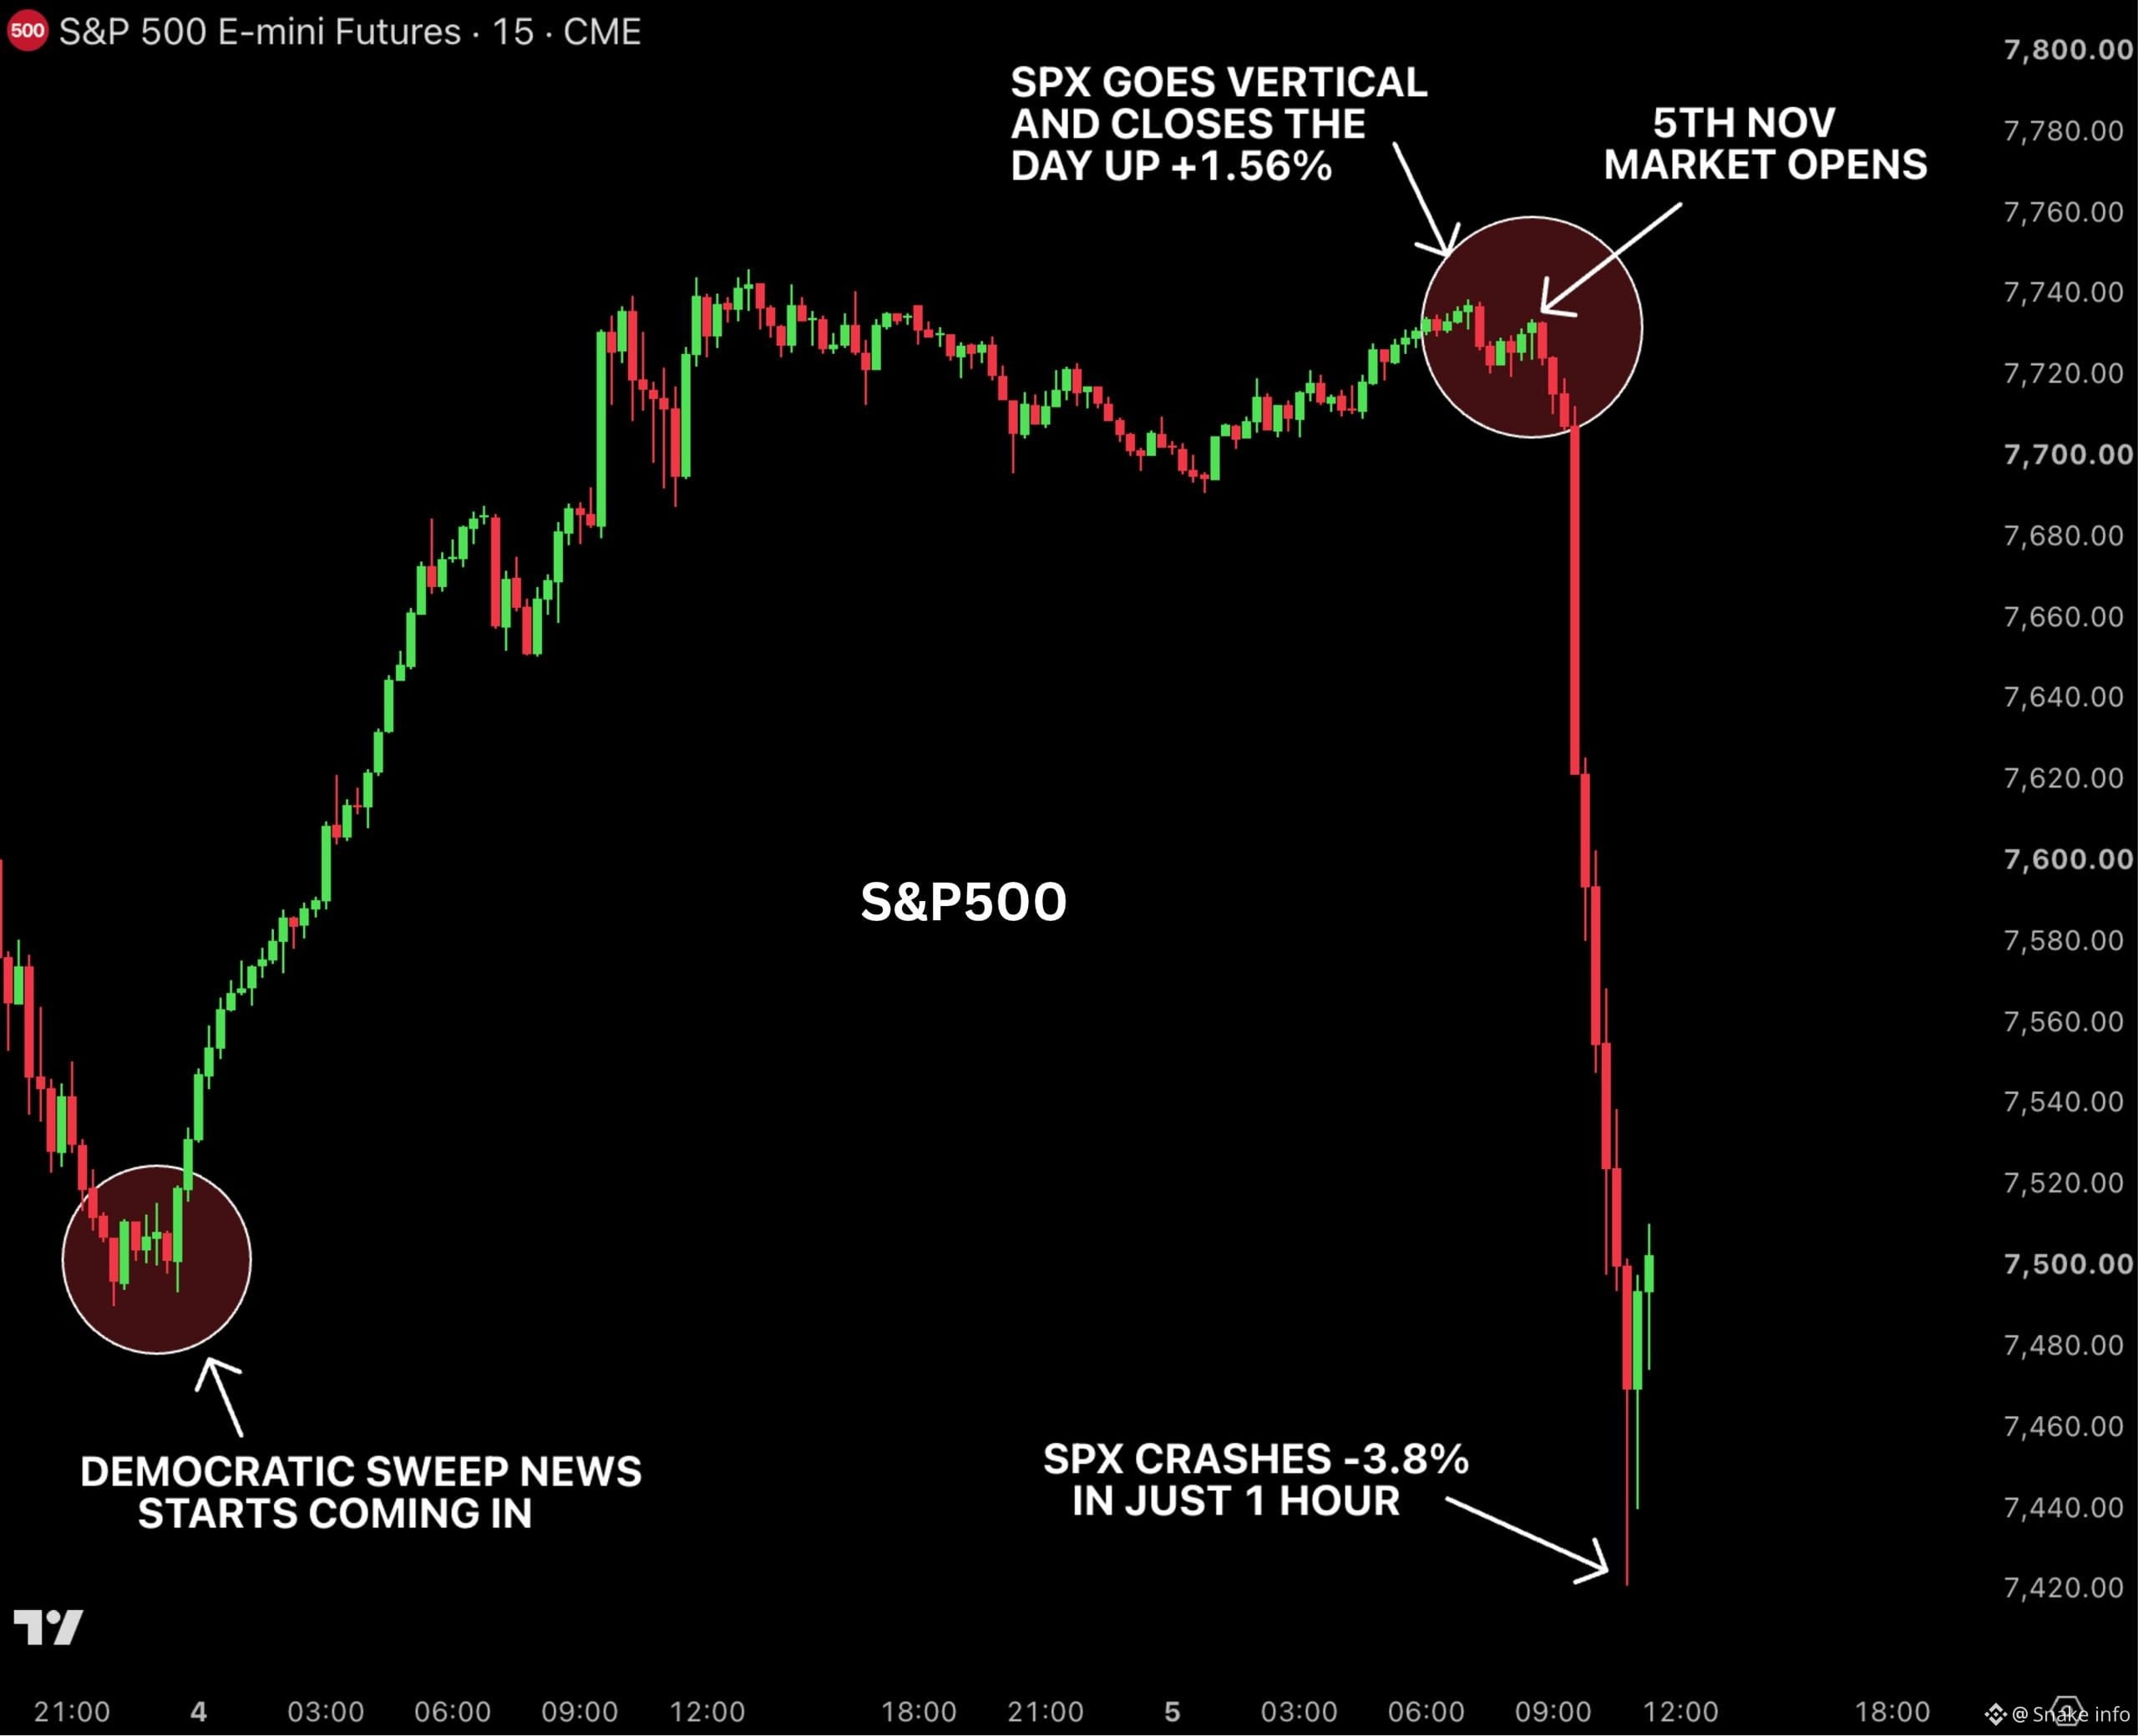
🚨 WAS YESTERDAY'S STOCK MARKET RALLY A PERFECT BULL TRAP?
Wall Street just delivered a shocking reversal. 📉
Here's what happened:
🇺🇸 Yesterday:
News broke that Democrats had won control of both the House and Senate.
Futures initially moved lower.
Then the S&P 500 suddenly surged.
The index closed up 1.56%, adding over $1 trillion in market value.
🔻 Today:
The S&P 500 plunged 3.84%.
Approximately $2.7 trillion in market value disappeared in just 90 minutes.
Yesterday's entire rally was wiped out.
⚠️ What Does This Mean?
The sudden reversal has raised questions about whether yesterday's rally attracted buyers just before a massive selloff.
Was it simply extreme market volatility, or did investors get caught in a classic bull trap?
🔥 One Thing Is Clear:
Markets can reverse direction faster than most traders expect.
📊 Watch liquidity, trading volume, institutional flows, and key support levels closely.
Did yesterday's rally create exit liquidity for bigger players? Or was this just a brutal market reversal?
What's your take? 👇
#StockMarket #SP500 #WallStreet #cryptomarket
Not financial advice. DYOR.
CLICK TO BELOW TRADE👇
$BTC $ETH $BNB
{future}(BNBUSDT)
{future}(ETHUSDT)
{future}(BTCUSDT)
🚨 WAS YESTERDAY'S STOCK MARKET RALLY A PERFECT BULL TRAP?
Wall Street just delivered a shocking reversal. 📉
Here's what happened:
🇺🇸 Yesterday:
News broke that Democrats had won control of both the House and Senate.
Futures initially moved lower.
Then the S&P 500 suddenly surged.
The index closed up 1.56%, adding over $1 trillion in market value.
🔻 Today:
The S&P 500 plunged 3.84%.
Approximately $2.7 trillion in market value disappeared in just 90 minutes.
Yesterday's entire rally was wiped out.
⚠️ What Does This Mean?
The sudden reversal has raised questions about whether yesterday's rally attracted buyers just before a massive selloff.
Was it simply extreme market volatility, or did investors get caught in a classic bull trap?
🔥 One Thing Is Clear:
Markets can reverse direction faster than most traders expect.
📊 Watch liquidity, trading volume, institutional flows, and key support levels closely.
Did yesterday's rally create exit liquidity for bigger players? Or was this just a brutal market reversal?
What's your take? 👇
#StockMarket #SP500 #WallStreet #cryptomarket
Not financial advice. DYOR.
CLICK TO BELOW TRADE👇
$BTC $ETH $BNB
Wall Street just delivered a shocking reversal. 📉
Here's what happened:
🇺🇸 Yesterday:
News broke that Democrats had won control of both the House and Senate.
Futures initially moved lower.
Then the S&P 500 suddenly surged.
The index closed up 1.56%, adding over $1 trillion in market value.
🔻 Today:
The S&P 500 plunged 3.84%.
Approximately $2.7 trillion in market value disappeared in just 90 minutes.
Yesterday's entire rally was wiped out.
⚠️ What Does This Mean?
The sudden reversal has raised questions about whether yesterday's rally attracted buyers just before a massive selloff.
Was it simply extreme market volatility, or did investors get caught in a classic bull trap?
🔥 One Thing Is Clear:
Markets can reverse direction faster than most traders expect.
📊 Watch liquidity, trading volume, institutional flows, and key support levels closely.
Did yesterday's rally create exit liquidity for bigger players? Or was this just a brutal market reversal?
What's your take? 👇
#StockMarket #SP500 #WallStreet #cryptomarket
Not financial advice. DYOR.
CLICK TO BELOW TRADE👇
$BTC $ETH $BNB
137
·
--
Падение
S&P 500 Rebounds — But Is the Market Too Comfortable?
⠀
The S&P 500 initially moved higher after Democrats won control of Congress, while the sharp drop in oil helped improve market sentiment.
⠀
But I think the market may be getting comfortable too quickly.
⠀
Geopolitical risk around Iran is still alive, Trump still holds broad foreign-policy authority, and another weekend is approaching.
⠀
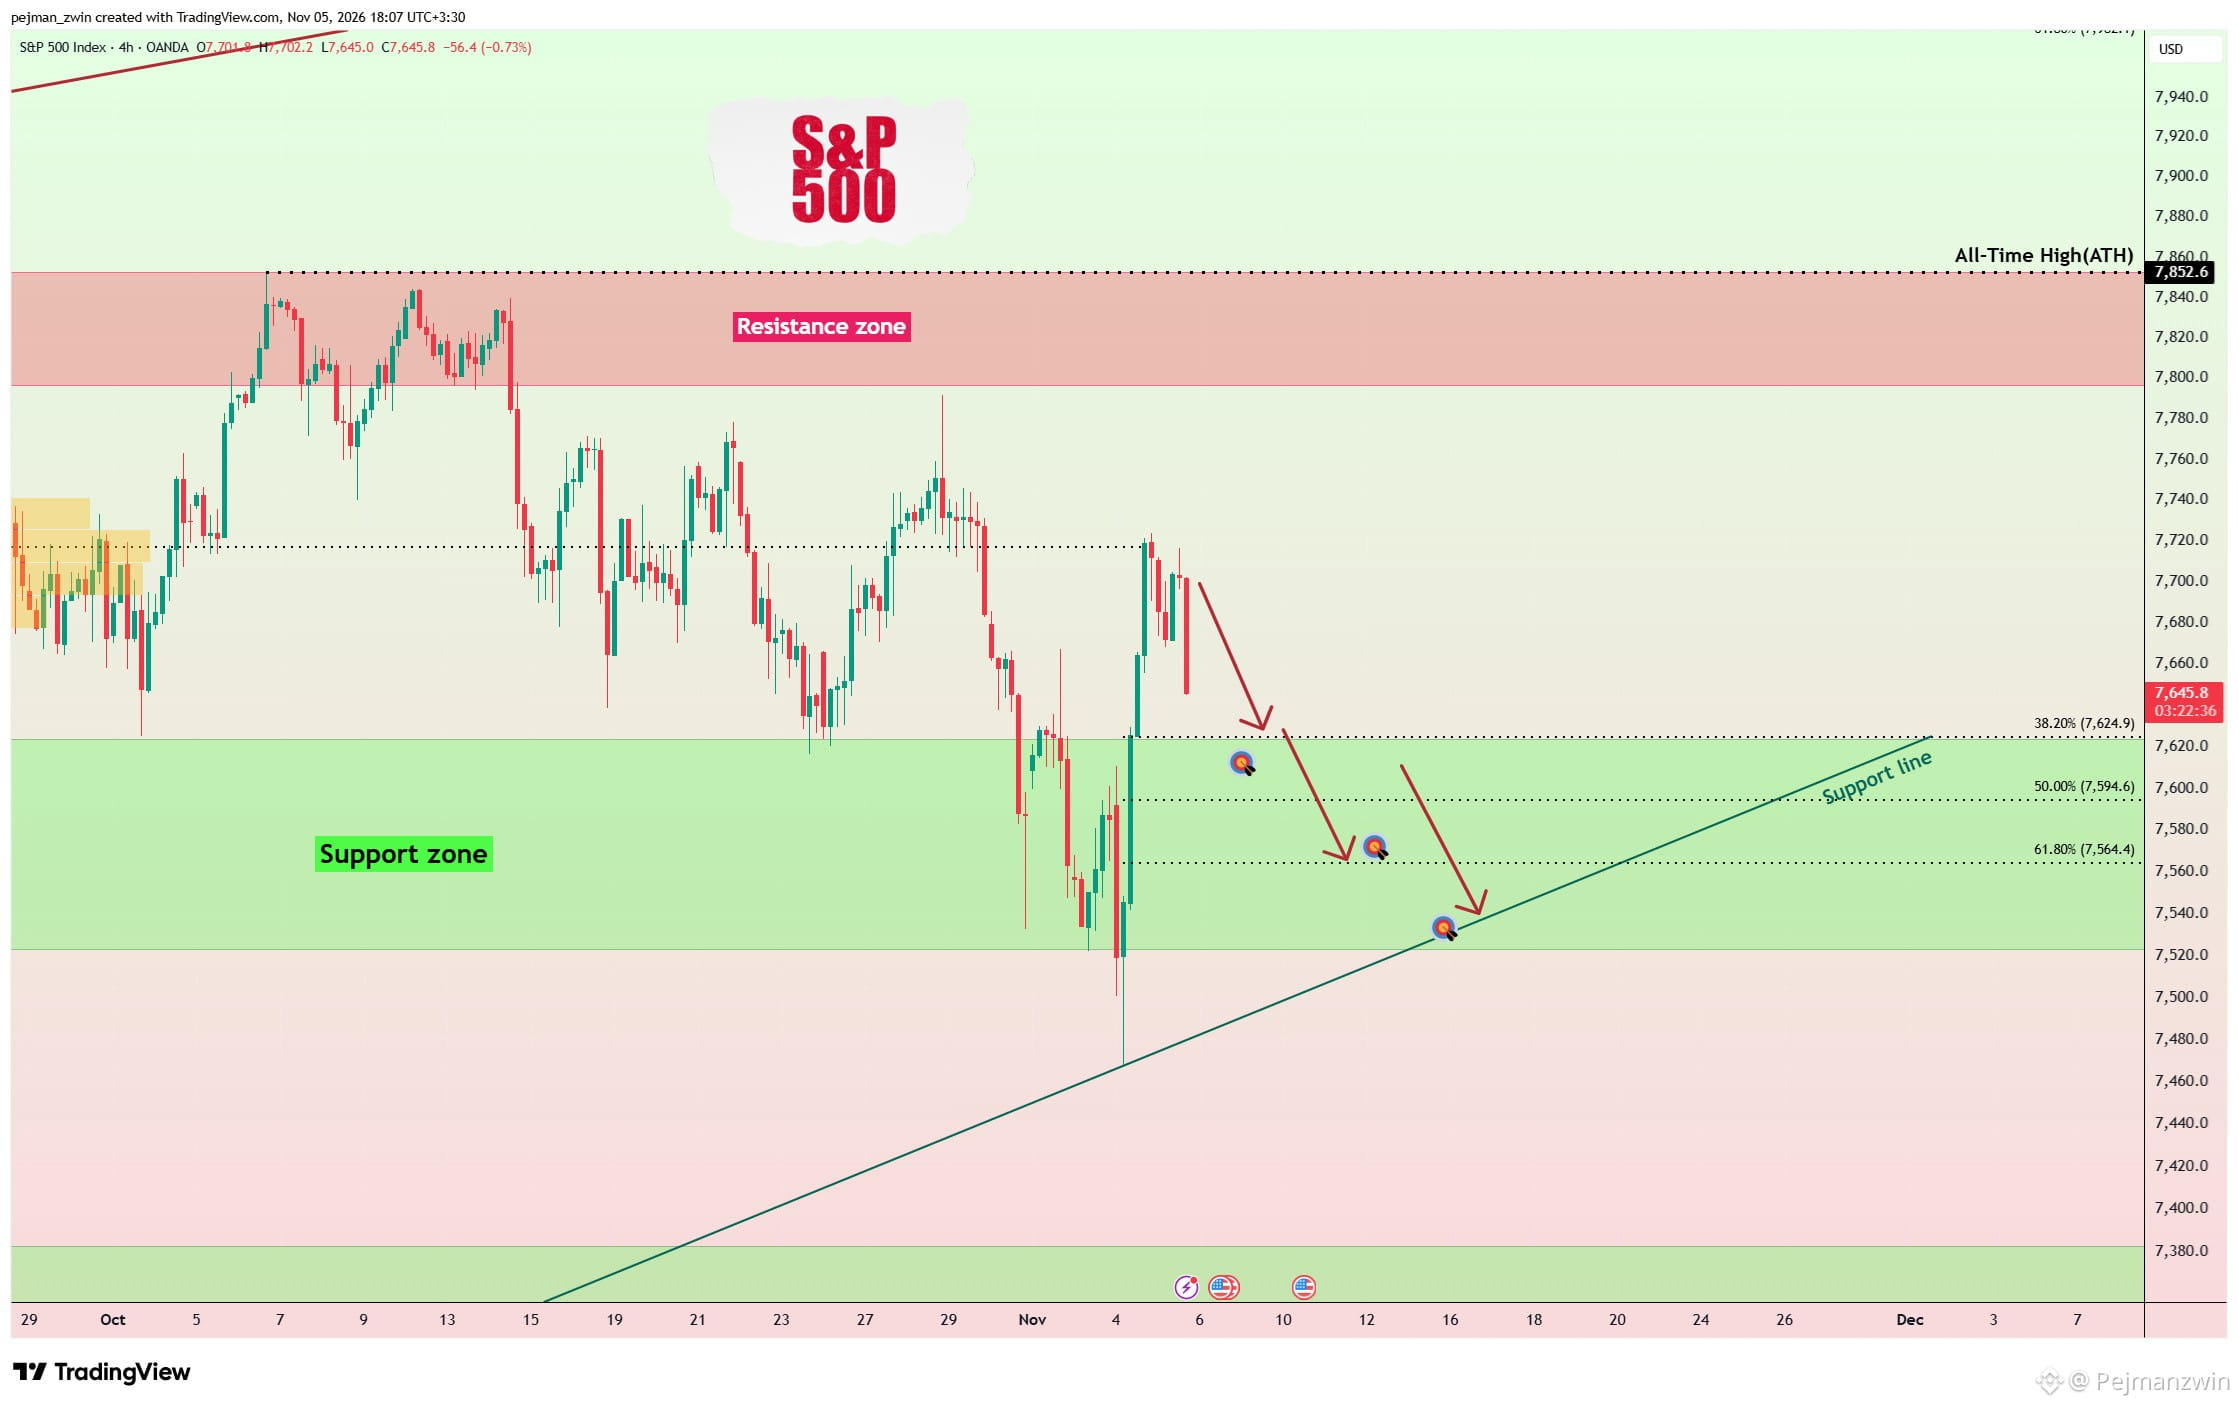
Technically, SPX is trading near the key 7,720 level.
⠀
If sellers return, I expect another move toward the Support Zone ($7,523-$7,624).
⠀
Trade Setup
⠀
TP: $7,553
SL: $7,732
Key Level: $7,720
⠀
For me, the next two days are more about risk management than chasing the recovery.
⠀
Do you think SPX holds above 7,720 — or does weekend risk send it back toward support?
⠀
#SP500
S&P 500 Rebounds — But Is the Market Too Comfortable?
⠀
The S&P 500 initially moved higher after Democrats won control of Congress, while the sharp drop in oil helped improve market sentiment.
⠀
But I think the market may be getting comfortable too quickly.
⠀
Geopolitical risk around Iran is still alive, Trump still holds broad foreign-policy authority, and another weekend is approaching.
⠀
Technically, SPX is trading near the key 7,720 level.
⠀
If sellers return, I expect another move toward the Support Zone ($7,523-$7,624).
⠀
Trade Setup
⠀
TP: $7,553
SL: $7,732
Key Level: $7,720
⠀
For me, the next two days are more about risk management than chasing the recovery.
⠀
Do you think SPX holds above 7,720 — or does weekend risk send it back toward support?
⠀
#SP500
⠀
The S&P 500 initially moved higher after Democrats won control of Congress, while the sharp drop in oil helped improve market sentiment.
⠀
But I think the market may be getting comfortable too quickly.
⠀
Geopolitical risk around Iran is still alive, Trump still holds broad foreign-policy authority, and another weekend is approaching.
⠀
Technically, SPX is trading near the key 7,720 level.
⠀
If sellers return, I expect another move toward the Support Zone ($7,523-$7,624).
⠀
Trade Setup
⠀
TP: $7,553
SL: $7,732
Key Level: $7,720
⠀
For me, the next two days are more about risk management than chasing the recovery.
⠀
Do you think SPX holds above 7,720 — or does weekend risk send it back toward support?
⠀
#SP500
1
474
·
--
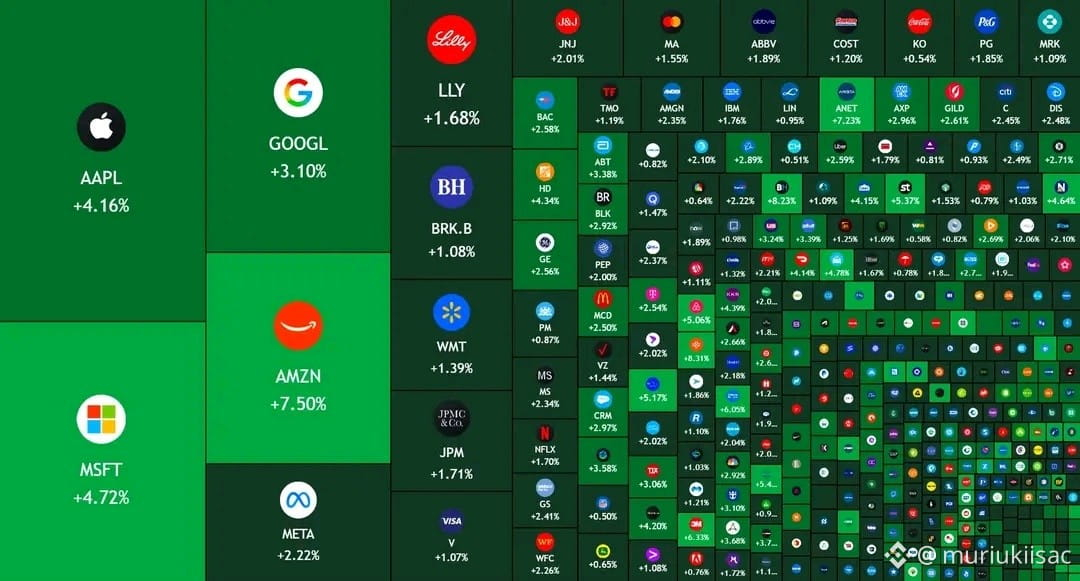
🚨 BREAKING: The S&P 500 hits 7,700, adding more than $1,100,000,000,000 in market capitalization today after Democrats take control of both the House and Senate.
#BTCRebounds80K
#SP500 #USMidterms-WhatAreMarketsExpecting? $SPCXB $AAPLB $MSFTB
🚨 BREAKING: The S&P 500 hits 7,700, adding more than $1,100,000,000,000 in market capitalization today after Democrats take control of both the House and Senate.
#BTCRebounds80K
#SP500 #USMidterms-WhatAreMarketsExpecting? $SPCXB $AAPLB $MSFTB
#BTCRebounds80K
#SP500 #USMidterms-WhatAreMarketsExpecting? $SPCXB $AAPLB $MSFTB
1
301

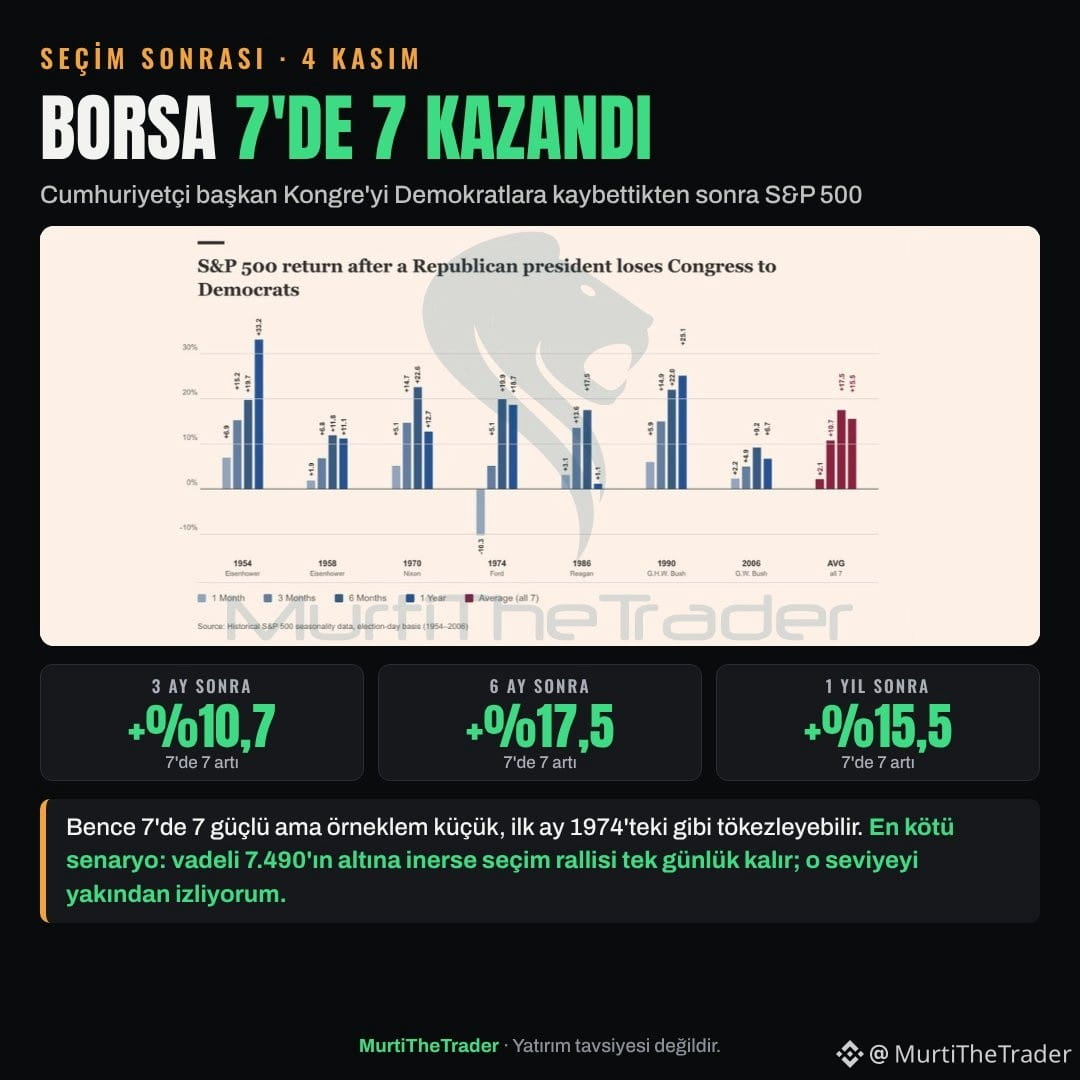
Post-election: Democrats took both chambers of Congress. In the previous 7 instances since 1954, the S&P 500 was higher one year later 7 out of 7 times.
→ Average: +10.7% in 3 months, +17.5% in 6 months, +15.5% in 1 year
→ First month positive in 6 of 7, with a double-digit drop in 1974
→ ES futures tagged 7,490 overnight, then flipped to +1.1%
My take: 7 for 7 is strong, but the sample is small, and the first month could stumble like 1974. Worst case: if futures drop below 7,490, the election rally lasts a single day. I'm watching that level closely.
#Investing #SP500
Post-election: Democrats took both chambers of Congress. In the previous 7 instances since 1954, the S&P 500 was higher one year later 7 out of 7 times.
→ Average: +10.7% in 3 months, +17.5% in 6 months, +15.5% in 1 year
→ First month positive in 6 of 7, with a double-digit drop in 1974
→ ES futures tagged 7,490 overnight, then flipped to +1.1%
My take: 7 for 7 is strong, but the sample is small, and the first month could stumble like 1974. Worst case: if futures drop below 7,490, the election rally lasts a single day. I'm watching that level closely.
#Investing #SP500
→ Average: +10.7% in 3 months, +17.5% in 6 months, +15.5% in 1 year
→ First month positive in 6 of 7, with a double-digit drop in 1974
→ ES futures tagged 7,490 overnight, then flipped to +1.1%
My take: 7 for 7 is strong, but the sample is small, and the first month could stumble like 1974. Worst case: if futures drop below 7,490, the election rally lasts a single day. I'm watching that level closely.
#Investing #SP500
1
128

·
--
🚀📈 FUERTE REBOTE DEL S&P 500 Y LOS ÍNDICES ESTADOUNIDENSES
📅 Miércoles 4 de noviembre de 2026
Wall Street protagoniza un importante giro alcista tras las elecciones de medio término en EE. UU.
🔎 ¿QUÉ ESTÁ IMPULSANDO LAS SUBIDAS?
🇺🇸 1. 🤝 TRUMP ACEPTA LOS RESULTADOS
El presidente ha reconocido los resultados, reduciendo los temores de una confrontación política prolongada. Esto ha contribuido a mejorar el sentimiento del mercado.
🏦 2. CAÍDA DE LAS RENTABILIDADES DE LOS BONOS
El retroceso de los rendimientos estadounidenses favorece las valoraciones bursátiles, especialmente en tecnología.
💻 3. RECUPERACIÓN TECNOLÓGICA
AMD destaca con fuertes subidas tras sus perspectivas de crecimiento, impulsando el optimismo en semiconductores.
📊 UN GIRO MUY IMPORTANTE
Los futuros del S&P 500 llegaron a caer cerca del 1,4% durante la madrugada, pero posteriormente se recuperaron hasta registrar subidas superiores al 1%.
🎯 CONCLUSIÓN
Estamos viendo un rebote de alivio tras las elecciones, acompañado de compras después de las recientes caídas.
⚠️ La clave será comprobar si el impulso se mantiene durante la sesión de Wall Street.
#SP500
🚀📈 FUERTE REBOTE DEL S&P 500 Y LOS ÍNDICES ESTADOUNIDENSES
📅 Miércoles 4 de noviembre de 2026
Wall Street protagoniza un importante giro alcista tras las elecciones de medio término en EE. UU.
🔎 ¿QUÉ ESTÁ IMPULSANDO LAS SUBIDAS?
🇺🇸 1. 🤝 TRUMP ACEPTA LOS RESULTADOS
El presidente ha reconocido los resultados, reduciendo los temores de una confrontación política prolongada. Esto ha contribuido a mejorar el sentimiento del mercado.
🏦 2. CAÍDA DE LAS RENTABILIDADES DE LOS BONOS
El retroceso de los rendimientos estadounidenses favorece las valoraciones bursátiles, especialmente en tecnología.
💻 3. RECUPERACIÓN TECNOLÓGICA
AMD destaca con fuertes subidas tras sus perspectivas de crecimiento, impulsando el optimismo en semiconductores.
📊 UN GIRO MUY IMPORTANTE
Los futuros del S&P 500 llegaron a caer cerca del 1,4% durante la madrugada, pero posteriormente se recuperaron hasta registrar subidas superiores al 1%.
🎯 CONCLUSIÓN
Estamos viendo un rebote de alivio tras las elecciones, acompañado de compras después de las recientes caídas.
⚠️ La clave será comprobar si el impulso se mantiene durante la sesión de Wall Street.
#SP500
📅 Miércoles 4 de noviembre de 2026
Wall Street protagoniza un importante giro alcista tras las elecciones de medio término en EE. UU.
🔎 ¿QUÉ ESTÁ IMPULSANDO LAS SUBIDAS?
🇺🇸 1. 🤝 TRUMP ACEPTA LOS RESULTADOS
El presidente ha reconocido los resultados, reduciendo los temores de una confrontación política prolongada. Esto ha contribuido a mejorar el sentimiento del mercado.
🏦 2. CAÍDA DE LAS RENTABILIDADES DE LOS BONOS
El retroceso de los rendimientos estadounidenses favorece las valoraciones bursátiles, especialmente en tecnología.
💻 3. RECUPERACIÓN TECNOLÓGICA
AMD destaca con fuertes subidas tras sus perspectivas de crecimiento, impulsando el optimismo en semiconductores.
📊 UN GIRO MUY IMPORTANTE
Los futuros del S&P 500 llegaron a caer cerca del 1,4% durante la madrugada, pero posteriormente se recuperaron hasta registrar subidas superiores al 1%.
🎯 CONCLUSIÓN
Estamos viendo un rebote de alivio tras las elecciones, acompañado de compras después de las recientes caídas.
⚠️ La clave será comprobar si el impulso se mantiene durante la sesión de Wall Street.
#SP500
1
105
·
--
Падение
S&P 500 Target Hit — Volatility Finally Respected the Levels
⠀
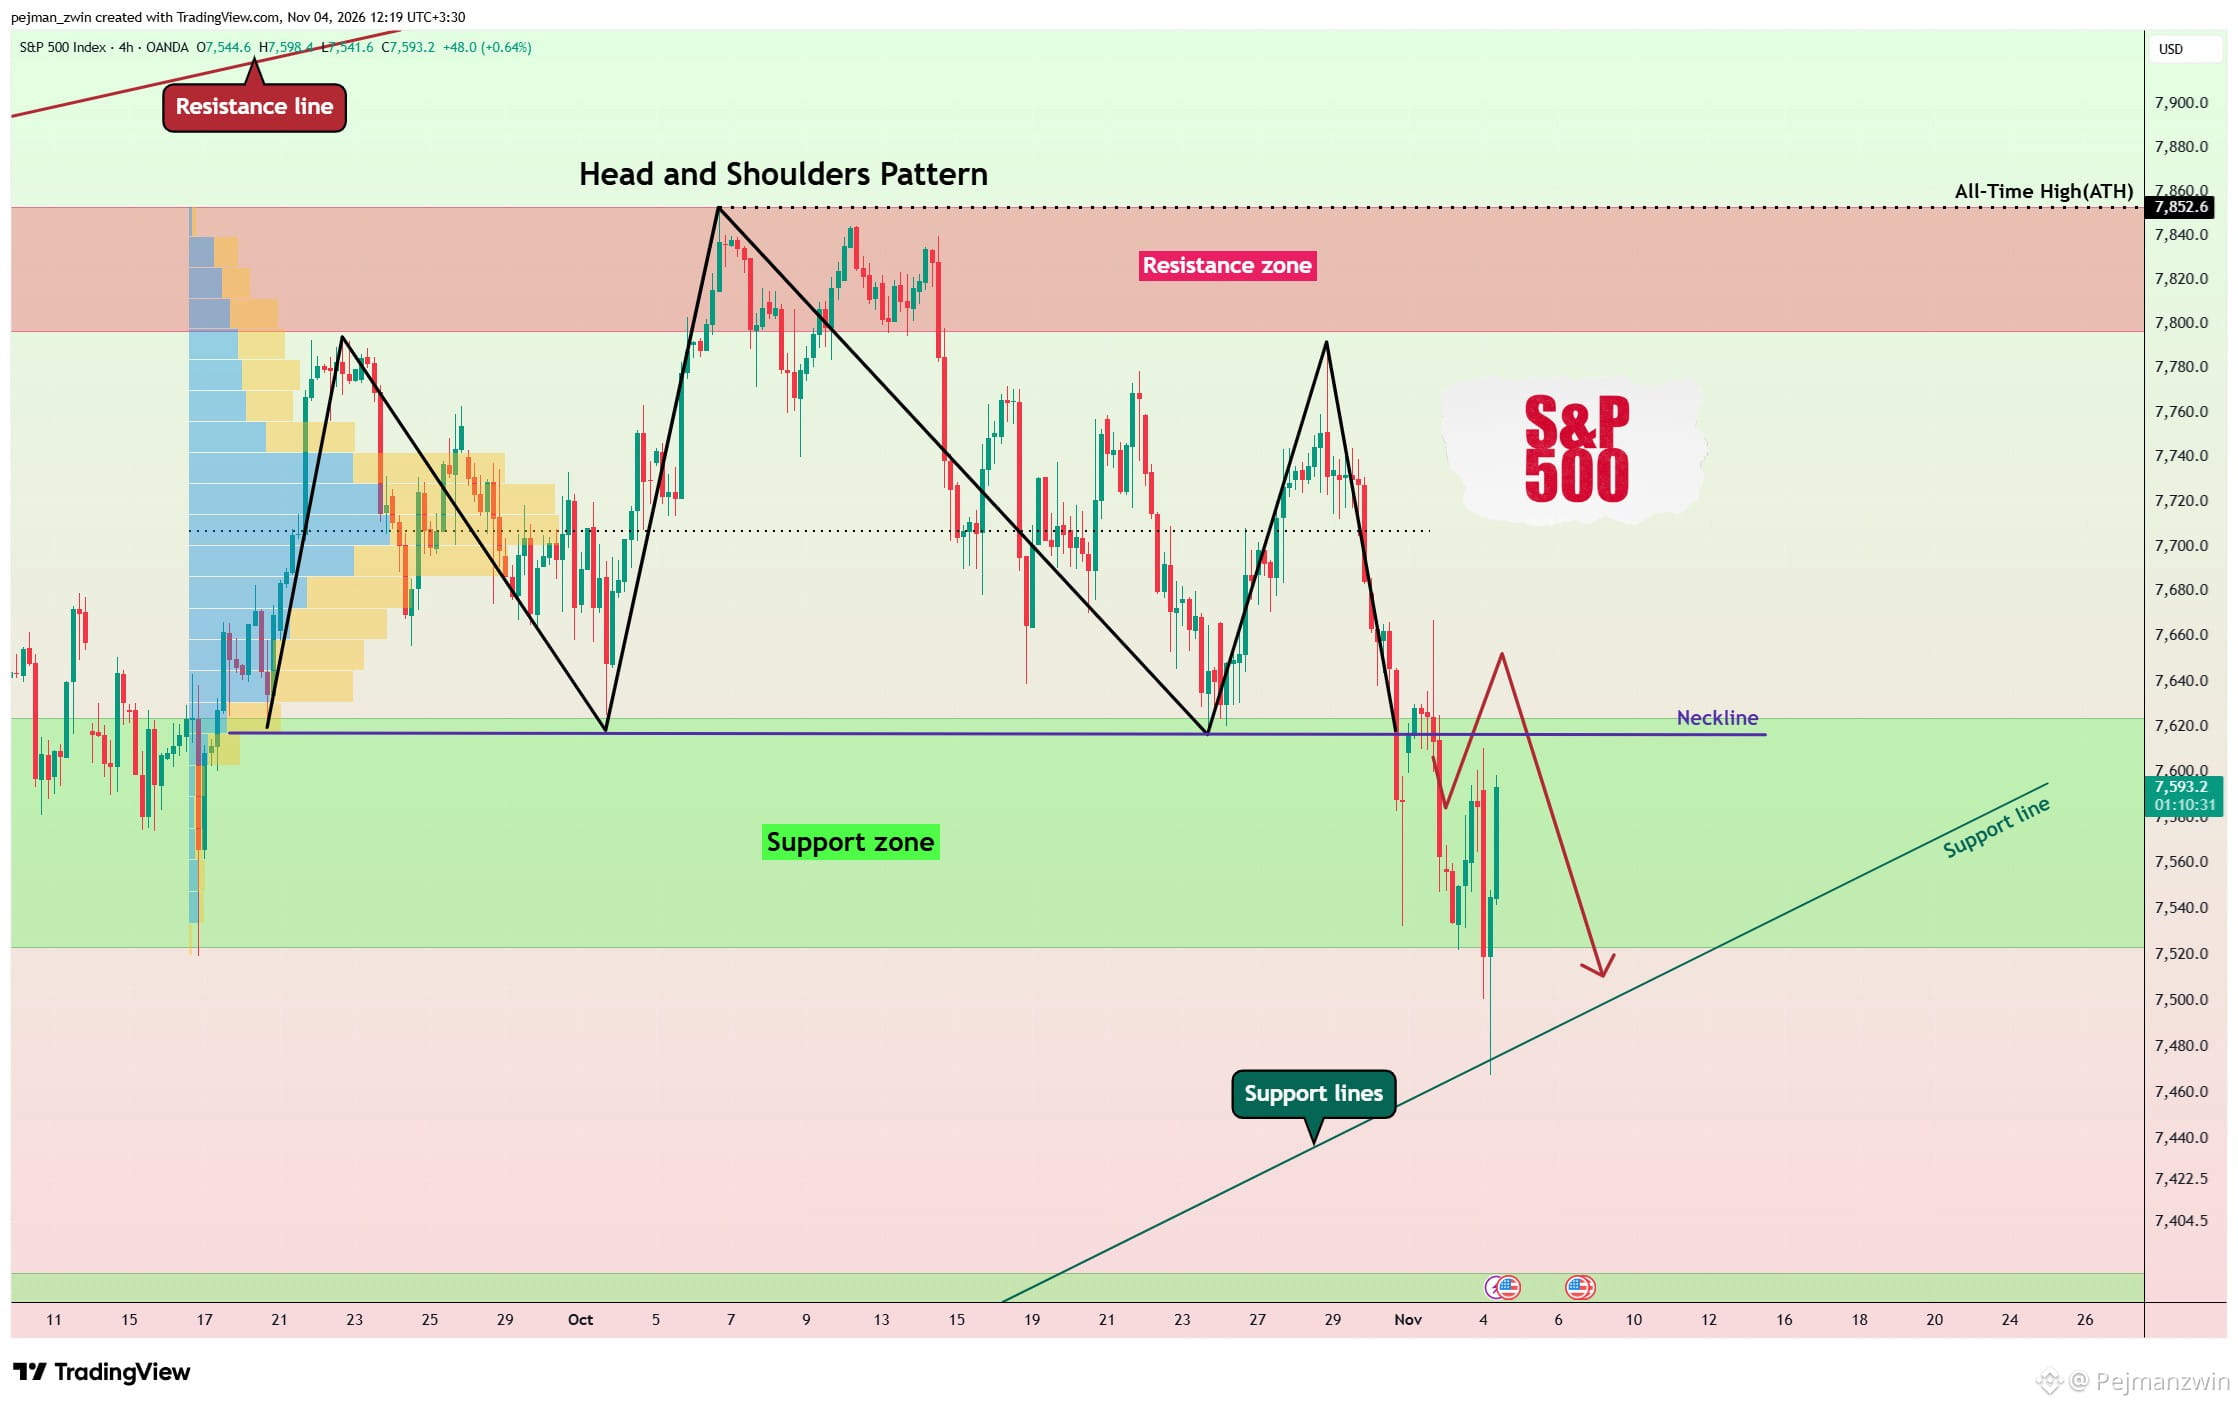
After several volatile sessions around the U.S. election, the S&P 500 finally reached my target.
⠀
SPX filled the lower gaps, reacted from the Support Line, and then started moving higher again.
⠀
This is exactly why I always combine market structure with major macro events.
⠀
Volatility can be aggressive, but the key technical areas still matter.
⠀
I hope this analysis helped you navigate the move and secure some profit.
⠀
What do you think comes next for the S&P 500 — continued recovery or another correction?
⠀
#SP500
S&P 500 Target Hit — Volatility Finally Respected the Levels
⠀
After several volatile sessions around the U.S. election, the S&P 500 finally reached my target.
⠀
SPX filled the lower gaps, reacted from the Support Line, and then started moving higher again.
⠀
This is exactly why I always combine market structure with major macro events.
⠀
Volatility can be aggressive, but the key technical areas still matter.
⠀
I hope this analysis helped you navigate the move and secure some profit.
⠀
What do you think comes next for the S&P 500 — continued recovery or another correction?
⠀
#SP500
⠀
After several volatile sessions around the U.S. election, the S&P 500 finally reached my target.
⠀
SPX filled the lower gaps, reacted from the Support Line, and then started moving higher again.
⠀
This is exactly why I always combine market structure with major macro events.
⠀
Volatility can be aggressive, but the key technical areas still matter.
⠀
I hope this analysis helped you navigate the move and secure some profit.
⠀
What do you think comes next for the S&P 500 — continued recovery or another correction?
⠀
#SP500
Pejmanzwin
·
--
S&P 500 at Major Support — Will the U.S. Midterms Trigger Another Sell-Off?
The S&P 500 came under strong pressure last week as technology stocks sold off sharply and investors became increasingly concerned about high valuations and the massive amount of capital being committed to AI.
⠀
Now another major catalyst is approaching.
⠀
The U.S. midterm elections take place tomorrow, November 3, and $SPX is entering the event while sitting directly on an important technical support structure.
⠀
For me, this makes the next 24-48 hours especially important.
⠀
Can buyers defend the current Support Zone, or is a move below $7,500 coming next?
⠀
Why the Market Came Under Pressure
⠀
The recent weakness was not simply about one bad economic report.
⠀
Technology and AI-related stocks became the main source of pressure as investors started questioning whether the enormous spending on data centers, chips, and AI infrastructure will generate sufficient returns.
⠀
The S&P 500 Technology sector fell 6.8% during October, while Friday alone brought another sharp 4.2% decline.
⠀
That selling pressure pushed the broader S&P 500 lower and left the market technically much more vulnerable heading into election week.
⠀
U.S. Midterm Elections — What Matters for the Market?
⠀
Election uncertainty is now being added to an already fragile market.
⠀
The latest polling favors Democrats nationally, and analysts currently see them as having a good chance of taking control of the House.
⠀
The Senate remains much more difficult to predict.
⠀
For markets, I do not think the story is simply “Democrats bearish, Republicans bullish.”
⠀
Each scenario has different implications.
⠀
A Democratic sweep could increase expectations for stronger congressional oversight of AI companies, data centers, crypto, and other industries.
⠀
That could create additional uncertainty for technology stocks at a time when the AI trade is already under pressure.
⠀
A Republican sweep could initially reduce concerns about aggressive new regulation and support expectations for tax or defense-policy continuity.
⠀
However, it could also revive concerns about larger fiscal deficits and Treasury yields.
⠀
A divided Congress may limit major policy changes, which markets have historically sometimes viewed positively because political gridlock can reduce the probability of large legislative surprises.
⠀
So for me, the biggest short-term risk is not simply which party wins.
⠀
It is whether the result surprises the market.
⠀
History After Midterm Elections
⠀
Historically, U.S. equities have often performed well after midterm elections.
⠀
Since 1938, the S&P 500 has posted gains during the following 12 months in approximately 95% of midterm cycles, with average returns around 14%.
⠀
One explanation is that election uncertainty begins to disappear once the result is known.
⠀
But history does not guarantee what happens tomorrow.
⠀
The current market is dealing with unusually high technology valuations, AI spending concerns, elevated Treasury yields, and geopolitical uncertainty.
⠀
That is why I am paying more attention to the chart than to historical averages.
⠀
Technical Analysis
⠀
On the 4-hour timeframe, the S&P 500 is attempting to break below the important Support Zone ($7,523-$7,624).
⠀
A small bullish Gap also formed around ($7,587.7-$7,599.4), and I believe this gap could still be filled during a short-term reaction.
⠀
But the larger technical structure remains more concerning.
⠀
From a classical technical analysis perspective, the S&P 500 appears to have formed a clear Head and Shoulders Pattern.
⠀
The Right Shoulder developed with strong bearish momentum toward the Neckline, and price is now testing this critical structure.
⠀
For me, the Neckline is the key.
⠀
As long as buyers cannot recover strongly from this area, the bearish pattern remains active.
⠀
Bearish Scenario
⠀
My main scenario is that election volatility could create sharp moves in both directions before the market chooses its next trend.
⠀
However, a confirmed breakdown below the current Support Zone and Head and Shoulders Neckline would significantly strengthen the bearish setup.
⠀
The first downside target would be the larger Gap ($7,483.6-$7,519.7).
⠀
That area also brings the market close to the psychological $7,500 level and an important Support Line.
⠀
This combination makes approximately $7,500 one of the most important areas I am watching.
⠀
If $7,500 fails with strong bearish momentum, the correction could develop into something deeper rather than remaining a simple election-driven shakeout.
⠀
Bullish Scenario
⠀
There is also a bullish scenario that I do not want to ignore.
⠀
If buyers successfully defend the Support Zone ($7,523-$7,624), fill the smaller Gap, and reclaim the broken structure with strong momentum, the Head and Shoulders breakdown could fail.
⠀
That type of failed breakdown during a high-volatility event could force short sellers to cover and create a sharp relief rally.
⠀
For me, confirmation matters more than trying to predict the election result itself.
⠀
Trade Setup
⠀
Take Profit: $7,519
⠀
Stop Loss: $7,690
⠀
Key Trading Levels:
$7,500
$7,708
⠀
Support Zone:
($7,523-$7,624)
⠀
Small Gap:
($7,587.7-$7,599.4)
⠀
Main Downside Gap:
($7,483.6-$7,519.7)
⠀
Impact on $BTC and $ETH
⠀
This setup is also important for the crypto market.
⠀
Bitcoin and Ethereum remain sensitive to changes in broader risk sentiment, particularly when U.S. equities experience sharp moves.
⠀
If the S&P 500 breaks support and technology stocks come under another wave of selling, I would expect that Risk-Off environment to increase pressure on Bitcoin and Ethereum as well.
⠀
On the other hand, if election uncertainty fades and U.S. equities produce a strong relief rally, crypto could also receive some short-term support.
⠀
My S&P 500 Outlook
⠀
For me, the story is straightforward.
⠀
The market entered election week already weakened by the technology sell-off.
⠀
Now the S&P 500 is sitting on an important Support Zone while a potential Head and Shoulders Pattern is threatening to break its Neckline.
⠀
A short-term reaction is possible, especially around the election.
⠀
But unless buyers successfully reclaim the structure, I continue to see a meaningful risk of a move toward the ($7,483.6-$7,519.7) Gap and the psychological $7,500 area.
⠀
Election results could create False Breakouts and aggressive moves in both directions, so I would rather react to confirmation than predict the first candle.
⠀
Which level will the S&P 500 reach first?
⠀
🔴 $7,519
🟢 $7,690
⠀
#SP500
⠀
Now another major catalyst is approaching.
⠀
The U.S. midterm elections take place tomorrow, November 3, and $SPX is entering the event while sitting directly on an important technical support structure.
⠀
For me, this makes the next 24-48 hours especially important.
⠀
Can buyers defend the current Support Zone, or is a move below $7,500 coming next?
⠀
Why the Market Came Under Pressure
⠀
The recent weakness was not simply about one bad economic report.
⠀
Technology and AI-related stocks became the main source of pressure as investors started questioning whether the enormous spending on data centers, chips, and AI infrastructure will generate sufficient returns.
⠀
The S&P 500 Technology sector fell 6.8% during October, while Friday alone brought another sharp 4.2% decline.
⠀
That selling pressure pushed the broader S&P 500 lower and left the market technically much more vulnerable heading into election week.
⠀
U.S. Midterm Elections — What Matters for the Market?
⠀
Election uncertainty is now being added to an already fragile market.
⠀
The latest polling favors Democrats nationally, and analysts currently see them as having a good chance of taking control of the House.
⠀
The Senate remains much more difficult to predict.
⠀
For markets, I do not think the story is simply “Democrats bearish, Republicans bullish.”
⠀
Each scenario has different implications.
⠀
A Democratic sweep could increase expectations for stronger congressional oversight of AI companies, data centers, crypto, and other industries.
⠀
That could create additional uncertainty for technology stocks at a time when the AI trade is already under pressure.
⠀
A Republican sweep could initially reduce concerns about aggressive new regulation and support expectations for tax or defense-policy continuity.
⠀
However, it could also revive concerns about larger fiscal deficits and Treasury yields.
⠀
A divided Congress may limit major policy changes, which markets have historically sometimes viewed positively because political gridlock can reduce the probability of large legislative surprises.
⠀
So for me, the biggest short-term risk is not simply which party wins.
⠀
It is whether the result surprises the market.
⠀
History After Midterm Elections
⠀
Historically, U.S. equities have often performed well after midterm elections.
⠀
Since 1938, the S&P 500 has posted gains during the following 12 months in approximately 95% of midterm cycles, with average returns around 14%.
⠀
One explanation is that election uncertainty begins to disappear once the result is known.
⠀
But history does not guarantee what happens tomorrow.
⠀
The current market is dealing with unusually high technology valuations, AI spending concerns, elevated Treasury yields, and geopolitical uncertainty.
⠀
That is why I am paying more attention to the chart than to historical averages.
⠀
Technical Analysis
⠀
On the 4-hour timeframe, the S&P 500 is attempting to break below the important Support Zone ($7,523-$7,624).
⠀
A small bullish Gap also formed around ($7,587.7-$7,599.4), and I believe this gap could still be filled during a short-term reaction.
⠀
But the larger technical structure remains more concerning.
⠀
From a classical technical analysis perspective, the S&P 500 appears to have formed a clear Head and Shoulders Pattern.
⠀
The Right Shoulder developed with strong bearish momentum toward the Neckline, and price is now testing this critical structure.
⠀
For me, the Neckline is the key.
⠀
As long as buyers cannot recover strongly from this area, the bearish pattern remains active.
⠀
Bearish Scenario
⠀
My main scenario is that election volatility could create sharp moves in both directions before the market chooses its next trend.
⠀
However, a confirmed breakdown below the current Support Zone and Head and Shoulders Neckline would significantly strengthen the bearish setup.
⠀
The first downside target would be the larger Gap ($7,483.6-$7,519.7).
⠀
That area also brings the market close to the psychological $7,500 level and an important Support Line.
⠀
This combination makes approximately $7,500 one of the most important areas I am watching.
⠀
If $7,500 fails with strong bearish momentum, the correction could develop into something deeper rather than remaining a simple election-driven shakeout.
⠀
Bullish Scenario
⠀
There is also a bullish scenario that I do not want to ignore.
⠀
If buyers successfully defend the Support Zone ($7,523-$7,624), fill the smaller Gap, and reclaim the broken structure with strong momentum, the Head and Shoulders breakdown could fail.
⠀
That type of failed breakdown during a high-volatility event could force short sellers to cover and create a sharp relief rally.
⠀
For me, confirmation matters more than trying to predict the election result itself.
⠀
Trade Setup
⠀
Take Profit: $7,519
⠀
Stop Loss: $7,690
⠀
Key Trading Levels:
$7,500
$7,708
⠀
Support Zone:
($7,523-$7,624)
⠀
Small Gap:
($7,587.7-$7,599.4)
⠀
Main Downside Gap:
($7,483.6-$7,519.7)
⠀
Impact on $BTC and $ETH
⠀
This setup is also important for the crypto market.
⠀
Bitcoin and Ethereum remain sensitive to changes in broader risk sentiment, particularly when U.S. equities experience sharp moves.
⠀
If the S&P 500 breaks support and technology stocks come under another wave of selling, I would expect that Risk-Off environment to increase pressure on Bitcoin and Ethereum as well.
⠀
On the other hand, if election uncertainty fades and U.S. equities produce a strong relief rally, crypto could also receive some short-term support.
⠀
My S&P 500 Outlook
⠀
For me, the story is straightforward.
⠀
The market entered election week already weakened by the technology sell-off.
⠀
Now the S&P 500 is sitting on an important Support Zone while a potential Head and Shoulders Pattern is threatening to break its Neckline.
⠀
A short-term reaction is possible, especially around the election.
⠀
But unless buyers successfully reclaim the structure, I continue to see a meaningful risk of a move toward the ($7,483.6-$7,519.7) Gap and the psychological $7,500 area.
⠀
Election results could create False Breakouts and aggressive moves in both directions, so I would rather react to confirmation than predict the first candle.
⠀
Which level will the S&P 500 reach first?
⠀
🔴 $7,519
🟢 $7,690
⠀
#SP500
1
461

·
--
Падение
🇺🇸 WALL STREET: TECH SELLOFF WEIGHS ON NASDAQ AND S&P 500
U.S. markets closed mixed as renewed selling in major technology stocks wiped out earlier gains.
📉 Nasdaq: Fell over 1%
📉 S&P 500: Dropped approximately 0.5%
📈 Dow Jones: Gained around 0.4%
Investors shifted away from mega-cap technology stocks, raising concerns about stretched valuations, AI investment returns and broader market sentiment.
Market outlook: Will traditional blue-chip stocks continue outperforming technology shares, or is this just a temporary rotation?
#WallStreet #Nasdaq #SP500 #DowJones #TechStocks #GlobalMarkets #PositiveMindsGlobalResults [ ](https://www.binance.com/square/hashtag/PositiveMindsGlobalResults)#BinanceSquare
🌍 PositiveMindsGlobalResults | Binance Square
INVEST • LEARN • GROW • TOGETHER
🌍 Stay positive. Stay informed. Stay secure!
{spot}(BNBUSDT)
🇺🇸 WALL STREET: TECH SELLOFF WEIGHS ON NASDAQ AND S&P 500
U.S. markets closed mixed as renewed selling in major technology stocks wiped out earlier gains.
📉 Nasdaq: Fell over 1%
📉 S&P 500: Dropped approximately 0.5%
📈 Dow Jones: Gained around 0.4%
Investors shifted away from mega-cap technology stocks, raising concerns about stretched valuations, AI investment returns and broader market sentiment.
Market outlook: Will traditional blue-chip stocks continue outperforming technology shares, or is this just a temporary rotation?
#WallStreet #Nasdaq #SP500 #DowJones #TechStocks #GlobalMarkets #PositiveMindsGlobalResults #BinanceSquare
🌍 PositiveMindsGlobalResults | Binance Square
INVEST • LEARN • GROW • TOGETHER
🌍 Stay positive. Stay informed. Stay secure!
U.S. markets closed mixed as renewed selling in major technology stocks wiped out earlier gains.
📉 Nasdaq: Fell over 1%
📉 S&P 500: Dropped approximately 0.5%
📈 Dow Jones: Gained around 0.4%
Investors shifted away from mega-cap technology stocks, raising concerns about stretched valuations, AI investment returns and broader market sentiment.
Market outlook: Will traditional blue-chip stocks continue outperforming technology shares, or is this just a temporary rotation?
#WallStreet #Nasdaq #SP500 #DowJones #TechStocks #GlobalMarkets #PositiveMindsGlobalResults #BinanceSquare
🌍 PositiveMindsGlobalResults | Binance Square
INVEST • LEARN • GROW • TOGETHER
🌍 Stay positive. Stay informed. Stay secure!
34

·
--

Статья
🚨 US500 BEARISH — BUT IS A RECOVERY COMING?{future}(XAUUSDT)
🚨 US500 BEARISH — BUT IS A RECOVERY COMING?
The S&P 500 remains below its key EMAs, with RSI at 34.61 and MACD negative.
But there's a twist:
- NAS100: -0.69%
- US30: +0.69%
- VIX: -2.63%
AI spending concerns, US midterm elections and inflation pressure remain key market drivers.
MarketLens Take: Bearish pressure remains, but broad-market confirmation is mixed.
Key levels: Support 7,561 | Pivot 7,601 | Resistance 7,610–7,626.
Will sellers break support, or will buyers step back in?
— MARKETLENS | SEE BEYOND THE PRICE.
#MarketLens #US500 #SP500 #WallStreet #MarketAnalysis
{etf_us}(SQQQ.ETF)
🚨 US500 BEARISH — BUT IS A RECOVERY COMING?
🚨 US500 BEARISH — BUT IS A RECOVERY COMING?
The S&P 500 remains below its key EMAs, with RSI at 34.61 and MACD negative.
But there's a twist:
- NAS100: -0.69%
- US30: +0.69%
- VIX: -2.63%
AI spending concerns, US midterm elections and inflation pressure remain key market drivers.
MarketLens Take: Bearish pressure remains, but broad-market confirmation is mixed.
Key levels: Support 7,561 | Pivot 7,601 | Resistance 7,610–7,626.
Will sellers break support, or will buyers step back in?
— MARKETLENS | SEE BEYOND THE PRICE.
#MarketLens #US500 #SP500 #WallStreet #MarketAnalysis
The S&P 500 remains below its key EMAs, with RSI at 34.61 and MACD negative.
But there's a twist:
- NAS100: -0.69%
- US30: +0.69%
- VIX: -2.63%
AI spending concerns, US midterm elections and inflation pressure remain key market drivers.
MarketLens Take: Bearish pressure remains, but broad-market confirmation is mixed.
Key levels: Support 7,561 | Pivot 7,601 | Resistance 7,610–7,626.
Will sellers break support, or will buyers step back in?
— MARKETLENS | SEE BEYOND THE PRICE.
#MarketLens #US500 #SP500 #WallStreet #MarketAnalysis
XAU-1,53%
SQQQETF+0,97%
1
200
·
--
Проверено
Статья
S&P 500 at Major Support — Will the U.S. Midterms Trigger Another Sell-Off?The S&P 500 came under strong pressure last week as technology stocks sold off sharply and investors became increasingly concerned about high valuations and the massive amount of capital being committed to AI.
⠀
Now another major catalyst is approaching.
⠀
The U.S. midterm elections take place tomorrow, November 3, and $SPX is entering the event while sitting directly on an important technical support structure.
⠀
For me, this makes the next 24-48 hours especially important.
⠀
Can buyers defend the current Support Zone, or is a move below $7,500 coming next?
⠀
Why the Market Came Under Pressure
⠀
The recent weakness was not simply about one bad economic report.
⠀
Technology and AI-related stocks became the main source of pressure as investors started questioning whether the enormous spending on data centers, chips, and AI infrastructure will generate sufficient returns.
⠀
The S&P 500 Technology sector fell 6.8% during October, while Friday alone brought another sharp 4.2% decline.
⠀
That selling pressure pushed the broader S&P 500 lower and left the market technically much more vulnerable heading into election week.
⠀
U.S. Midterm Elections — What Matters for the Market?
⠀
Election uncertainty is now being added to an already fragile market.
⠀
The latest polling favors Democrats nationally, and analysts currently see them as having a good chance of taking control of the House.
⠀
The Senate remains much more difficult to predict.
⠀
For markets, I do not think the story is simply “Democrats bearish, Republicans bullish.”
⠀
Each scenario has different implications.
⠀
A Democratic sweep could increase expectations for stronger congressional oversight of AI companies, data centers, crypto, and other industries.
⠀
That could create additional uncertainty for technology stocks at a time when the AI trade is already under pressure.
⠀
A Republican sweep could initially reduce concerns about aggressive new regulation and support expectations for tax or defense-policy continuity.
⠀
However, it could also revive concerns about larger fiscal deficits and Treasury yields.
⠀
A divided Congress may limit major policy changes, which markets have historically sometimes viewed positively because political gridlock can reduce the probability of large legislative surprises.
⠀
So for me, the biggest short-term risk is not simply which party wins.
⠀
It is whether the result surprises the market.
⠀
History After Midterm Elections
⠀
Historically, U.S. equities have often performed well after midterm elections.
⠀
Since 1938, the S&P 500 has posted gains during the following 12 months in approximately 95% of midterm cycles, with average returns around 14%.
⠀
One explanation is that election uncertainty begins to disappear once the result is known.
⠀
But history does not guarantee what happens tomorrow.
⠀
The current market is dealing with unusually high technology valuations, AI spending concerns, elevated Treasury yields, and geopolitical uncertainty.
⠀
That is why I am paying more attention to the chart than to historical averages.
⠀
Technical Analysis
⠀
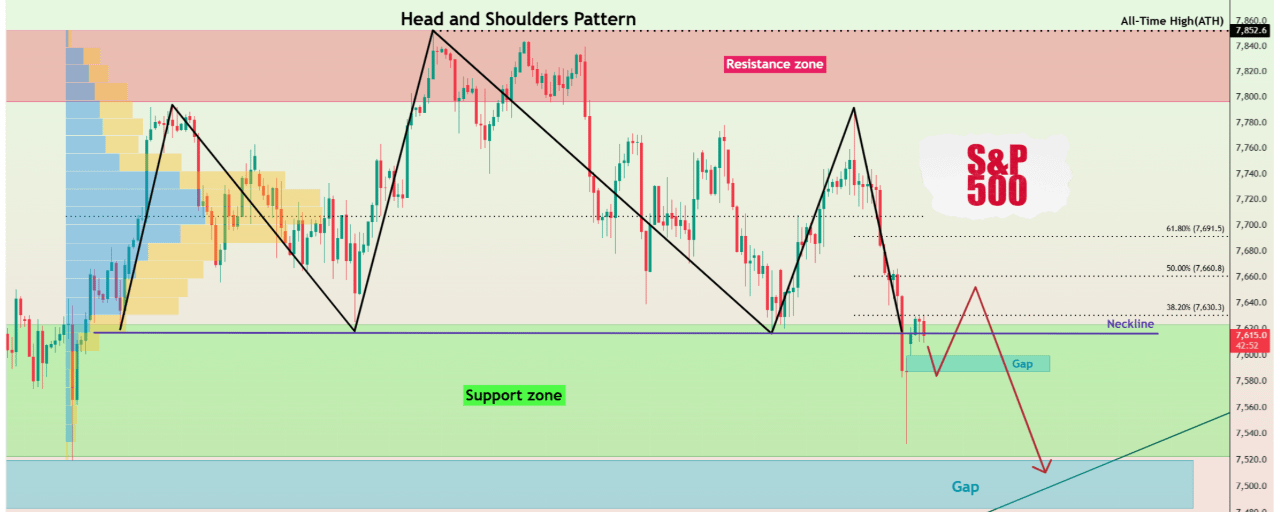
On the 4-hour timeframe, the S&P 500 is attempting to break below the important Support Zone ($7,523-$7,624).
⠀
A small bullish Gap also formed around ($7,587.7-$7,599.4), and I believe this gap could still be filled during a short-term reaction.
⠀
But the larger technical structure remains more concerning.
⠀
From a classical technical analysis perspective, the S&P 500 appears to have formed a clear Head and Shoulders Pattern.
⠀
The Right Shoulder developed with strong bearish momentum toward the Neckline, and price is now testing this critical structure.
⠀
For me, the Neckline is the key.
⠀
As long as buyers cannot recover strongly from this area, the bearish pattern remains active.
⠀
Bearish Scenario
⠀
My main scenario is that election volatility could create sharp moves in both directions before the market chooses its next trend.
⠀
However, a confirmed breakdown below the current Support Zone and Head and Shoulders Neckline would significantly strengthen the bearish setup.
⠀
The first downside target would be the larger Gap ($7,483.6-$7,519.7).
⠀
That area also brings the market close to the psychological $7,500 level and an important Support Line.
⠀
This combination makes approximately $7,500 one of the most important areas I am watching.
⠀
If $7,500 fails with strong bearish momentum, the correction could develop into something deeper rather than remaining a simple election-driven shakeout.
⠀
Bullish Scenario
⠀
There is also a bullish scenario that I do not want to ignore.
⠀
If buyers successfully defend the Support Zone ($7,523-$7,624), fill the smaller Gap, and reclaim the broken structure with strong momentum, the Head and Shoulders breakdown could fail.
⠀
That type of failed breakdown during a high-volatility event could force short sellers to cover and create a sharp relief rally.
⠀
For me, confirmation matters more than trying to predict the election result itself.
⠀
Trade Setup
⠀
Take Profit: $7,519
⠀
Stop Loss: $7,690
⠀
Key Trading Levels:
$7,500
$7,708
⠀
Support Zone:
($7,523-$7,624)
⠀
Small Gap:
($7,587.7-$7,599.4)
⠀
Main Downside Gap:
($7,483.6-$7,519.7)
⠀
Impact on $BTC and $ETH
⠀
This setup is also important for the crypto market.
⠀
Bitcoin and Ethereum remain sensitive to changes in broader risk sentiment, particularly when U.S. equities experience sharp moves.
⠀
If the S&P 500 breaks support and technology stocks come under another wave of selling, I would expect that Risk-Off environment to increase pressure on Bitcoin and Ethereum as well.
⠀
On the other hand, if election uncertainty fades and U.S. equities produce a strong relief rally, crypto could also receive some short-term support.
⠀
My S&P 500 Outlook
⠀
For me, the story is straightforward.
⠀
The market entered election week already weakened by the technology sell-off.
⠀
Now the S&P 500 is sitting on an important Support Zone while a potential Head and Shoulders Pattern is threatening to break its Neckline.
⠀
A short-term reaction is possible, especially around the election.
⠀
But unless buyers successfully reclaim the structure, I continue to see a meaningful risk of a move toward the ($7,483.6-$7,519.7) Gap and the psychological $7,500 area.
⠀
Election results could create False Breakouts and aggressive moves in both directions, so I would rather react to confirmation than predict the first candle.
⠀
Which level will the S&P 500 reach first?
⠀
🔴 $7,519
🟢 $7,690
⠀
#SP500
S&P 500 at Major Support — Will the U.S. Midterms Trigger Another Sell-Off?
The S&P 500 came under strong pressure last week as technology stocks sold off sharply and investors became increasingly concerned about high valuations and the massive amount of capital being committed to AI.
⠀
Now another major catalyst is approaching.
⠀
The U.S. midterm elections take place tomorrow, November 3, and $SPX is entering the event while sitting directly on an important technical support structure.
⠀
For me, this makes the next 24-48 hours especially important.
⠀
Can buyers defend the current Support Zone, or is a move below $7,500 coming next?
⠀
Why the Market Came Under Pressure
⠀
The recent weakness was not simply about one bad economic report.
⠀
Technology and AI-related stocks became the main source of pressure as investors started questioning whether the enormous spending on data centers, chips, and AI infrastructure will generate sufficient returns.
⠀
The S&P 500 Technology sector fell 6.8% during October, while Friday alone brought another sharp 4.2% decline.
⠀
That selling pressure pushed the broader S&P 500 lower and left the market technically much more vulnerable heading into election week.
⠀
U.S. Midterm Elections — What Matters for the Market?
⠀
Election uncertainty is now being added to an already fragile market.
⠀
The latest polling favors Democrats nationally, and analysts currently see them as having a good chance of taking control of the House.
⠀
The Senate remains much more difficult to predict.
⠀
For markets, I do not think the story is simply “Democrats bearish, Republicans bullish.”
⠀
Each scenario has different implications.
⠀
A Democratic sweep could increase expectations for stronger congressional oversight of AI companies, data centers, crypto, and other industries.
⠀
That could create additional uncertainty for technology stocks at a time when the AI trade is already under pressure.
⠀
A Republican sweep could initially reduce concerns about aggressive new regulation and support expectations for tax or defense-policy continuity.
⠀
However, it could also revive concerns about larger fiscal deficits and Treasury yields.
⠀
A divided Congress may limit major policy changes, which markets have historically sometimes viewed positively because political gridlock can reduce the probability of large legislative surprises.
⠀
So for me, the biggest short-term risk is not simply which party wins.
⠀
It is whether the result surprises the market.
⠀
History After Midterm Elections
⠀
Historically, U.S. equities have often performed well after midterm elections.
⠀
Since 1938, the S&P 500 has posted gains during the following 12 months in approximately 95% of midterm cycles, with average returns around 14%.
⠀
One explanation is that election uncertainty begins to disappear once the result is known.
⠀
But history does not guarantee what happens tomorrow.
⠀
The current market is dealing with unusually high technology valuations, AI spending concerns, elevated Treasury yields, and geopolitical uncertainty.
⠀
That is why I am paying more attention to the chart than to historical averages.
⠀
Technical Analysis
⠀
On the 4-hour timeframe, the S&P 500 is attempting to break below the important Support Zone ($7,523-$7,624).
⠀
A small bullish Gap also formed around ($7,587.7-$7,599.4), and I believe this gap could still be filled during a short-term reaction.
⠀
But the larger technical structure remains more concerning.
⠀
From a classical technical analysis perspective, the S&P 500 appears to have formed a clear Head and Shoulders Pattern.
⠀
The Right Shoulder developed with strong bearish momentum toward the Neckline, and price is now testing this critical structure.
⠀
For me, the Neckline is the key.
⠀
As long as buyers cannot recover strongly from this area, the bearish pattern remains active.
⠀
Bearish Scenario
⠀
My main scenario is that election volatility could create sharp moves in both directions before the market chooses its next trend.
⠀
However, a confirmed breakdown below the current Support Zone and Head and Shoulders Neckline would significantly strengthen the bearish setup.
⠀
The first downside target would be the larger Gap ($7,483.6-$7,519.7).
⠀
That area also brings the market close to the psychological $7,500 level and an important Support Line.
⠀
This combination makes approximately $7,500 one of the most important areas I am watching.
⠀
If $7,500 fails with strong bearish momentum, the correction could develop into something deeper rather than remaining a simple election-driven shakeout.
⠀
Bullish Scenario
⠀
There is also a bullish scenario that I do not want to ignore.
⠀
If buyers successfully defend the Support Zone ($7,523-$7,624), fill the smaller Gap, and reclaim the broken structure with strong momentum, the Head and Shoulders breakdown could fail.
⠀
That type of failed breakdown during a high-volatility event could force short sellers to cover and create a sharp relief rally.
⠀
For me, confirmation matters more than trying to predict the election result itself.
⠀
Trade Setup
⠀
Take Profit: $7,519
⠀
Stop Loss: $7,690
⠀
Key Trading Levels:
$7,500
$7,708
⠀
Support Zone:
($7,523-$7,624)
⠀
Small Gap:
($7,587.7-$7,599.4)
⠀
Main Downside Gap:
($7,483.6-$7,519.7)
⠀
Impact on $BTC and $ETH
⠀
This setup is also important for the crypto market.
⠀
Bitcoin and Ethereum remain sensitive to changes in broader risk sentiment, particularly when U.S. equities experience sharp moves.
⠀
If the S&P 500 breaks support and technology stocks come under another wave of selling, I would expect that Risk-Off environment to increase pressure on Bitcoin and Ethereum as well.
⠀
On the other hand, if election uncertainty fades and U.S. equities produce a strong relief rally, crypto could also receive some short-term support.
⠀
My S&P 500 Outlook
⠀
For me, the story is straightforward.
⠀
The market entered election week already weakened by the technology sell-off.
⠀
Now the S&P 500 is sitting on an important Support Zone while a potential Head and Shoulders Pattern is threatening to break its Neckline.
⠀
A short-term reaction is possible, especially around the election.
⠀
But unless buyers successfully reclaim the structure, I continue to see a meaningful risk of a move toward the ($7,483.6-$7,519.7) Gap and the psychological $7,500 area.
⠀
Election results could create False Breakouts and aggressive moves in both directions, so I would rather react to confirmation than predict the first candle.
⠀
Which level will the S&P 500 reach first?
⠀
🔴 $7,519
🟢 $7,690
⠀
#SP500
⠀
Now another major catalyst is approaching.
⠀
The U.S. midterm elections take place tomorrow, November 3, and $SPX is entering the event while sitting directly on an important technical support structure.
⠀
For me, this makes the next 24-48 hours especially important.
⠀
Can buyers defend the current Support Zone, or is a move below $7,500 coming next?
⠀
Why the Market Came Under Pressure
⠀
The recent weakness was not simply about one bad economic report.
⠀
Technology and AI-related stocks became the main source of pressure as investors started questioning whether the enormous spending on data centers, chips, and AI infrastructure will generate sufficient returns.
⠀
The S&P 500 Technology sector fell 6.8% during October, while Friday alone brought another sharp 4.2% decline.
⠀
That selling pressure pushed the broader S&P 500 lower and left the market technically much more vulnerable heading into election week.
⠀
U.S. Midterm Elections — What Matters for the Market?
⠀
Election uncertainty is now being added to an already fragile market.
⠀
The latest polling favors Democrats nationally, and analysts currently see them as having a good chance of taking control of the House.
⠀
The Senate remains much more difficult to predict.
⠀
For markets, I do not think the story is simply “Democrats bearish, Republicans bullish.”
⠀
Each scenario has different implications.
⠀
A Democratic sweep could increase expectations for stronger congressional oversight of AI companies, data centers, crypto, and other industries.
⠀
That could create additional uncertainty for technology stocks at a time when the AI trade is already under pressure.
⠀
A Republican sweep could initially reduce concerns about aggressive new regulation and support expectations for tax or defense-policy continuity.
⠀
However, it could also revive concerns about larger fiscal deficits and Treasury yields.
⠀
A divided Congress may limit major policy changes, which markets have historically sometimes viewed positively because political gridlock can reduce the probability of large legislative surprises.
⠀
So for me, the biggest short-term risk is not simply which party wins.
⠀
It is whether the result surprises the market.
⠀
History After Midterm Elections
⠀
Historically, U.S. equities have often performed well after midterm elections.
⠀
Since 1938, the S&P 500 has posted gains during the following 12 months in approximately 95% of midterm cycles, with average returns around 14%.
⠀
One explanation is that election uncertainty begins to disappear once the result is known.
⠀
But history does not guarantee what happens tomorrow.
⠀
The current market is dealing with unusually high technology valuations, AI spending concerns, elevated Treasury yields, and geopolitical uncertainty.
⠀
That is why I am paying more attention to the chart than to historical averages.
⠀
Technical Analysis
⠀
On the 4-hour timeframe, the S&P 500 is attempting to break below the important Support Zone ($7,523-$7,624).
⠀
A small bullish Gap also formed around ($7,587.7-$7,599.4), and I believe this gap could still be filled during a short-term reaction.
⠀
But the larger technical structure remains more concerning.
⠀
From a classical technical analysis perspective, the S&P 500 appears to have formed a clear Head and Shoulders Pattern.
⠀
The Right Shoulder developed with strong bearish momentum toward the Neckline, and price is now testing this critical structure.
⠀
For me, the Neckline is the key.
⠀
As long as buyers cannot recover strongly from this area, the bearish pattern remains active.
⠀
Bearish Scenario
⠀
My main scenario is that election volatility could create sharp moves in both directions before the market chooses its next trend.
⠀
However, a confirmed breakdown below the current Support Zone and Head and Shoulders Neckline would significantly strengthen the bearish setup.
⠀
The first downside target would be the larger Gap ($7,483.6-$7,519.7).
⠀
That area also brings the market close to the psychological $7,500 level and an important Support Line.
⠀
This combination makes approximately $7,500 one of the most important areas I am watching.
⠀
If $7,500 fails with strong bearish momentum, the correction could develop into something deeper rather than remaining a simple election-driven shakeout.
⠀
Bullish Scenario
⠀
There is also a bullish scenario that I do not want to ignore.
⠀
If buyers successfully defend the Support Zone ($7,523-$7,624), fill the smaller Gap, and reclaim the broken structure with strong momentum, the Head and Shoulders breakdown could fail.
⠀
That type of failed breakdown during a high-volatility event could force short sellers to cover and create a sharp relief rally.
⠀
For me, confirmation matters more than trying to predict the election result itself.
⠀
Trade Setup
⠀
Take Profit: $7,519
⠀
Stop Loss: $7,690
⠀
Key Trading Levels:
$7,500
$7,708
⠀
Support Zone:
($7,523-$7,624)
⠀
Small Gap:
($7,587.7-$7,599.4)
⠀
Main Downside Gap:
($7,483.6-$7,519.7)
⠀
Impact on $BTC and $ETH
⠀
This setup is also important for the crypto market.
⠀
Bitcoin and Ethereum remain sensitive to changes in broader risk sentiment, particularly when U.S. equities experience sharp moves.
⠀
If the S&P 500 breaks support and technology stocks come under another wave of selling, I would expect that Risk-Off environment to increase pressure on Bitcoin and Ethereum as well.
⠀
On the other hand, if election uncertainty fades and U.S. equities produce a strong relief rally, crypto could also receive some short-term support.
⠀
My S&P 500 Outlook
⠀
For me, the story is straightforward.
⠀
The market entered election week already weakened by the technology sell-off.
⠀
Now the S&P 500 is sitting on an important Support Zone while a potential Head and Shoulders Pattern is threatening to break its Neckline.
⠀
A short-term reaction is possible, especially around the election.
⠀
But unless buyers successfully reclaim the structure, I continue to see a meaningful risk of a move toward the ($7,483.6-$7,519.7) Gap and the psychological $7,500 area.
⠀
Election results could create False Breakouts and aggressive moves in both directions, so I would rather react to confirmation than predict the first candle.
⠀
Which level will the S&P 500 reach first?
⠀
🔴 $7,519
🟢 $7,690
⠀
#SP500
1
2
567

·
--
Okta 要进 S&P 500 了。做身份认证的,终于被「认证」成大盘股 😂
S&P Dow Jones Indices 10-30 官方公告:
1️⃣ Okta(OKTA)从 S&P MidCap 400 升级,11 月 4 日开盘前生效
2️⃣ 被替换的是 Kenvue(KVUE),因为 Kimberly-Clark 正在收购它
3️⃣ 一出一进:消费必需品出,Information Technology 进
我的看法:
S&P 500 本质是一台自动换血机器。被并购的、掉队的出去,长起来的进来。你不用选股,指数帮你做了末位淘汰。这也是我一直不看空美股大盘的原因之一。
Okta 本身的叙事也挺应景:AI agent 越多,「谁在登录、谁有权限」就越值钱。身份层是 agent 时代的门卫。MarketWatch 提到它今年股价已经翻倍以上。
提醒一句:纳入指数会带来被动资金调仓,但公告后的涨幅往往提前兑现,生效日前后波动不小,别把「进标普」当成无脑买点。
只筛选不教育,不构成投资建议。
来源:S&P Dow Jones Indices 官方新闻稿(2026-10-30)、MarketWatch
#美股 #SP500 #Okta #AI
Okta 要进 S&P 500 了。做身份认证的,终于被「认证」成大盘股 😂
S&P Dow Jones Indices 10-30 官方公告:
1️⃣ Okta(OKTA)从 S&P MidCap 400 升级,11 月 4 日开盘前生效
2️⃣ 被替换的是 Kenvue(KVUE),因为 Kimberly-Clark 正在收购它
3️⃣ 一出一进:消费必需品出,Information Technology 进
我的看法:
S&P 500 本质是一台自动换血机器。被并购的、掉队的出去,长起来的进来。你不用选股,指数帮你做了末位淘汰。这也是我一直不看空美股大盘的原因之一。
Okta 本身的叙事也挺应景:AI agent 越多,「谁在登录、谁有权限」就越值钱。身份层是 agent 时代的门卫。MarketWatch 提到它今年股价已经翻倍以上。
提醒一句:纳入指数会带来被动资金调仓,但公告后的涨幅往往提前兑现,生效日前后波动不小,别把「进标普」当成无脑买点。
只筛选不教育,不构成投资建议。
来源:S&P Dow Jones Indices 官方新闻稿(2026-10-30)、MarketWatch
#美股 #SP500 #Okta #AI
S&P Dow Jones Indices 10-30 官方公告:
1️⃣ Okta(OKTA)从 S&P MidCap 400 升级,11 月 4 日开盘前生效
2️⃣ 被替换的是 Kenvue(KVUE),因为 Kimberly-Clark 正在收购它
3️⃣ 一出一进:消费必需品出,Information Technology 进
我的看法:
S&P 500 本质是一台自动换血机器。被并购的、掉队的出去,长起来的进来。你不用选股,指数帮你做了末位淘汰。这也是我一直不看空美股大盘的原因之一。
Okta 本身的叙事也挺应景:AI agent 越多,「谁在登录、谁有权限」就越值钱。身份层是 agent 时代的门卫。MarketWatch 提到它今年股价已经翻倍以上。
提醒一句:纳入指数会带来被动资金调仓,但公告后的涨幅往往提前兑现,生效日前后波动不小,别把「进标普」当成无脑买点。
只筛选不教育,不构成投资建议。
来源:S&P Dow Jones Indices 官方新闻稿(2026-10-30)、MarketWatch
#美股 #SP500 #Okta #AI
KVUEUS0,00%
OKTAUS+0,41%
73

·
--
Рост
🚨 S&P 500: Is a Major Correction Coming?
The weekly chart is showing some warning signs that investors shouldn't ignore.
The S&P 500 continues to print higher highs, but the RSI is forming lower highs — a classic Bearish Divergence.
Here’s what the chart suggests:
📉 6,900 – First potential downside target.
📉 6,350 – Major support zone and a possible deeper correction.
📊 A potential 19% pullback could bring the index toward its long-term moving average support.
However, the bigger bullish trend isn't necessarily over. If support holds and buyers step back in, the market could resume its upward journey toward new highs.
My takeaway: Don't ignore bearish divergence during a strong uptrend. Watch support levels, manage risk, and avoid chasing the market at the top.
Is this just a healthy correction, or the beginning of a bigger market reversal?
#SP500 #StockMarket #Trading #MarketAnalysis #Investing
🚨 S&P 500: Is a Major Correction Coming?
The weekly chart is showing some warning signs that investors shouldn't ignore.
The S&P 500 continues to print higher highs, but the RSI is forming lower highs — a classic Bearish Divergence.
Here’s what the chart suggests:
📉 6,900 – First potential downside target.
📉 6,350 – Major support zone and a possible deeper correction.
📊 A potential 19% pullback could bring the index toward its long-term moving average support.
However, the bigger bullish trend isn't necessarily over. If support holds and buyers step back in, the market could resume its upward journey toward new highs.
My takeaway: Don't ignore bearish divergence during a strong uptrend. Watch support levels, manage risk, and avoid chasing the market at the top.
Is this just a healthy correction, or the beginning of a bigger market reversal?
#SP500 #StockMarket #Trading #MarketAnalysis #Investing
The weekly chart is showing some warning signs that investors shouldn't ignore.
The S&P 500 continues to print higher highs, but the RSI is forming lower highs — a classic Bearish Divergence.
Here’s what the chart suggests:
📉 6,900 – First potential downside target.
📉 6,350 – Major support zone and a possible deeper correction.
📊 A potential 19% pullback could bring the index toward its long-term moving average support.
However, the bigger bullish trend isn't necessarily over. If support holds and buyers step back in, the market could resume its upward journey toward new highs.
My takeaway: Don't ignore bearish divergence during a strong uptrend. Watch support levels, manage risk, and avoid chasing the market at the top.
Is this just a healthy correction, or the beginning of a bigger market reversal?
#SP500 #StockMarket #Trading #MarketAnalysis #Investing
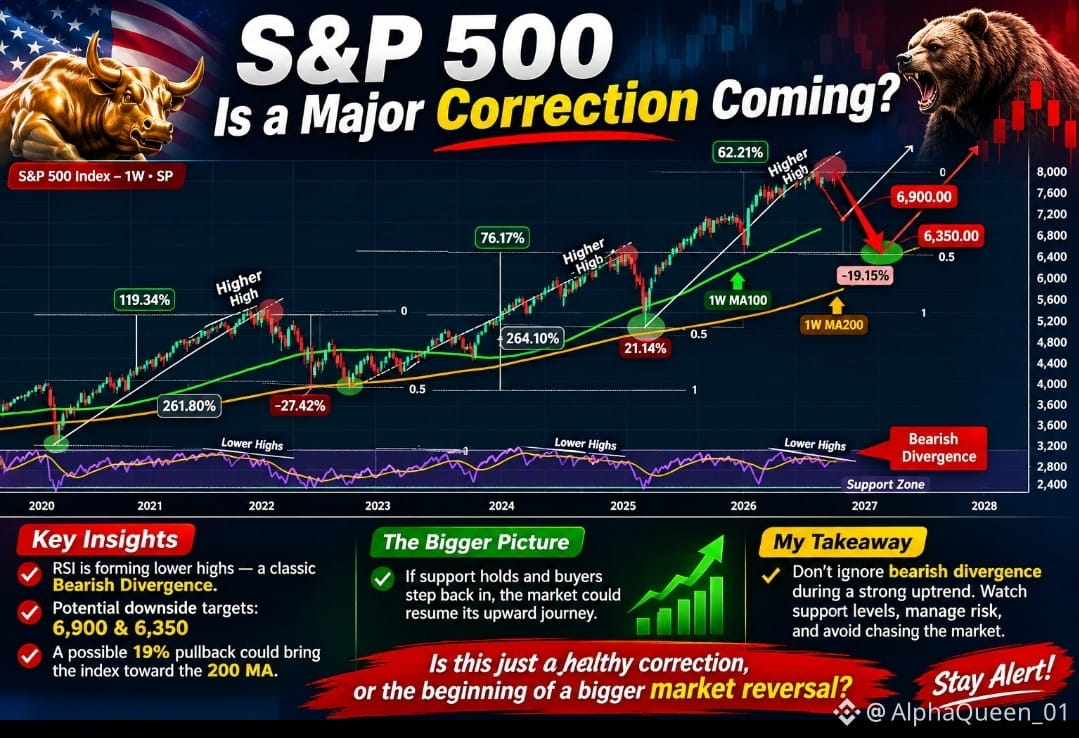
2
175

·
--
Проверено
The S&P 500 is becoming a market of winners and losers, and investors may need to rethink their strategy.
Societe Generale data shows around 40% of possible S&P 500 stock pairs are negatively correlated, with overall correlations below historical norms.
That could create more opportunities for stock pickers and diversification, but index gains may hide growing gaps between individual companies.
Is this a golden opportunity for selective investors, or a warning that market uncertainty is rising?
#SP500 #Stocks #Investing
$MAGMA
{future}(MAGMAUSDT)
$HYPE
{future}(HYPEUSDT)
$LSK
{future}(LSKUSDT)
The S&P 500 is becoming a market of winners and losers, and investors may need to rethink their strategy.
Societe Generale data shows around 40% of possible S&P 500 stock pairs are negatively correlated, with overall correlations below historical norms.
That could create more opportunities for stock pickers and diversification, but index gains may hide growing gaps between individual companies.
Is this a golden opportunity for selective investors, or a warning that market uncertainty is rising?
#SP500 #Stocks #Investing
$MAGMA
$HYPE
$LSK
Societe Generale data shows around 40% of possible S&P 500 stock pairs are negatively correlated, with overall correlations below historical norms.
That could create more opportunities for stock pickers and diversification, but index gains may hide growing gaps between individual companies.
Is this a golden opportunity for selective investors, or a warning that market uncertainty is rising?
#SP500 #Stocks #Investing
$MAGMA
$HYPE
$LSK
1
630

FOMC NOISE. US MARKET EXPANSION. 🚀
So many uncertainties, endless “ifs and buts” around the FOMC timeline.
But sometimes, the biggest opportunities emerge when everyone is busy overthinking the next move.
Forget the noise. Forget the distractions.
Not just Altcoins. Not just Crypto. Let's turn the entire US market bullish. 📈
🎯 S&P 500 E-mini Futures — 7,819.50
This is the upside level on my chart. Price is currently trading around 7,778, with 7,749.50 marked as a key level to watch.
Now, let's see whether the market can build enough momentum to push higher. Confirmation matters — no blind entries, no unnecessary FOMO.
Stay focused. Respect the levels. Let price action do the talking.
— Ali Trading
#SP500 #FOMC #USMarketss #PriceAction #TradingViewTips #AliTrading
FOMC NOISE. US MARKET EXPANSION. 🚀
So many uncertainties, endless “ifs and buts” around the FOMC timeline.
But sometimes, the biggest opportunities emerge when everyone is busy overthinking the next move.
Forget the noise. Forget the distractions.
Not just Altcoins. Not just Crypto. Let's turn the entire US market bullish. 📈
🎯 S&P 500 E-mini Futures — 7,819.50
This is the upside level on my chart. Price is currently trading around 7,778, with 7,749.50 marked as a key level to watch.
Now, let's see whether the market can build enough momentum to push higher. Confirmation matters — no blind entries, no unnecessary FOMO.
Stay focused. Respect the levels. Let price action do the talking.
— Ali Trading
#SP500 #FOMC #USMarketss #PriceAction #TradingViewTips #AliTrading
So many uncertainties, endless “ifs and buts” around the FOMC timeline.
But sometimes, the biggest opportunities emerge when everyone is busy overthinking the next move.
Forget the noise. Forget the distractions.
Not just Altcoins. Not just Crypto. Let's turn the entire US market bullish. 📈
🎯 S&P 500 E-mini Futures — 7,819.50
This is the upside level on my chart. Price is currently trading around 7,778, with 7,749.50 marked as a key level to watch.
Now, let's see whether the market can build enough momentum to push higher. Confirmation matters — no blind entries, no unnecessary FOMO.
Stay focused. Respect the levels. Let price action do the talking.
— Ali Trading
#SP500 #FOMC #USMarketss #PriceAction #TradingViewTips #AliTrading
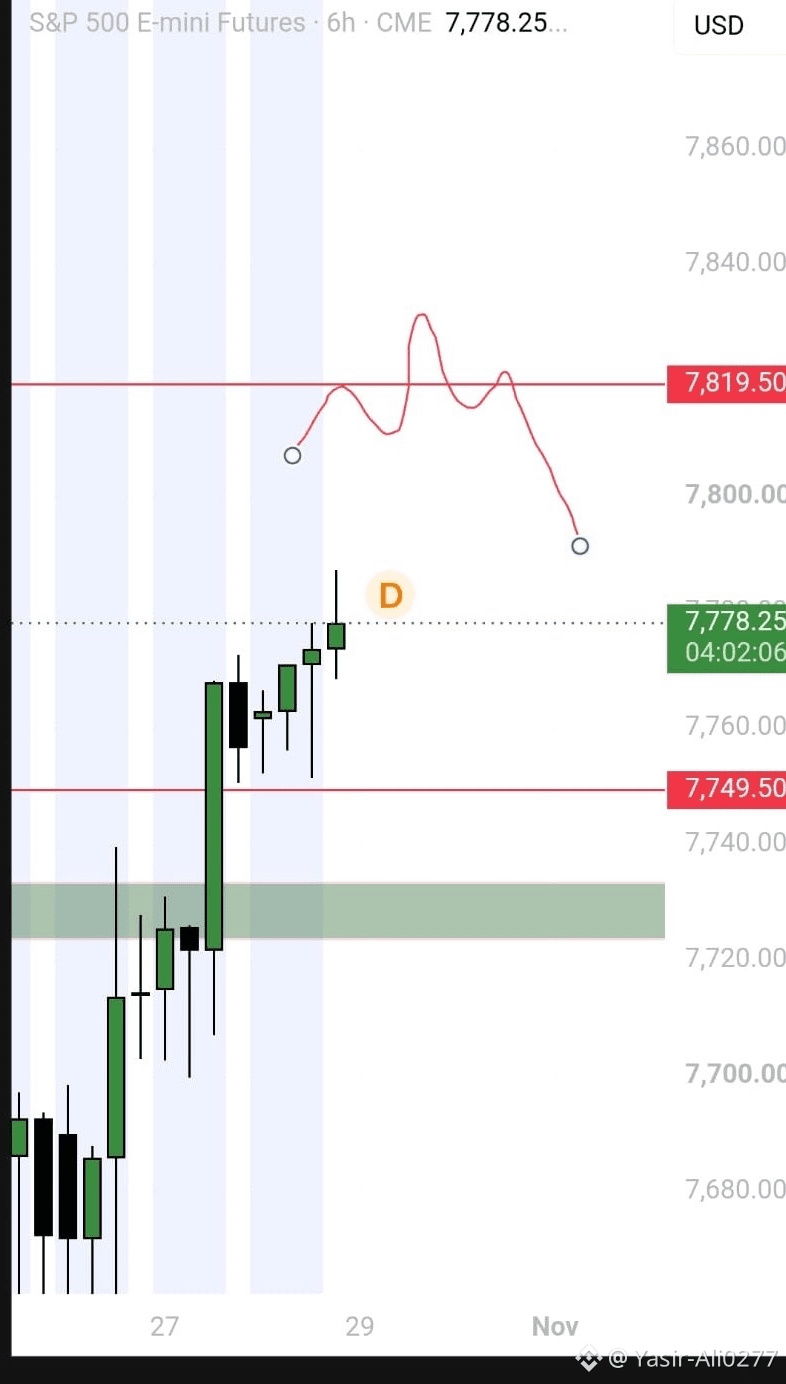
95
Войдите, чтобы посмотреть больше материала
Присоединяйтесь к пользователям криптовалют по всему миру на Binance Square
⚡️ Получайте новейшую и полезную информацию о криптоактивах.
💬 Нам доверяет крупнейшая в мире криптобиржа.
👍 Получите достоверные аналитические данные от верифицированных создателей контента.
Эл. почта/номер телефона
В тренде
1
#WhatWillDriveCryptoandStocks’NextRebound?
Просмотров: 24,099
427 обсуждают
2
#Anthropic’s6xIPODemandSignalsPotentialRecordRaise
Просмотров: 7,337
188 обсуждают
3
#USSpotBitcoinETFsSee$1.56BYTDNetOutflows
Просмотров: 0
0 обсуждают
4
#HuangExitNvidiaStrategyInFocus
Просмотров: 166,616
1,517 обсуждают
5
#AnthropicRejectsIPODelayValuationinQuestion
Просмотров: 786,389
5,688 обсуждают
6
#HedgeFundsCMEBitcoinNetShortsFall89%
Просмотров: 12,916
207 обсуждают
7
#BitMineReports$6.3BNetLossForFiscal2026
Просмотров: 23,569
187 обсуждают
8
#TradFiForBeginners
Просмотров: 562,479
3,945 обсуждают
9
#SoFiExpandsSoFiUSDStablecoinToPolygon
Просмотров: 7,960
118 обсуждают
10
#TetherGoldXAUTCompletesKPMGAudit
Просмотров: 11,472
130 обсуждают