

#macd
macd
Просмотров: 615,525
1,546 обсуждают
Популярные
Новые


·
--
$CHIP
{spot}(CHIPUSDT)
/USDT: I’m Watching This MACD Signal Closely 📉
I’ve been looking at CHIP/USDT on the 30-minute chart, and there’s a small shift in momentum that caught my attention.
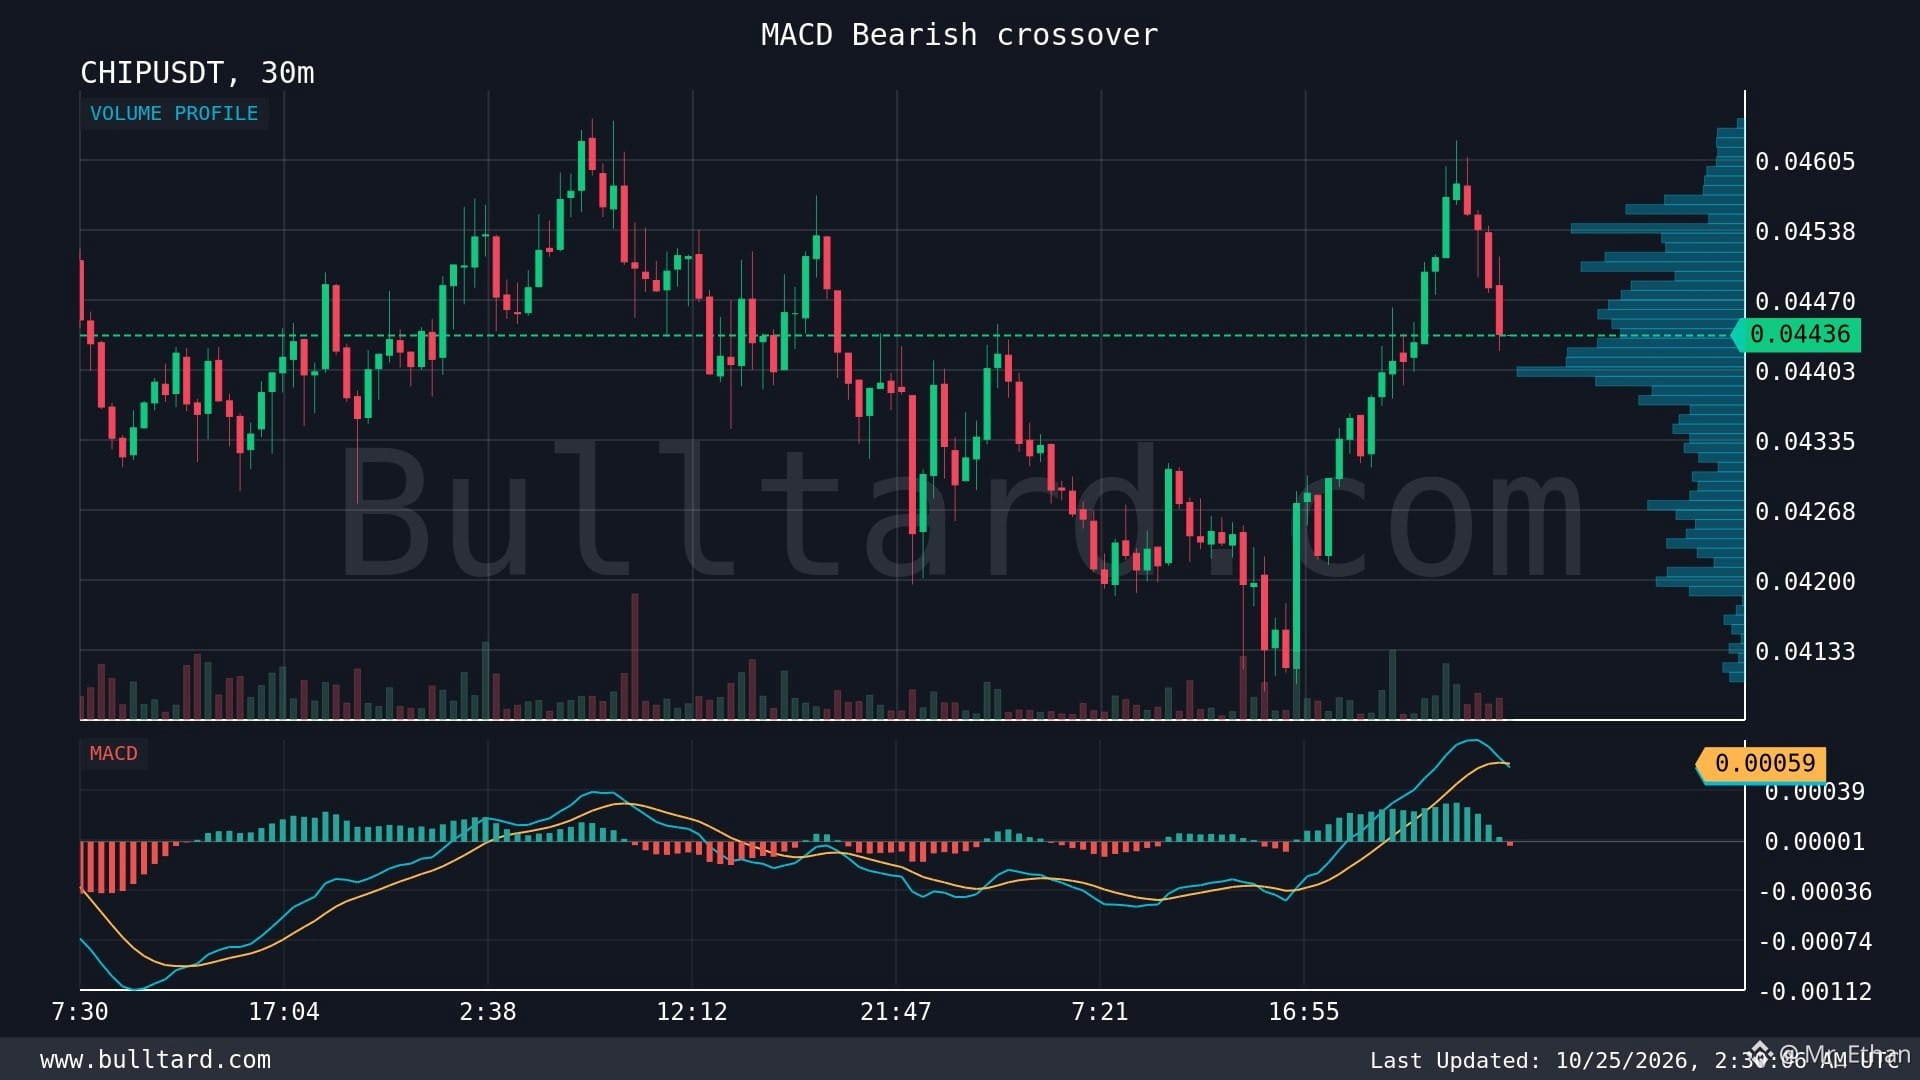
The price is currently around $0.04436. The MACD line sits at 0.0005615, slightly below the signal line at 0.000591. This bearish crossover suggests that buying momentum may be weakening in the short term.
From my experience, these signals are useful, but I never rely on MACD alone. I also watch volume, support levels, and how price reacts after the crossover. Sometimes sellers take control, while other times the signal reverses quickly.
What interests me most is the broader potential of blockchain and AI-related crypto projects. If CHIP can build real utility, attract users, and maintain demand, that could matter more over time than short-term price movements. However, I always check the project's actual use case, liquidity, token supply, and adoption before forming a long-term view.
My biggest lesson from trading altcoins is simple: a signal is a warning, not a guarantee. I prefer confirmation over emotional decisions.
What’s your view on CHIP/USDT? Will bearish momentum continue, or could buyers regain control?
#CHIP #CryptoTrading #MACD #BinanceSquare
$CHIP
/USDT: I’m Watching This MACD Signal Closely 📉
I’ve been looking at CHIP/USDT on the 30-minute chart, and there’s a small shift in momentum that caught my attention.
The price is currently around $0.04436. The MACD line sits at 0.0005615, slightly below the signal line at 0.000591. This bearish crossover suggests that buying momentum may be weakening in the short term.
From my experience, these signals are useful, but I never rely on MACD alone. I also watch volume, support levels, and how price reacts after the crossover. Sometimes sellers take control, while other times the signal reverses quickly.
What interests me most is the broader potential of blockchain and AI-related crypto projects. If CHIP can build real utility, attract users, and maintain demand, that could matter more over time than short-term price movements. However, I always check the project's actual use case, liquidity, token supply, and adoption before forming a long-term view.
My biggest lesson from trading altcoins is simple: a signal is a warning, not a guarantee. I prefer confirmation over emotional decisions.
What’s your view on CHIP/USDT? Will bearish momentum continue, or could buyers regain control?
#CHIP #CryptoTrading #MACD #BinanceSquare
/USDT: I’m Watching This MACD Signal Closely 📉
I’ve been looking at CHIP/USDT on the 30-minute chart, and there’s a small shift in momentum that caught my attention.
The price is currently around $0.04436. The MACD line sits at 0.0005615, slightly below the signal line at 0.000591. This bearish crossover suggests that buying momentum may be weakening in the short term.
From my experience, these signals are useful, but I never rely on MACD alone. I also watch volume, support levels, and how price reacts after the crossover. Sometimes sellers take control, while other times the signal reverses quickly.
What interests me most is the broader potential of blockchain and AI-related crypto projects. If CHIP can build real utility, attract users, and maintain demand, that could matter more over time than short-term price movements. However, I always check the project's actual use case, liquidity, token supply, and adoption before forming a long-term view.
My biggest lesson from trading altcoins is simple: a signal is a warning, not a guarantee. I prefer confirmation over emotional decisions.
What’s your view on CHIP/USDT? Will bearish momentum continue, or could buyers regain control?
#CHIP #CryptoTrading #MACD #BinanceSquare
234
·
--
$MTL
{spot}(MTLUSDT)
/USDT: I’m Watching This Bearish MACD Signal 👀
I’ve been watching MTL/USDT on the 30-minute chart, and the latest MACD setup is worth paying attention to.
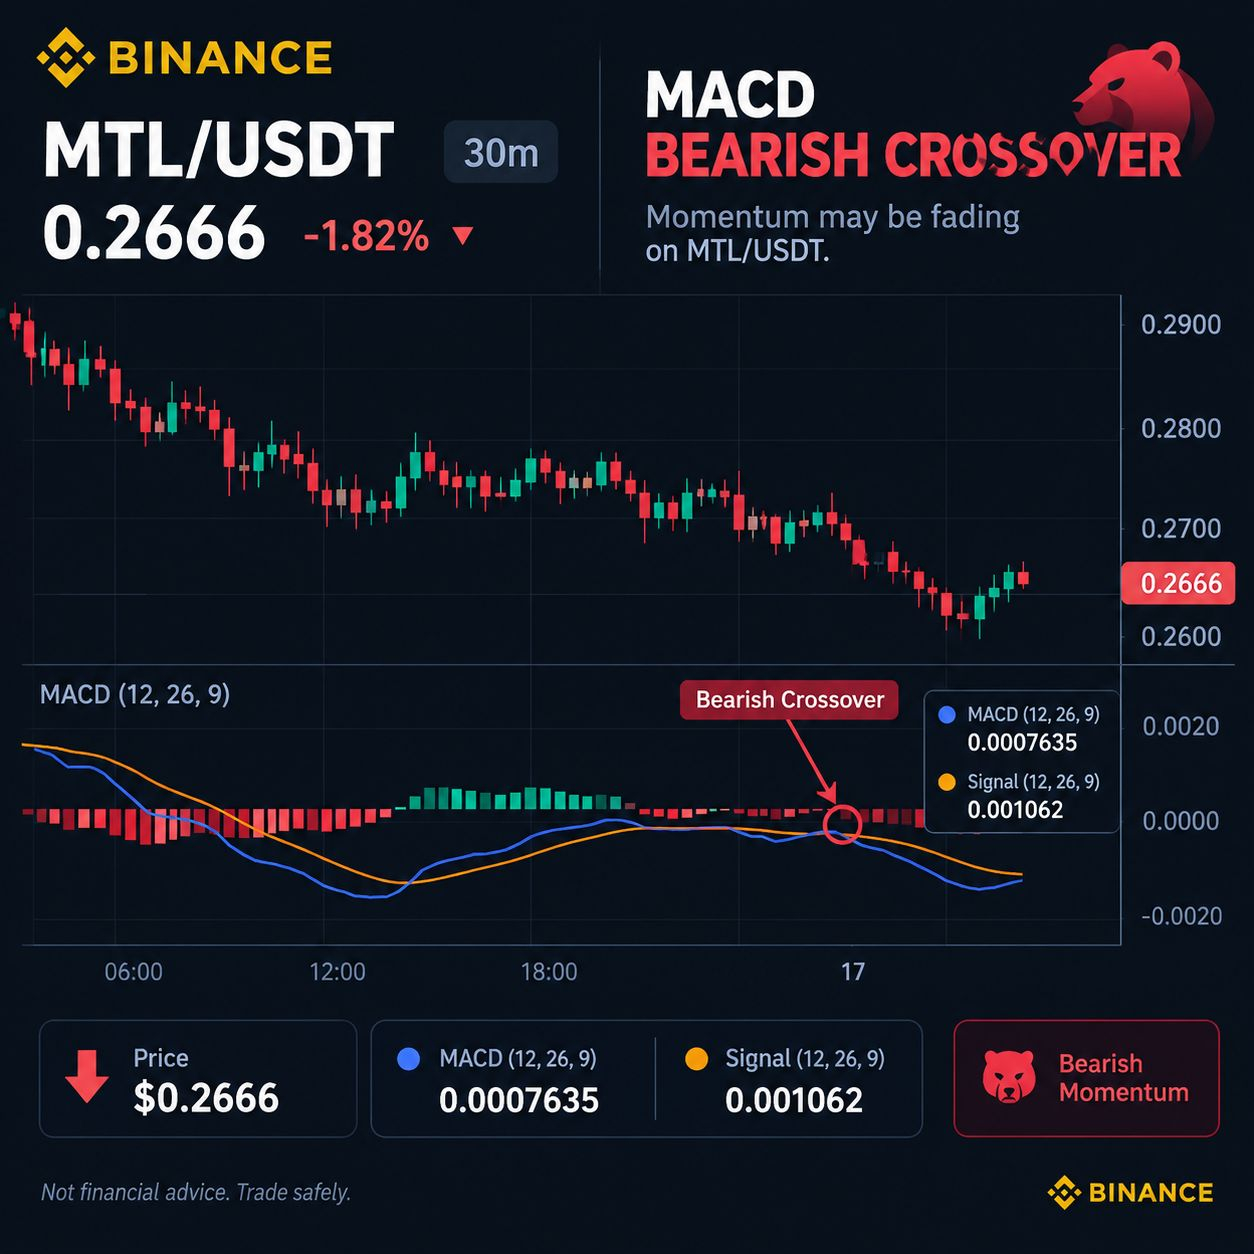
MTL is trading around $0.2666, and the MACD line is at 0.0007635, below the signal line at 0.001062. This bearish crossover suggests that short-term buying momentum may be fading.
From my experience, I never treat one indicator as a complete trading strategy. MACD helps me understand momentum, but price action tells me whether sellers are actually taking control.
One strength of MTL is its connection to the Metal ecosystem, which focuses on blockchain-based financial services. Like other crypto projects, its long-term potential depends on real adoption, utility, liquidity, and market demand.
But there are risks. Smaller altcoins can move sharply, and a bearish crossover can quickly reverse if buyers step back in. Bitcoin’s direction and overall market sentiment can also influence MTL.
My approach is simple: I watch support levels, trading volume, and the next candle closes before making a decision. I’ve learned that chasing every signal often costs more than waiting for confirmation.
What do you think? Will MTL face more selling pressure, or could buyers turn this signal around?
#MTL #CryptoTrading #MACD #BinanceSquare
$MTL
/USDT: I’m Watching This Bearish MACD Signal 👀
I’ve been watching MTL/USDT on the 30-minute chart, and the latest MACD setup is worth paying attention to.
MTL is trading around $0.2666, and the MACD line is at 0.0007635, below the signal line at 0.001062. This bearish crossover suggests that short-term buying momentum may be fading.
From my experience, I never treat one indicator as a complete trading strategy. MACD helps me understand momentum, but price action tells me whether sellers are actually taking control.
One strength of MTL is its connection to the Metal ecosystem, which focuses on blockchain-based financial services. Like other crypto projects, its long-term potential depends on real adoption, utility, liquidity, and market demand.
But there are risks. Smaller altcoins can move sharply, and a bearish crossover can quickly reverse if buyers step back in. Bitcoin’s direction and overall market sentiment can also influence MTL.
My approach is simple: I watch support levels, trading volume, and the next candle closes before making a decision. I’ve learned that chasing every signal often costs more than waiting for confirmation.
What do you think? Will MTL face more selling pressure, or could buyers turn this signal around?
#MTL #CryptoTrading #MACD #BinanceSquare
/USDT: I’m Watching This Bearish MACD Signal 👀
I’ve been watching MTL/USDT on the 30-minute chart, and the latest MACD setup is worth paying attention to.
MTL is trading around $0.2666, and the MACD line is at 0.0007635, below the signal line at 0.001062. This bearish crossover suggests that short-term buying momentum may be fading.
From my experience, I never treat one indicator as a complete trading strategy. MACD helps me understand momentum, but price action tells me whether sellers are actually taking control.
One strength of MTL is its connection to the Metal ecosystem, which focuses on blockchain-based financial services. Like other crypto projects, its long-term potential depends on real adoption, utility, liquidity, and market demand.
But there are risks. Smaller altcoins can move sharply, and a bearish crossover can quickly reverse if buyers step back in. Bitcoin’s direction and overall market sentiment can also influence MTL.
My approach is simple: I watch support levels, trading volume, and the next candle closes before making a decision. I’ve learned that chasing every signal often costs more than waiting for confirmation.
What do you think? Will MTL face more selling pressure, or could buyers turn this signal around?
#MTL #CryptoTrading #MACD #BinanceSquare
282
·
--
Падение
📉 $FET
{spot}(FETUSDT)
/USDT: MACD Shows Early Bearish Pressure
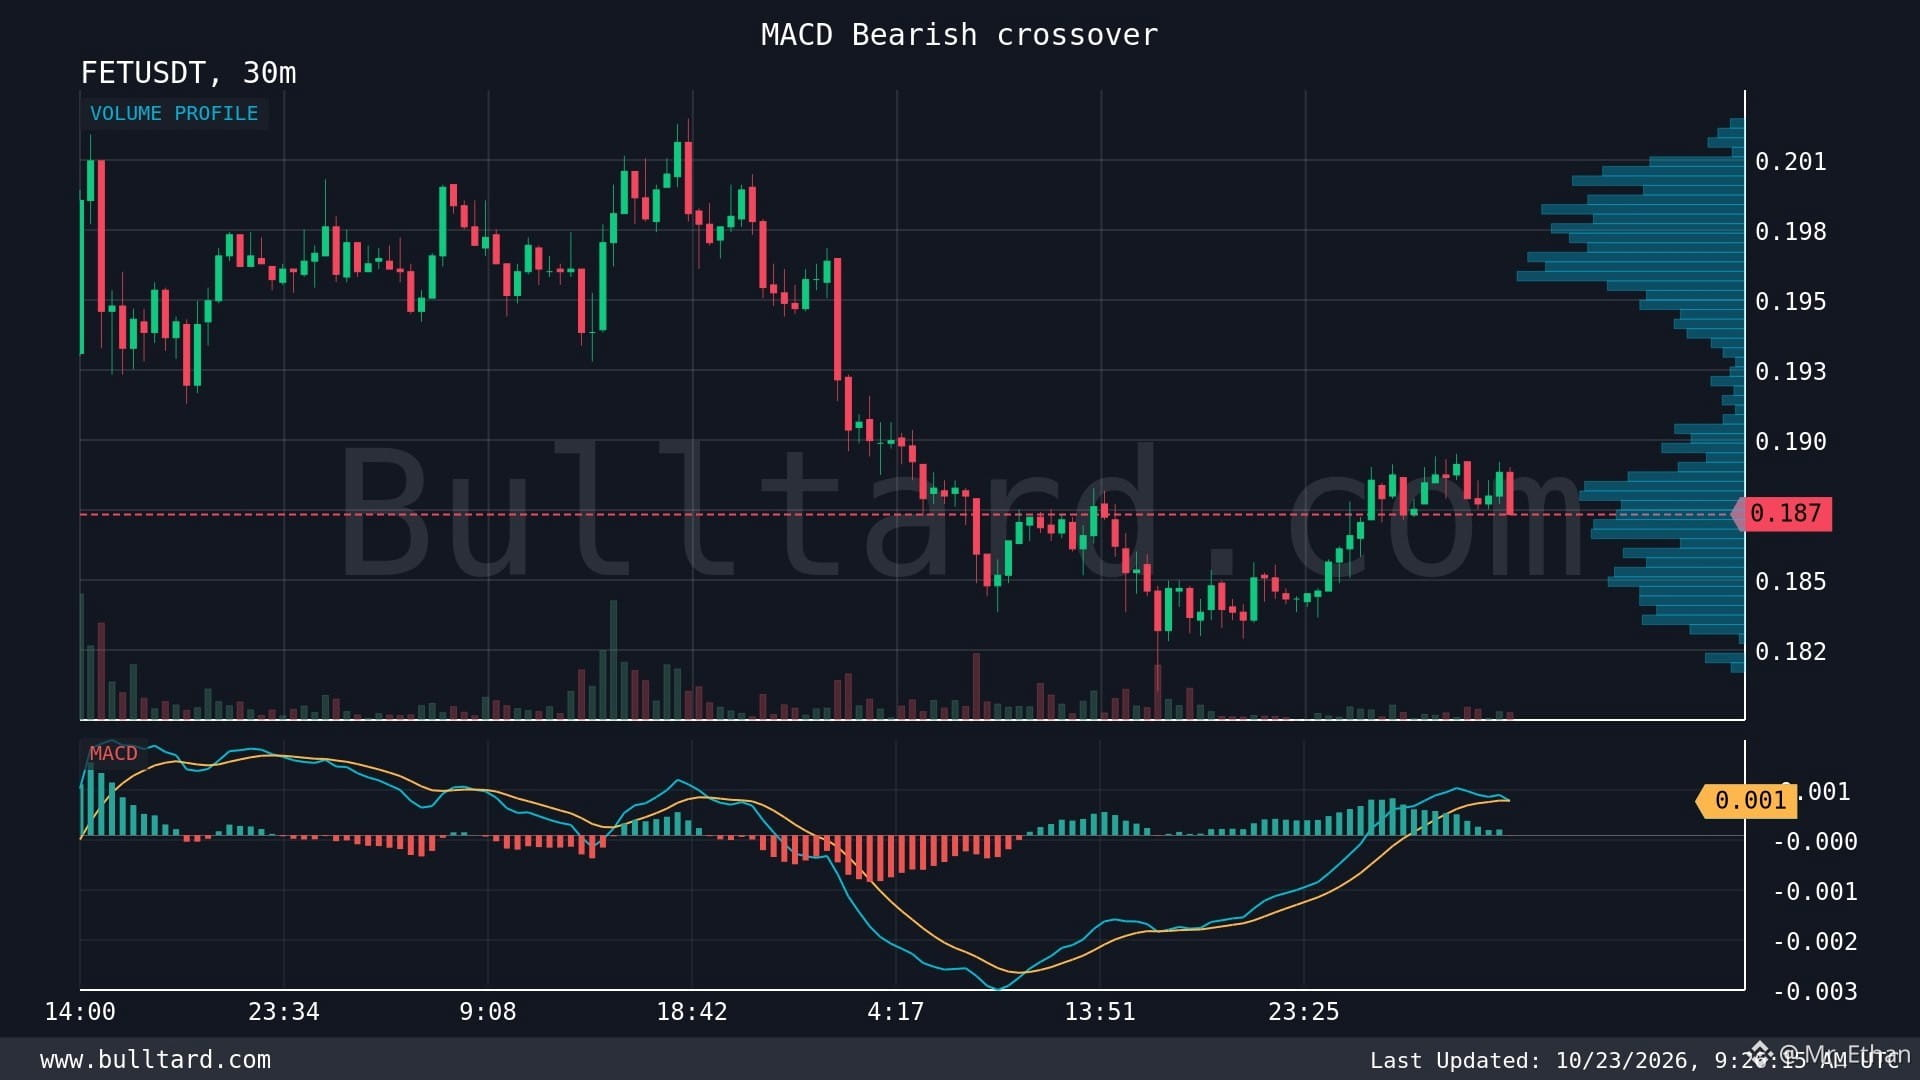
I’m watching FET/USDT closely as the 30-minute chart shows a bearish MACD crossover. The price is around $0.1873, and this is a signal I don’t want to ignore.
My attention is on the MACD line at 0.0006109 and the signal line at 0.0006168. The MACD has slipped slightly below the signal line, suggesting that short-term bullish momentum may be weakening.
I’ve learned that these small crossovers can be useful warnings, but they don’t always lead to a major drop. In crypto, one strong buying candle can quickly change the picture.
FET is part of the AI and blockchain space, which gives the project an interesting long-term narrative. Still, strong fundamentals don’t protect a token from short-term selling pressure. Compared with other AI-related tokens, FET also faces competition and changing market sentiment.
For now, I’m watching trading volume, nearby support, and whether the MACD gap starts widening. If selling pressure increases, the price could face more downside. If buyers step in, this signal may turn into a false alarm.
My lesson is simple: follow confirmation, not just indicators.
Are you seeing a potential pullback in FET, or could buyers regain control? 👀
#FET #FetchAI #CryptoTrading #MACD
📉 $FET
/USDT: MACD Shows Early Bearish Pressure
I’m watching FET/USDT closely as the 30-minute chart shows a bearish MACD crossover. The price is around $0.1873, and this is a signal I don’t want to ignore.
My attention is on the MACD line at 0.0006109 and the signal line at 0.0006168. The MACD has slipped slightly below the signal line, suggesting that short-term bullish momentum may be weakening.
I’ve learned that these small crossovers can be useful warnings, but they don’t always lead to a major drop. In crypto, one strong buying candle can quickly change the picture.
FET is part of the AI and blockchain space, which gives the project an interesting long-term narrative. Still, strong fundamentals don’t protect a token from short-term selling pressure. Compared with other AI-related tokens, FET also faces competition and changing market sentiment.
For now, I’m watching trading volume, nearby support, and whether the MACD gap starts widening. If selling pressure increases, the price could face more downside. If buyers step in, this signal may turn into a false alarm.
My lesson is simple: follow confirmation, not just indicators.
Are you seeing a potential pullback in FET, or could buyers regain control? 👀
#FET #FetchAI #CryptoTrading #MACD
/USDT: MACD Shows Early Bearish Pressure
I’m watching FET/USDT closely as the 30-minute chart shows a bearish MACD crossover. The price is around $0.1873, and this is a signal I don’t want to ignore.
My attention is on the MACD line at 0.0006109 and the signal line at 0.0006168. The MACD has slipped slightly below the signal line, suggesting that short-term bullish momentum may be weakening.
I’ve learned that these small crossovers can be useful warnings, but they don’t always lead to a major drop. In crypto, one strong buying candle can quickly change the picture.
FET is part of the AI and blockchain space, which gives the project an interesting long-term narrative. Still, strong fundamentals don’t protect a token from short-term selling pressure. Compared with other AI-related tokens, FET also faces competition and changing market sentiment.
For now, I’m watching trading volume, nearby support, and whether the MACD gap starts widening. If selling pressure increases, the price could face more downside. If buyers step in, this signal may turn into a false alarm.
My lesson is simple: follow confirmation, not just indicators.
Are you seeing a potential pullback in FET, or could buyers regain control? 👀
#FET #FetchAI #CryptoTrading #MACD
1
449
·
--
$BNCB
{spot}(BNCBUSDT)
/USDT: I’m Watching This 30m MACD Signal 👀
I’ve been keeping an eye on BNCB/USDT, and the 30-minute MACD is showing a small bearish crossover.
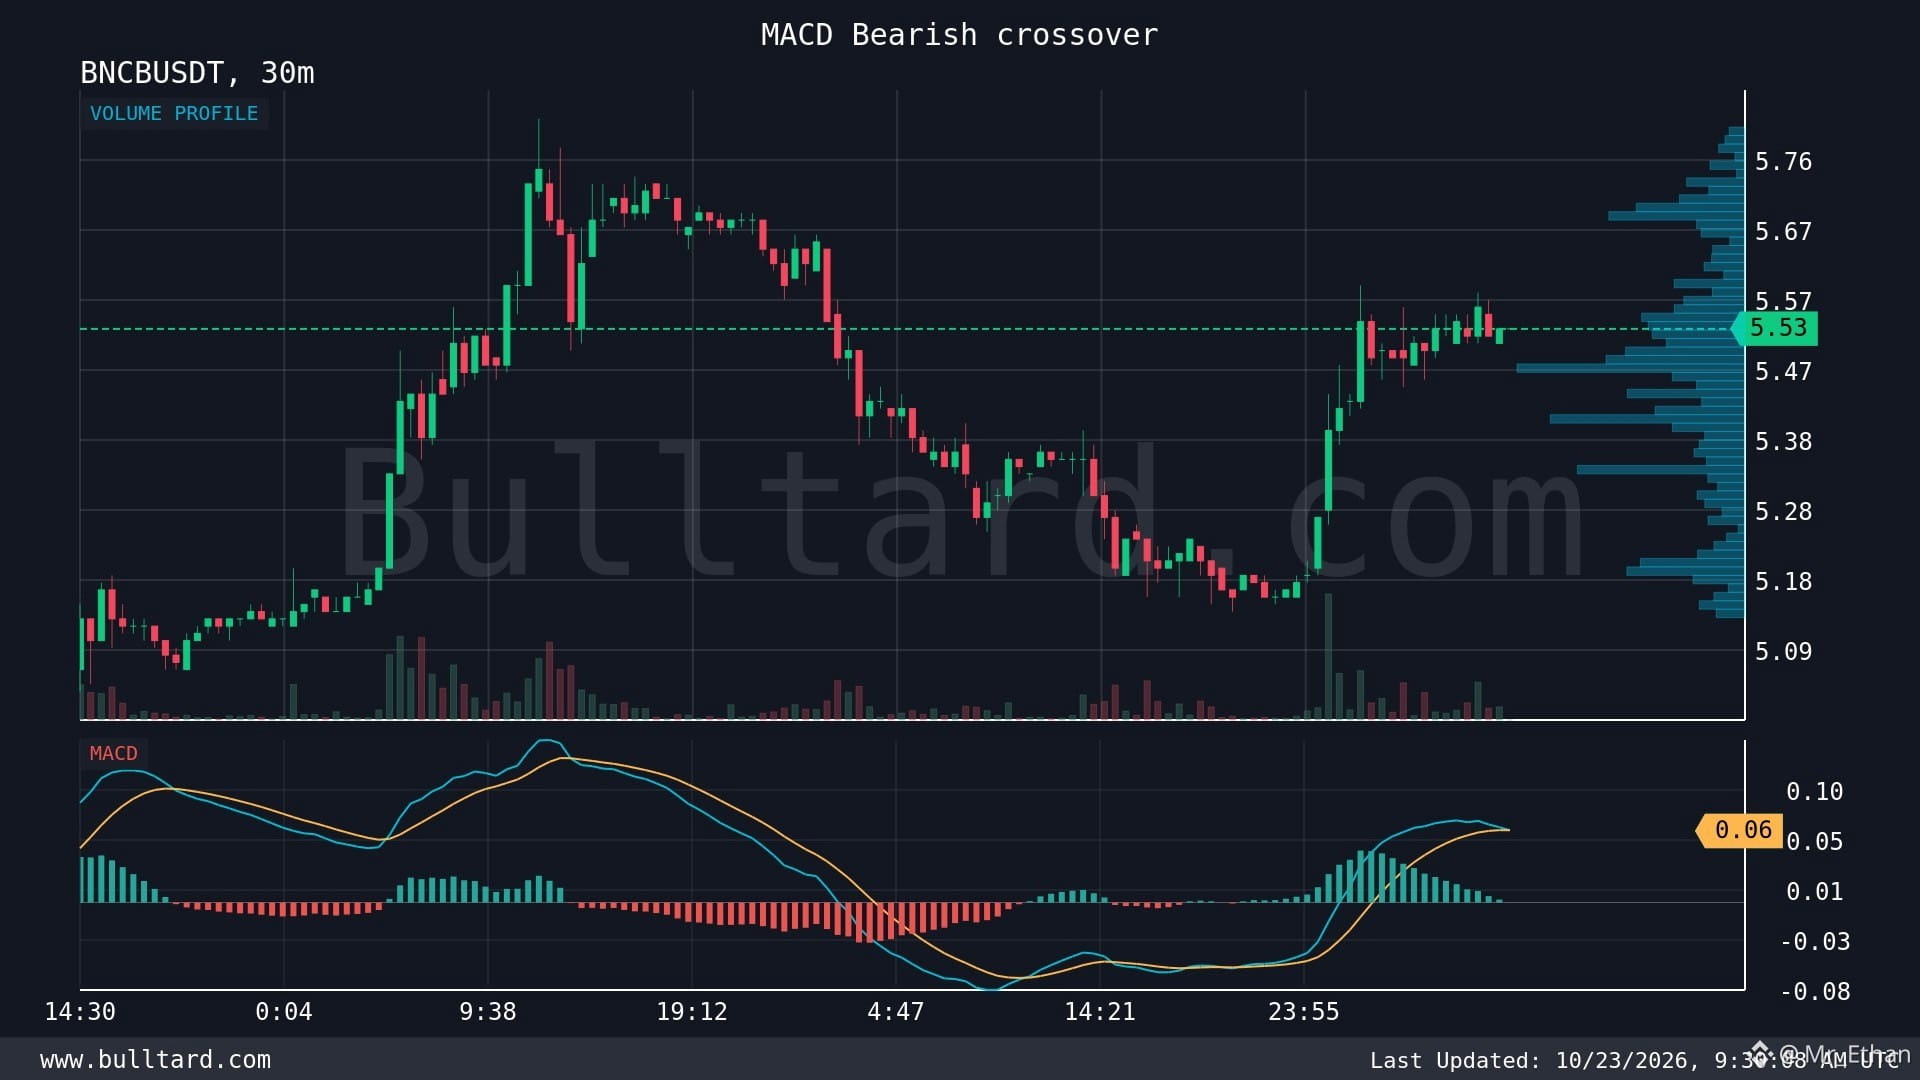
Price is around 5.53 USDT. The MACD line is at 0.06291, just below the signal line at 0.06297. The gap is tiny, but it’s worth watching.
From my experience, a bearish crossover can signal that buying momentum is slowing down. Still, I don’t treat one indicator as a reason to enter a trade immediately.
What matters now is price action. If BNCB starts making lower highs and selling volume increases, the bearish signal could gain strength. But if buyers defend the current level and price pushes back up, this crossover may turn into a false signal.
I also like to check the RSI, volume, and nearby support levels before making a decision. Compared with relying on MACD alone, combining indicators with price structure gives me a clearer picture.
My biggest lesson in crypto trading is simple: a signal is a warning, not a guarantee. Small crossovers can reverse quickly, especially in volatile altcoins with thinner liquidity.
For now, I’m watching how price reacts around 5.53 rather than rushing into a position.
What do you think? Will BNCB continue lower, or can buyers regain momentum? 📉📈
#BNCB #CryptoTrading #MACD #BinanceSquare
$BNCB
/USDT: I’m Watching This 30m MACD Signal 👀
I’ve been keeping an eye on BNCB/USDT, and the 30-minute MACD is showing a small bearish crossover.
Price is around 5.53 USDT. The MACD line is at 0.06291, just below the signal line at 0.06297. The gap is tiny, but it’s worth watching.
From my experience, a bearish crossover can signal that buying momentum is slowing down. Still, I don’t treat one indicator as a reason to enter a trade immediately.
What matters now is price action. If BNCB starts making lower highs and selling volume increases, the bearish signal could gain strength. But if buyers defend the current level and price pushes back up, this crossover may turn into a false signal.
I also like to check the RSI, volume, and nearby support levels before making a decision. Compared with relying on MACD alone, combining indicators with price structure gives me a clearer picture.
My biggest lesson in crypto trading is simple: a signal is a warning, not a guarantee. Small crossovers can reverse quickly, especially in volatile altcoins with thinner liquidity.
For now, I’m watching how price reacts around 5.53 rather than rushing into a position.
What do you think? Will BNCB continue lower, or can buyers regain momentum? 📉📈
#BNCB #CryptoTrading #MACD #BinanceSquare
/USDT: I’m Watching This 30m MACD Signal 👀
I’ve been keeping an eye on BNCB/USDT, and the 30-minute MACD is showing a small bearish crossover.
Price is around 5.53 USDT. The MACD line is at 0.06291, just below the signal line at 0.06297. The gap is tiny, but it’s worth watching.
From my experience, a bearish crossover can signal that buying momentum is slowing down. Still, I don’t treat one indicator as a reason to enter a trade immediately.
What matters now is price action. If BNCB starts making lower highs and selling volume increases, the bearish signal could gain strength. But if buyers defend the current level and price pushes back up, this crossover may turn into a false signal.
I also like to check the RSI, volume, and nearby support levels before making a decision. Compared with relying on MACD alone, combining indicators with price structure gives me a clearer picture.
My biggest lesson in crypto trading is simple: a signal is a warning, not a guarantee. Small crossovers can reverse quickly, especially in volatile altcoins with thinner liquidity.
For now, I’m watching how price reacts around 5.53 rather than rushing into a position.
What do you think? Will BNCB continue lower, or can buyers regain momentum? 📉📈
#BNCB #CryptoTrading #MACD #BinanceSquare
92
·
--
$BNB
{spot}(BNBUSDT)
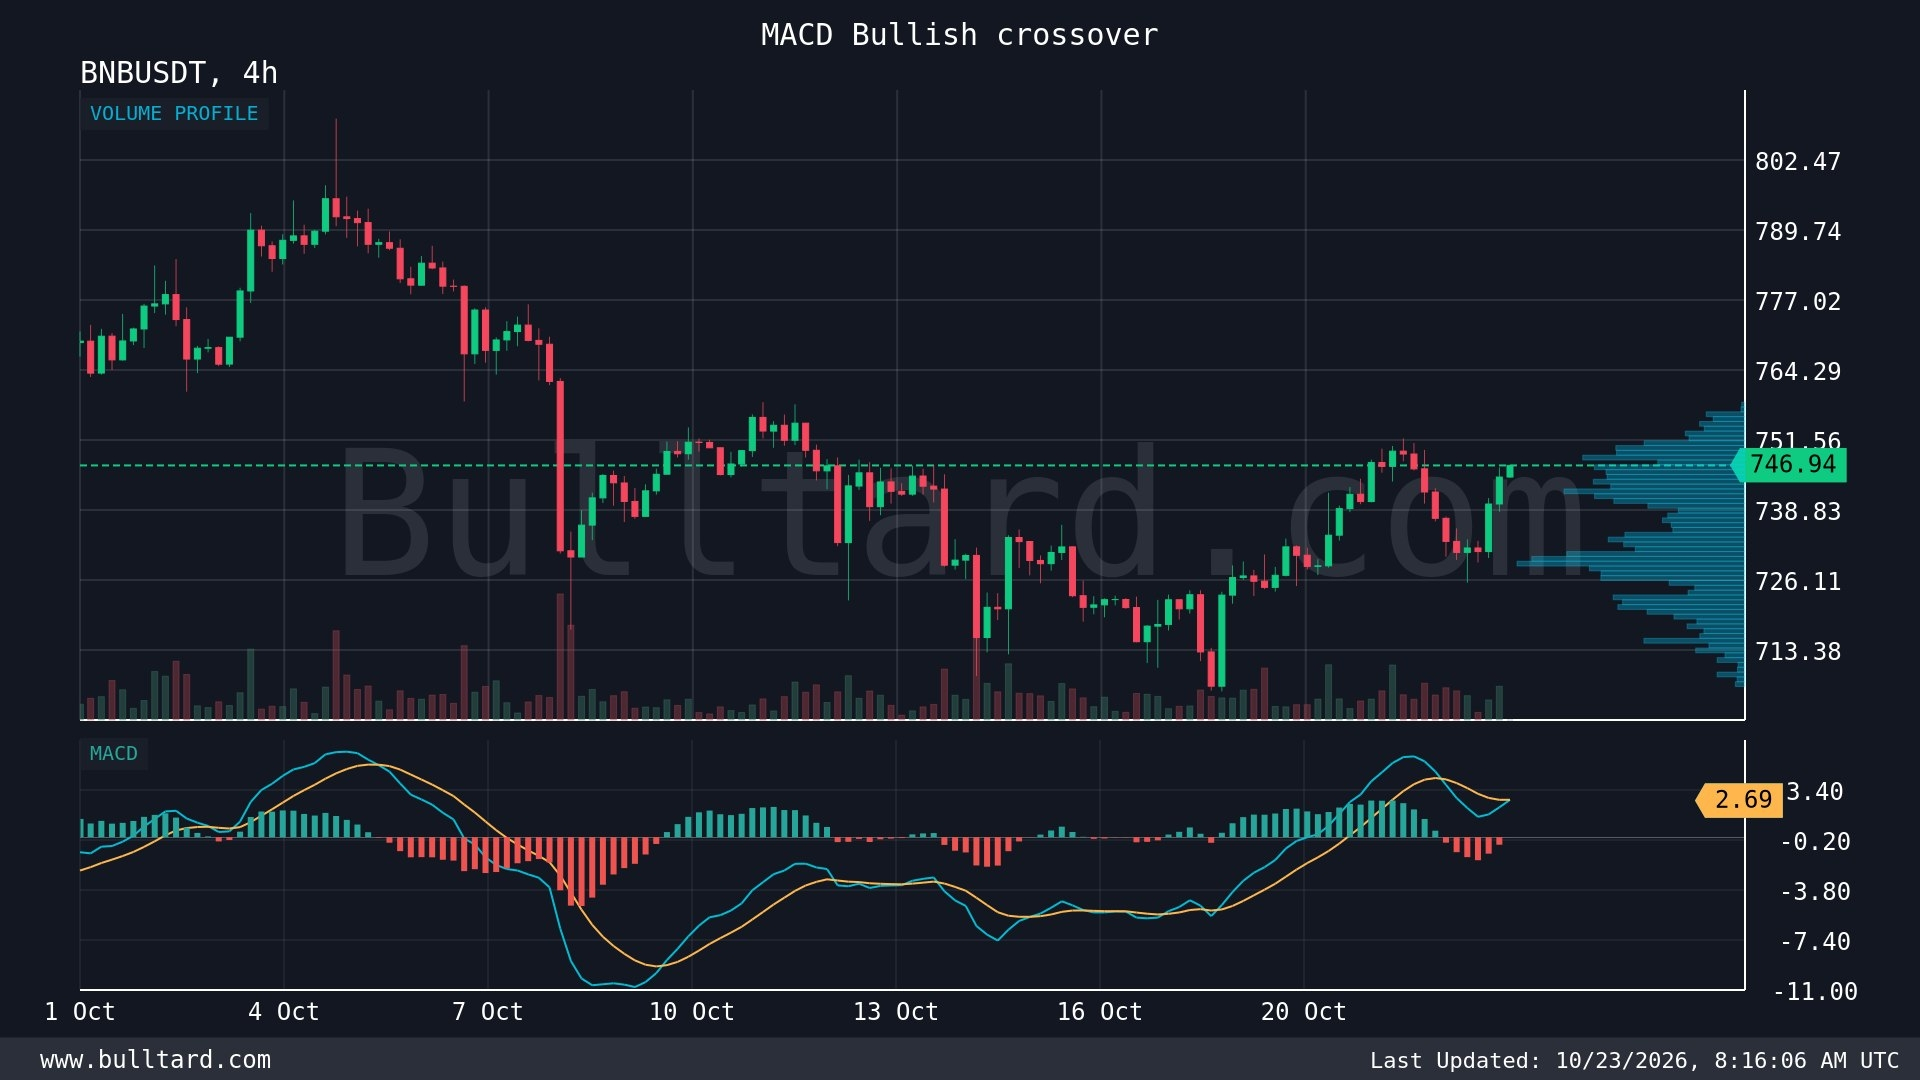
/USDT: MACD Bullish Crossover — Is Momentum Shifting? 📈
I’m keeping a close eye on BNB right now. On the 4H chart, the MACD line has moved slightly above the signal line, showing an early bullish crossover.
💰 Current Price: $746.94
📊 MACD Line: 2.70
📉 Signal Line: 2.69
🔍 My Market View
I’ve learned that small MACD crossovers can be useful early signals, but they need confirmation. The gap here is very narrow, so I want to see stronger buying volume and a solid 4H candle close before trusting this move.
🚀 Support & Resistance
🟢 Support: $740–$735
🔴 Resistance: $755–$765
🎯 Next Target: $775–$785 if buyers break resistance with strong volume.
These are watch zones, not guaranteed price levels.
⚖️ Strengths & Risks
BNB benefits from its role in the BNB Chain ecosystem, including transaction fees and decentralized applications. That gives it utility beyond short-term trading.
Still, crypto momentum can reverse quickly. A weak breakout, falling volume, or a bearish Bitcoin move could invalidate the bullish setup.
💡 My Pro Tip
I never rely on MACD alone. I combine it with volume, support and resistance, and price action. Protecting capital matters more than catching every move.
What do you think? Can BNB break $765, or will sellers push it back down? 👇
#BNB #BNBUSDT #CryptoTrading #MACD
$BNB
/USDT: MACD Bullish Crossover — Is Momentum Shifting? 📈
I’m keeping a close eye on BNB right now. On the 4H chart, the MACD line has moved slightly above the signal line, showing an early bullish crossover.
💰 Current Price: $746.94
📊 MACD Line: 2.70
📉 Signal Line: 2.69
🔍 My Market View
I’ve learned that small MACD crossovers can be useful early signals, but they need confirmation. The gap here is very narrow, so I want to see stronger buying volume and a solid 4H candle close before trusting this move.
🚀 Support & Resistance
🟢 Support: $740–$735
🔴 Resistance: $755–$765
🎯 Next Target: $775–$785 if buyers break resistance with strong volume.
These are watch zones, not guaranteed price levels.
⚖️ Strengths & Risks
BNB benefits from its role in the BNB Chain ecosystem, including transaction fees and decentralized applications. That gives it utility beyond short-term trading.
Still, crypto momentum can reverse quickly. A weak breakout, falling volume, or a bearish Bitcoin move could invalidate the bullish setup.
💡 My Pro Tip
I never rely on MACD alone. I combine it with volume, support and resistance, and price action. Protecting capital matters more than catching every move.
What do you think? Can BNB break $765, or will sellers push it back down? 👇
#BNB #BNBUSDT #CryptoTrading #MACD
/USDT: MACD Bullish Crossover — Is Momentum Shifting? 📈
I’m keeping a close eye on BNB right now. On the 4H chart, the MACD line has moved slightly above the signal line, showing an early bullish crossover.
💰 Current Price: $746.94
📊 MACD Line: 2.70
📉 Signal Line: 2.69
🔍 My Market View
I’ve learned that small MACD crossovers can be useful early signals, but they need confirmation. The gap here is very narrow, so I want to see stronger buying volume and a solid 4H candle close before trusting this move.
🚀 Support & Resistance
🟢 Support: $740–$735
🔴 Resistance: $755–$765
🎯 Next Target: $775–$785 if buyers break resistance with strong volume.
These are watch zones, not guaranteed price levels.
⚖️ Strengths & Risks
BNB benefits from its role in the BNB Chain ecosystem, including transaction fees and decentralized applications. That gives it utility beyond short-term trading.
Still, crypto momentum can reverse quickly. A weak breakout, falling volume, or a bearish Bitcoin move could invalidate the bullish setup.
💡 My Pro Tip
I never rely on MACD alone. I combine it with volume, support and resistance, and price action. Protecting capital matters more than catching every move.
What do you think? Can BNB break $765, or will sellers push it back down? 👇
#BNB #BNBUSDT #CryptoTrading #MACD
56
·
--
Падение
$MUBARAK
{spot}(MUBARAKUSDT)
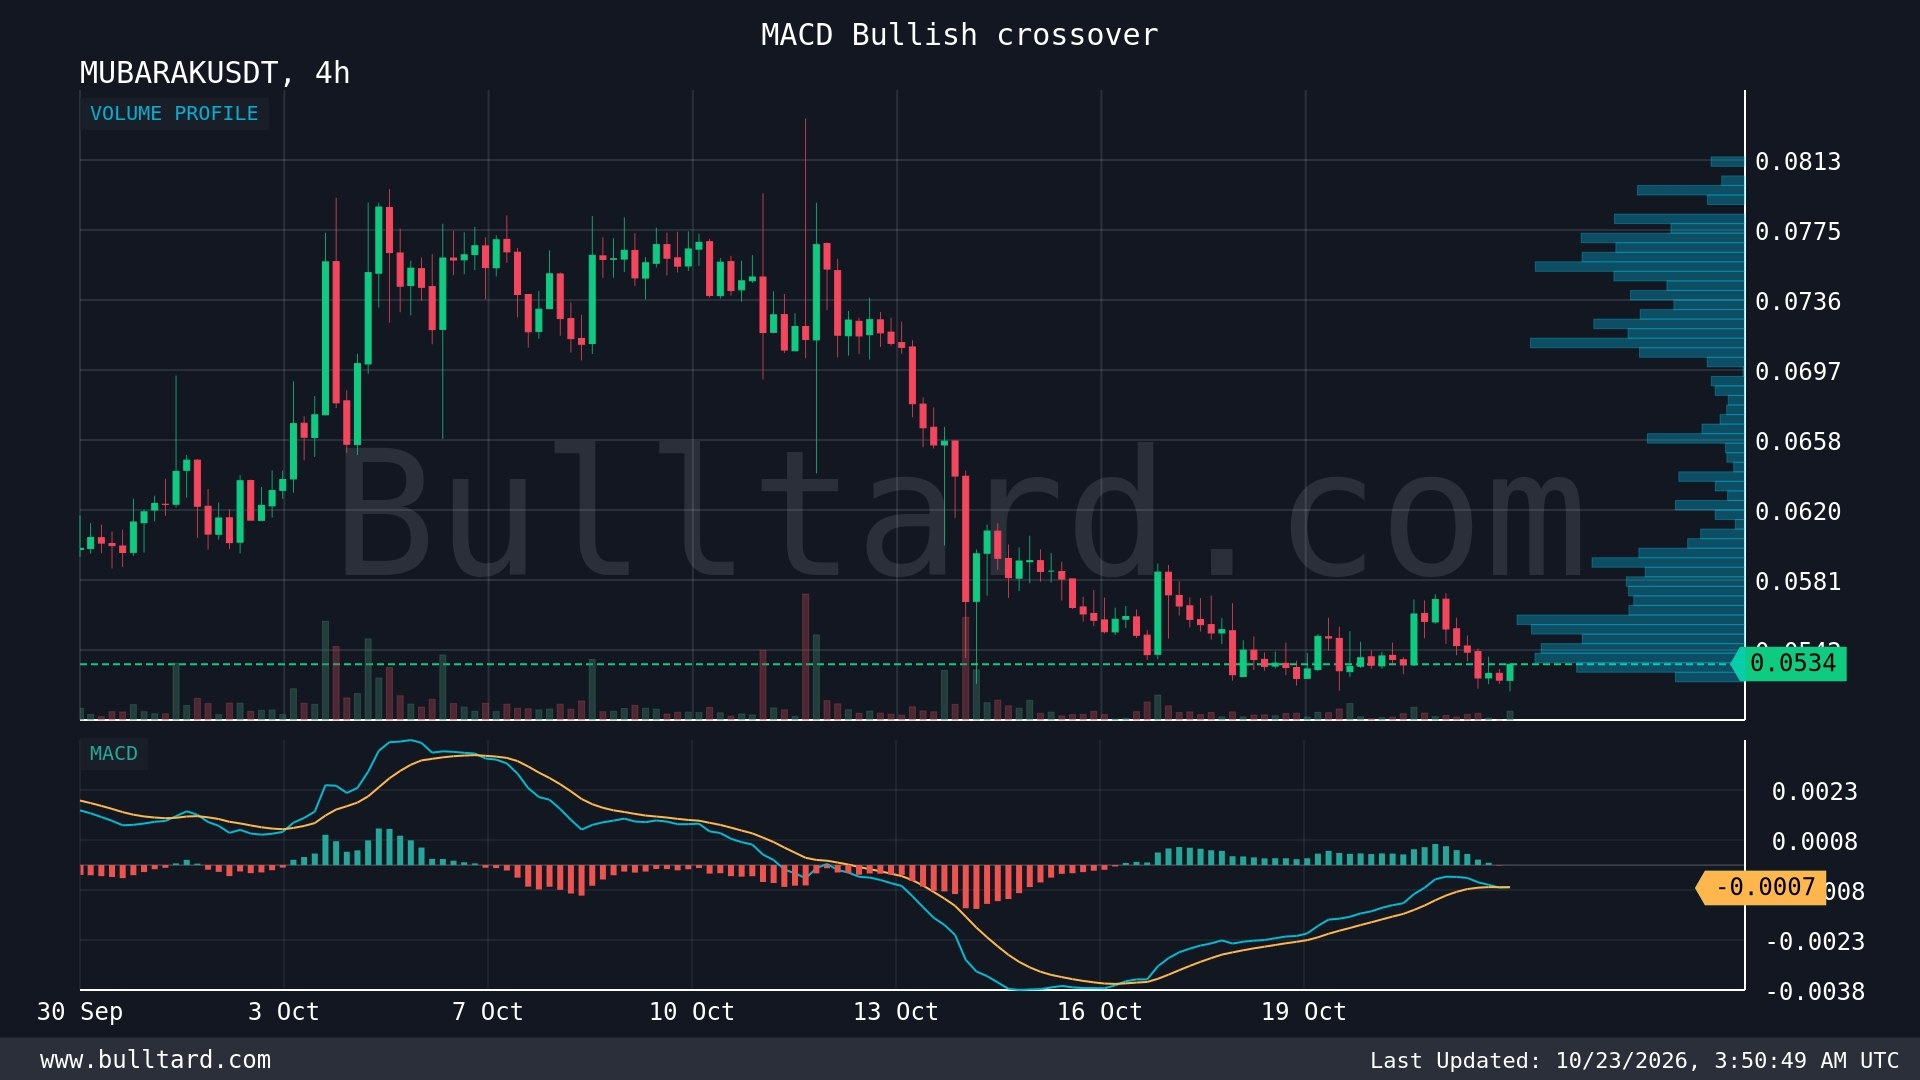
/USDT: I’m Watching This Bullish MACD Signal 👀📈
I’ve learned that some of the most interesting trading setups appear when momentum starts changing before the price makes a big move.
MUBARAK/USDT is showing a bullish MACD crossover on the 4-hour chart. The current price is around 0.05343 USDT. The MACD line is at -0.0006816, while the signal line is at -0.0006822.
The MACD line has moved slightly above the signal line. For me, this is an early sign that selling pressure could be fading. Both lines are still below zero, so I’d treat this as a possible momentum shift, not a confirmed trend reversal.
Small-cap tokens can move quickly when buying interest returns, but they can also suffer from low liquidity, sharp pullbacks, and sudden volatility. Compared with established ecosystem tokens, smaller projects may offer more volatility but often carry greater risk.
My next step would be to watch trading volume, resistance levels, and whether buyers can keep the price moving higher. I never rely on one indicator alone.
One lesson I’ve learned is that confirmation matters more than excitement.
Do you think MUBARAK can build bullish momentum from here, or is this crossover too weak to trust?
#MUBARAK #CryptoTrading #MACD #BinanceSquare
$MUBARAK
/USDT: I’m Watching This Bullish MACD Signal 👀📈
I’ve learned that some of the most interesting trading setups appear when momentum starts changing before the price makes a big move.
MUBARAK/USDT is showing a bullish MACD crossover on the 4-hour chart. The current price is around 0.05343 USDT. The MACD line is at -0.0006816, while the signal line is at -0.0006822.
The MACD line has moved slightly above the signal line. For me, this is an early sign that selling pressure could be fading. Both lines are still below zero, so I’d treat this as a possible momentum shift, not a confirmed trend reversal.
Small-cap tokens can move quickly when buying interest returns, but they can also suffer from low liquidity, sharp pullbacks, and sudden volatility. Compared with established ecosystem tokens, smaller projects may offer more volatility but often carry greater risk.
My next step would be to watch trading volume, resistance levels, and whether buyers can keep the price moving higher. I never rely on one indicator alone.
One lesson I’ve learned is that confirmation matters more than excitement.
Do you think MUBARAK can build bullish momentum from here, or is this crossover too weak to trust?
#MUBARAK #CryptoTrading #MACD #BinanceSquare
/USDT: I’m Watching This Bullish MACD Signal 👀📈
I’ve learned that some of the most interesting trading setups appear when momentum starts changing before the price makes a big move.
MUBARAK/USDT is showing a bullish MACD crossover on the 4-hour chart. The current price is around 0.05343 USDT. The MACD line is at -0.0006816, while the signal line is at -0.0006822.
The MACD line has moved slightly above the signal line. For me, this is an early sign that selling pressure could be fading. Both lines are still below zero, so I’d treat this as a possible momentum shift, not a confirmed trend reversal.
Small-cap tokens can move quickly when buying interest returns, but they can also suffer from low liquidity, sharp pullbacks, and sudden volatility. Compared with established ecosystem tokens, smaller projects may offer more volatility but often carry greater risk.
My next step would be to watch trading volume, resistance levels, and whether buyers can keep the price moving higher. I never rely on one indicator alone.
One lesson I’ve learned is that confirmation matters more than excitement.
Do you think MUBARAK can build bullish momentum from here, or is this crossover too weak to trust?
#MUBARAK #CryptoTrading #MACD #BinanceSquare
Binance BiBi:
I see! The post says MUBARAK/USDT on the 4-hour chart is showing an early bullish MACD crossover with price around 0.05343 USDT, which the author treats as a possible momentum shift (not a confirmed reversal) since both MACD lines are still below zero. It also warns that small-cap tokens can be very volatile due to lower liquidity and sharp pullbacks, and suggests watching volume, resistance levels, and follow-through instead of relying on one indicator. Not financial advice, DYOR.
2
1
470
·
--
$ASTER
{spot}(ASTERUSDT)
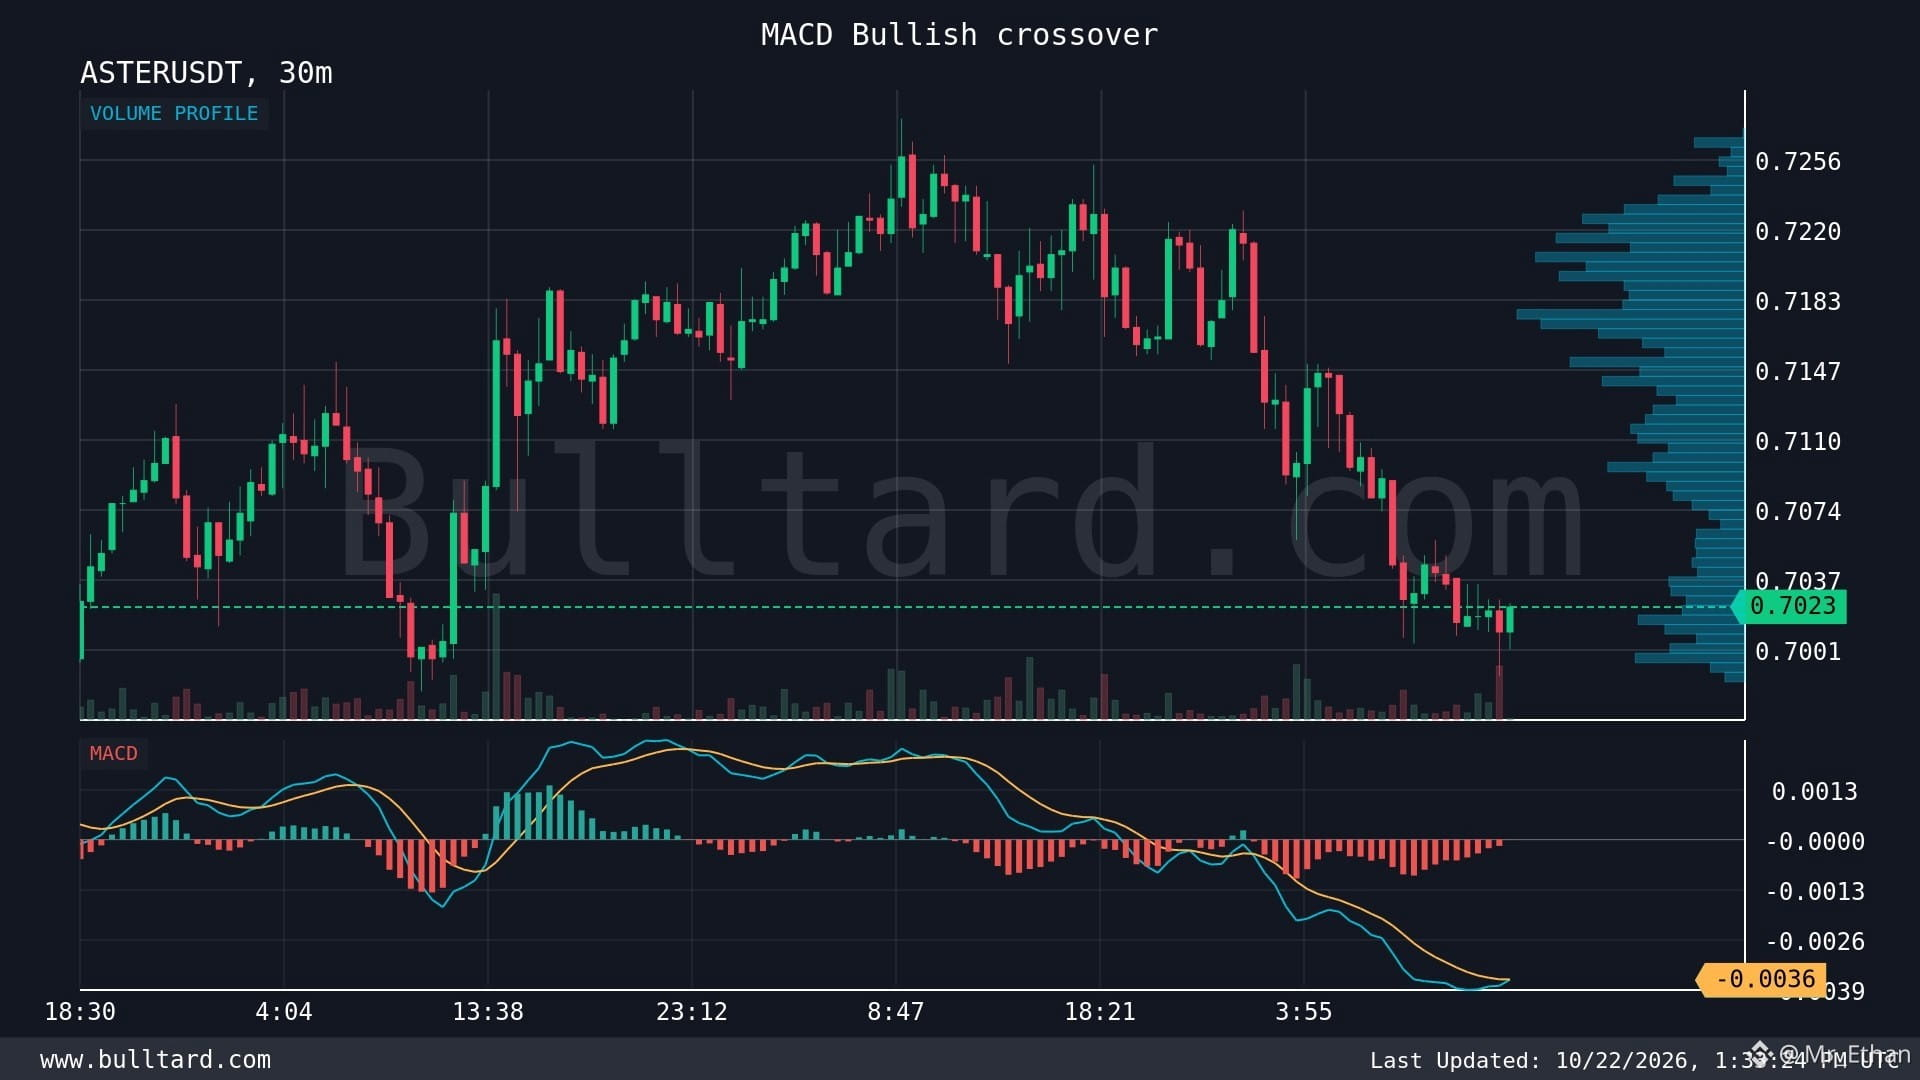
/USDT: I’m Watching This MACD Signal Closely 👀
I’ve been keeping an eye on ASTER, and the latest 30-minute chart is showing a small bullish MACD crossover. The price is around $0.7023, with the MACD line at -0.003622 moving just above the signal line at -0.003630.
For me, this is an early signal worth watching, not a reason to rush into a trade.
I’ve learned that MACD crossovers can show a shift in short-term momentum, especially when buyers start stepping in after a period of weakness. But when both lines are still below zero, I want to see stronger confirmation before getting too confident.
ASTER has an interesting place in the DeFi trading space, where traders care about liquidity, execution, and access to on-chain markets. Still, competition is strong, and market sentiment can change quickly. A bullish indicator alone cannot tell me whether buying pressure will last.
My next step is to watch volume, nearby resistance, and whether ASTER can hold its gains. If momentum fades, I’m not afraid to wait.
One lesson I’ve learned in crypto: protecting capital matters more than chasing every green signal.
Are you watching ASTER for a possible breakout, or do you think this crossover needs more confirmation?
#ASTER #CryptoTrading #MACD #DeFi #BinanceSquare
$ASTER
/USDT: I’m Watching This MACD Signal Closely 👀
I’ve been keeping an eye on ASTER, and the latest 30-minute chart is showing a small bullish MACD crossover. The price is around $0.7023, with the MACD line at -0.003622 moving just above the signal line at -0.003630.
For me, this is an early signal worth watching, not a reason to rush into a trade.
I’ve learned that MACD crossovers can show a shift in short-term momentum, especially when buyers start stepping in after a period of weakness. But when both lines are still below zero, I want to see stronger confirmation before getting too confident.
ASTER has an interesting place in the DeFi trading space, where traders care about liquidity, execution, and access to on-chain markets. Still, competition is strong, and market sentiment can change quickly. A bullish indicator alone cannot tell me whether buying pressure will last.
My next step is to watch volume, nearby resistance, and whether ASTER can hold its gains. If momentum fades, I’m not afraid to wait.
One lesson I’ve learned in crypto: protecting capital matters more than chasing every green signal.
Are you watching ASTER for a possible breakout, or do you think this crossover needs more confirmation?
#ASTER #CryptoTrading #MACD #DeFi #BinanceSquare
/USDT: I’m Watching This MACD Signal Closely 👀
I’ve been keeping an eye on ASTER, and the latest 30-minute chart is showing a small bullish MACD crossover. The price is around $0.7023, with the MACD line at -0.003622 moving just above the signal line at -0.003630.
For me, this is an early signal worth watching, not a reason to rush into a trade.
I’ve learned that MACD crossovers can show a shift in short-term momentum, especially when buyers start stepping in after a period of weakness. But when both lines are still below zero, I want to see stronger confirmation before getting too confident.
ASTER has an interesting place in the DeFi trading space, where traders care about liquidity, execution, and access to on-chain markets. Still, competition is strong, and market sentiment can change quickly. A bullish indicator alone cannot tell me whether buying pressure will last.
My next step is to watch volume, nearby resistance, and whether ASTER can hold its gains. If momentum fades, I’m not afraid to wait.
One lesson I’ve learned in crypto: protecting capital matters more than chasing every green signal.
Are you watching ASTER for a possible breakout, or do you think this crossover needs more confirmation?
#ASTER #CryptoTrading #MACD #DeFi #BinanceSquare
287
·
--
$XAUT
{spot}(XAUTUSDT)
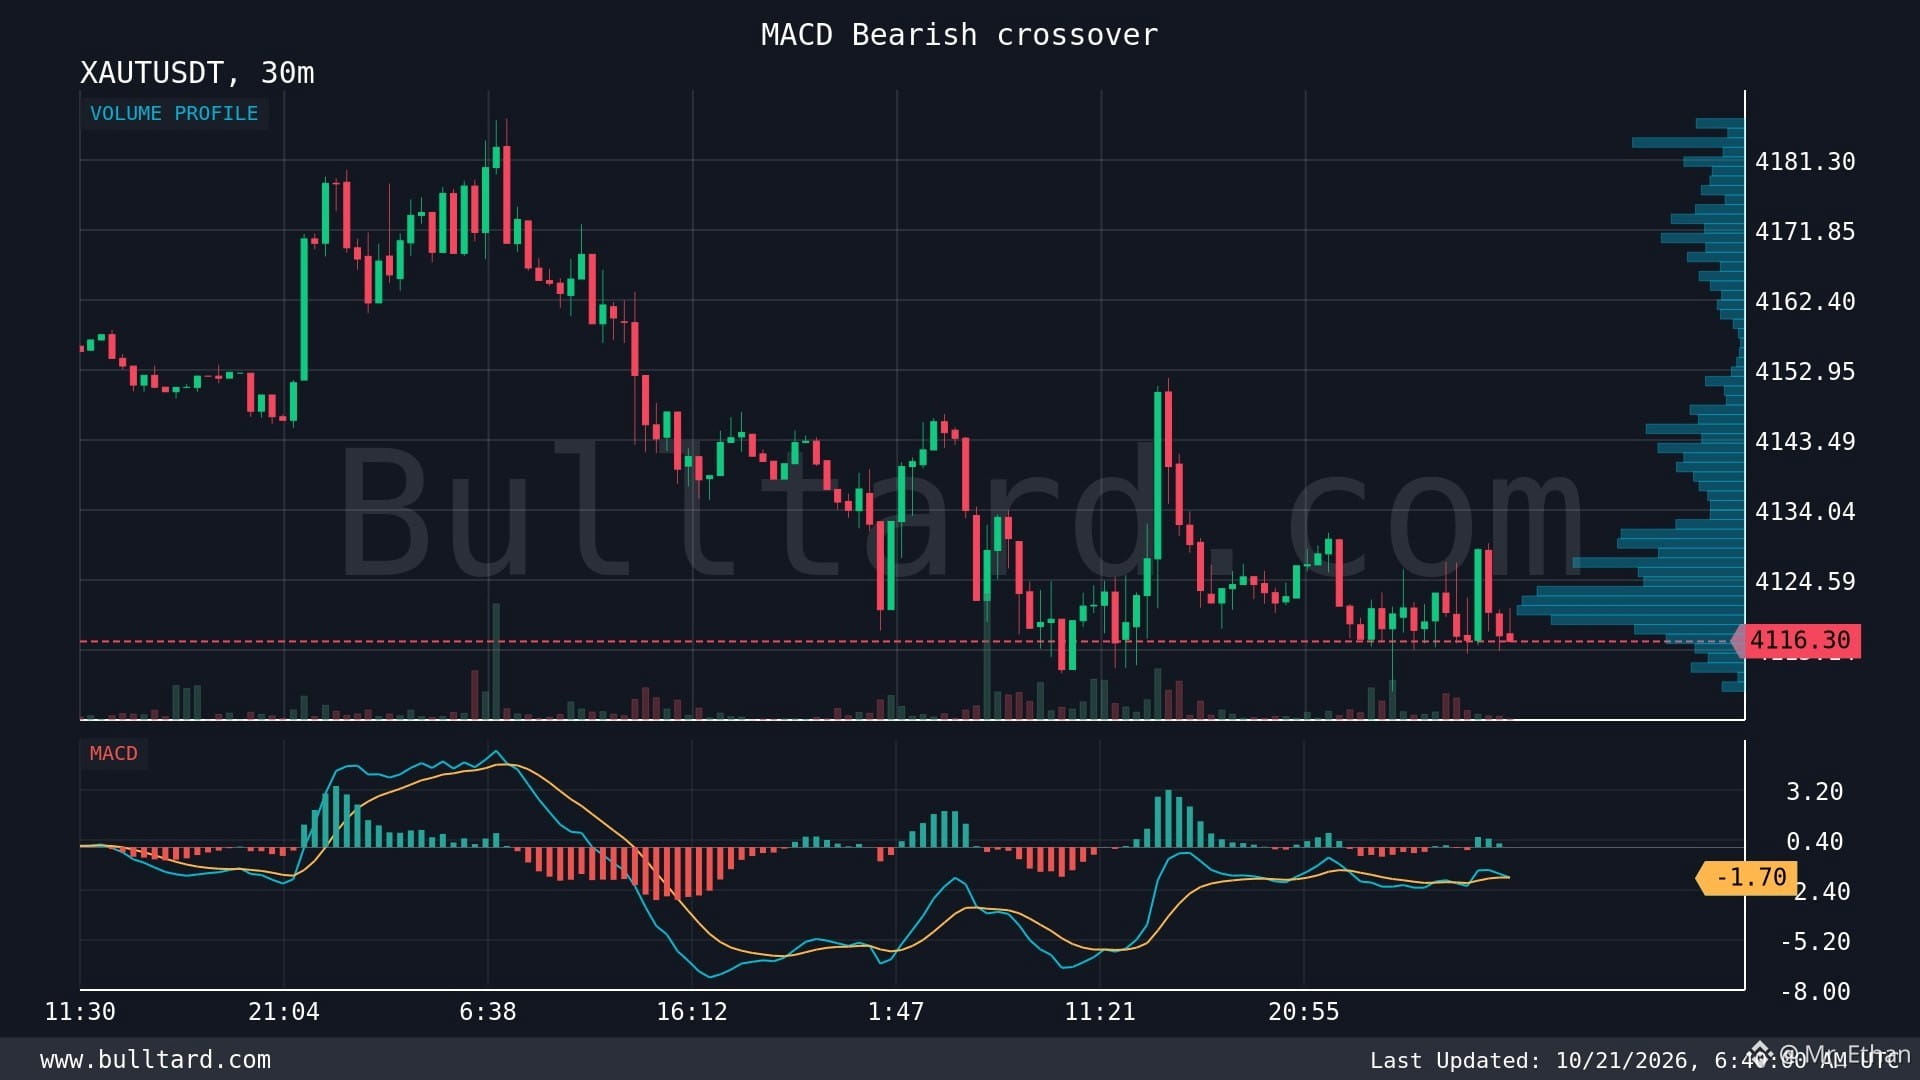
/USDT: I’m Watching This 30m MACD Bearish Crossover 👀
I’m keeping a close eye on XAUT/USDT as the 30-minute MACD shows a bearish crossover signal. The price is around $4,116.3, and momentum looks worth watching before making my next move.
XAUT is Tether Gold, a token backed by physical gold. I find it interesting because it connects traditional gold exposure with blockchain trading, making gold accessible through crypto markets.
But even gold-backed tokens can face short-term selling pressure. Right now, the MACD line is at -1.71, slightly below the signal line at -1.70. This suggests weakening short-term momentum, although one crossover alone doesn’t confirm a full trend reversal.
My approach is to watch price action, trading volume, and nearby support levels before deciding whether the bearish move has real strength. Compared with Bitcoin, XAUT follows gold more closely, but it still carries crypto-platform, liquidity, and market execution risks.
One lesson I’ve learned is that indicators work best when combined with price structure. Chasing every MACD crossover can lead to unnecessary losses, especially in choppy markets.
I’m staying cautious and waiting for confirmation rather than guessing the next move.
What do you think? Will XAUT face more downside, or could buyers defend the current level?
#XAUT #TetherGold #CryptoTrading #MACD #BinanceSquare
$XAUT
/USDT: I’m Watching This 30m MACD Bearish Crossover 👀
I’m keeping a close eye on XAUT/USDT as the 30-minute MACD shows a bearish crossover signal. The price is around $4,116.3, and momentum looks worth watching before making my next move.
XAUT is Tether Gold, a token backed by physical gold. I find it interesting because it connects traditional gold exposure with blockchain trading, making gold accessible through crypto markets.
But even gold-backed tokens can face short-term selling pressure. Right now, the MACD line is at -1.71, slightly below the signal line at -1.70. This suggests weakening short-term momentum, although one crossover alone doesn’t confirm a full trend reversal.
My approach is to watch price action, trading volume, and nearby support levels before deciding whether the bearish move has real strength. Compared with Bitcoin, XAUT follows gold more closely, but it still carries crypto-platform, liquidity, and market execution risks.
One lesson I’ve learned is that indicators work best when combined with price structure. Chasing every MACD crossover can lead to unnecessary losses, especially in choppy markets.
I’m staying cautious and waiting for confirmation rather than guessing the next move.
What do you think? Will XAUT face more downside, or could buyers defend the current level?
#XAUT #TetherGold #CryptoTrading #MACD #BinanceSquare
/USDT: I’m Watching This 30m MACD Bearish Crossover 👀
I’m keeping a close eye on XAUT/USDT as the 30-minute MACD shows a bearish crossover signal. The price is around $4,116.3, and momentum looks worth watching before making my next move.
XAUT is Tether Gold, a token backed by physical gold. I find it interesting because it connects traditional gold exposure with blockchain trading, making gold accessible through crypto markets.
But even gold-backed tokens can face short-term selling pressure. Right now, the MACD line is at -1.71, slightly below the signal line at -1.70. This suggests weakening short-term momentum, although one crossover alone doesn’t confirm a full trend reversal.
My approach is to watch price action, trading volume, and nearby support levels before deciding whether the bearish move has real strength. Compared with Bitcoin, XAUT follows gold more closely, but it still carries crypto-platform, liquidity, and market execution risks.
One lesson I’ve learned is that indicators work best when combined with price structure. Chasing every MACD crossover can lead to unnecessary losses, especially in choppy markets.
I’m staying cautious and waiting for confirmation rather than guessing the next move.
What do you think? Will XAUT face more downside, or could buyers defend the current level?
#XAUT #TetherGold #CryptoTrading #MACD #BinanceSquare
131

·
--
Статья
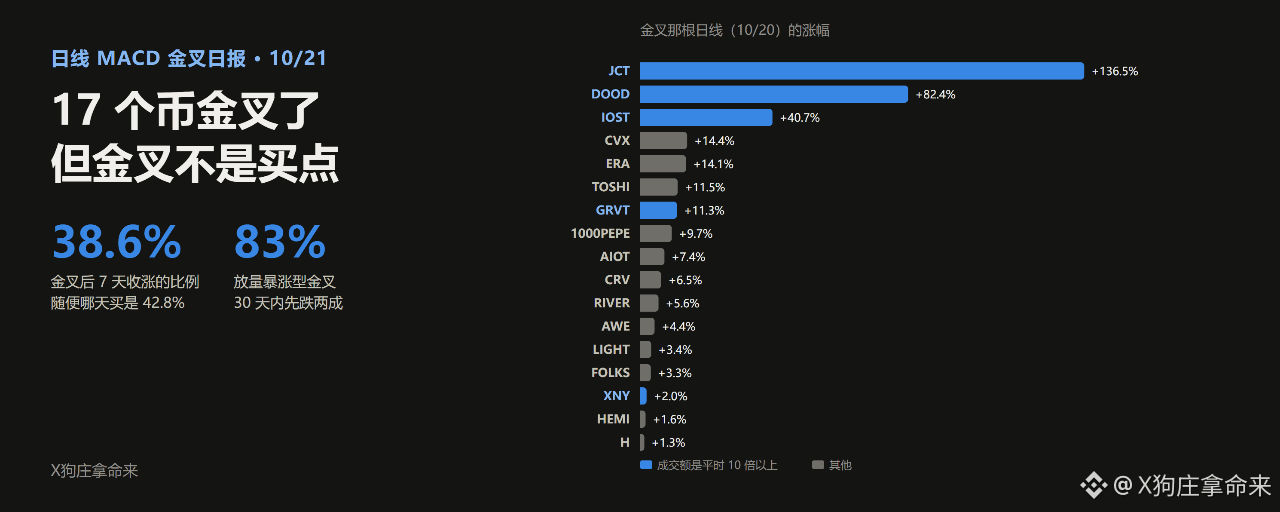
10/21 日线 MACD 金叉日报:17 个币金叉了,但金叉不是买点今早 8 点日线收盘后,币安合约里有 17 个币出了日线 MACD 金叉,都是金叉后的第一根日线。我按金叉那天的表现把它们分成三组。先说结论:金叉本身不是买点,它只是告诉你"这个币开始有动静了"。
▍先科普:MACD 金叉是什么
MACD 有两条线,一条快线、一条慢线。快线从下往上穿过慢线,就叫金叉,意思是最近几天的涨势比之前强了。
金叉出在零轴下面,一般是下跌途中的第一次反弹;出在零轴上面,是已经在涨的币又加了一把劲。
▍先说实话:金叉单独用,和随便哪天买差不多
我拿币安合约近 1000 天的日K(633 个币,包括已经下架的)算了一遍,一共 13,096 次日线金叉,假设金叉那天收盘买入:
· 7 天后收盘上涨的只有 38.6%,随便挑一天买是 42.8%。
· 30 天后收盘一般跌 7.7%,随便挑一天买是跌 7.8%,几乎一样。
· 零轴上面的金叉更差:30 天后收盘上涨的只有 27%。
· 金叉当天放量暴涨的(一天涨 30% 以上、成交是平时 10 倍以上):30 天内翻倍的有 20.5%,是随便哪天的 2.7 倍;但 83% 会先跌掉两成,30 天后收盘一般跌 26%。
说白了:金叉是一张观察名单,不是买入单。
▍第一组:放量暴涨,已经涨了一大截
· $JCT 金叉那天涨 136.5%,成交 6.37 亿美金,是平时的 123 倍,日线 RSI 79.6,已经很热。空单还在加。
· $DOOD 涨 82.4%,成交 1.9 亿美金,是平时的 147 倍,RSI 77.2,合约持仓 7 天涨了 182%。
· $IOST 涨 40.7%,成交是平时的 25 倍,合约持仓 7 天涨了 187%,但离 90 天高点还差 45%。
这一组不追,等回踩。按上面的数据,这种金叉大多会先回撤两成。
▍第二组:放量但没暴涨,重点观察
· XNY:只涨了 2%,成交却是平时的 20 倍。放量不涨,要么有人在接,要么有人在出,接下来几天看方向。
· GRVT:涨 11.3%,成交是平时的 10 倍,RSI 69.5,离 30 天高点只差 1%。
· ERA:涨 14.1%,成交是平时的 10 倍左右。多空谁付钱这一项是负的,空头每 4 小时付 0.048% 给多头,做空的人挤成一团。
· CVX:涨 14.4%,成交是平时的 4 倍,价格已经站上 30 天和 90 天的高点。
· 1000PEPE:涨 9.7%,成交 3.95 亿美金,这批里仅次于 JCT。大币金叉,走得会慢一些。
▍第三组:缩量,或者还在低位磨
· CRV、AIOT、TOSHI、AWE、LIGHT、FOLKS:金叉那天涨 3% 到 12%,成交在平时的 0.7 到 2.5 倍之间,没什么新钱进来。
· RIVER、HEMI、H:成交比平时还少,日线 RSI 在 40 上下,离 90 天高点还差 65% 到 77%。这种金叉多半只是跌累了喘口气。
▍我怎么用这份名单
· 只当观察池,不当买入单。
· 第一组等回踩,不追。
· 第二组盯接下来 3 到 5 天,能守住金叉那天的最低价才继续看。
· 第三组先放一放,等成交量起来再说。
· 不管看哪个,都只开 1 倍。
不构成投资建议。
这 17 个里你最看好哪个?评论区聊聊。
#MACD #币安合约 #山寨币 #JCT
10/21 日线 MACD 金叉日报:17 个币金叉了,但金叉不是买点
今早 8 点日线收盘后,币安合约里有 17 个币出了日线 MACD 金叉,都是金叉后的第一根日线。我按金叉那天的表现把它们分成三组。先说结论:金叉本身不是买点,它只是告诉你"这个币开始有动静了"。
▍先科普:MACD 金叉是什么
MACD 有两条线,一条快线、一条慢线。快线从下往上穿过慢线,就叫金叉,意思是最近几天的涨势比之前强了。
金叉出在零轴下面,一般是下跌途中的第一次反弹;出在零轴上面,是已经在涨的币又加了一把劲。
▍先说实话:金叉单独用,和随便哪天买差不多
我拿币安合约近 1000 天的日K(633 个币,包括已经下架的)算了一遍,一共 13,096 次日线金叉,假设金叉那天收盘买入:
· 7 天后收盘上涨的只有 38.6%,随便挑一天买是 42.8%。
· 30 天后收盘一般跌 7.7%,随便挑一天买是跌 7.8%,几乎一样。
· 零轴上面的金叉更差:30 天后收盘上涨的只有 27%。
· 金叉当天放量暴涨的(一天涨 30% 以上、成交是平时 10 倍以上):30 天内翻倍的有 20.5%,是随便哪天的 2.7 倍;但 83% 会先跌掉两成,30 天后收盘一般跌 26%。
说白了:金叉是一张观察名单,不是买入单。
▍第一组:放量暴涨,已经涨了一大截
· $JCT 金叉那天涨 136.5%,成交 6.37 亿美金,是平时的 123 倍,日线 RSI 79.6,已经很热。空单还在加。
· $DOOD 涨 82.4%,成交 1.9 亿美金,是平时的 147 倍,RSI 77.2,合约持仓 7 天涨了 182%。
· $IOST 涨 40.7%,成交是平时的 25 倍,合约持仓 7 天涨了 187%,但离 90 天高点还差 45%。
这一组不追,等回踩。按上面的数据,这种金叉大多会先回撤两成。
▍第二组:放量但没暴涨,重点观察
· XNY:只涨了 2%,成交却是平时的 20 倍。放量不涨,要么有人在接,要么有人在出,接下来几天看方向。
· GRVT:涨 11.3%,成交是平时的 10 倍,RSI 69.5,离 30 天高点只差 1%。
· ERA:涨 14.1%,成交是平时的 10 倍左右。多空谁付钱这一项是负的,空头每 4 小时付 0.048% 给多头,做空的人挤成一团。
· CVX:涨 14.4%,成交是平时的 4 倍,价格已经站上 30 天和 90 天的高点。
· 1000PEPE:涨 9.7%,成交 3.95 亿美金,这批里仅次于 JCT。大币金叉,走得会慢一些。
▍第三组:缩量,或者还在低位磨
· CRV、AIOT、TOSHI、AWE、LIGHT、FOLKS:金叉那天涨 3% 到 12%,成交在平时的 0.7 到 2.5 倍之间,没什么新钱进来。
· RIVER、HEMI、H:成交比平时还少,日线 RSI 在 40 上下,离 90 天高点还差 65% 到 77%。这种金叉多半只是跌累了喘口气。
▍我怎么用这份名单
· 只当观察池,不当买入单。
· 第一组等回踩,不追。
· 第二组盯接下来 3 到 5 天,能守住金叉那天的最低价才继续看。
· 第三组先放一放,等成交量起来再说。
· 不管看哪个,都只开 1 倍。
不构成投资建议。
这 17 个里你最看好哪个?评论区聊聊。
#MACD #币安合约 #山寨币 #JCT
▍先科普:MACD 金叉是什么
MACD 有两条线,一条快线、一条慢线。快线从下往上穿过慢线,就叫金叉,意思是最近几天的涨势比之前强了。
金叉出在零轴下面,一般是下跌途中的第一次反弹;出在零轴上面,是已经在涨的币又加了一把劲。
▍先说实话:金叉单独用,和随便哪天买差不多
我拿币安合约近 1000 天的日K(633 个币,包括已经下架的)算了一遍,一共 13,096 次日线金叉,假设金叉那天收盘买入:
· 7 天后收盘上涨的只有 38.6%,随便挑一天买是 42.8%。
· 30 天后收盘一般跌 7.7%,随便挑一天买是跌 7.8%,几乎一样。
· 零轴上面的金叉更差:30 天后收盘上涨的只有 27%。
· 金叉当天放量暴涨的(一天涨 30% 以上、成交是平时 10 倍以上):30 天内翻倍的有 20.5%,是随便哪天的 2.7 倍;但 83% 会先跌掉两成,30 天后收盘一般跌 26%。
说白了:金叉是一张观察名单,不是买入单。
▍第一组:放量暴涨,已经涨了一大截
· $JCT 金叉那天涨 136.5%,成交 6.37 亿美金,是平时的 123 倍,日线 RSI 79.6,已经很热。空单还在加。
· $DOOD 涨 82.4%,成交 1.9 亿美金,是平时的 147 倍,RSI 77.2,合约持仓 7 天涨了 182%。
· $IOST 涨 40.7%,成交是平时的 25 倍,合约持仓 7 天涨了 187%,但离 90 天高点还差 45%。
这一组不追,等回踩。按上面的数据,这种金叉大多会先回撤两成。
▍第二组:放量但没暴涨,重点观察
· XNY:只涨了 2%,成交却是平时的 20 倍。放量不涨,要么有人在接,要么有人在出,接下来几天看方向。
· GRVT:涨 11.3%,成交是平时的 10 倍,RSI 69.5,离 30 天高点只差 1%。
· ERA:涨 14.1%,成交是平时的 10 倍左右。多空谁付钱这一项是负的,空头每 4 小时付 0.048% 给多头,做空的人挤成一团。
· CVX:涨 14.4%,成交是平时的 4 倍,价格已经站上 30 天和 90 天的高点。
· 1000PEPE:涨 9.7%,成交 3.95 亿美金,这批里仅次于 JCT。大币金叉,走得会慢一些。
▍第三组:缩量,或者还在低位磨
· CRV、AIOT、TOSHI、AWE、LIGHT、FOLKS:金叉那天涨 3% 到 12%,成交在平时的 0.7 到 2.5 倍之间,没什么新钱进来。
· RIVER、HEMI、H:成交比平时还少,日线 RSI 在 40 上下,离 90 天高点还差 65% 到 77%。这种金叉多半只是跌累了喘口气。
▍我怎么用这份名单
· 只当观察池,不当买入单。
· 第一组等回踩,不追。
· 第二组盯接下来 3 到 5 天,能守住金叉那天的最低价才继续看。
· 第三组先放一放,等成交量起来再说。
· 不管看哪个,都只开 1 倍。
不构成投资建议。
这 17 个里你最看好哪个?评论区聊聊。
#MACD #币安合约 #山寨币 #JCT
1.4k

·
--
पार्ट 65 | MACD क्या है?
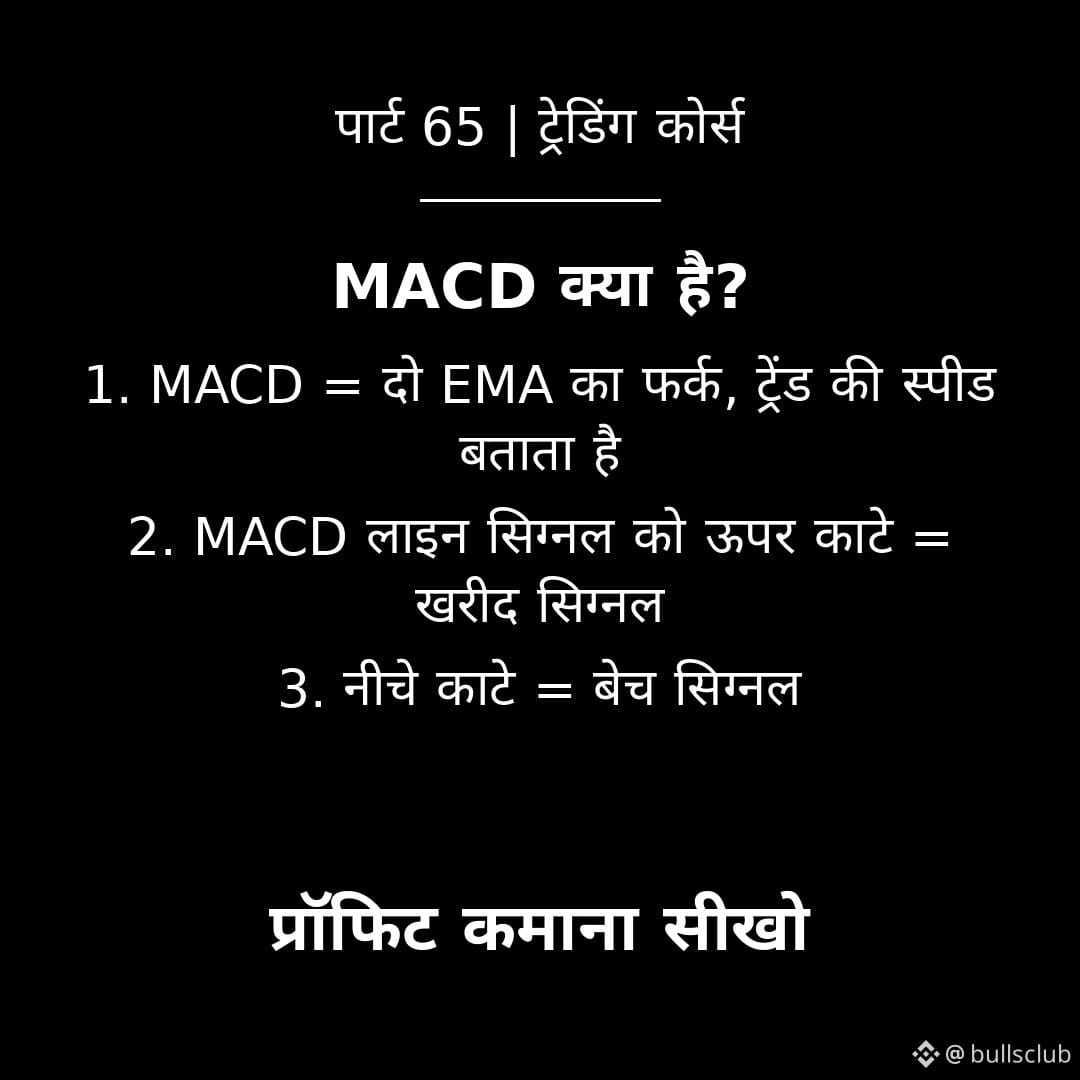
MACD दो EMA के फर्क से ट्रेंड की स्पीड और दिशा बताता है। जब MACD लाइन सिग्नल लाइन को ऊपर काटती है, तो खरीद का सिग्नल है। नीचे काटे तो बेच का सिग्नल। हिस्टोग्राम बार्स मोमेंटम की ताक़त दिखाते हैं।
कैसे इस्तेमाल करें:
1. ऊपर क्रॉसओवर = तेज़ी की शुरुआत संभव
2. नीचे क्रॉसओवर = मंदी की शुरुआत संभव
3. ज़ीरो लाइन के ऊपर के सिग्नल ज़्यादा भरोसेमंद
याद रखो: MACD ट्रेंड वाले बाज़ार में बेस्ट है, रेंज में गलत सिग्नल देता है।
फॉलो करो 👇
#Indicators #RSI #MACD #TechnicalAnalysis $ETH
पार्ट 65 | MACD क्या है?
MACD दो EMA के फर्क से ट्रेंड की स्पीड और दिशा बताता है। जब MACD लाइन सिग्नल लाइन को ऊपर काटती है, तो खरीद का सिग्नल है। नीचे काटे तो बेच का सिग्नल। हिस्टोग्राम बार्स मोमेंटम की ताक़त दिखाते हैं।
कैसे इस्तेमाल करें:
1. ऊपर क्रॉसओवर = तेज़ी की शुरुआत संभव
2. नीचे क्रॉसओवर = मंदी की शुरुआत संभव
3. ज़ीरो लाइन के ऊपर के सिग्नल ज़्यादा भरोसेमंद
याद रखो: MACD ट्रेंड वाले बाज़ार में बेस्ट है, रेंज में गलत सिग्नल देता है।
फॉलो करो 👇
#Indicators #RSI #MACD #TechnicalAnalysis $ETH
MACD दो EMA के फर्क से ट्रेंड की स्पीड और दिशा बताता है। जब MACD लाइन सिग्नल लाइन को ऊपर काटती है, तो खरीद का सिग्नल है। नीचे काटे तो बेच का सिग्नल। हिस्टोग्राम बार्स मोमेंटम की ताक़त दिखाते हैं।
कैसे इस्तेमाल करें:
1. ऊपर क्रॉसओवर = तेज़ी की शुरुआत संभव
2. नीचे क्रॉसओवर = मंदी की शुरुआत संभव
3. ज़ीरो लाइन के ऊपर के सिग्नल ज़्यादा भरोसेमंद
याद रखो: MACD ट्रेंड वाले बाज़ार में बेस्ट है, रेंज में गलत सिग्नल देता है।
फॉलो करो 👇
#Indicators #RSI #MACD #TechnicalAnalysis $ETH
27
·
--
$SOL
{spot}(SOLUSDT)
/USDT: I’m Watching This Bearish Signal Closely 👀
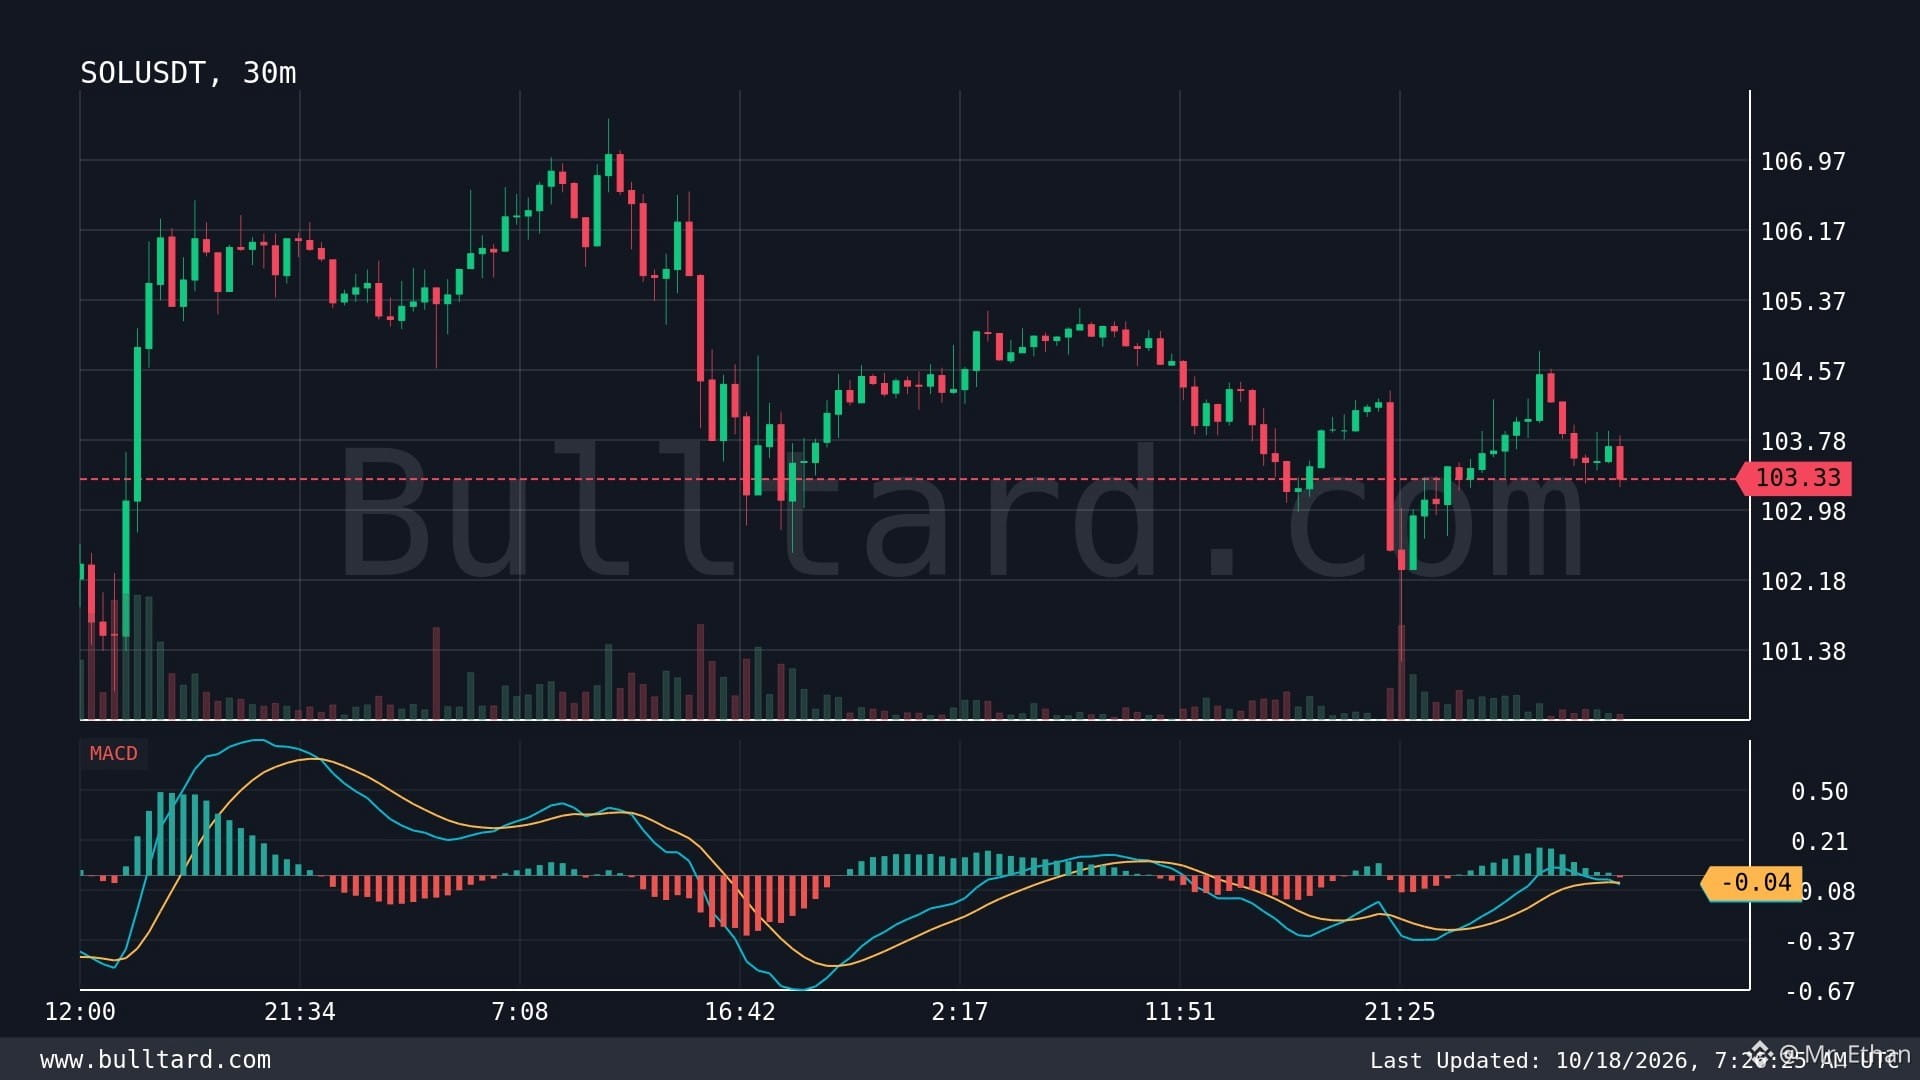
I’m keeping an eye on Solana right now. $SOL is trading around $103.33, and the 30-minute MACD has formed a bearish crossover. For me, that’s a sign to slow down and watch price action carefully.
I’ve learned that short-term momentum can change quickly in crypto. A bearish crossover may point to selling pressure, but I never treat one indicator as a guaranteed prediction. Volume, support levels, and Bitcoin’s direction also matter.
What I like about Solana is its fast transactions, relatively low fees, and strong focus on DeFi, meme coins, and on-chain applications. Compared with many older networks, Solana aims to make blockchain activity smoother and more affordable for everyday users.
But I also see risks. Network reliability, intense competition from Ethereum and other Layer 1 chains, and sudden market-wide sell-offs can affect SOL. Strong ecosystem activity doesn’t always mean the token price will rise.
My strategy is to wait for confirmation instead of chasing every candle. If sellers stay in control, SOL could face more downside pressure. If buyers return with strong volume, the bearish signal may fade.
My lesson: protect capital first, profits second.
Do you think SOL will drop further or recover from here?
#SOL #Solana #CryptoTrading #MACD
$SOL
/USDT: I’m Watching This Bearish Signal Closely 👀
I’m keeping an eye on Solana right now. $SOL is trading around $103.33, and the 30-minute MACD has formed a bearish crossover. For me, that’s a sign to slow down and watch price action carefully.
I’ve learned that short-term momentum can change quickly in crypto. A bearish crossover may point to selling pressure, but I never treat one indicator as a guaranteed prediction. Volume, support levels, and Bitcoin’s direction also matter.
What I like about Solana is its fast transactions, relatively low fees, and strong focus on DeFi, meme coins, and on-chain applications. Compared with many older networks, Solana aims to make blockchain activity smoother and more affordable for everyday users.
But I also see risks. Network reliability, intense competition from Ethereum and other Layer 1 chains, and sudden market-wide sell-offs can affect SOL. Strong ecosystem activity doesn’t always mean the token price will rise.
My strategy is to wait for confirmation instead of chasing every candle. If sellers stay in control, SOL could face more downside pressure. If buyers return with strong volume, the bearish signal may fade.
My lesson: protect capital first, profits second.
Do you think SOL will drop further or recover from here?
#SOL #Solana #CryptoTrading #MACD
/USDT: I’m Watching This Bearish Signal Closely 👀
I’m keeping an eye on Solana right now. $SOL is trading around $103.33, and the 30-minute MACD has formed a bearish crossover. For me, that’s a sign to slow down and watch price action carefully.
I’ve learned that short-term momentum can change quickly in crypto. A bearish crossover may point to selling pressure, but I never treat one indicator as a guaranteed prediction. Volume, support levels, and Bitcoin’s direction also matter.
What I like about Solana is its fast transactions, relatively low fees, and strong focus on DeFi, meme coins, and on-chain applications. Compared with many older networks, Solana aims to make blockchain activity smoother and more affordable for everyday users.
But I also see risks. Network reliability, intense competition from Ethereum and other Layer 1 chains, and sudden market-wide sell-offs can affect SOL. Strong ecosystem activity doesn’t always mean the token price will rise.
My strategy is to wait for confirmation instead of chasing every candle. If sellers stay in control, SOL could face more downside pressure. If buyers return with strong volume, the bearish signal may fade.
My lesson: protect capital first, profits second.
Do you think SOL will drop further or recover from here?
#SOL #Solana #CryptoTrading #MACD
142
·
--
$HYPE
{spot}(HYPEUSDT)
/USDT: I’m Watching This MACD Bearish Crossover 👀
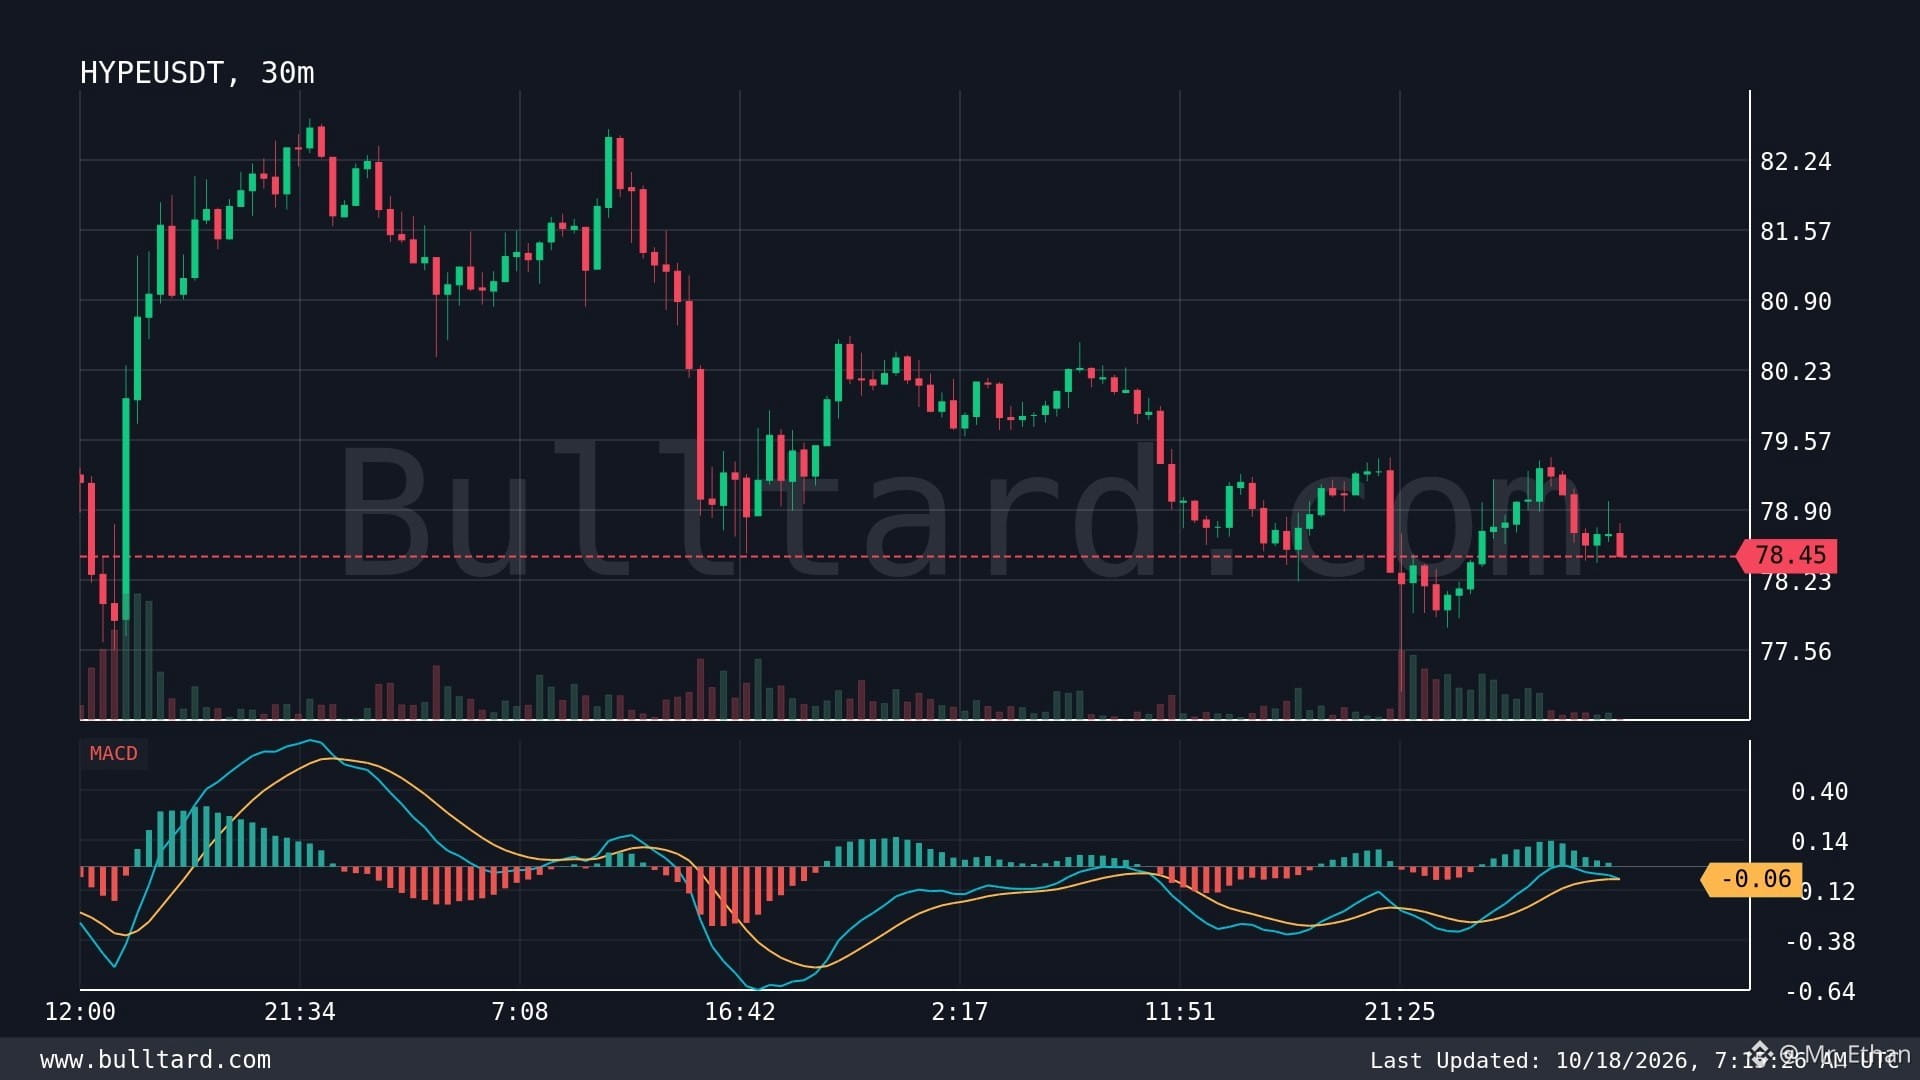
I’m keeping a close eye on $HYPE right now. On the 30-minute chart, MACD has formed a bearish crossover, with the price sitting around $78.45.
From my experience, this signal often tells me that short-term buying momentum is cooling down. It doesn’t guarantee a dump, but it makes me more careful before entering a trade.
What I like about Hyperliquid is its focus on decentralized perpetual trading. It offers traders on-chain access to derivatives, an area where speed, liquidity, and user experience really matter. Compared with many DeFi platforms, its trading-focused ecosystem gives it a clear identity.
Still, I never ignore the risks. Competition from centralized exchanges and other decentralized platforms is tough. HYPE can also face sharp price swings, changing sentiment, and sudden liquidations when leverage gets crowded.
My approach here is simple: I want to see whether price confirms the bearish signal or buyers step in and push momentum back up. I also watch volume and key support levels instead of trusting MACD alone.
One lesson I’ve learned is that a signal is only useful when price action supports it. I’d rather miss an entry than force a trade.
What do you think? Will correct further, or can buyers regain control?
#HYPE #Hyperliquid #CryptoTrading #MACD
$HYPE
/USDT: I’m Watching This MACD Bearish Crossover 👀
I’m keeping a close eye on $HYPE right now. On the 30-minute chart, MACD has formed a bearish crossover, with the price sitting around $78.45.
From my experience, this signal often tells me that short-term buying momentum is cooling down. It doesn’t guarantee a dump, but it makes me more careful before entering a trade.
What I like about Hyperliquid is its focus on decentralized perpetual trading. It offers traders on-chain access to derivatives, an area where speed, liquidity, and user experience really matter. Compared with many DeFi platforms, its trading-focused ecosystem gives it a clear identity.
Still, I never ignore the risks. Competition from centralized exchanges and other decentralized platforms is tough. HYPE can also face sharp price swings, changing sentiment, and sudden liquidations when leverage gets crowded.
My approach here is simple: I want to see whether price confirms the bearish signal or buyers step in and push momentum back up. I also watch volume and key support levels instead of trusting MACD alone.
One lesson I’ve learned is that a signal is only useful when price action supports it. I’d rather miss an entry than force a trade.
What do you think? Will correct further, or can buyers regain control?
#HYPE #Hyperliquid #CryptoTrading #MACD
/USDT: I’m Watching This MACD Bearish Crossover 👀
I’m keeping a close eye on $HYPE right now. On the 30-minute chart, MACD has formed a bearish crossover, with the price sitting around $78.45.
From my experience, this signal often tells me that short-term buying momentum is cooling down. It doesn’t guarantee a dump, but it makes me more careful before entering a trade.
What I like about Hyperliquid is its focus on decentralized perpetual trading. It offers traders on-chain access to derivatives, an area where speed, liquidity, and user experience really matter. Compared with many DeFi platforms, its trading-focused ecosystem gives it a clear identity.
Still, I never ignore the risks. Competition from centralized exchanges and other decentralized platforms is tough. HYPE can also face sharp price swings, changing sentiment, and sudden liquidations when leverage gets crowded.
My approach here is simple: I want to see whether price confirms the bearish signal or buyers step in and push momentum back up. I also watch volume and key support levels instead of trusting MACD alone.
One lesson I’ve learned is that a signal is only useful when price action supports it. I’d rather miss an entry than force a trade.
What do you think? Will correct further, or can buyers regain control?
#HYPE #Hyperliquid #CryptoTrading #MACD
142

·
--
币圈小白第17天:RSI看涨,MACD看跌,到底该听谁的?
以前我觉得,技术指标学得越多,判断行情就越准确。但实际观察后发现,RSI和MACD有时会给出不同信号。
那该怎么办?
1️⃣ 先理解两个指标
📌 RSI:衡量一段时间内价格上涨和下跌的相对强弱。
📌 MACD:辅助观察趋势和动能变化。
两者关注的角度不同,信号不一致很正常。
2️⃣ 信号矛盾时,怎么办?
比如RSI偏强,但MACD出现死叉,我不会马上做多或做空,而是先看三个方面:
① 价格趋势: 高点和低点是否逐步抬高?
② 关键位置: 价格是在支撑位附近,还是接近压力位?
③ 后续走势: 有没有跌破支撑?反弹能否重新站稳?
如果价格结构依然偏强,我会继续观察;如果价格跌破支撑、指标也持续走弱,就要提高警惕。
3️⃣ 两个指标同时看涨,就能做多吗?
也不一定。指标都来自历史价格,信号一致也不能保证未来上涨。如果价格已经连续上涨,并接近重要压力位,追高仍然有风险。
今天的收获:
先看价格结构,再看支撑和压力,最后用RSI、MACD辅助判断。
指标不是投票器,不能简单地数看涨和看跌的数量。
学习技术分析,不是为了找到永远正确的答案,而是为了在不确定的市场里,减少冲动和错误。
这是我学习BTC技术分析的第17天,继续学习,继续复盘。
#币圈学习 #BTC #RSI #MACD #美国PPI同比升至6.3%
币圈小白第17天:RSI看涨,MACD看跌,到底该听谁的?
以前我觉得,技术指标学得越多,判断行情就越准确。但实际观察后发现,RSI和MACD有时会给出不同信号。
那该怎么办?
1️⃣ 先理解两个指标
📌 RSI:衡量一段时间内价格上涨和下跌的相对强弱。
📌 MACD:辅助观察趋势和动能变化。
两者关注的角度不同,信号不一致很正常。
2️⃣ 信号矛盾时,怎么办?
比如RSI偏强,但MACD出现死叉,我不会马上做多或做空,而是先看三个方面:
① 价格趋势: 高点和低点是否逐步抬高?
② 关键位置: 价格是在支撑位附近,还是接近压力位?
③ 后续走势: 有没有跌破支撑?反弹能否重新站稳?
如果价格结构依然偏强,我会继续观察;如果价格跌破支撑、指标也持续走弱,就要提高警惕。
3️⃣ 两个指标同时看涨,就能做多吗?
也不一定。指标都来自历史价格,信号一致也不能保证未来上涨。如果价格已经连续上涨,并接近重要压力位,追高仍然有风险。
今天的收获:
先看价格结构,再看支撑和压力,最后用RSI、MACD辅助判断。
指标不是投票器,不能简单地数看涨和看跌的数量。
学习技术分析,不是为了找到永远正确的答案,而是为了在不确定的市场里,减少冲动和错误。
这是我学习BTC技术分析的第17天,继续学习,继续复盘。
#币圈学习 #BTC #RSI #MACD #美国PPI同比升至6.3%
以前我觉得,技术指标学得越多,判断行情就越准确。但实际观察后发现,RSI和MACD有时会给出不同信号。
那该怎么办?
1️⃣ 先理解两个指标
📌 RSI:衡量一段时间内价格上涨和下跌的相对强弱。
📌 MACD:辅助观察趋势和动能变化。
两者关注的角度不同,信号不一致很正常。
2️⃣ 信号矛盾时,怎么办?
比如RSI偏强,但MACD出现死叉,我不会马上做多或做空,而是先看三个方面:
① 价格趋势: 高点和低点是否逐步抬高?
② 关键位置: 价格是在支撑位附近,还是接近压力位?
③ 后续走势: 有没有跌破支撑?反弹能否重新站稳?
如果价格结构依然偏强,我会继续观察;如果价格跌破支撑、指标也持续走弱,就要提高警惕。
3️⃣ 两个指标同时看涨,就能做多吗?
也不一定。指标都来自历史价格,信号一致也不能保证未来上涨。如果价格已经连续上涨,并接近重要压力位,追高仍然有风险。
今天的收获:
先看价格结构,再看支撑和压力,最后用RSI、MACD辅助判断。
指标不是投票器,不能简单地数看涨和看跌的数量。
学习技术分析,不是为了找到永远正确的答案,而是为了在不确定的市场里,减少冲动和错误。
这是我学习BTC技术分析的第17天,继续学习,继续复盘。
#币圈学习 #BTC #RSI #MACD #美国PPI同比升至6.3%
2
243


Статья
CARA BACA MACD BUAT PEMULA: 3 MENIT LANGSUNG PAHAMBanyak yang lihat MACD bingung. DIF, DEA, Histogram itu apa sih? Ini cara baca paling simpel.
MACD itu cuma punya 3 bagian. Kuasai 3 ini, kamu udah bisa baca momentum.
1. DUA GARIS: DIF (Kuning) & DEA (Pink)
Ini otaknya. Lihat persilangannya:
Golden Cross = Sinyal Beli
DIF memotong DEA dari BAWAH ke ATAS.
Artinya: Momentum beli mulai menang. Buyer mulai masuk.
Dead Cross = Sinyal Jual
DIF memotong DEA dari ATAS ke BAWAH.
Artinya: Momentum jual mulai menang. Seller mulai ambil alih.
2. HISTOGRAM: Batang Merah Hijau
Ini ototnya. Kekuatan trend.
- Hijau Makin Tinggi & Panjang: Tenaga beli makin KUAT. Trend naik lagi kencang.
- Merah Makin Dalam & Panjang: Tenaga jual makin KUAT. Trend turun lagi kencang.
- Batangnya Memendek (baik hijau atau merah): Tenaganya mulai CAPEK. Hati-hati, biasanya mau balik arah / reversal.
Ini paling penting: Jangan entry kalau histogram masih pendek dan ragu-ragu.
3. GARIS NOL (0) - Batas Wilayah
- Posisi di ATAS garis 0: Pasar lagi di mode UPTREND. Lebih aman cari setup LONG.
- Posisi di BAWAH garis 0:* Pasar lagi di mode DOWNTREND. Lebih aman cari setup SHORT.
RUMUS CEPAT TANPA RIBET:
Untuk cari LONG:
1. DIF sudah di ATAS DEA
2. Histogram HIJAU dan mulai memanjang
3. Posisi masih di atas garis 0
4. Cek RSI jangan sudah di atas 70 (overbought)
Untuk cari SHORT:
1. DIF sudah di BAWAH DEA
2. Histogram MERAH dan mulai memanjang
3. Posisi masih di bawah garis 0
4. Cek RSI jangan sudah di bawah 30 (oversold)
ATURAN EMAS:
JANGAN PERNAH PAKAI MACD SENDIRIAN!
MACD itu lagging, kalau market lagi sideways dia sering kasih sinyal palsu. Selalu kombinasikan dengan Bollinger Bands atau Support Resistance.
BONUS - DIVERGENCE (Sinyal Sultan):
- Harga naik bikin puncak lebih TINGGI, tapi MACD malah bikin puncak lebih RENDAH = Bearish Divergence = Harga bisa jatuh.
- Harga turun bikin lembah lebih RENDAH, tapi MACD malah bikin lembah lebih TINGGI = Bullish Divergence = Harga bisa naik.
Gimana? Sekarang coba buka chart kamu, MACD kamu lagi Golden Cross atau Dead Cross?
Komen koin apa yang mau dibahas next, nanti aku bedah!
Follow untuk analisa sinyal harian dan edukasi !
#EdukasiCrypto #MACD #TradingPemula
CARA BACA MACD BUAT PEMULA: 3 MENIT LANGSUNG PAHAM
Banyak yang lihat MACD bingung. DIF, DEA, Histogram itu apa sih? Ini cara baca paling simpel.
MACD itu cuma punya 3 bagian. Kuasai 3 ini, kamu udah bisa baca momentum.
1. DUA GARIS: DIF (Kuning) & DEA (Pink)
Ini otaknya. Lihat persilangannya:
Golden Cross = Sinyal Beli
DIF memotong DEA dari BAWAH ke ATAS.
Artinya: Momentum beli mulai menang. Buyer mulai masuk.
Dead Cross = Sinyal Jual
DIF memotong DEA dari ATAS ke BAWAH.
Artinya: Momentum jual mulai menang. Seller mulai ambil alih.
2. HISTOGRAM: Batang Merah Hijau
Ini ototnya. Kekuatan trend.
- Hijau Makin Tinggi & Panjang: Tenaga beli makin KUAT. Trend naik lagi kencang.
- Merah Makin Dalam & Panjang: Tenaga jual makin KUAT. Trend turun lagi kencang.
- Batangnya Memendek (baik hijau atau merah): Tenaganya mulai CAPEK. Hati-hati, biasanya mau balik arah / reversal.
Ini paling penting: Jangan entry kalau histogram masih pendek dan ragu-ragu.
3. GARIS NOL (0) - Batas Wilayah
- Posisi di ATAS garis 0: Pasar lagi di mode UPTREND. Lebih aman cari setup LONG.
- Posisi di BAWAH garis 0:* Pasar lagi di mode DOWNTREND. Lebih aman cari setup SHORT.
RUMUS CEPAT TANPA RIBET:
Untuk cari LONG:
1. DIF sudah di ATAS DEA
2. Histogram HIJAU dan mulai memanjang
3. Posisi masih di atas garis 0
4. Cek RSI jangan sudah di atas 70 (overbought)
Untuk cari SHORT:
1. DIF sudah di BAWAH DEA
2. Histogram MERAH dan mulai memanjang
3. Posisi masih di bawah garis 0
4. Cek RSI jangan sudah di bawah 30 (oversold)
ATURAN EMAS:
JANGAN PERNAH PAKAI MACD SENDIRIAN!
MACD itu lagging, kalau market lagi sideways dia sering kasih sinyal palsu. Selalu kombinasikan dengan Bollinger Bands atau Support Resistance.
BONUS - DIVERGENCE (Sinyal Sultan):
- Harga naik bikin puncak lebih TINGGI, tapi MACD malah bikin puncak lebih RENDAH = Bearish Divergence = Harga bisa jatuh.
- Harga turun bikin lembah lebih RENDAH, tapi MACD malah bikin lembah lebih TINGGI = Bullish Divergence = Harga bisa naik.
Gimana? Sekarang coba buka chart kamu, MACD kamu lagi Golden Cross atau Dead Cross?
Komen koin apa yang mau dibahas next, nanti aku bedah!
Follow untuk analisa sinyal harian dan edukasi !
#EdukasiCrypto #MACD #TradingPemula
MACD itu cuma punya 3 bagian. Kuasai 3 ini, kamu udah bisa baca momentum.
1. DUA GARIS: DIF (Kuning) & DEA (Pink)
Ini otaknya. Lihat persilangannya:
Golden Cross = Sinyal Beli
DIF memotong DEA dari BAWAH ke ATAS.
Artinya: Momentum beli mulai menang. Buyer mulai masuk.
Dead Cross = Sinyal Jual
DIF memotong DEA dari ATAS ke BAWAH.
Artinya: Momentum jual mulai menang. Seller mulai ambil alih.
2. HISTOGRAM: Batang Merah Hijau
Ini ototnya. Kekuatan trend.
- Hijau Makin Tinggi & Panjang: Tenaga beli makin KUAT. Trend naik lagi kencang.
- Merah Makin Dalam & Panjang: Tenaga jual makin KUAT. Trend turun lagi kencang.
- Batangnya Memendek (baik hijau atau merah): Tenaganya mulai CAPEK. Hati-hati, biasanya mau balik arah / reversal.
Ini paling penting: Jangan entry kalau histogram masih pendek dan ragu-ragu.
3. GARIS NOL (0) - Batas Wilayah
- Posisi di ATAS garis 0: Pasar lagi di mode UPTREND. Lebih aman cari setup LONG.
- Posisi di BAWAH garis 0:* Pasar lagi di mode DOWNTREND. Lebih aman cari setup SHORT.
RUMUS CEPAT TANPA RIBET:
Untuk cari LONG:
1. DIF sudah di ATAS DEA
2. Histogram HIJAU dan mulai memanjang
3. Posisi masih di atas garis 0
4. Cek RSI jangan sudah di atas 70 (overbought)
Untuk cari SHORT:
1. DIF sudah di BAWAH DEA
2. Histogram MERAH dan mulai memanjang
3. Posisi masih di bawah garis 0
4. Cek RSI jangan sudah di bawah 30 (oversold)
ATURAN EMAS:
JANGAN PERNAH PAKAI MACD SENDIRIAN!
MACD itu lagging, kalau market lagi sideways dia sering kasih sinyal palsu. Selalu kombinasikan dengan Bollinger Bands atau Support Resistance.
BONUS - DIVERGENCE (Sinyal Sultan):
- Harga naik bikin puncak lebih TINGGI, tapi MACD malah bikin puncak lebih RENDAH = Bearish Divergence = Harga bisa jatuh.
- Harga turun bikin lembah lebih RENDAH, tapi MACD malah bikin lembah lebih TINGGI = Bullish Divergence = Harga bisa naik.
Gimana? Sekarang coba buka chart kamu, MACD kamu lagi Golden Cross atau Dead Cross?
Komen koin apa yang mau dibahas next, nanti aku bedah!
Follow untuk analisa sinyal harian dan edukasi !
#EdukasiCrypto #MACD #TradingPemula
285

everyone thinks a weekly macd flip means the bull market is back but actually thats how most people get chopped up waiting for a move that isnt confirmed yet.
youve seen this movie. indicator turns green, you ape into $btc, then it dumps and youre stuck holding while the real trend takes another month to show up.
$btc just flipped weekly macd positive after 44 consecutive negative weeks. thats not noise, thats a long stretch of bearish momentum finally breaking. a potential shift in long-term momentum is underway but confirmation is everything, ser. one green print after 44 red ones is a signal, not a guarantee.
ngl the last time traders treated a first macd flip as gospel they got wrecked on the retest. $eth and $sol usually wait for $btc to actually hold the move before they start running. if youre already full size you might be early.
anyone else waiting for a second weekly close before they call this the real shift?
#Bitcoin #MACD #BTC
everyone thinks a weekly macd flip means the bull market is back but actually thats how most people get chopped up waiting for a move that isnt confirmed yet.
youve seen this movie. indicator turns green, you ape into $btc, then it dumps and youre stuck holding while the real trend takes another month to show up.
$btc just flipped weekly macd positive after 44 consecutive negative weeks. thats not noise, thats a long stretch of bearish momentum finally breaking. a potential shift in long-term momentum is underway but confirmation is everything, ser. one green print after 44 red ones is a signal, not a guarantee.
ngl the last time traders treated a first macd flip as gospel they got wrecked on the retest. $eth and $sol usually wait for $btc to actually hold the move before they start running. if youre already full size you might be early.
anyone else waiting for a second weekly close before they call this the real shift?
#Bitcoin #MACD #BTC
youve seen this movie. indicator turns green, you ape into $btc, then it dumps and youre stuck holding while the real trend takes another month to show up.
$btc just flipped weekly macd positive after 44 consecutive negative weeks. thats not noise, thats a long stretch of bearish momentum finally breaking. a potential shift in long-term momentum is underway but confirmation is everything, ser. one green print after 44 red ones is a signal, not a guarantee.
ngl the last time traders treated a first macd flip as gospel they got wrecked on the retest. $eth and $sol usually wait for $btc to actually hold the move before they start running. if youre already full size you might be early.
anyone else waiting for a second weekly close before they call this the real shift?
#Bitcoin #MACD #BTC

12

·
--
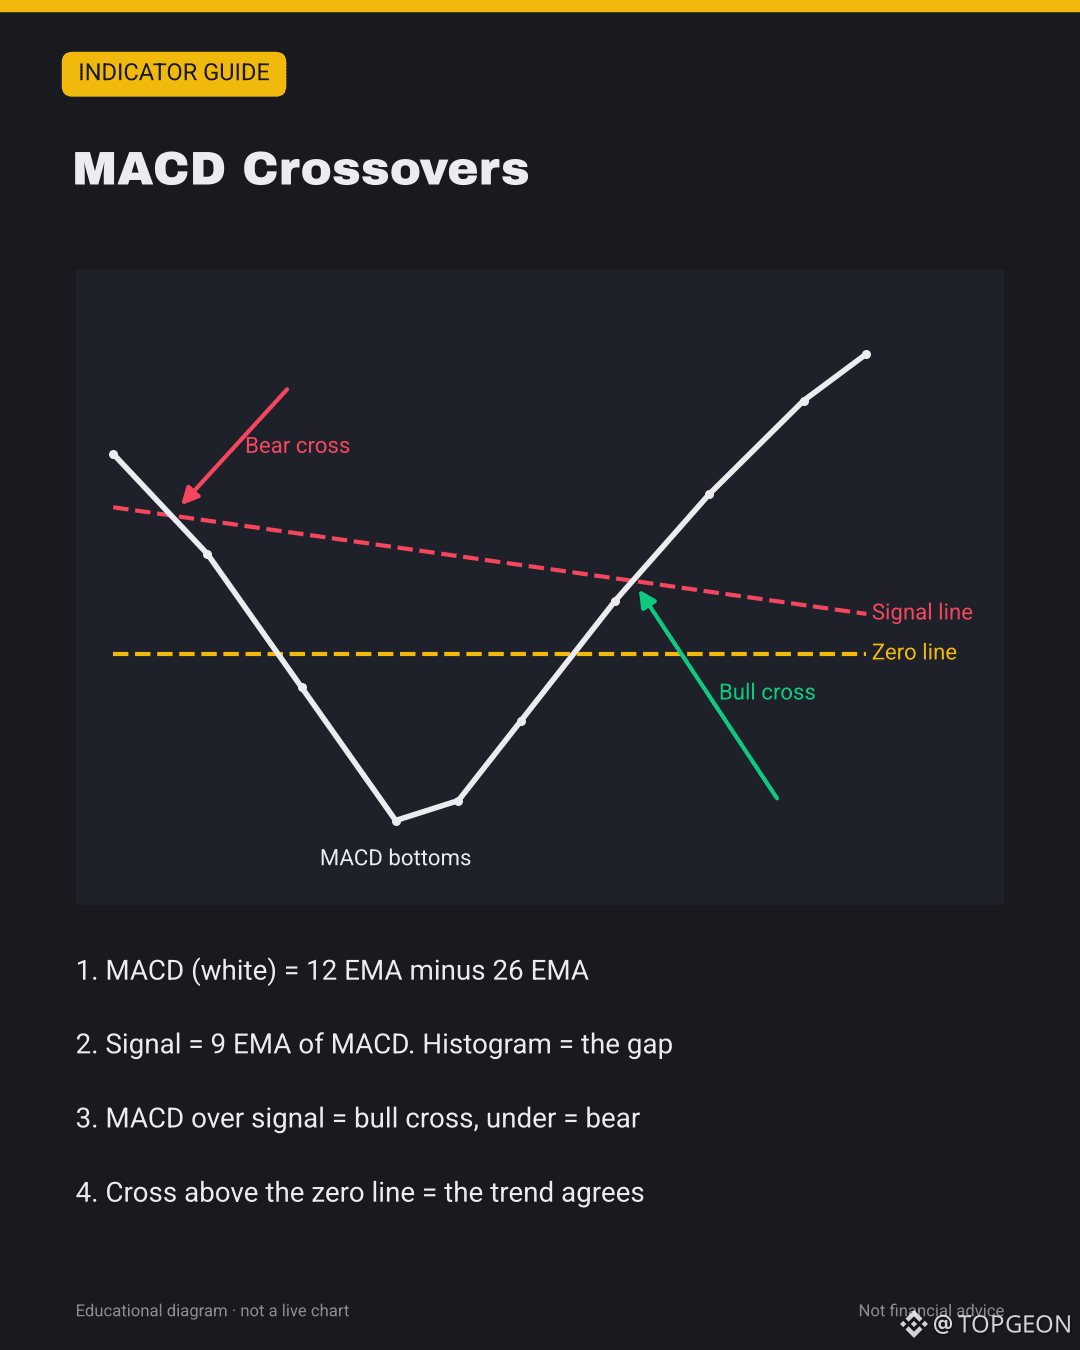
🧠 3 things to know about $ETH's MACD bull cross
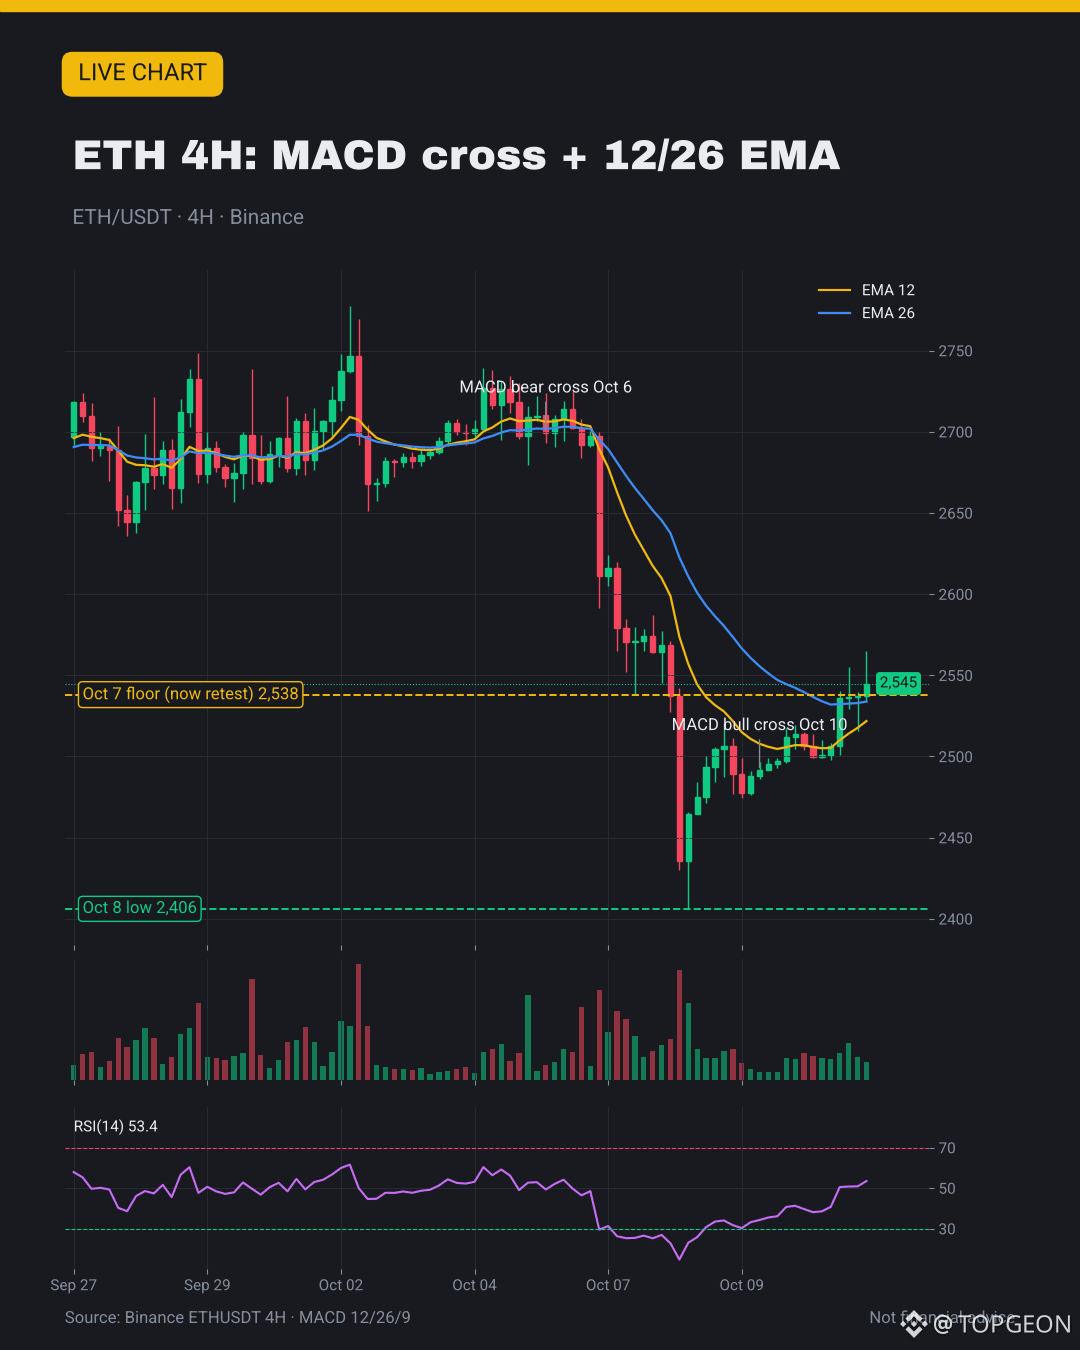
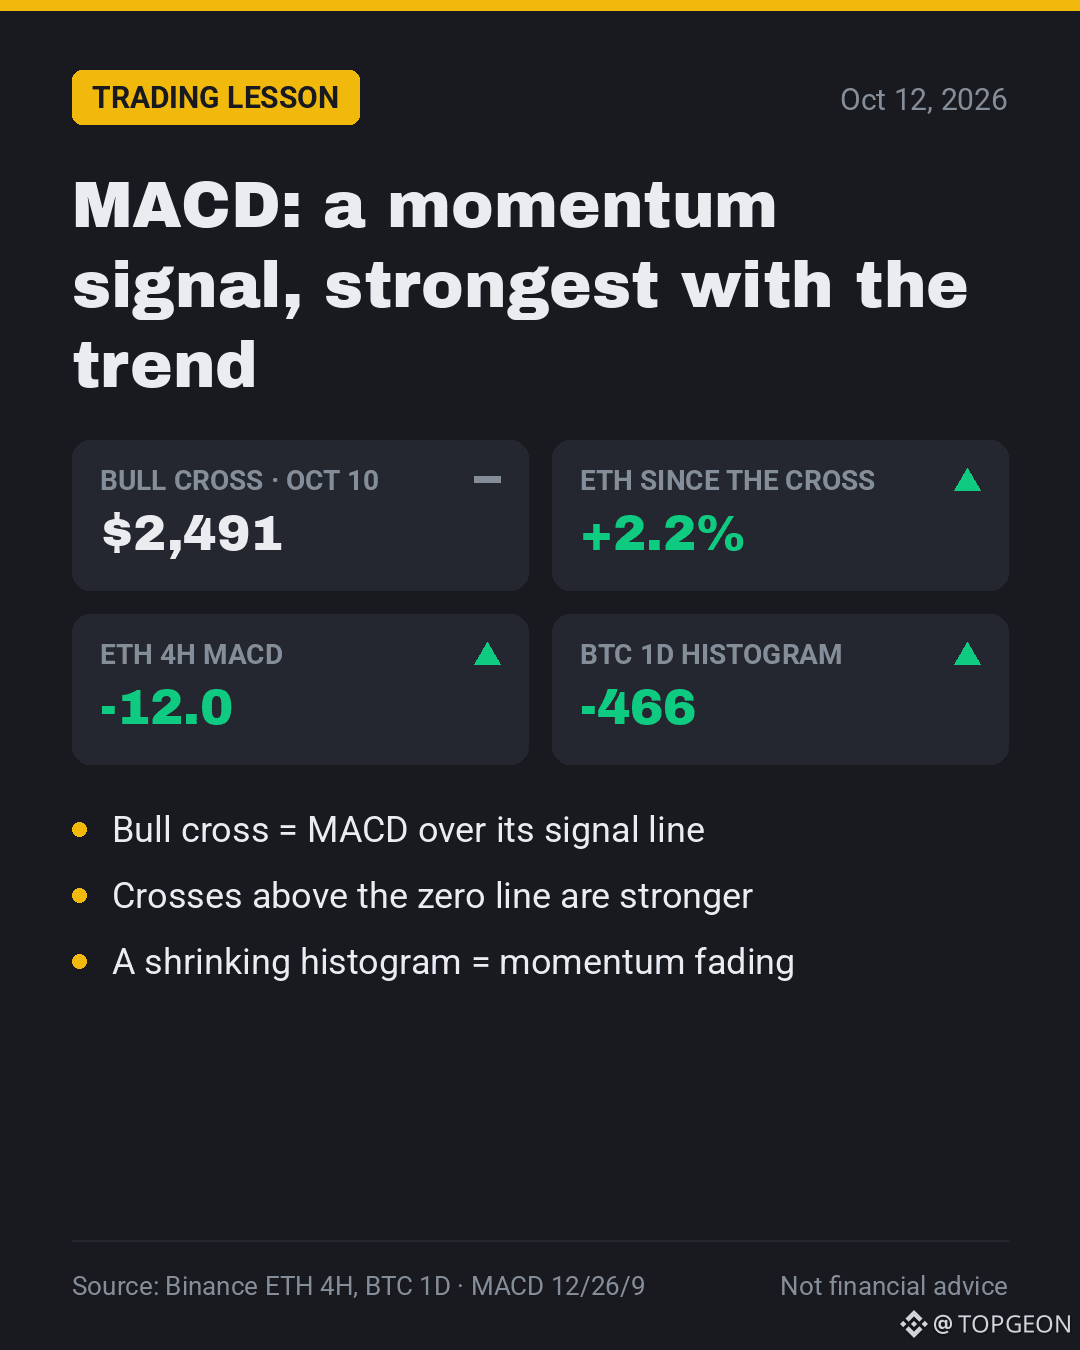
1️⃣ Oct 10: MACD crossed its signal at $2,491 (4H)
2️⃣ ETH ~$2,546 now (+2.2%), histogram green 13 candles
3️⃣ Catch: MACD still under zero (-12), so trend not flipped
🎯 My take: 4H close over $2,538 + MACD over zero = confirmed
💬 Do you trust MACD crosses below the zero line? 👇
📖 Full lesson: https://app.binance.com/uni-qr/cart/376365218980945
#MACD #TradingTips #Ethereum
🧠 3 things to know about $ETH 's MACD bull cross
1️⃣ Oct 10: MACD crossed its signal at $2,491 (4H)
2️⃣ ETH ~$2,546 now (+2.2%), histogram green 13 candles
3️⃣ Catch: MACD still under zero (-12), so trend not flipped
🎯 My take: 4H close over $2,538 + MACD over zero = confirmed
💬 Do you trust MACD crosses below the zero line? 👇
📖 Full lesson: https://app.binance.com/uni-qr/cart/376365218980945
#MACD #TradingTips #Ethereum
1️⃣ Oct 10: MACD crossed its signal at $2,491 (4H)
2️⃣ ETH ~$2,546 now (+2.2%), histogram green 13 candles
3️⃣ Catch: MACD still under zero (-12), so trend not flipped
🎯 My take: 4H close over $2,538 + MACD over zero = confirmed
💬 Do you trust MACD crosses below the zero line? 👇
📖 Full lesson: https://app.binance.com/uni-qr/cart/376365218980945
#MACD #TradingTips #Ethereum
57
·
--
Статья
MACD Crossovers, Histogram & Divergence: Explained Simply📘 What is MACD?
MACD stands for Moving Average Convergence Divergence. It measures momentum: how fast price is moving, and whether that speed is growing or fading.
It is built from two EMAs. The MACD line = 12 EMA minus 26 EMA. When the fast EMA pulls away from the slow one, momentum is strong. When they squeeze together, momentum is fading.
$ETH printed a textbook MACD bull cross on the 4H chart 2 days ago, so we use it as a live example.
📊 Live chart in the cover and in the image post below.
🔍 The 3 parts
• MACD line: the gap between the 12 and 26 EMA
• Signal line: a 9 EMA of the MACD line. It is slower and smoother
• Histogram: the bars showing MACD minus signal. Taller bars = momentum growing
• Zero line: MACD above zero means the 12 EMA is above the 26 EMA (short-term uptrend)
🔍 How to spot the signals
• Bull cross: the MACD line crosses ABOVE the signal line. The histogram flips from red to green
• Bear cross: the MACD line crosses BELOW the signal line. The histogram flips to red
• Zero-line cross: MACD moves from negative to positive (or back). This is slower but confirms the trend
• Shrinking histogram: momentum is fading, even if price is still moving the same way
• Divergence: price makes a new high (or low) but MACD does not. The move is losing power
📈 How traders use it
• Entry: a bull cross that happens near support, or right after a pullback in an uptrend. A cross above the zero line is the stronger version
• Stop-loss: under the swing low that formed before the cross, not under a random number
• Target: the next resistance level, aiming for at least 2x your risk. Some traders exit when the histogram starts shrinking
• Filter: in a downtrend, ignore bull crosses below zero unless price also breaks a key level
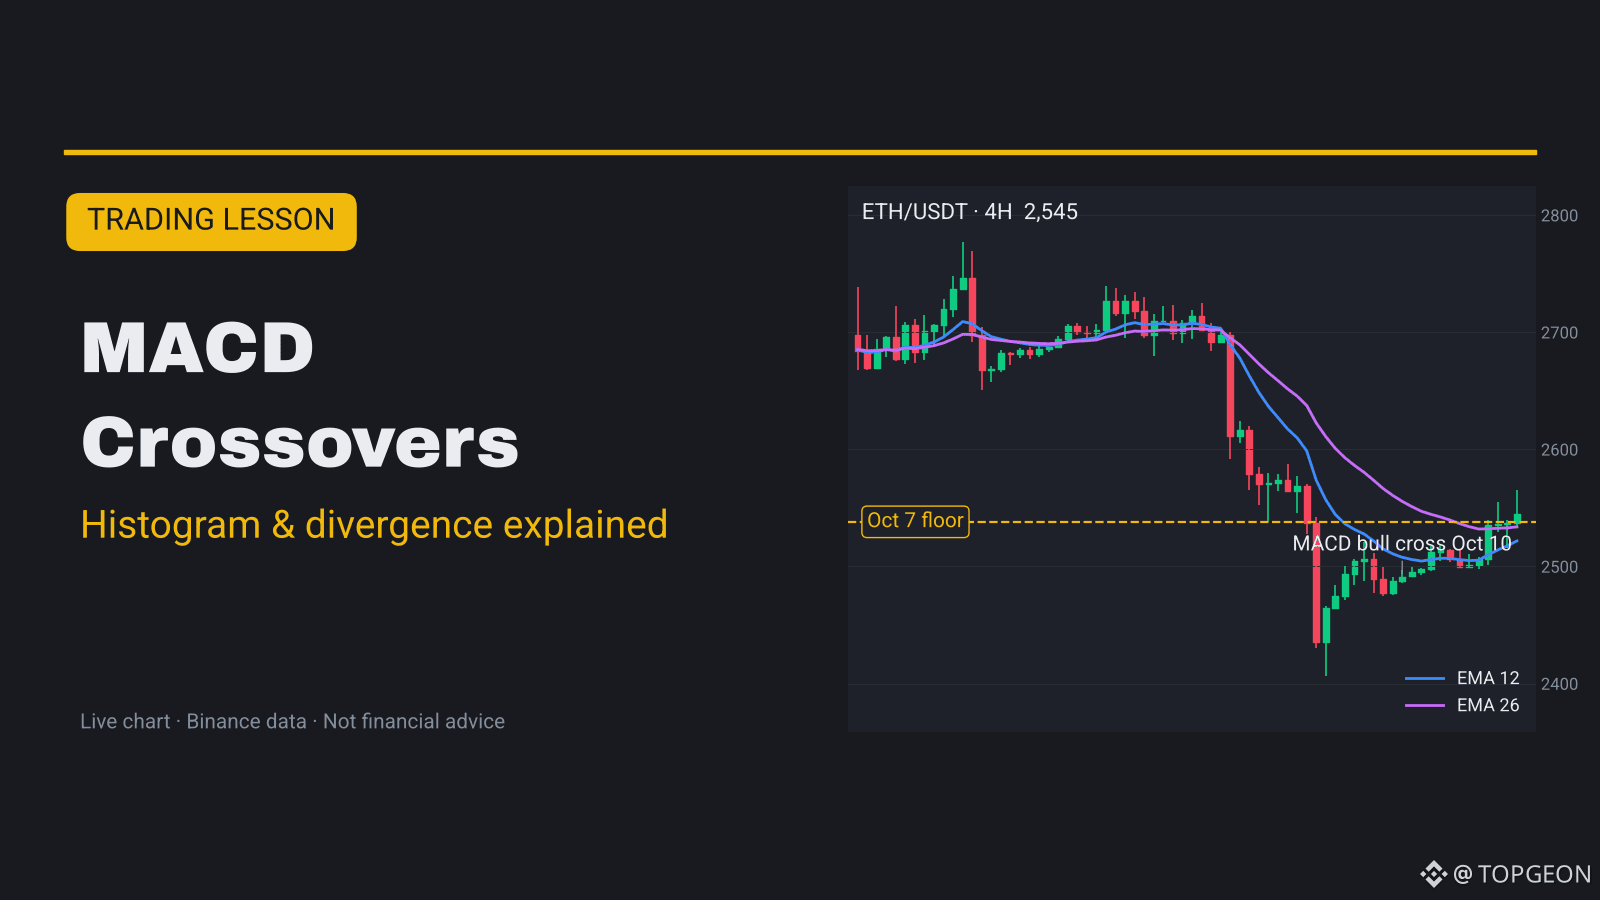
🧪 Live example: $ETH 4H
• Oct 6: bear cross near $2,699. ETH then dropped to $2,406 on Oct 8 (-11%)
• Oct 10, 00:00 UTC: bull cross at $2,491. The histogram has been green for 13 candles in a row
• Now: ETH about $2,545, +2.2% since the cross. 4H RSI 53
• But the MACD line is still BELOW zero (about -12, signal about -24). The 12 EMA (~$2,522) has not crossed the 26 EMA (~$2,534) yet
• What would confirm it: MACD above zero and a 4H close above the $2,538 Oct 7 floor that ETH is now testing
• What would cancel it: a bear cross and a drop back under $2,474
🧪 Bonus: $BTC daily
• Sep 29: bear cross at $83,664. MACD is still above zero (+852), so the bigger trend is not broken
• The red histogram peaked at -568 on Oct 10 and is now -466. Selling momentum is fading, but there is no bull cross yet
⚠️ Common mistakes
• Taking every cross on 5m charts. Most of them are noise
• Buying a bull cross deep below zero in a strong downtrend
• Forgetting MACD lags: by the time it crosses, part of the move is already done
• Using MACD alone, without support/resistance or volume
✅ Quick checklist
• Is the cross on the 4H or daily chart?
• Is it above or below the zero line?
• Is the histogram growing after the cross?
• Is price at a real support or resistance level?
• Is your stop under the swing and sized to 1-2% risk?
💬 Do you use MACD crosses, or do you prefer RSI or moving averages? 👇
Not financial advice. DYOR.
#TradingTips #MACD #Ethereum
MACD Crossovers, Histogram & Divergence: Explained Simply
📘 What is MACD?
MACD stands for Moving Average Convergence Divergence. It measures momentum: how fast price is moving, and whether that speed is growing or fading.
It is built from two EMAs. The MACD line = 12 EMA minus 26 EMA. When the fast EMA pulls away from the slow one, momentum is strong. When they squeeze together, momentum is fading.
$ETH printed a textbook MACD bull cross on the 4H chart 2 days ago, so we use it as a live example.
📊 Live chart in the cover and in the image post below.
🔍 The 3 parts
• MACD line: the gap between the 12 and 26 EMA
• Signal line: a 9 EMA of the MACD line. It is slower and smoother
• Histogram: the bars showing MACD minus signal. Taller bars = momentum growing
• Zero line: MACD above zero means the 12 EMA is above the 26 EMA (short-term uptrend)
🔍 How to spot the signals
• Bull cross: the MACD line crosses ABOVE the signal line. The histogram flips from red to green
• Bear cross: the MACD line crosses BELOW the signal line. The histogram flips to red
• Zero-line cross: MACD moves from negative to positive (or back). This is slower but confirms the trend
• Shrinking histogram: momentum is fading, even if price is still moving the same way
• Divergence: price makes a new high (or low) but MACD does not. The move is losing power
📈 How traders use it
• Entry: a bull cross that happens near support, or right after a pullback in an uptrend. A cross above the zero line is the stronger version
• Stop-loss: under the swing low that formed before the cross, not under a random number
• Target: the next resistance level, aiming for at least 2x your risk. Some traders exit when the histogram starts shrinking
• Filter: in a downtrend, ignore bull crosses below zero unless price also breaks a key level
🧪 Live example: $ETH 4H
• Oct 6: bear cross near $2,699. ETH then dropped to $2,406 on Oct 8 (-11%)
• Oct 10, 00:00 UTC: bull cross at $2,491. The histogram has been green for 13 candles in a row
• Now: ETH about $2,545, +2.2% since the cross. 4H RSI 53
• But the MACD line is still BELOW zero (about -12, signal about -24). The 12 EMA (~$2,522) has not crossed the 26 EMA (~$2,534) yet
• What would confirm it: MACD above zero and a 4H close above the $2,538 Oct 7 floor that ETH is now testing
• What would cancel it: a bear cross and a drop back under $2,474
🧪 Bonus: $BTC daily
• Sep 29: bear cross at $83,664. MACD is still above zero (+852), so the bigger trend is not broken
• The red histogram peaked at -568 on Oct 10 and is now -466. Selling momentum is fading, but there is no bull cross yet
⚠️ Common mistakes
• Taking every cross on 5m charts. Most of them are noise
• Buying a bull cross deep below zero in a strong downtrend
• Forgetting MACD lags: by the time it crosses, part of the move is already done
• Using MACD alone, without support/resistance or volume
✅ Quick checklist
• Is the cross on the 4H or daily chart?
• Is it above or below the zero line?
• Is the histogram growing after the cross?
• Is price at a real support or resistance level?
• Is your stop under the swing and sized to 1-2% risk?
💬 Do you use MACD crosses, or do you prefer RSI or moving averages? 👇
Not financial advice. DYOR.
#TradingTips #MACD #Ethereum
MACD stands for Moving Average Convergence Divergence. It measures momentum: how fast price is moving, and whether that speed is growing or fading.
It is built from two EMAs. The MACD line = 12 EMA minus 26 EMA. When the fast EMA pulls away from the slow one, momentum is strong. When they squeeze together, momentum is fading.
$ETH printed a textbook MACD bull cross on the 4H chart 2 days ago, so we use it as a live example.
📊 Live chart in the cover and in the image post below.
🔍 The 3 parts
• MACD line: the gap between the 12 and 26 EMA
• Signal line: a 9 EMA of the MACD line. It is slower and smoother
• Histogram: the bars showing MACD minus signal. Taller bars = momentum growing
• Zero line: MACD above zero means the 12 EMA is above the 26 EMA (short-term uptrend)
🔍 How to spot the signals
• Bull cross: the MACD line crosses ABOVE the signal line. The histogram flips from red to green
• Bear cross: the MACD line crosses BELOW the signal line. The histogram flips to red
• Zero-line cross: MACD moves from negative to positive (or back). This is slower but confirms the trend
• Shrinking histogram: momentum is fading, even if price is still moving the same way
• Divergence: price makes a new high (or low) but MACD does not. The move is losing power
📈 How traders use it
• Entry: a bull cross that happens near support, or right after a pullback in an uptrend. A cross above the zero line is the stronger version
• Stop-loss: under the swing low that formed before the cross, not under a random number
• Target: the next resistance level, aiming for at least 2x your risk. Some traders exit when the histogram starts shrinking
• Filter: in a downtrend, ignore bull crosses below zero unless price also breaks a key level
🧪 Live example: $ETH 4H
• Oct 6: bear cross near $2,699. ETH then dropped to $2,406 on Oct 8 (-11%)
• Oct 10, 00:00 UTC: bull cross at $2,491. The histogram has been green for 13 candles in a row
• Now: ETH about $2,545, +2.2% since the cross. 4H RSI 53
• But the MACD line is still BELOW zero (about -12, signal about -24). The 12 EMA (~$2,522) has not crossed the 26 EMA (~$2,534) yet
• What would confirm it: MACD above zero and a 4H close above the $2,538 Oct 7 floor that ETH is now testing
• What would cancel it: a bear cross and a drop back under $2,474
🧪 Bonus: $BTC daily
• Sep 29: bear cross at $83,664. MACD is still above zero (+852), so the bigger trend is not broken
• The red histogram peaked at -568 on Oct 10 and is now -466. Selling momentum is fading, but there is no bull cross yet
⚠️ Common mistakes
• Taking every cross on 5m charts. Most of them are noise
• Buying a bull cross deep below zero in a strong downtrend
• Forgetting MACD lags: by the time it crosses, part of the move is already done
• Using MACD alone, without support/resistance or volume
✅ Quick checklist
• Is the cross on the 4H or daily chart?
• Is it above or below the zero line?
• Is the histogram growing after the cross?
• Is price at a real support or resistance level?
• Is your stop under the swing and sized to 1-2% risk?
💬 Do you use MACD crosses, or do you prefer RSI or moving averages? 👇
Not financial advice. DYOR.
#TradingTips #MACD #Ethereum
76
·
--
Статья
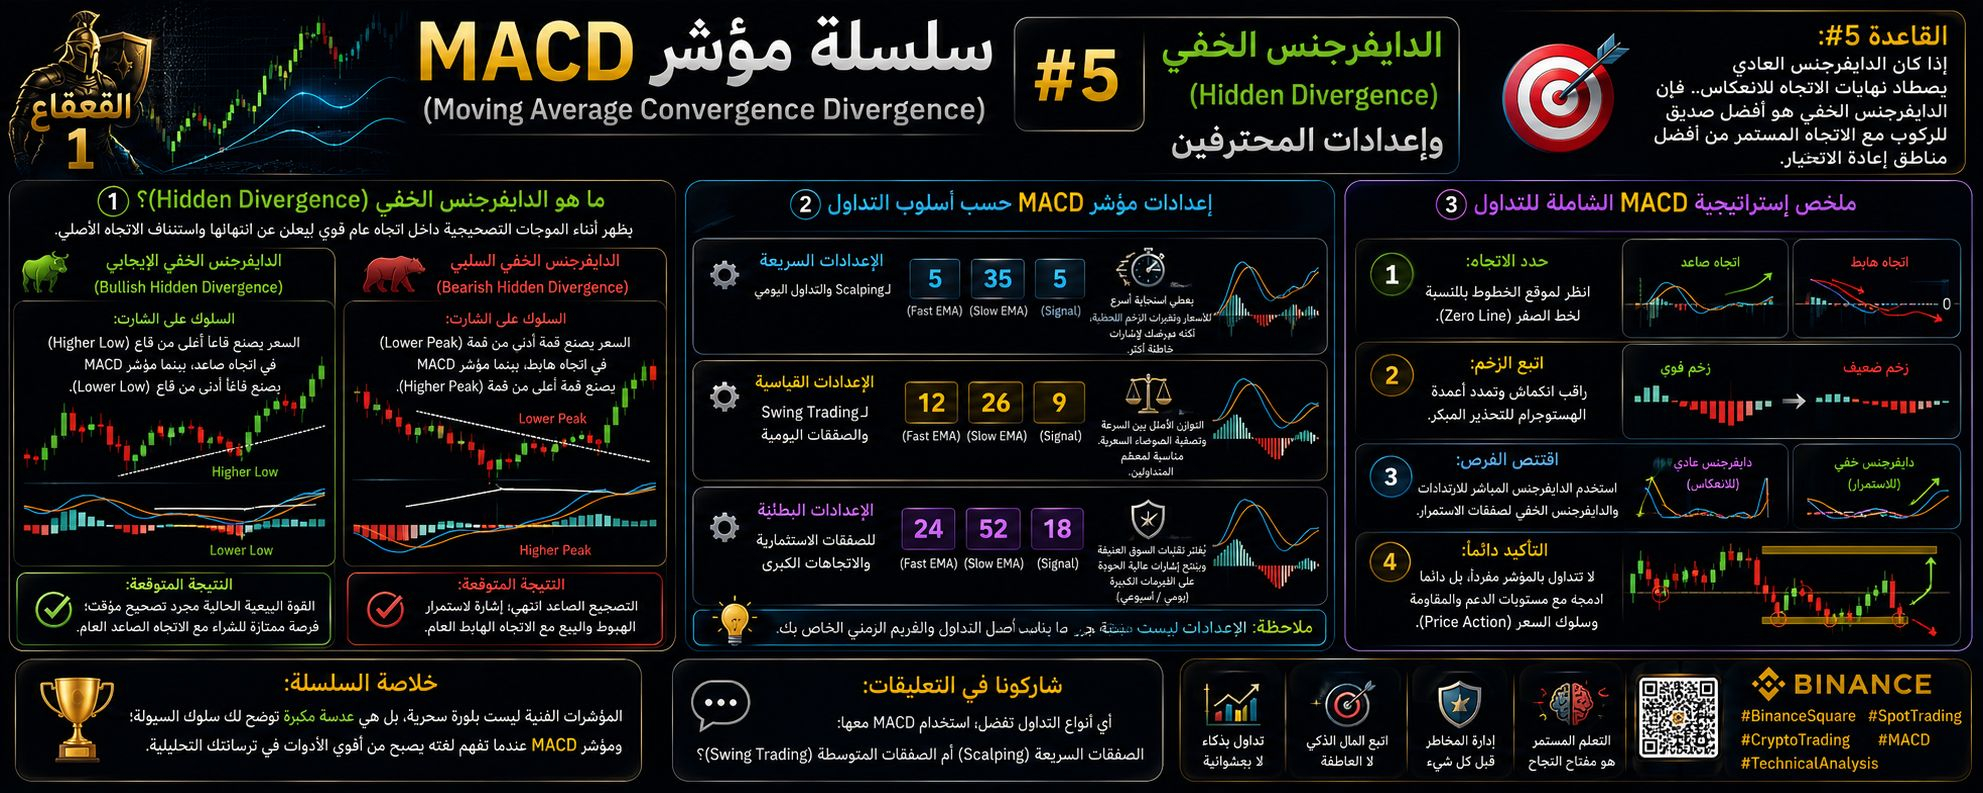
سلسلة مؤشر التقارب والتباعد للمتوسطات المتحركة (MACD) الدرس #5: الدايفرجنس الخفي (Hidden Divergenceمرحباً بكم زملائي المتداولين! أهلاً بكم في المحطة الخامسة والختامية من سلسلتنا التعليمية حول مؤشر MACD. بعد أن تعلمنا الأساسيات والتقاطعات وأعمدة الهستوجرام والدايفرجنس المباشر، نختم اليوم بالسلاح السري للمتداولين المحترفين: الدايفرجنس الخفي (Hidden Divergence) وكيفية ضبط إعدادات المؤشر حسب إستراتيجيتك.
🎯 القاعدة #5: "إذا كان الدايفرجنس العادي يصطاد نهايات الاتجاه للانعكاس.. فإن الدايفرجنس الخفي هو أفضل صديق للركوب مع الاتجاه المستمر (Trend Following) من أفضل مناطق إعادة الاختبار."
💡 1️⃣ ما هو الدايفرجنس الخفي (Hidden Divergence)؟
الدايفرجنس الخفي لا يستهدف القمم والقيعان النهائية، بل يظهر أثناء الموجات التصحيحية داخل اتجاه عام قوي، ليعلن عن انتهائها واستئناف الاتجاه الأصلي:
• 1. الدايفرجنس الخفي الإيجابي (Bullish Hidden Divergence):
- السلوك على الشارت: السعر يصنع قاعاً أعلى من قاع (Higher Low) في اتجاه صاعد، بينما مؤشر MACD يصنع قاعاً أدنى من قاع (Lower Low).
- النتيجة المتوقعة: القوة البيعية الحالية مجرد تصحيح مؤقت؛ فرصة ممتازة للشراء مع الاتجاه الصاعد العام.
• 2. الدايفرجنس الخفي السلبي (Bearish Hidden Divergence)
- السلوك على الشارت: السعر يصنع قمة أدنى من قمة (Lower Peak) في اتجاه هابط، بينما مؤشر MACD يصنع قمة أعلى من قمة (Higher Peak)
- النتيجة المتوقعة: التصحيح الصاعد انتهى؛ إشارة لاستمرار الهبوط والبيع مع الاتجاه الهابط العام.
---
🧬 2️⃣ إعدادات مؤشر MACD حسب أسلوب التداول
الإعداد الافتراضي (12, 26, 9) ممتازة لمعظم المتداولين، لكن يمكنك تعديلها لتناسب أسلوبك:
• الإعدادات السريعة (لـ Scalping والتداول اليومي): (5, 35, 5)
- يعطي استجابة أسرع للأسعار وتغيرات الزخم اللحظية، لكنه يعرضك لإشارات خاطئة أكثر.
• الإعدادات القياسية (لـ Swing Trading والصفقات اليومية): (12, 26, 9)
- التوازن الأمثل بين السرعة وتصفية الضوضاء السعرية.
• الإعدادات البطئية (للصفقات الاستثمارية والاتجاهات الكبرى): (24, 52, 18)
- يفلتر تقلبات السوق العنيفة وينتج إشارات عالية الجودة على الفريمات الكبيرة (يومي / أسبوعي).
---
🔍 3️⃣ ملخص إستراتيجية MACD الشاملة للتداول
لتحقيق أفضل نتائج على الشارت:
1. حدد الاتجاه: انظر لموقع الخطوط بالنسبة لخط الصفر (Zero Line).
2. اتبع الزخم: راقب انكماش وتمدد أعمدة الهستوجرام للتحذير المبكر.
3. اقتنص الفرص: استخدم الدايفرجنس المباشر للارتدادات والدايفرجنس الخفي لصفقات الاستمرار.
4. التأكيد دائماً: لا تتداول بالمؤشر مفرداً، بل دائمًا ادمجه مع مستويات الدعم والمقاومة وسلوك السعر (Price Action).
---
⚖️ خلاصة السلسلة:
"المؤشرات الفنية ليست بلورة سحرية، بل هي عدسة مكبرة توضح لك سلوك السيولة؛ ومؤشر MACD عندما تفهم لغته يصبح من أقوى الأدوات في ترسانتك التحليلية."
---
💬 شاركونا في التعليقات:
أي أنواع التداول تفضل استخدام MACD معها: الصفقات السريعة (Scalping) أم الصفقات المتوسطة (Swing Trading)؟
#BinanceSquare #cryptotrading #MACD #TechnicalAnalysis #القعقاع_1
{spot}(BIOUSDT)
{spot}(DEXEUSDT)
{spot}(BTCUSDT)
$1 $Mubarakah $AKE
سلسلة مؤشر التقارب والتباعد للمتوسطات المتحركة (MACD) الدرس #5: الدايفرجنس الخفي (Hidden Divergence
مرحباً بكم زملائي المتداولين! أهلاً بكم في المحطة الخامسة والختامية من سلسلتنا التعليمية حول مؤشر MACD. بعد أن تعلمنا الأساسيات والتقاطعات وأعمدة الهستوجرام والدايفرجنس المباشر، نختم اليوم بالسلاح السري للمتداولين المحترفين: الدايفرجنس الخفي (Hidden Divergence) وكيفية ضبط إعدادات المؤشر حسب إستراتيجيتك.
🎯 القاعدة #5: "إذا كان الدايفرجنس العادي يصطاد نهايات الاتجاه للانعكاس.. فإن الدايفرجنس الخفي هو أفضل صديق للركوب مع الاتجاه المستمر (Trend Following) من أفضل مناطق إعادة الاختبار."
💡 1️⃣ ما هو الدايفرجنس الخفي (Hidden Divergence)؟
الدايفرجنس الخفي لا يستهدف القمم والقيعان النهائية، بل يظهر أثناء الموجات التصحيحية داخل اتجاه عام قوي، ليعلن عن انتهائها واستئناف الاتجاه الأصلي:
• 1. الدايفرجنس الخفي الإيجابي (Bullish Hidden Divergence):
- السلوك على الشارت: السعر يصنع قاعاً أعلى من قاع (Higher Low) في اتجاه صاعد، بينما مؤشر MACD يصنع قاعاً أدنى من قاع (Lower Low).
- النتيجة المتوقعة: القوة البيعية الحالية مجرد تصحيح مؤقت؛ فرصة ممتازة للشراء مع الاتجاه الصاعد العام.
• 2. الدايفرجنس الخفي السلبي (Bearish Hidden Divergence)
- السلوك على الشارت: السعر يصنع قمة أدنى من قمة (Lower Peak) في اتجاه هابط، بينما مؤشر MACD يصنع قمة أعلى من قمة (Higher Peak)
- النتيجة المتوقعة: التصحيح الصاعد انتهى؛ إشارة لاستمرار الهبوط والبيع مع الاتجاه الهابط العام.
---
🧬 2️⃣ إعدادات مؤشر MACD حسب أسلوب التداول
الإعداد الافتراضي (12, 26, 9) ممتازة لمعظم المتداولين، لكن يمكنك تعديلها لتناسب أسلوبك:
• الإعدادات السريعة (لـ Scalping والتداول اليومي): (5, 35, 5)
- يعطي استجابة أسرع للأسعار وتغيرات الزخم اللحظية، لكنه يعرضك لإشارات خاطئة أكثر.
• الإعدادات القياسية (لـ Swing Trading والصفقات اليومية): (12, 26, 9)
- التوازن الأمثل بين السرعة وتصفية الضوضاء السعرية.
• الإعدادات البطئية (للصفقات الاستثمارية والاتجاهات الكبرى): (24, 52, 18)
- يفلتر تقلبات السوق العنيفة وينتج إشارات عالية الجودة على الفريمات الكبيرة (يومي / أسبوعي).
---
🔍 3️⃣ ملخص إستراتيجية MACD الشاملة للتداول
لتحقيق أفضل نتائج على الشارت:
1. حدد الاتجاه: انظر لموقع الخطوط بالنسبة لخط الصفر (Zero Line).
2. اتبع الزخم: راقب انكماش وتمدد أعمدة الهستوجرام للتحذير المبكر.
3. اقتنص الفرص: استخدم الدايفرجنس المباشر للارتدادات والدايفرجنس الخفي لصفقات الاستمرار.
4. التأكيد دائماً: لا تتداول بالمؤشر مفرداً، بل دائمًا ادمجه مع مستويات الدعم والمقاومة وسلوك السعر (Price Action).
---
⚖️ خلاصة السلسلة:
"المؤشرات الفنية ليست بلورة سحرية، بل هي عدسة مكبرة توضح لك سلوك السيولة؛ ومؤشر MACD عندما تفهم لغته يصبح من أقوى الأدوات في ترسانتك التحليلية."
---
💬 شاركونا في التعليقات:
أي أنواع التداول تفضل استخدام MACD معها: الصفقات السريعة (Scalping) أم الصفقات المتوسطة (Swing Trading)؟
#BinanceSquare #cryptotrading #MACD #TechnicalAnalysis #القعقاع_1
$1 $Mubarakah $AKE
🎯 القاعدة #5: "إذا كان الدايفرجنس العادي يصطاد نهايات الاتجاه للانعكاس.. فإن الدايفرجنس الخفي هو أفضل صديق للركوب مع الاتجاه المستمر (Trend Following) من أفضل مناطق إعادة الاختبار."
💡 1️⃣ ما هو الدايفرجنس الخفي (Hidden Divergence)؟
الدايفرجنس الخفي لا يستهدف القمم والقيعان النهائية، بل يظهر أثناء الموجات التصحيحية داخل اتجاه عام قوي، ليعلن عن انتهائها واستئناف الاتجاه الأصلي:
• 1. الدايفرجنس الخفي الإيجابي (Bullish Hidden Divergence):
- السلوك على الشارت: السعر يصنع قاعاً أعلى من قاع (Higher Low) في اتجاه صاعد، بينما مؤشر MACD يصنع قاعاً أدنى من قاع (Lower Low).
- النتيجة المتوقعة: القوة البيعية الحالية مجرد تصحيح مؤقت؛ فرصة ممتازة للشراء مع الاتجاه الصاعد العام.
• 2. الدايفرجنس الخفي السلبي (Bearish Hidden Divergence)
- السلوك على الشارت: السعر يصنع قمة أدنى من قمة (Lower Peak) في اتجاه هابط، بينما مؤشر MACD يصنع قمة أعلى من قمة (Higher Peak)
- النتيجة المتوقعة: التصحيح الصاعد انتهى؛ إشارة لاستمرار الهبوط والبيع مع الاتجاه الهابط العام.
---
🧬 2️⃣ إعدادات مؤشر MACD حسب أسلوب التداول
الإعداد الافتراضي (12, 26, 9) ممتازة لمعظم المتداولين، لكن يمكنك تعديلها لتناسب أسلوبك:
• الإعدادات السريعة (لـ Scalping والتداول اليومي): (5, 35, 5)
- يعطي استجابة أسرع للأسعار وتغيرات الزخم اللحظية، لكنه يعرضك لإشارات خاطئة أكثر.
• الإعدادات القياسية (لـ Swing Trading والصفقات اليومية): (12, 26, 9)
- التوازن الأمثل بين السرعة وتصفية الضوضاء السعرية.
• الإعدادات البطئية (للصفقات الاستثمارية والاتجاهات الكبرى): (24, 52, 18)
- يفلتر تقلبات السوق العنيفة وينتج إشارات عالية الجودة على الفريمات الكبيرة (يومي / أسبوعي).
---
🔍 3️⃣ ملخص إستراتيجية MACD الشاملة للتداول
لتحقيق أفضل نتائج على الشارت:
1. حدد الاتجاه: انظر لموقع الخطوط بالنسبة لخط الصفر (Zero Line).
2. اتبع الزخم: راقب انكماش وتمدد أعمدة الهستوجرام للتحذير المبكر.
3. اقتنص الفرص: استخدم الدايفرجنس المباشر للارتدادات والدايفرجنس الخفي لصفقات الاستمرار.
4. التأكيد دائماً: لا تتداول بالمؤشر مفرداً، بل دائمًا ادمجه مع مستويات الدعم والمقاومة وسلوك السعر (Price Action).
---
⚖️ خلاصة السلسلة:
"المؤشرات الفنية ليست بلورة سحرية، بل هي عدسة مكبرة توضح لك سلوك السيولة؛ ومؤشر MACD عندما تفهم لغته يصبح من أقوى الأدوات في ترسانتك التحليلية."
---
💬 شاركونا في التعليقات:
أي أنواع التداول تفضل استخدام MACD معها: الصفقات السريعة (Scalping) أم الصفقات المتوسطة (Swing Trading)؟
#BinanceSquare #cryptotrading #MACD #TechnicalAnalysis #القعقاع_1
$1 $Mubarakah $AKE
2
284
·
--
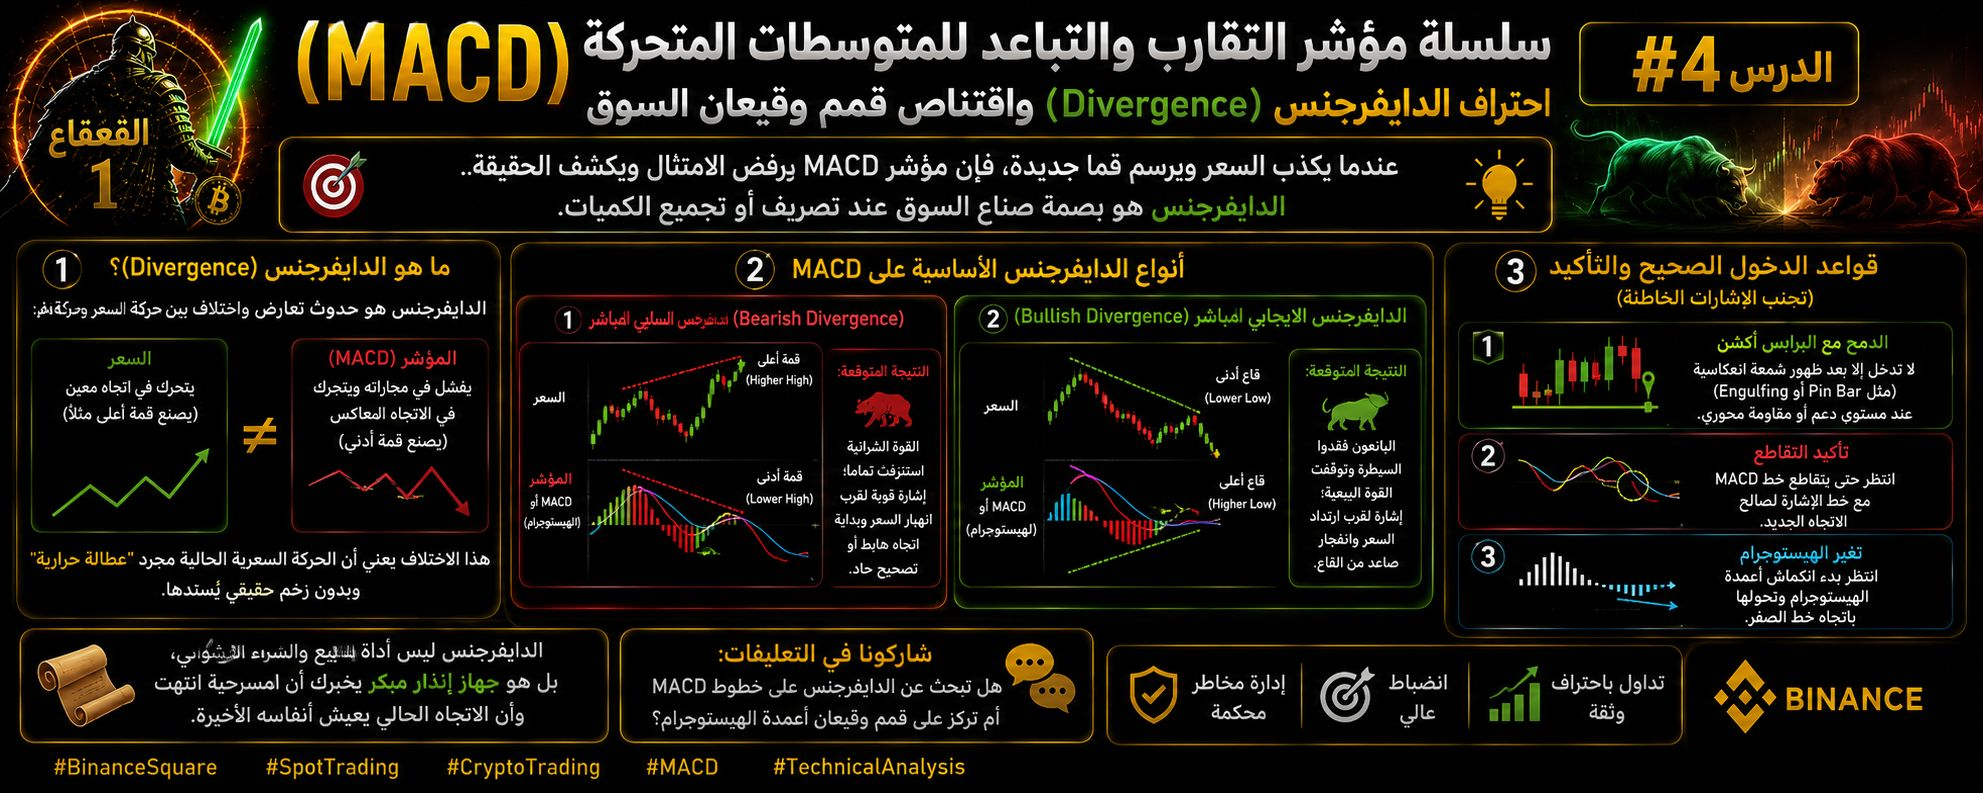
Статья
📌 **سلسلة مؤشر التقارب والتباعد للمتوسطات المتحركة (MACD) الدرس #4:احتراف الدايفرجنس Divergenceاقتناص قمم وقيعان السوق
مرحباً بكم زملائي المتداولين! أهلاً بكم في رابع محطات سلسلتنا. نصل اليوم إلى السلاح الأكثر إبهاراً وقوة في مؤشر MACD: **الانحراف أو الدايفرجنس (Divergence)**. وهو السلوك الذي يكشف التضليل السعري ويصطاد نقاط الانعكاس قبل الجميع.
---
🎯 **القاعدة #4:** "عندما يكذب السعر ويرسم قماً جديدة، فإن مؤشر MACD يرفض الامتثال ويكشف الحقيقة.. الدايفرجنس هو بصمة صناع السوق عند تصريف أو تجميع الكميات."
---
💡 **1️⃣ ما هو الدايفرجنس (Divergence)؟**
الدايفرجنس هو حدوث **تعارض واختلاف بين حركة السعر وحركة مؤشر MACD**:
• السعر يتحرك في اتجاه معين (يصنع قمة أعلى مثلاً).
• بينما المؤشر يفشل في مجاراته ويتحرك في الاتجاه المعاكس (يصنع قمة أدنى).
هذا الاختلاف يعني أن الحركة السعرية الحالية مجرد "عطالة حرارية" وبدون زخم حقيقي يُسندها.
---
🧬 **2️⃣ أنواع الدايفرجنس الأساسية على MACD**
• **1. الدايفرجنس السلبي المباشر (Bearish Divergence):**
- **السلوك على الشارت:** السعر يصنع قمة أعلى من قمة (Higher High)، بينما خط MACD أو الهستوجرام يصنع قمة أدنى من قمة (Lower High).
- **النتيجة المتوقعة:** القوة الشرائية استُنزفت تماماً؛ إشارة قوية لقرب انهيار السعر وبداية اتجاه هابط أو تصحيح حاد.
• **2. الدايفرجنس الإيجابي المباشر (Bullish Divergence):**
- **السلوك على الشارت:** السعر يصنع قاعاً أدنى من قاع (Lower Low)، بينما خط MACD أو الهستوجرام يصنع قاعاً أعلى من قاع (Higher Low).
- **النتيجة المتوقعة:** البائعون فقدوا السيطرة وتوقفت القوة البيعية؛ إشارة لقرب ارتداد السعر وانفجار صاعد من القاع.
---
🔍 **3️⃣ قواعد الدخول الصحيح والتأكيد (تجنب الإشارات الخاطئة)**
الخطأ القاتل هو الدخول المباشر بمجرد رؤية الدايفرجنس. لتأكيد الصفقة وزيادة نسبة نجاحها:
1. **الدمج مع البرايس أكشن:** لا تدخل إلا بعد ظهور شمعة انعكاسية (مثل Pin Bar أو Engulfing) عند مستوى دعم أو مقاومة محوري.
2. **تأكيد التقاطع:** انتظر حتى يتقاطع خط MACD مع خط الإشارة لصالح الاتجاه الجديد.
3. **تغير الهستوجرام:** انتظر بدء انكماش أعمدة الهستوجرام وتحولها باتجاه خط الصفر.
---
⚖️ **خلاصة الدرس الرابع:**
"الدايفرجنس ليس أداة للبيع والشراء العشوائي، بل هو جهاز إنذار مبكر يخبرك أن المسرحية انتهت وأن الاتجاه الحالي يعيش أنفاسه الأخيرة."
---
💬 **شاركونا في التعليقات:**
هل تبحث عن الدايفرجنس على خطوط MACD أم تركز على قمم وقيعان أعمدة الهستوجرام؟
#BinanceSquare #القعقاع_1
#cryptotrading #MACD
$BTC
{spot}(BTCUSDT)
$ETH
{spot}(ETHUSDT)
$BIO
{spot}(BIOUSDT)
📌 **سلسلة مؤشر التقارب والتباعد للمتوسطات المتحركة (MACD) الدرس #4:احتراف الدايفرجنس Divergence
اقتناص قمم وقيعان السوق
مرحباً بكم زملائي المتداولين! أهلاً بكم في رابع محطات سلسلتنا. نصل اليوم إلى السلاح الأكثر إبهاراً وقوة في مؤشر MACD: **الانحراف أو الدايفرجنس (Divergence)**. وهو السلوك الذي يكشف التضليل السعري ويصطاد نقاط الانعكاس قبل الجميع.
---
🎯 **القاعدة #4:** "عندما يكذب السعر ويرسم قماً جديدة، فإن مؤشر MACD يرفض الامتثال ويكشف الحقيقة.. الدايفرجنس هو بصمة صناع السوق عند تصريف أو تجميع الكميات."
---
💡 **1️⃣ ما هو الدايفرجنس (Divergence)؟**
الدايفرجنس هو حدوث **تعارض واختلاف بين حركة السعر وحركة مؤشر MACD**:
• السعر يتحرك في اتجاه معين (يصنع قمة أعلى مثلاً).
• بينما المؤشر يفشل في مجاراته ويتحرك في الاتجاه المعاكس (يصنع قمة أدنى).
هذا الاختلاف يعني أن الحركة السعرية الحالية مجرد "عطالة حرارية" وبدون زخم حقيقي يُسندها.
---
🧬 **2️⃣ أنواع الدايفرجنس الأساسية على MACD**
• **1. الدايفرجنس السلبي المباشر (Bearish Divergence):**
- **السلوك على الشارت:** السعر يصنع قمة أعلى من قمة (Higher High)، بينما خط MACD أو الهستوجرام يصنع قمة أدنى من قمة (Lower High).
- **النتيجة المتوقعة:** القوة الشرائية استُنزفت تماماً؛ إشارة قوية لقرب انهيار السعر وبداية اتجاه هابط أو تصحيح حاد.
• **2. الدايفرجنس الإيجابي المباشر (Bullish Divergence):**
- **السلوك على الشارت:** السعر يصنع قاعاً أدنى من قاع (Lower Low)، بينما خط MACD أو الهستوجرام يصنع قاعاً أعلى من قاع (Higher Low).
- **النتيجة المتوقعة:** البائعون فقدوا السيطرة وتوقفت القوة البيعية؛ إشارة لقرب ارتداد السعر وانفجار صاعد من القاع.
---
🔍 **3️⃣ قواعد الدخول الصحيح والتأكيد (تجنب الإشارات الخاطئة)**
الخطأ القاتل هو الدخول المباشر بمجرد رؤية الدايفرجنس. لتأكيد الصفقة وزيادة نسبة نجاحها:
1. **الدمج مع البرايس أكشن:** لا تدخل إلا بعد ظهور شمعة انعكاسية (مثل Pin Bar أو Engulfing) عند مستوى دعم أو مقاومة محوري.
2. **تأكيد التقاطع:** انتظر حتى يتقاطع خط MACD مع خط الإشارة لصالح الاتجاه الجديد.
3. **تغير الهستوجرام:** انتظر بدء انكماش أعمدة الهستوجرام وتحولها باتجاه خط الصفر.
---
⚖️ **خلاصة الدرس الرابع:**
"الدايفرجنس ليس أداة للبيع والشراء العشوائي، بل هو جهاز إنذار مبكر يخبرك أن المسرحية انتهت وأن الاتجاه الحالي يعيش أنفاسه الأخيرة."
---
💬 **شاركونا في التعليقات:**
هل تبحث عن الدايفرجنس على خطوط MACD أم تركز على قمم وقيعان أعمدة الهستوجرام؟
#BinanceSquare #القعقاع_1
#cryptotrading #MACD
$BTC
$ETH
$BIO
مرحباً بكم زملائي المتداولين! أهلاً بكم في رابع محطات سلسلتنا. نصل اليوم إلى السلاح الأكثر إبهاراً وقوة في مؤشر MACD: **الانحراف أو الدايفرجنس (Divergence)**. وهو السلوك الذي يكشف التضليل السعري ويصطاد نقاط الانعكاس قبل الجميع.
---
🎯 **القاعدة #4:** "عندما يكذب السعر ويرسم قماً جديدة، فإن مؤشر MACD يرفض الامتثال ويكشف الحقيقة.. الدايفرجنس هو بصمة صناع السوق عند تصريف أو تجميع الكميات."
---
💡 **1️⃣ ما هو الدايفرجنس (Divergence)؟**
الدايفرجنس هو حدوث **تعارض واختلاف بين حركة السعر وحركة مؤشر MACD**:
• السعر يتحرك في اتجاه معين (يصنع قمة أعلى مثلاً).
• بينما المؤشر يفشل في مجاراته ويتحرك في الاتجاه المعاكس (يصنع قمة أدنى).
هذا الاختلاف يعني أن الحركة السعرية الحالية مجرد "عطالة حرارية" وبدون زخم حقيقي يُسندها.
---
🧬 **2️⃣ أنواع الدايفرجنس الأساسية على MACD**
• **1. الدايفرجنس السلبي المباشر (Bearish Divergence):**
- **السلوك على الشارت:** السعر يصنع قمة أعلى من قمة (Higher High)، بينما خط MACD أو الهستوجرام يصنع قمة أدنى من قمة (Lower High).
- **النتيجة المتوقعة:** القوة الشرائية استُنزفت تماماً؛ إشارة قوية لقرب انهيار السعر وبداية اتجاه هابط أو تصحيح حاد.
• **2. الدايفرجنس الإيجابي المباشر (Bullish Divergence):**
- **السلوك على الشارت:** السعر يصنع قاعاً أدنى من قاع (Lower Low)، بينما خط MACD أو الهستوجرام يصنع قاعاً أعلى من قاع (Higher Low).
- **النتيجة المتوقعة:** البائعون فقدوا السيطرة وتوقفت القوة البيعية؛ إشارة لقرب ارتداد السعر وانفجار صاعد من القاع.
---
🔍 **3️⃣ قواعد الدخول الصحيح والتأكيد (تجنب الإشارات الخاطئة)**
الخطأ القاتل هو الدخول المباشر بمجرد رؤية الدايفرجنس. لتأكيد الصفقة وزيادة نسبة نجاحها:
1. **الدمج مع البرايس أكشن:** لا تدخل إلا بعد ظهور شمعة انعكاسية (مثل Pin Bar أو Engulfing) عند مستوى دعم أو مقاومة محوري.
2. **تأكيد التقاطع:** انتظر حتى يتقاطع خط MACD مع خط الإشارة لصالح الاتجاه الجديد.
3. **تغير الهستوجرام:** انتظر بدء انكماش أعمدة الهستوجرام وتحولها باتجاه خط الصفر.
---
⚖️ **خلاصة الدرس الرابع:**
"الدايفرجنس ليس أداة للبيع والشراء العشوائي، بل هو جهاز إنذار مبكر يخبرك أن المسرحية انتهت وأن الاتجاه الحالي يعيش أنفاسه الأخيرة."
---
💬 **شاركونا في التعليقات:**
هل تبحث عن الدايفرجنس على خطوط MACD أم تركز على قمم وقيعان أعمدة الهستوجرام؟
#BinanceSquare #القعقاع_1
#cryptotrading #MACD
$BTC
$ETH
$BIO
2
194
·
--
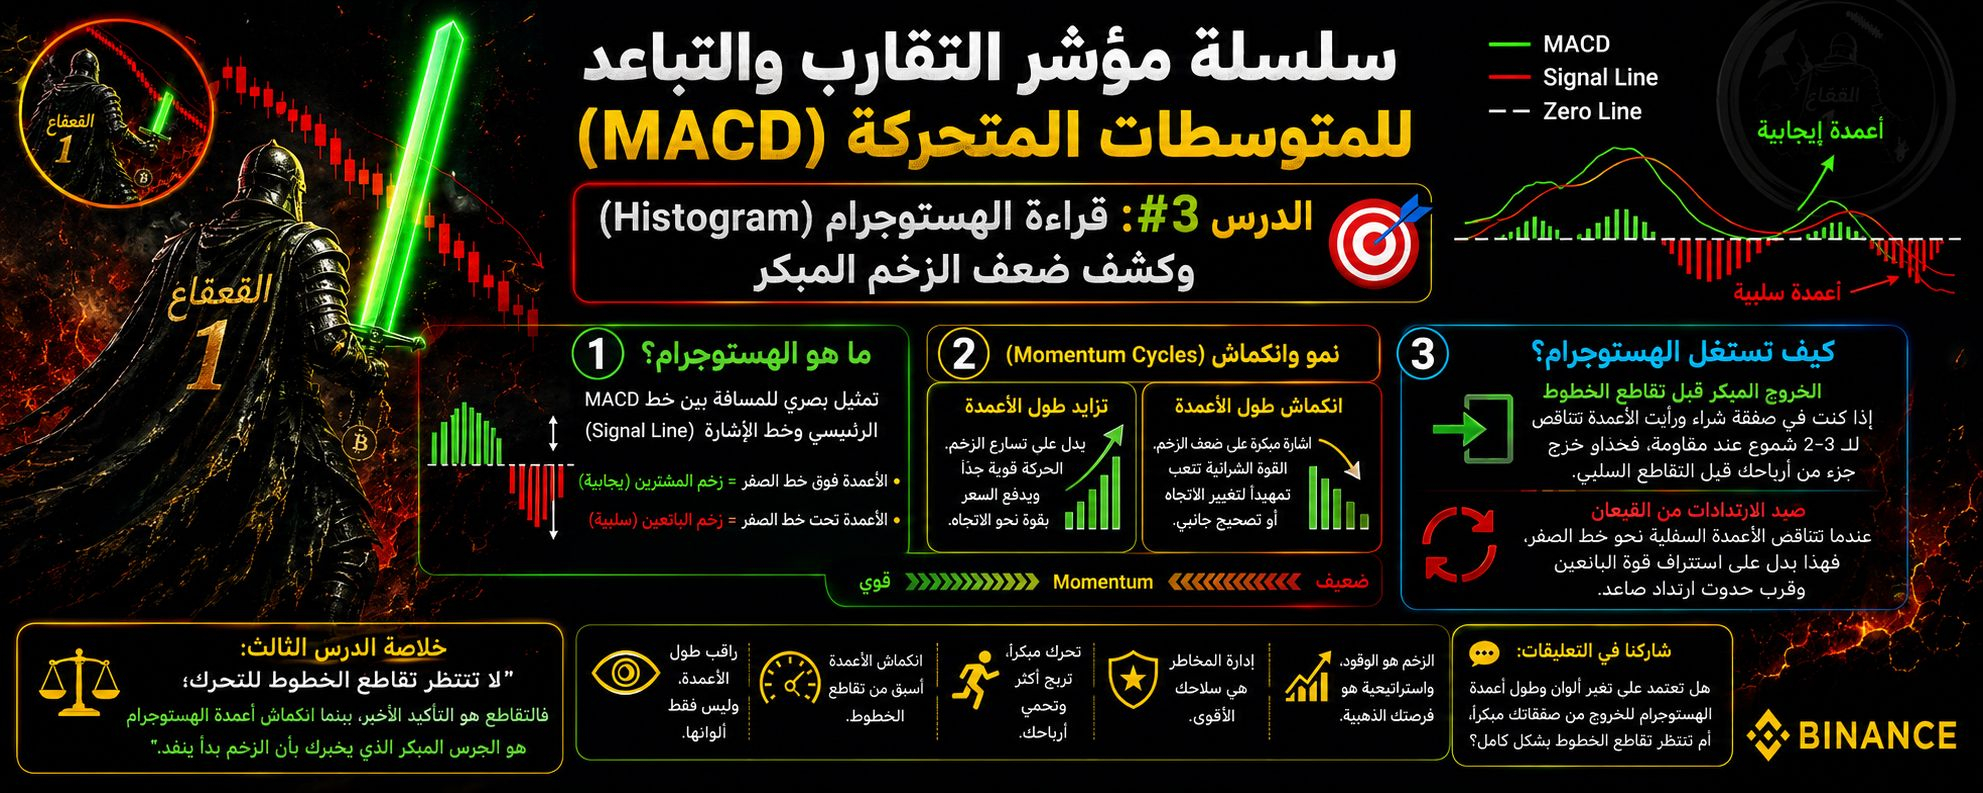
Статья
📌 سلسلة مؤشر التقارب والتباعد للمتوسطات المتحركة (MACD) | الدرس #3: قراءة الهستوجرام (Histogram)مرحباً بكم زملائي المتداولين! أهلاً بكم في ثالث محطات سلسلتنا. بعد أن تعلمنا تركيبة الخطوط وأسرار تقاطعاتها مع خط الصفر، ننتقل اليوم إلى العضو الأسرع والأكثر استجابة في هذا المؤشر: **المدرج التكراري (Histogram)**، الشاشة الحقيقية لقياس نبض السوق قبل حدوث التقاطعات الرسمية.
---
🎯 **القاعدة #3:** "تقاطعات الخطوط تخبرك بما حدث، أما الهستوجرام فيخبرك بما يحدث الآن وما سيحدث قريباً.. فهو البنزين الذي يحرك سيارة الاتجاه!"
---
💡 **1️⃣ ما هو الهستوجرام؟ وكيف يُقرأ على الشارت؟**
الهستوجرام ليس سوى تمثيل بصري للمسافة الفاصلة بين **خط MACD الرئيسي** و**خط الإشارة (Signal Line)**:
• **الأعمدة أعلى خط الصفر (إيجابية):** تعني أن خط MACD يتواجد فوق خط الإشارة (الزخم لصالح المشترين).
• **الأعمدة أسفل خط الصفر (سلبية):** تعني أن خط MACD يتواجد تحت خط الإشارة (الزخم لصالح البائعين).
---
🧬 **2️⃣ السر السلوكي: نمو وانكماش الأعمدة (Momentum Cycles)**
الخطأ الذي يقع فيه أغلب المتداولين هو الانتظار حتى تتحول الأعمدة من خضراء إلى حمراء (أو العكس). المحترف يراقب **تغير طول الأعمدة نفسها**:
• **تزايد طول الأعمدة (Expanding Bars):**
يدل على تسارع الزخم. الحركة الحالية قوية جداً والمشترون (أو البائعون) يدفعون السعر بكل قوتهم.
• **انكماش طول الأعمدة (Shrinking Bars):**
أهم إشارة مبكرة على الشارت! عندما يبدأ طول العمود بالتقلص وهو لا يزال فوق خط الصفر، فهذا يعني أن القوة الشرائية بدأت تتعب وأن الزخم الصاعد يضعف، تمهيداً لتغيير الاتجاه أو البدء في تصحيح جانبي.
---
🔍 **3️⃣ كيف تستغل الهستوجرام في صفقات السكالبينج والتداول اليومي؟**
• **الخروج المبكر قبل تقاطع الخطوط:** إذا كنت في صفقة شراء ورأيت أعمدة الهستوجرام تبدأ في الانكماش لـ 2-3 شمعات متتالية عند منطقة مقاومة، فهذا تحذير لخروج جزء من أرباحك قبل أن يتقاطع خط MACD سلباً.
• **صيد الارتدادات من القيعان:** عندما تكون الأسعار في هبوط حاد وتبدأ أعمدة الهستوجرام السفلية بالانكماش (تقصر شيئاً فشيئاً نحو خط الصفر)، فهذه إشارة على استنزاف قوة البائعين وقرب حدوث ارتداد صاعد.
---
⚖️️ **خلاصة الدرس الثالث:**
"لا تنتظر تقاطع الخطوط للتحرك؛ فالتقاطع هو التأكيد الأخير، بينما انكماش أعمدة الهستوجرام هو الجرس المبكر الذي يخبرك بأن الزخم بدأ ينفد."
---
💬 **شاركونا في التعليقات:**
هل تعتمد على تغير ألوان وطول أعمدة الهستوجرام للخروج من صفقاتك مبكراً، أم تنتظر تقاطع الخطوط بشكل كامل؟
#القعقاع_1 #BinanceSquare #SpotT
#cryptotrading #MACD #TechnicalAnalysis
{spot}(BTCUSDT)
{spot}(DEXEUSDT)
$BIO
{spot}(BIOUSDT)
@hams15 @CHAINnews @CoinVoice @Dy201210 @chenbo16958 @Ella51888 @Square-Creator-f950685a3c52 @Square-Creator-7be28d989 @Square-Creator-1b173031556ad @chengzi8150 @CoinSummer @Punk666 @DeHuiVC @danny1991 @Square-Creator-fcb1a203f721
📌 سلسلة مؤشر التقارب والتباعد للمتوسطات المتحركة (MACD) | الدرس #3: قراءة الهستوجرام (Histogram)
مرحباً بكم زملائي المتداولين! أهلاً بكم في ثالث محطات سلسلتنا. بعد أن تعلمنا تركيبة الخطوط وأسرار تقاطعاتها مع خط الصفر، ننتقل اليوم إلى العضو الأسرع والأكثر استجابة في هذا المؤشر: **المدرج التكراري (Histogram)**، الشاشة الحقيقية لقياس نبض السوق قبل حدوث التقاطعات الرسمية.
---
🎯 **القاعدة #3:** "تقاطعات الخطوط تخبرك بما حدث، أما الهستوجرام فيخبرك بما يحدث الآن وما سيحدث قريباً.. فهو البنزين الذي يحرك سيارة الاتجاه!"
---
💡 **1️⃣ ما هو الهستوجرام؟ وكيف يُقرأ على الشارت؟**
الهستوجرام ليس سوى تمثيل بصري للمسافة الفاصلة بين **خط MACD الرئيسي** و**خط الإشارة (Signal Line)**:
• **الأعمدة أعلى خط الصفر (إيجابية):** تعني أن خط MACD يتواجد فوق خط الإشارة (الزخم لصالح المشترين).
• **الأعمدة أسفل خط الصفر (سلبية):** تعني أن خط MACD يتواجد تحت خط الإشارة (الزخم لصالح البائعين).
---
🧬 **2️⃣ السر السلوكي: نمو وانكماش الأعمدة (Momentum Cycles)**
الخطأ الذي يقع فيه أغلب المتداولين هو الانتظار حتى تتحول الأعمدة من خضراء إلى حمراء (أو العكس). المحترف يراقب **تغير طول الأعمدة نفسها**:
• **تزايد طول الأعمدة (Expanding Bars):**
يدل على تسارع الزخم. الحركة الحالية قوية جداً والمشترون (أو البائعون) يدفعون السعر بكل قوتهم.
• **انكماش طول الأعمدة (Shrinking Bars):**
أهم إشارة مبكرة على الشارت! عندما يبدأ طول العمود بالتقلص وهو لا يزال فوق خط الصفر، فهذا يعني أن القوة الشرائية بدأت تتعب وأن الزخم الصاعد يضعف، تمهيداً لتغيير الاتجاه أو البدء في تصحيح جانبي.
---
🔍 **3️⃣ كيف تستغل الهستوجرام في صفقات السكالبينج والتداول اليومي؟**
• **الخروج المبكر قبل تقاطع الخطوط:** إذا كنت في صفقة شراء ورأيت أعمدة الهستوجرام تبدأ في الانكماش لـ 2-3 شمعات متتالية عند منطقة مقاومة، فهذا تحذير لخروج جزء من أرباحك قبل أن يتقاطع خط MACD سلباً.
• **صيد الارتدادات من القيعان:** عندما تكون الأسعار في هبوط حاد وتبدأ أعمدة الهستوجرام السفلية بالانكماش (تقصر شيئاً فشيئاً نحو خط الصفر)، فهذه إشارة على استنزاف قوة البائعين وقرب حدوث ارتداد صاعد.
---
⚖️️ **خلاصة الدرس الثالث:**
"لا تنتظر تقاطع الخطوط للتحرك؛ فالتقاطع هو التأكيد الأخير، بينما انكماش أعمدة الهستوجرام هو الجرس المبكر الذي يخبرك بأن الزخم بدأ ينفد."
---
💬 **شاركونا في التعليقات:**
هل تعتمد على تغير ألوان وطول أعمدة الهستوجرام للخروج من صفقاتك مبكراً، أم تنتظر تقاطع الخطوط بشكل كامل؟
#القعقاع_1 #BinanceSquare #SpotT
#cryptotrading #MACD #TechnicalAnalysis
$BIO
@HAMS15 @CHAIN news @CoinVoice @connie三姐汇汇 @Chenbó辰镈 @Caicai诗雨 @Cherry 上帝的宝贝 @Crypto钟良 @LB鲁班 @CC 程程 BNB @CoinSummer @Daft Punk–不是反指版 @DeHui德惠VC @Danny小学僧 @DL钱行-神话MUA
---
🎯 **القاعدة #3:** "تقاطعات الخطوط تخبرك بما حدث، أما الهستوجرام فيخبرك بما يحدث الآن وما سيحدث قريباً.. فهو البنزين الذي يحرك سيارة الاتجاه!"
---
💡 **1️⃣ ما هو الهستوجرام؟ وكيف يُقرأ على الشارت؟**
الهستوجرام ليس سوى تمثيل بصري للمسافة الفاصلة بين **خط MACD الرئيسي** و**خط الإشارة (Signal Line)**:
• **الأعمدة أعلى خط الصفر (إيجابية):** تعني أن خط MACD يتواجد فوق خط الإشارة (الزخم لصالح المشترين).
• **الأعمدة أسفل خط الصفر (سلبية):** تعني أن خط MACD يتواجد تحت خط الإشارة (الزخم لصالح البائعين).
---
🧬 **2️⃣ السر السلوكي: نمو وانكماش الأعمدة (Momentum Cycles)**
الخطأ الذي يقع فيه أغلب المتداولين هو الانتظار حتى تتحول الأعمدة من خضراء إلى حمراء (أو العكس). المحترف يراقب **تغير طول الأعمدة نفسها**:
• **تزايد طول الأعمدة (Expanding Bars):**
يدل على تسارع الزخم. الحركة الحالية قوية جداً والمشترون (أو البائعون) يدفعون السعر بكل قوتهم.
• **انكماش طول الأعمدة (Shrinking Bars):**
أهم إشارة مبكرة على الشارت! عندما يبدأ طول العمود بالتقلص وهو لا يزال فوق خط الصفر، فهذا يعني أن القوة الشرائية بدأت تتعب وأن الزخم الصاعد يضعف، تمهيداً لتغيير الاتجاه أو البدء في تصحيح جانبي.
---
🔍 **3️⃣ كيف تستغل الهستوجرام في صفقات السكالبينج والتداول اليومي؟**
• **الخروج المبكر قبل تقاطع الخطوط:** إذا كنت في صفقة شراء ورأيت أعمدة الهستوجرام تبدأ في الانكماش لـ 2-3 شمعات متتالية عند منطقة مقاومة، فهذا تحذير لخروج جزء من أرباحك قبل أن يتقاطع خط MACD سلباً.
• **صيد الارتدادات من القيعان:** عندما تكون الأسعار في هبوط حاد وتبدأ أعمدة الهستوجرام السفلية بالانكماش (تقصر شيئاً فشيئاً نحو خط الصفر)، فهذه إشارة على استنزاف قوة البائعين وقرب حدوث ارتداد صاعد.
---
⚖️️ **خلاصة الدرس الثالث:**
"لا تنتظر تقاطع الخطوط للتحرك؛ فالتقاطع هو التأكيد الأخير، بينما انكماش أعمدة الهستوجرام هو الجرس المبكر الذي يخبرك بأن الزخم بدأ ينفد."
---
💬 **شاركونا في التعليقات:**
هل تعتمد على تغير ألوان وطول أعمدة الهستوجرام للخروج من صفقاتك مبكراً، أم تنتظر تقاطع الخطوط بشكل كامل؟
#القعقاع_1 #BinanceSquare #SpotT
#cryptotrading #MACD #TechnicalAnalysis
$BIO
@HAMS15 @CHAIN news @CoinVoice @connie三姐汇汇 @Chenbó辰镈 @Caicai诗雨 @Cherry 上帝的宝贝 @Crypto钟良 @LB鲁班 @CC 程程 BNB @CoinSummer @Daft Punk–不是反指版 @DeHui德惠VC @Danny小学僧 @DL钱行-神话MUA
2
560
Войдите, чтобы посмотреть больше материала
Присоединяйтесь к пользователям криптовалют по всему миру на Binance Square
⚡️ Получайте новейшую и полезную информацию о криптоактивах.
💬 Нам доверяет крупнейшая в мире криптобиржа.
👍 Получите достоверные аналитические данные от верифицированных создателей контента.
Эл. почта/номер телефона
В тренде
1
#BinancekzWin
Просмотров: 32,423
94 обсуждают
2
#BinancePick
Просмотров: 2.8M
146,586 обсуждают
3
#EarningsSeason
Просмотров: 5.1M
25,062 обсуждают
4
#AnthropicTTMRevenueGrewAbout1200%
Просмотров: 178
40 обсуждают
5
#AnthropicS1ExpectedToday
Просмотров: 1,507
72 обсуждают
6
#SouthKoreaReportedlyWeighsFourthCryptoTaxDelay
Просмотров: 10,061
239 обсуждают
7
#FranklinTempletonFilesForTwoDividendToBitcoinETFs
Просмотров: 16,512
363 обсуждают
8
#StrategyMSTRSurpassesNasdaqInMarketCap
Просмотров: 13,494
290 обсуждают
9
#CanadaProposesStablecoinRedemptionWithin3BusinessDays
Просмотров: 613
30 обсуждают
10
#ElectrumWalletBugLetRogueServersStealFunds
Просмотров: 18,415
396 обсуждают