

Mr_Ethan
33.1k Публикации

Mr_Ethan
Отправить жалобу
Заблокировать пользователя
Crypto Lover || Crypto influencer || BNB || Content Creator || Crypto influencer
Открытая сделка
Трейдер с регулярными сделками
1 г
1 подписок(и/а)
33.0K+ подписчиков(а)
20.0K+ понравилось
Посты
Портфель
Все
Цитирования
Активно
·
--
Рост
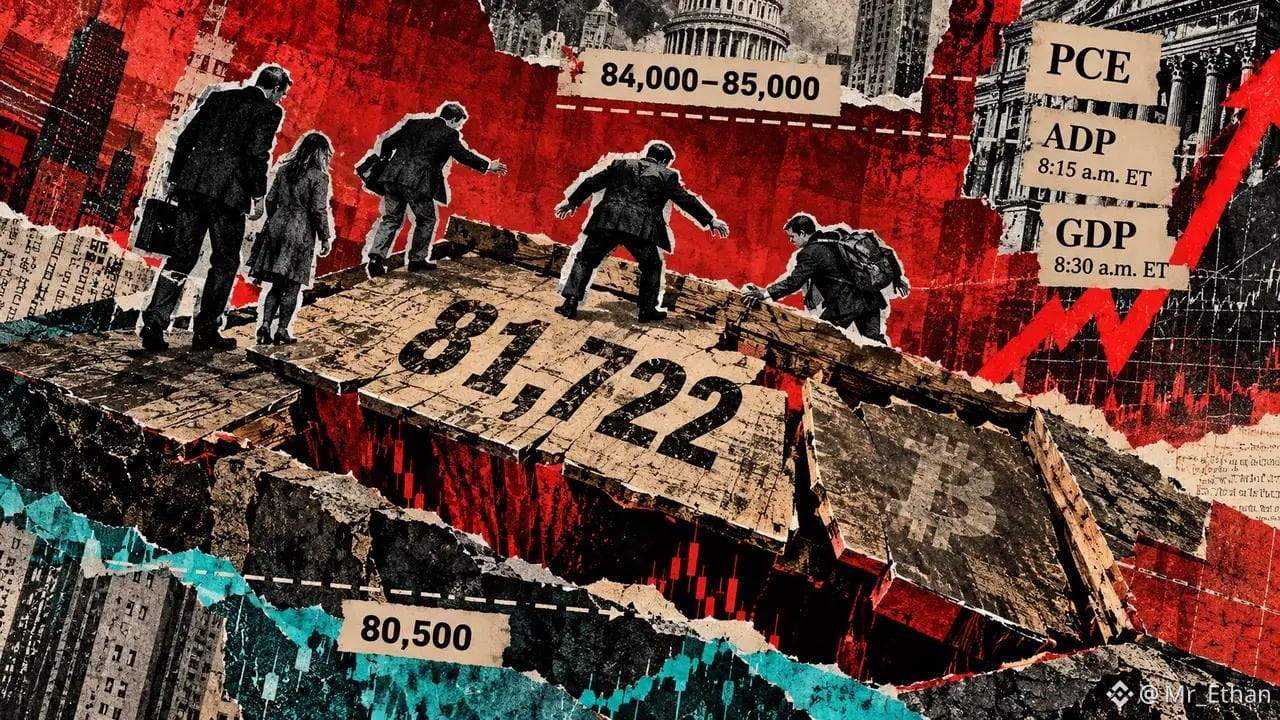
Bitcoin’s estimated break-even level for the average ETF holder is around $81,722, according to Bloomberg’s James Seyffart.
That level is getting more attention as BTC faces a possible test from today’s inflation and jobs data. Bitcoin closed Sept. 29 around $83,579, meaning a decline of roughly 2.2% would bring the price back to the estimated ETF holder break-even zone.
I think this is an important level to watch because ETF flows have become a major part of Bitcoin’s market structure. When a large group of investors is close to its average cost, price action around that area can become more sensitive.
If BTC holds above $81,722 despite fresh economic data, it could show that buyers are still willing to defend lower levels. On the other hand, a clear move below it could increase selling pressure, especially if the economic numbers push investors toward a more cautious risk outlook.
For now, I’m not looking at the $81.7K level as a guaranteed support zone. It’s simply a price area worth watching closely.
The next move may depend heavily on how markets react to today’s inflation and jobs data. With macro uncertainty still high, Bitcoin could see some sharp moves before a clearer direction develops.
$BTC
{future}(BTCUSDT)
Bitcoin’s estimated break-even level for the average ETF holder is around $81,722, according to Bloomberg’s James Seyffart.
That level is getting more attention as BTC faces a possible test from today’s inflation and jobs data. Bitcoin closed Sept. 29 around $83,579, meaning a decline of roughly 2.2% would bring the price back to the estimated ETF holder break-even zone.
I think this is an important level to watch because ETF flows have become a major part of Bitcoin’s market structure. When a large group of investors is close to its average cost, price action around that area can become more sensitive.
If BTC holds above $81,722 despite fresh economic data, it could show that buyers are still willing to defend lower levels. On the other hand, a clear move below it could increase selling pressure, especially if the economic numbers push investors toward a more cautious risk outlook.
For now, I’m not looking at the $81.7K level as a guaranteed support zone. It’s simply a price area worth watching closely.
The next move may depend heavily on how markets react to today’s inflation and jobs data. With macro uncertainty still high, Bitcoin could see some sharp moves before a clearer direction develops.
$BTC
That level is getting more attention as BTC faces a possible test from today’s inflation and jobs data. Bitcoin closed Sept. 29 around $83,579, meaning a decline of roughly 2.2% would bring the price back to the estimated ETF holder break-even zone.
I think this is an important level to watch because ETF flows have become a major part of Bitcoin’s market structure. When a large group of investors is close to its average cost, price action around that area can become more sensitive.
If BTC holds above $81,722 despite fresh economic data, it could show that buyers are still willing to defend lower levels. On the other hand, a clear move below it could increase selling pressure, especially if the economic numbers push investors toward a more cautious risk outlook.
For now, I’m not looking at the $81.7K level as a guaranteed support zone. It’s simply a price area worth watching closely.
The next move may depend heavily on how markets react to today’s inflation and jobs data. With macro uncertainty still high, Bitcoin could see some sharp moves before a clearer direction develops.
$BTC
92
·
--
$SEI
{future}(SEIUSDT)
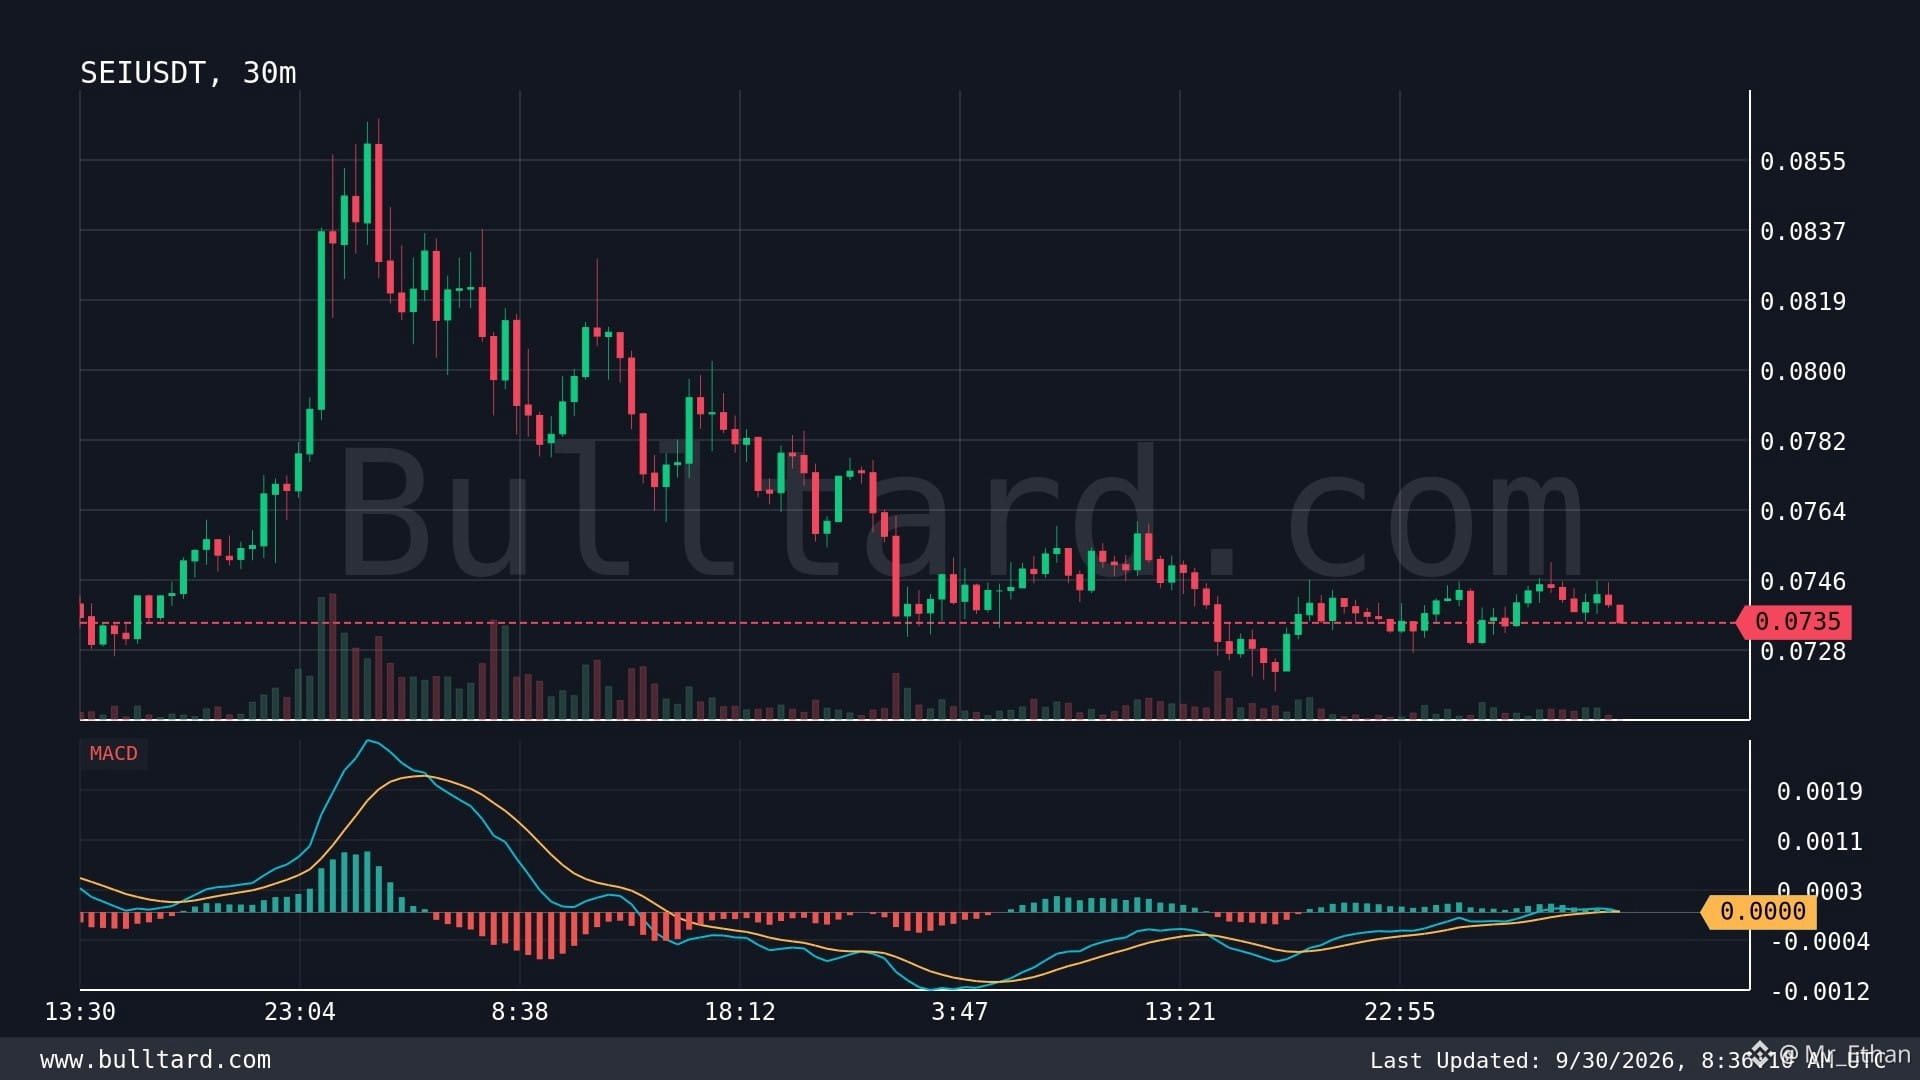
/USDT is showing a warning sign on the 30m chart. The MACD has printed a super bearish crossover, with price around $0.07348.
I’ve learned not to treat one indicator as a guaranteed direction. Still, when momentum shifts this sharply, I usually watch the next few candles very closely. SEI has strong potential as a fast, scalable blockchain, but like most altcoins, it can see aggressive moves when market sentiment turns weak.
My focus here would be price reaction around nearby support rather than chasing the move. If buyers step in and reclaim short-term resistance, the bearish signal could lose strength. If support breaks with volume, downside pressure may continue.
One lesson I’ve picked up from crypto: momentum signals work best when confirmed by price action and volume. A crossover alone isn’t enough for me.
I’m watching SEI closely now. Will buyers defend this level, or will sellers gain more control?
$SEI
/USDT is showing a warning sign on the 30m chart. The MACD has printed a super bearish crossover, with price around $0.07348.
I’ve learned not to treat one indicator as a guaranteed direction. Still, when momentum shifts this sharply, I usually watch the next few candles very closely. SEI has strong potential as a fast, scalable blockchain, but like most altcoins, it can see aggressive moves when market sentiment turns weak.
My focus here would be price reaction around nearby support rather than chasing the move. If buyers step in and reclaim short-term resistance, the bearish signal could lose strength. If support breaks with volume, downside pressure may continue.
One lesson I’ve picked up from crypto: momentum signals work best when confirmed by price action and volume. A crossover alone isn’t enough for me.
I’m watching SEI closely now. Will buyers defend this level, or will sellers gain more control?
/USDT is showing a warning sign on the 30m chart. The MACD has printed a super bearish crossover, with price around $0.07348.
I’ve learned not to treat one indicator as a guaranteed direction. Still, when momentum shifts this sharply, I usually watch the next few candles very closely. SEI has strong potential as a fast, scalable blockchain, but like most altcoins, it can see aggressive moves when market sentiment turns weak.
My focus here would be price reaction around nearby support rather than chasing the move. If buyers step in and reclaim short-term resistance, the bearish signal could lose strength. If support breaks with volume, downside pressure may continue.
One lesson I’ve picked up from crypto: momentum signals work best when confirmed by price action and volume. A crossover alone isn’t enough for me.
I’m watching SEI closely now. Will buyers defend this level, or will sellers gain more control?
1
406
·
--
Рост
$ETH I’m watching /BTC closely after a bearish MACD crossover appeared on the 30m chart. Price is currently around 0.03081, and for me, this is a sign to stay cautious rather than chase a trade.
I’ve seen these short-term crossovers give strong moves, but I’ve also learned that MACD alone isn’t enough. I want to see volume, price structure, and key support levels confirm the weakness.
Ethereum still has strong fundamentals, deep liquidity, and major adoption across DeFi, L2s, and Web3. But against BTC, ETH can struggle when capital rotates toward Bitcoin or traders become more defensive.
The main risk here is a false bearish signal. A quick recovery above nearby resistance could invalidate the setup and trigger a short squeeze.
My takeaway from trading these pairs is simple: momentum signals work best when they match the bigger market structure. I’m watching 0.03081 closely for confirmation before making a stronger move.
Do you think ETH can regain strength against BTC, or is more downside coming?
{spot}(ETHUSDT)
$4
{future}(4USDT)
$BULLA
{future}(BULLAUSDT)
$ETH I’m watching /BTC closely after a bearish MACD crossover appeared on the 30m chart. Price is currently around 0.03081, and for me, this is a sign to stay cautious rather than chase a trade.
I’ve seen these short-term crossovers give strong moves, but I’ve also learned that MACD alone isn’t enough. I want to see volume, price structure, and key support levels confirm the weakness.
Ethereum still has strong fundamentals, deep liquidity, and major adoption across DeFi, L2s, and Web3. But against BTC, ETH can struggle when capital rotates toward Bitcoin or traders become more defensive.
The main risk here is a false bearish signal. A quick recovery above nearby resistance could invalidate the setup and trigger a short squeeze.
My takeaway from trading these pairs is simple: momentum signals work best when they match the bigger market structure. I’m watching 0.03081 closely for confirmation before making a stronger move.
Do you think ETH can regain strength against BTC, or is more downside coming?
$4
$BULLA
I’ve seen these short-term crossovers give strong moves, but I’ve also learned that MACD alone isn’t enough. I want to see volume, price structure, and key support levels confirm the weakness.
Ethereum still has strong fundamentals, deep liquidity, and major adoption across DeFi, L2s, and Web3. But against BTC, ETH can struggle when capital rotates toward Bitcoin or traders become more defensive.
The main risk here is a false bearish signal. A quick recovery above nearby resistance could invalidate the setup and trigger a short squeeze.
My takeaway from trading these pairs is simple: momentum signals work best when they match the bigger market structure. I’m watching 0.03081 closely for confirmation before making a stronger move.
Do you think ETH can regain strength against BTC, or is more downside coming?
$4
$BULLA
351
·
--
Рост
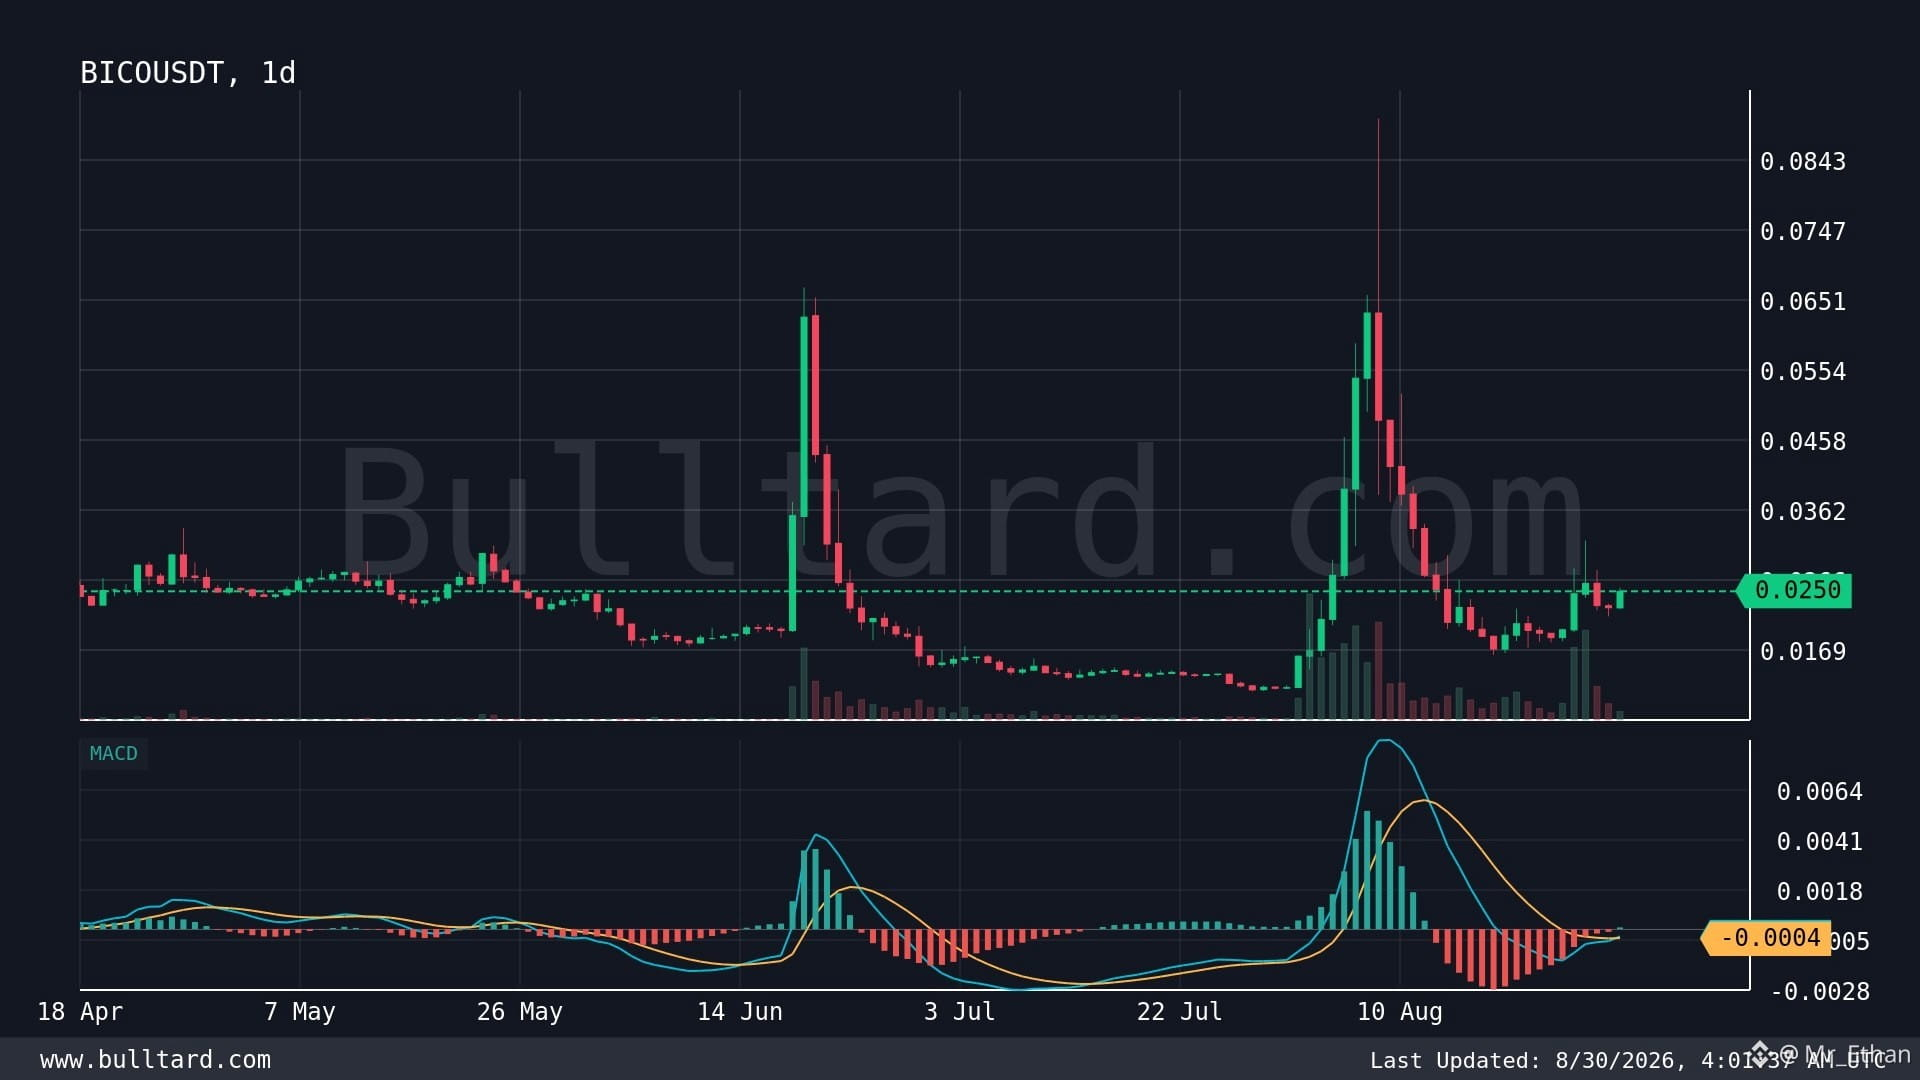
$BICO /USDT is giving me a signal I’m paying attention to 👀🔥
I’ve learned that when a daily MACD gives a strong bullish crossover, I don’t treat it as an instant buy signal. I treat it as a sign that momentum may be starting to change. Right now, BICO is around $0.025, so this setup is definitely worth watching.
Biconomy is focused on simplifying blockchain transactions and improving the user experience for Web3 apps. That matters because better infrastructure can help remove some of the friction that keeps normal users away from crypto.
What I like is the infrastructure angle and the potential for broader Web3 adoption. But I’m also keeping my expectations realistic. BICO still faces competition, liquidity risks, market volatility, and the usual problem of whether real usage can translate into long-term token value.
My biggest lesson from trading these setups is simple: MACD can show momentum, but price action must confirm it. I’d rather enter late with confirmation than chase the first green candle.
I’m watching BICO closely now. Do you think this daily crossover can turn into a bigger trend?
$BICO
{spot}(BICOUSDT)
$BMT
{spot}(BMTUSDT)
$BICO /USDT is giving me a signal I’m paying attention to 👀🔥
I’ve learned that when a daily MACD gives a strong bullish crossover, I don’t treat it as an instant buy signal. I treat it as a sign that momentum may be starting to change. Right now, BICO is around $0.025, so this setup is definitely worth watching.
Biconomy is focused on simplifying blockchain transactions and improving the user experience for Web3 apps. That matters because better infrastructure can help remove some of the friction that keeps normal users away from crypto.
What I like is the infrastructure angle and the potential for broader Web3 adoption. But I’m also keeping my expectations realistic. BICO still faces competition, liquidity risks, market volatility, and the usual problem of whether real usage can translate into long-term token value.
My biggest lesson from trading these setups is simple: MACD can show momentum, but price action must confirm it. I’d rather enter late with confirmation than chase the first green candle.
I’m watching BICO closely now. Do you think this daily crossover can turn into a bigger trend?
$BICO
$BMT
I’ve learned that when a daily MACD gives a strong bullish crossover, I don’t treat it as an instant buy signal. I treat it as a sign that momentum may be starting to change. Right now, BICO is around $0.025, so this setup is definitely worth watching.
Biconomy is focused on simplifying blockchain transactions and improving the user experience for Web3 apps. That matters because better infrastructure can help remove some of the friction that keeps normal users away from crypto.
What I like is the infrastructure angle and the potential for broader Web3 adoption. But I’m also keeping my expectations realistic. BICO still faces competition, liquidity risks, market volatility, and the usual problem of whether real usage can translate into long-term token value.
My biggest lesson from trading these setups is simple: MACD can show momentum, but price action must confirm it. I’d rather enter late with confirmation than chase the first green candle.
I’m watching BICO closely now. Do you think this daily crossover can turn into a bigger trend?
$BICO
$BMT
247
·
--
Рост
$GRAM /USDT. The 30m MACD has just printed a bullish crossover, with price around 1.358. I usually pay attention to these signals because they can show when short-term momentum is starting to shift.
I’ve learned that a MACD crossover alone is never enough for me to enter. I want to see volume, price structure, and follow-through. If buyers keep defending the current area and momentum continues building, this could develop into a stronger short-term move.
What I like is the early momentum signal. The weakness is that 30m signals can flip quickly, especially in a volatile market. Fake breakouts and sudden liquidity grabs are always possible, so I’m keeping risk management tight.
My main lesson from trading these setups: confirmation matters more than the crossover itself. I’d rather enter a little later with stronger confirmation than chase the first candle.
I’m watching. $GRAM
{spot}(GRAMUSDT)
$WET
{future}(WETUSDT)
$GRAM /USDT. The 30m MACD has just printed a bullish crossover, with price around 1.358. I usually pay attention to these signals because they can show when short-term momentum is starting to shift.
I’ve learned that a MACD crossover alone is never enough for me to enter. I want to see volume, price structure, and follow-through. If buyers keep defending the current area and momentum continues building, this could develop into a stronger short-term move.
What I like is the early momentum signal. The weakness is that 30m signals can flip quickly, especially in a volatile market. Fake breakouts and sudden liquidity grabs are always possible, so I’m keeping risk management tight.
My main lesson from trading these setups: confirmation matters more than the crossover itself. I’d rather enter a little later with stronger confirmation than chase the first candle.
I’m watching. $GRAM
$WET
I’ve learned that a MACD crossover alone is never enough for me to enter. I want to see volume, price structure, and follow-through. If buyers keep defending the current area and momentum continues building, this could develop into a stronger short-term move.
What I like is the early momentum signal. The weakness is that 30m signals can flip quickly, especially in a volatile market. Fake breakouts and sudden liquidity grabs are always possible, so I’m keeping risk management tight.
My main lesson from trading these setups: confirmation matters more than the crossover itself. I’d rather enter a little later with stronger confirmation than chase the first candle.
I’m watching. $GRAM
$WET
347
·
--
Рост
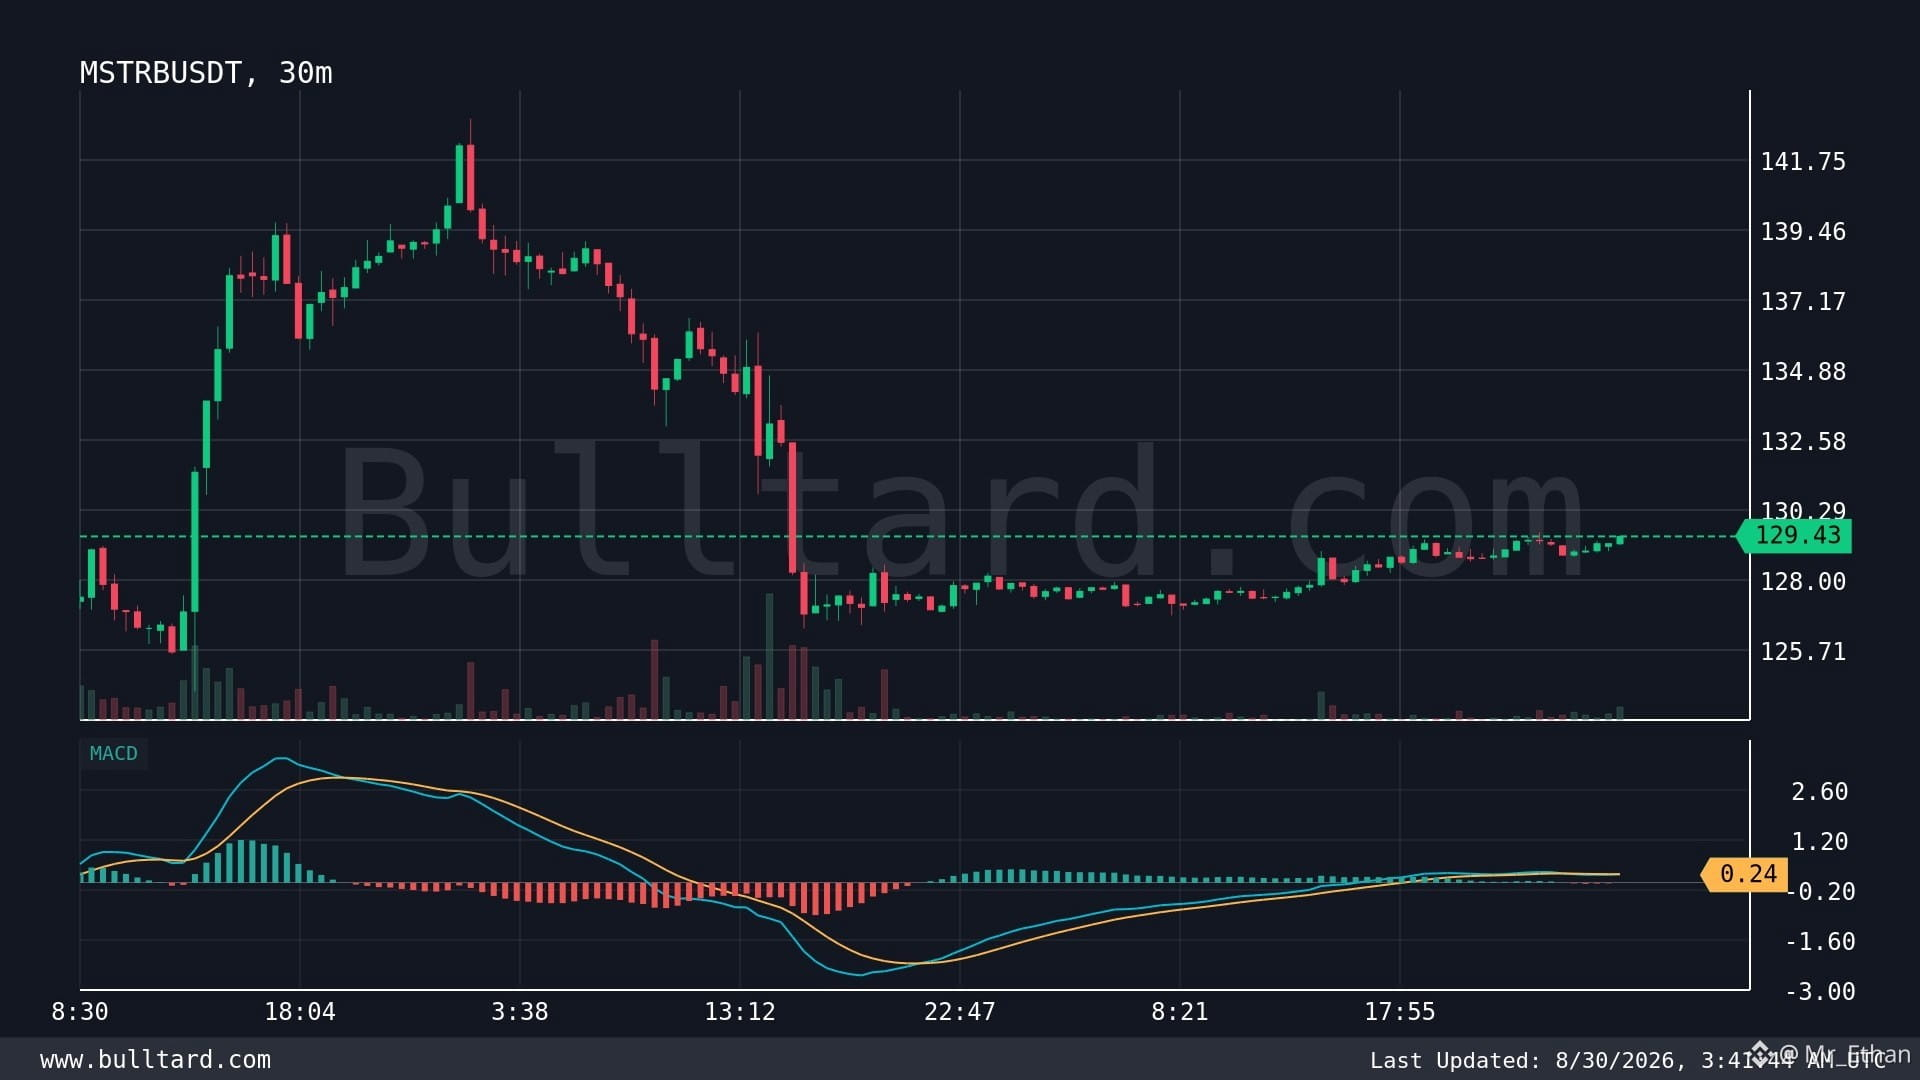
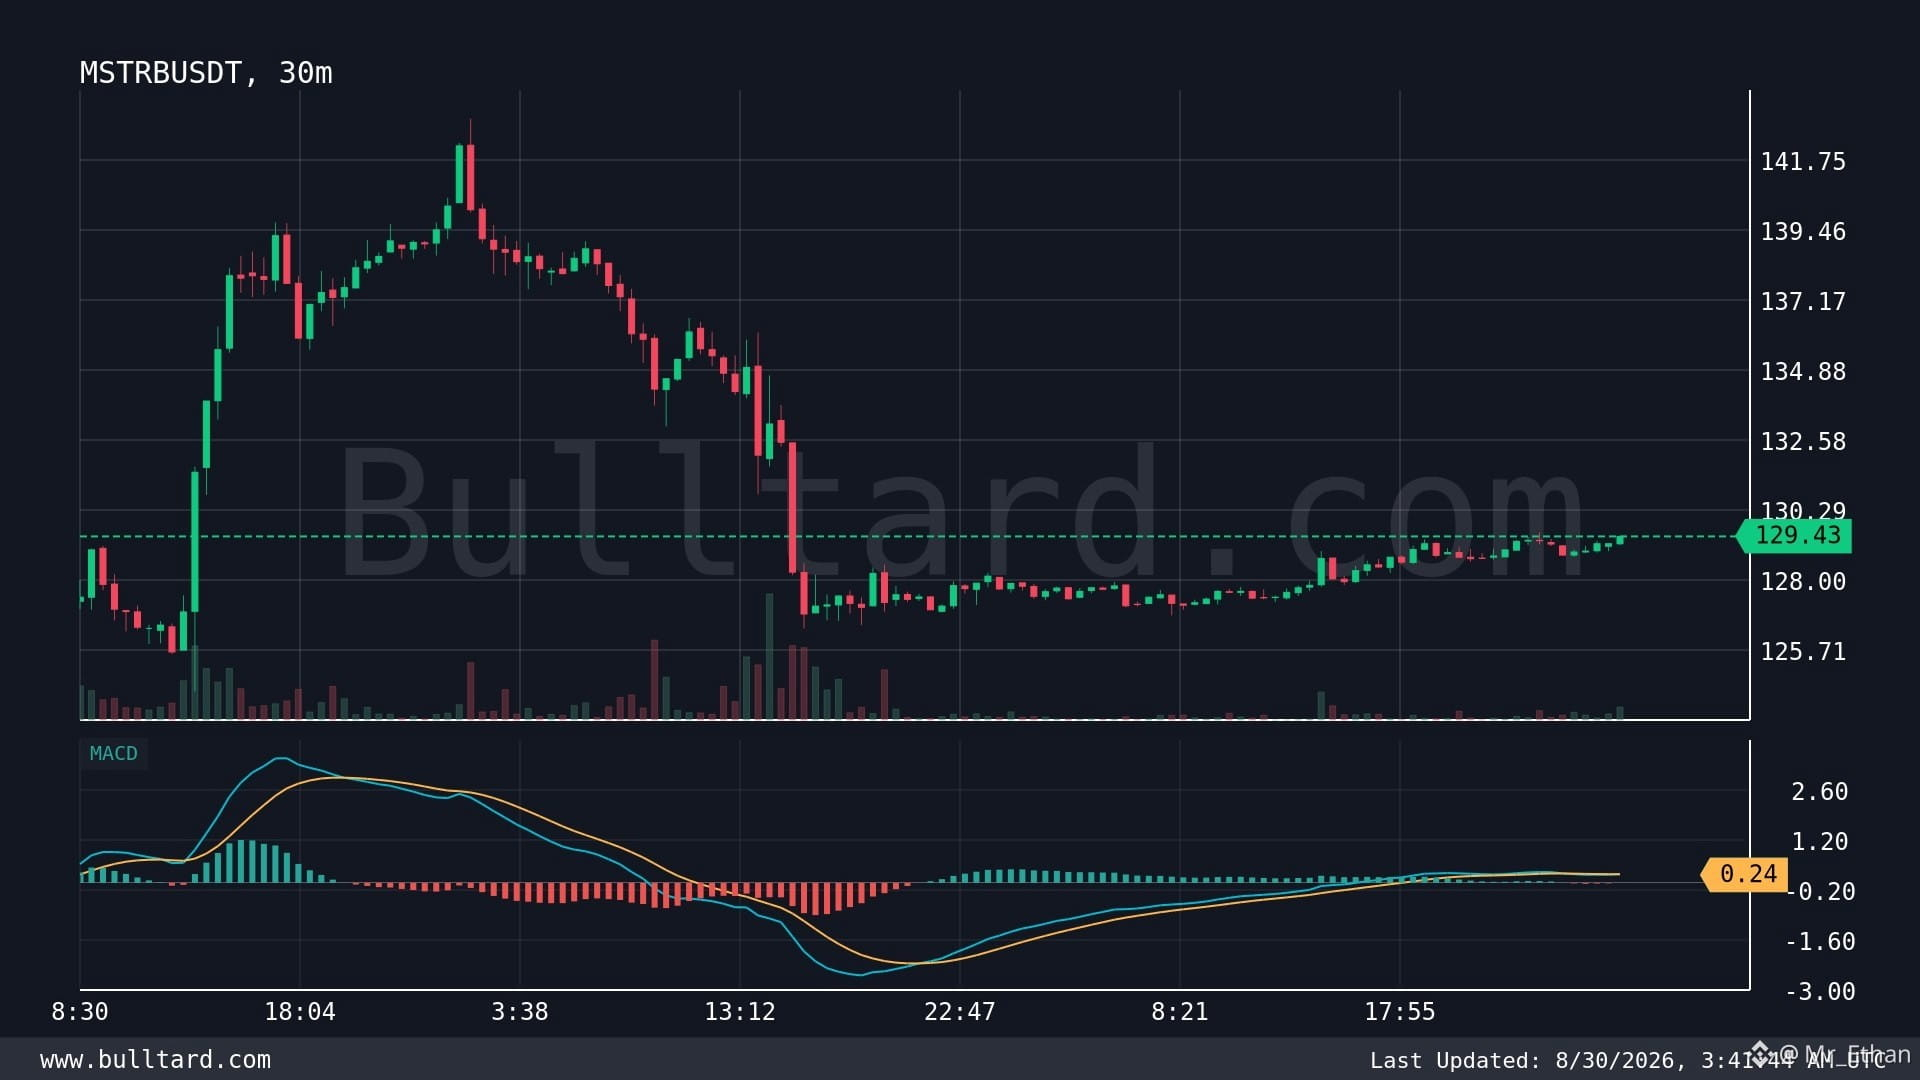
$MSTRB /USDT is showing a bullish MACD crossover on the 30m chart, and I’m watching this one closely.
The price is around $129.43, and for me, the main signal here is momentum starting to turn positive. I’ve seen plenty of MACD crosses fail, so I never treat one as a guaranteed move. I want to see follow-through, stronger volume, and price holding above nearby support.
What I like is that a bullish crossover can sometimes catch the early part of a short-term trend reversal. But the risk is simple: if buyers lose momentum, this signal can quickly turn into a fakeout.
My experience with these setups is that patience matters more than chasing the first green candle. I’m watching how reacts after the crossover rather than assuming the move is already confirmed.
For now, I’m cautiously bullish, but I’ll stay disciplined and manage risk if the setup breaks down.
Do you think can build enough momentum for the next move higher?
$MSTRB
{spot}(MSTRBUSDT)
$FGII.US
{stock_us}(FGII.US)
$MSTRB /USDT is showing a bullish MACD crossover on the 30m chart, and I’m watching this one closely.
The price is around $129.43, and for me, the main signal here is momentum starting to turn positive. I’ve seen plenty of MACD crosses fail, so I never treat one as a guaranteed move. I want to see follow-through, stronger volume, and price holding above nearby support.
What I like is that a bullish crossover can sometimes catch the early part of a short-term trend reversal. But the risk is simple: if buyers lose momentum, this signal can quickly turn into a fakeout.
My experience with these setups is that patience matters more than chasing the first green candle. I’m watching how reacts after the crossover rather than assuming the move is already confirmed.
For now, I’m cautiously bullish, but I’ll stay disciplined and manage risk if the setup breaks down.
Do you think can build enough momentum for the next move higher?
$MSTRB
$FGII.US
The price is around $129.43, and for me, the main signal here is momentum starting to turn positive. I’ve seen plenty of MACD crosses fail, so I never treat one as a guaranteed move. I want to see follow-through, stronger volume, and price holding above nearby support.
What I like is that a bullish crossover can sometimes catch the early part of a short-term trend reversal. But the risk is simple: if buyers lose momentum, this signal can quickly turn into a fakeout.
My experience with these setups is that patience matters more than chasing the first green candle. I’m watching how reacts after the crossover rather than assuming the move is already confirmed.
For now, I’m cautiously bullish, but I’ll stay disciplined and manage risk if the setup breaks down.
Do you think can build enough momentum for the next move higher?
$MSTRB
$FGII.US
MSTRB-6,58%
FGIIUS-0,01%
115
·
--
Падение
$RE is catching my attention right now.
On the 30m chart, I’m seeing a MACD bullish crossover with price around $0.4892. I don’t treat one crossover as a guaranteed pump, but from my experience, these early momentum shifts are worth watching closely, especially when volume starts confirming the move.
For me, the interesting part is how reacts after this signal. If buyers can hold the current area and push through nearby resistance, the setup could develop into a stronger short-term trend. But if volume stays weak, I’d be careful because MACD signals can easily turn into fakeouts during choppy markets.
One thing I’ve learned trading crypto is that entering just because an indicator turns green is usually a mistake. I prefer to wait for confirmation from price action, volume, and market structure.
The strength here is improving momentum. The risk is simple: the crossover can fail quickly if sellers step back in.
I’m watching closely rather than chasing.
Would you trust this bullish crossover, or wait for stronger confirmation?
$RE
{spot}(REUSDT)
$RE is catching my attention right now.
On the 30m chart, I’m seeing a MACD bullish crossover with price around $0.4892. I don’t treat one crossover as a guaranteed pump, but from my experience, these early momentum shifts are worth watching closely, especially when volume starts confirming the move.
For me, the interesting part is how reacts after this signal. If buyers can hold the current area and push through nearby resistance, the setup could develop into a stronger short-term trend. But if volume stays weak, I’d be careful because MACD signals can easily turn into fakeouts during choppy markets.
One thing I’ve learned trading crypto is that entering just because an indicator turns green is usually a mistake. I prefer to wait for confirmation from price action, volume, and market structure.
The strength here is improving momentum. The risk is simple: the crossover can fail quickly if sellers step back in.
I’m watching closely rather than chasing.
Would you trust this bullish crossover, or wait for stronger confirmation?
$RE
On the 30m chart, I’m seeing a MACD bullish crossover with price around $0.4892. I don’t treat one crossover as a guaranteed pump, but from my experience, these early momentum shifts are worth watching closely, especially when volume starts confirming the move.
For me, the interesting part is how reacts after this signal. If buyers can hold the current area and push through nearby resistance, the setup could develop into a stronger short-term trend. But if volume stays weak, I’d be careful because MACD signals can easily turn into fakeouts during choppy markets.
One thing I’ve learned trading crypto is that entering just because an indicator turns green is usually a mistake. I prefer to wait for confirmation from price action, volume, and market structure.
The strength here is improving momentum. The risk is simple: the crossover can fail quickly if sellers step back in.
I’m watching closely rather than chasing.
Would you trust this bullish crossover, or wait for stronger confirmation?
$RE
181
·
--
Рост
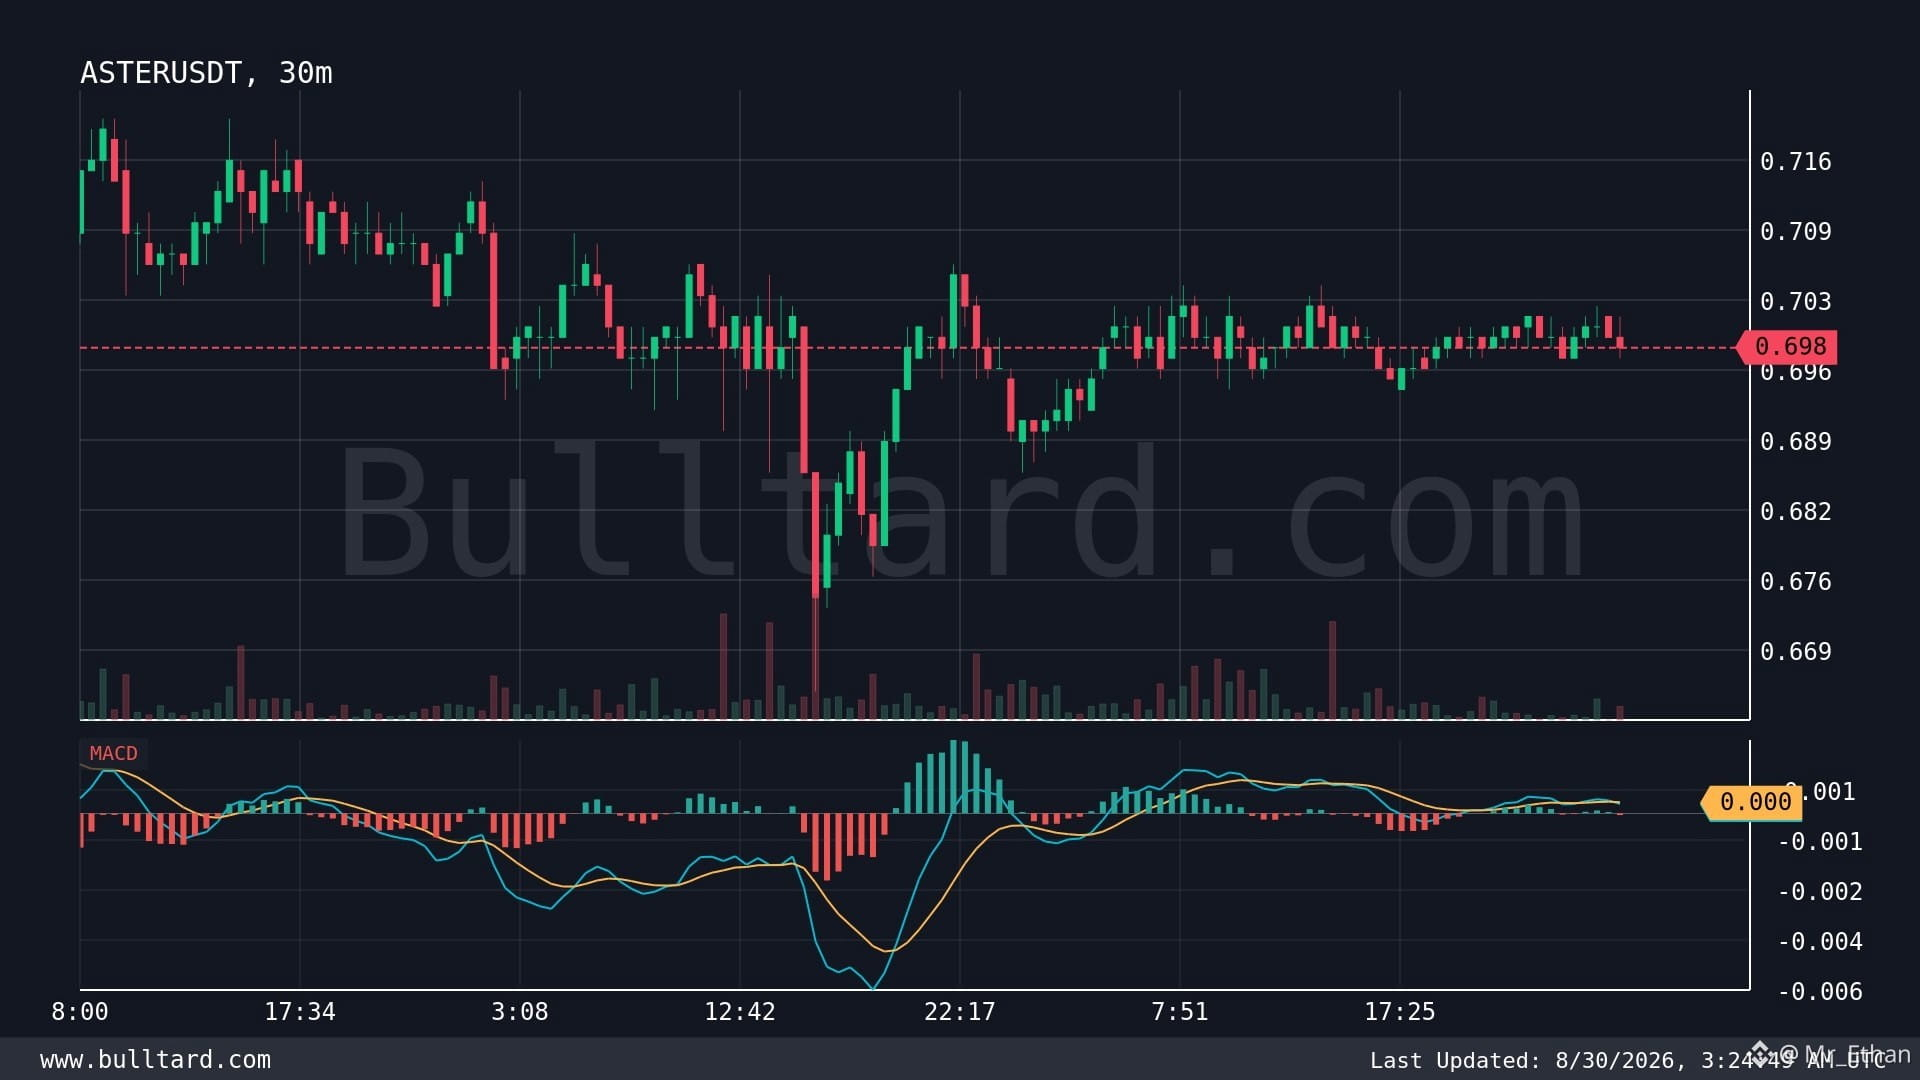
$ASTER /USDT is showing a super bearish MACD crossover on the 30m chart 💀
I’m watching this one carefully because these short-term signals can shift market structure quickly. At around $0.698, my first focus is how price reacts after this bearish momentum appears.
I’ve learned not to chase a candle just because MACD turns bearish. I prefer waiting for confirmation, especially around support. If sellers keep control, ASTER could see more downside pressure. But if buyers reclaim momentum and the MACD starts recovering, this signal can lose strength fast.
ASTER has an interesting place in the crypto market, but like most newer tokens, volatility is a major risk. Liquidity, sentiment, and sudden volume changes can move price aggressively.
For me, the key lesson is simple: MACD is a signal, not a guarantee. I use it with price action, volume, and support/resistance before making a decision.
I’m staying cautious here and watching the next few 30m candles closely.
Would you wait for confirmation or expect more downside from
$ASTER
{spot}(ASTERUSDT)
$BNB
{spot}(BNBUSDT)
$ASTER /USDT is showing a super bearish MACD crossover on the 30m chart 💀
I’m watching this one carefully because these short-term signals can shift market structure quickly. At around $0.698, my first focus is how price reacts after this bearish momentum appears.
I’ve learned not to chase a candle just because MACD turns bearish. I prefer waiting for confirmation, especially around support. If sellers keep control, ASTER could see more downside pressure. But if buyers reclaim momentum and the MACD starts recovering, this signal can lose strength fast.
ASTER has an interesting place in the crypto market, but like most newer tokens, volatility is a major risk. Liquidity, sentiment, and sudden volume changes can move price aggressively.
For me, the key lesson is simple: MACD is a signal, not a guarantee. I use it with price action, volume, and support/resistance before making a decision.
I’m staying cautious here and watching the next few 30m candles closely.
Would you wait for confirmation or expect more downside from
$ASTER
$BNB
I’m watching this one carefully because these short-term signals can shift market structure quickly. At around $0.698, my first focus is how price reacts after this bearish momentum appears.
I’ve learned not to chase a candle just because MACD turns bearish. I prefer waiting for confirmation, especially around support. If sellers keep control, ASTER could see more downside pressure. But if buyers reclaim momentum and the MACD starts recovering, this signal can lose strength fast.
ASTER has an interesting place in the crypto market, but like most newer tokens, volatility is a major risk. Liquidity, sentiment, and sudden volume changes can move price aggressively.
For me, the key lesson is simple: MACD is a signal, not a guarantee. I use it with price action, volume, and support/resistance before making a decision.
I’m staying cautious here and watching the next few 30m candles closely.
Would you wait for confirmation or expect more downside from
$ASTER
$BNB
227
·
--
Падение
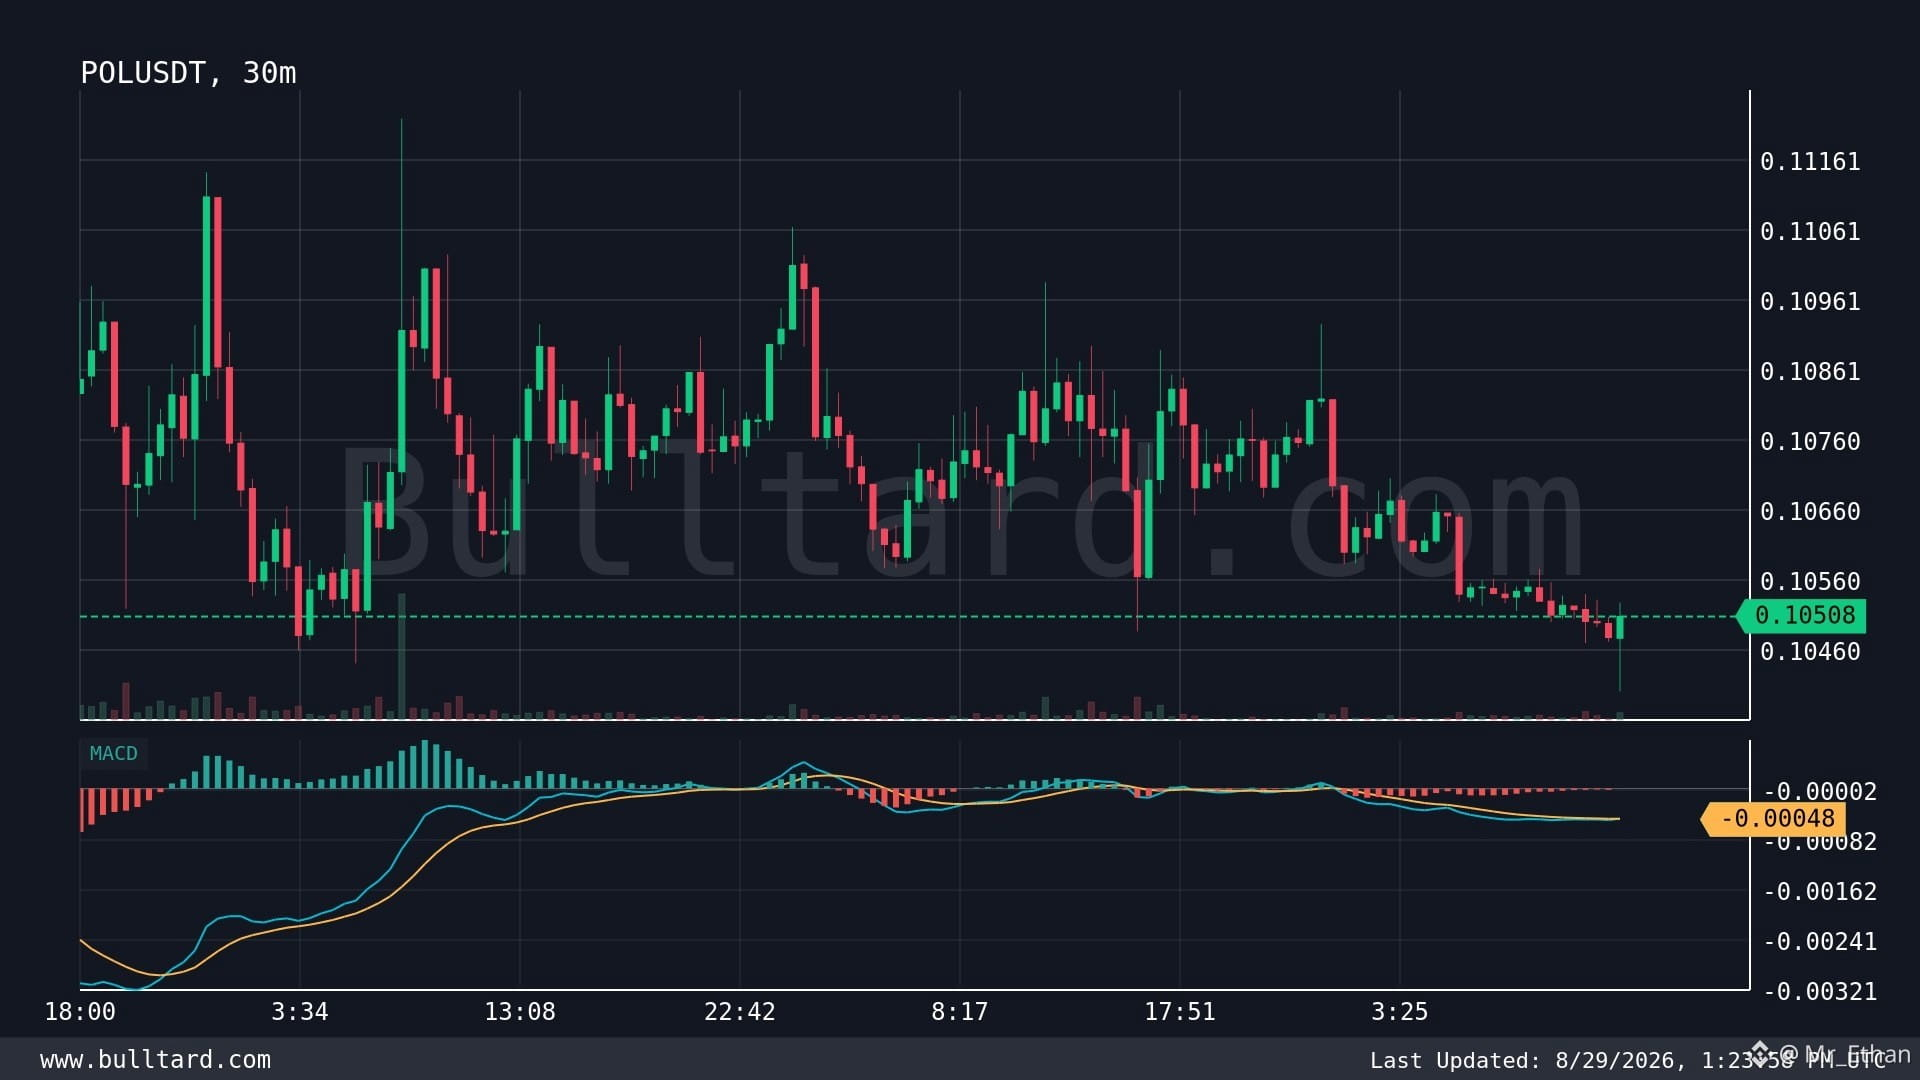
is showing a bullish MACD crossover on the 30m chart, and I’m watching this one closely.
I’ve learned that these short-term signals can be useful for spotting momentum shifts early, but I never treat a single crossover as a guaranteed trade. Right now, POL is around $0.10508, so I’m looking for follow-through from buyers before getting too aggressive.
What I like about Polygon is its focus on scaling Ethereum and making blockchain applications cheaper and easier to use. POL also has a broader role in Polygon’s evolving ecosystem, which gives the token a stronger utility story than pure speculation.
Still, I’m keeping the risks in mind. The 30m timeframe can produce plenty of fake signals, especially when overall market liquidity is weak. Bitcoin’s direction can also quickly change the setup.
One lesson I’ve learned from trading these crossovers: confirmation matters more than excitement. I’d rather enter a little late with stronger momentum than chase the first green candle.
I’m watching volume and price structure next.
Would you take this bullish crossover as an early entry, or wait for confirmation?$POL
#USShortTermTreasuryYieldsJump
{spot}(POLUSDT)
is showing a bullish MACD crossover on the 30m chart, and I’m watching this one closely.
I’ve learned that these short-term signals can be useful for spotting momentum shifts early, but I never treat a single crossover as a guaranteed trade. Right now, POL is around $0.10508, so I’m looking for follow-through from buyers before getting too aggressive.
What I like about Polygon is its focus on scaling Ethereum and making blockchain applications cheaper and easier to use. POL also has a broader role in Polygon’s evolving ecosystem, which gives the token a stronger utility story than pure speculation.
Still, I’m keeping the risks in mind. The 30m timeframe can produce plenty of fake signals, especially when overall market liquidity is weak. Bitcoin’s direction can also quickly change the setup.
One lesson I’ve learned from trading these crossovers: confirmation matters more than excitement. I’d rather enter a little late with stronger momentum than chase the first green candle.
I’m watching volume and price structure next.
Would you take this bullish crossover as an early entry, or wait for confirmation?$POL
#USShortTermTreasuryYieldsJump
I’ve learned that these short-term signals can be useful for spotting momentum shifts early, but I never treat a single crossover as a guaranteed trade. Right now, POL is around $0.10508, so I’m looking for follow-through from buyers before getting too aggressive.
What I like about Polygon is its focus on scaling Ethereum and making blockchain applications cheaper and easier to use. POL also has a broader role in Polygon’s evolving ecosystem, which gives the token a stronger utility story than pure speculation.
Still, I’m keeping the risks in mind. The 30m timeframe can produce plenty of fake signals, especially when overall market liquidity is weak. Bitcoin’s direction can also quickly change the setup.
One lesson I’ve learned from trading these crossovers: confirmation matters more than excitement. I’d rather enter a little late with stronger momentum than chase the first green candle.
I’m watching volume and price structure next.
Would you take this bullish crossover as an early entry, or wait for confirmation?$POL
#USShortTermTreasuryYieldsJump
146
·
--
is starting to catch my attention again. 🔥
I’m watching the 30m chart closely because the MACD has printed a super bullish crossover around 0.03141. From my experience, these signals can be useful for spotting a shift in short-term momentum, especially after a long period of weakness.
What matters here is not just the crossover. ETH/BTC shows how Ethereum is performing relative to Bitcoin. When this pair starts moving higher, it can signal that capital is becoming more comfortable rotating toward ETH and the broader altcoin market.
I like Ethereum’s strength in DeFi, stablecoins, L2s, and smart-contract activity. But I’m also careful. MACD signals can fail quickly, and BTC strength can easily pull this ratio back down.
One lesson I’ve learned is never to trade a crossover blindly. I want confirmation from price structure, volume, and support holding.
For now, I’m watching 0.03141 closely.
Do you think ETH is finally ready to outperform BTC again?$ETH
{spot}(ETHUSDT)
$BTC
{spot}(BTCUSDT)
$SOL
{spot}(SOLUSDT)
is starting to catch my attention again. 🔥
I’m watching the 30m chart closely because the MACD has printed a super bullish crossover around 0.03141. From my experience, these signals can be useful for spotting a shift in short-term momentum, especially after a long period of weakness.
What matters here is not just the crossover. ETH/BTC shows how Ethereum is performing relative to Bitcoin. When this pair starts moving higher, it can signal that capital is becoming more comfortable rotating toward ETH and the broader altcoin market.
I like Ethereum’s strength in DeFi, stablecoins, L2s, and smart-contract activity. But I’m also careful. MACD signals can fail quickly, and BTC strength can easily pull this ratio back down.
One lesson I’ve learned is never to trade a crossover blindly. I want confirmation from price structure, volume, and support holding.
For now, I’m watching 0.03141 closely.
Do you think ETH is finally ready to outperform BTC again?$ETH
$BTC
$SOL
I’m watching the 30m chart closely because the MACD has printed a super bullish crossover around 0.03141. From my experience, these signals can be useful for spotting a shift in short-term momentum, especially after a long period of weakness.
What matters here is not just the crossover. ETH/BTC shows how Ethereum is performing relative to Bitcoin. When this pair starts moving higher, it can signal that capital is becoming more comfortable rotating toward ETH and the broader altcoin market.
I like Ethereum’s strength in DeFi, stablecoins, L2s, and smart-contract activity. But I’m also careful. MACD signals can fail quickly, and BTC strength can easily pull this ratio back down.
One lesson I’ve learned is never to trade a crossover blindly. I want confirmation from price structure, volume, and support holding.
For now, I’m watching 0.03141 closely.
Do you think ETH is finally ready to outperform BTC again?$ETH
$BTC
$SOL
127
·
--
: Watching the 4H Momentum Shift
I’m watching closely after the 4H MACD printed a bullish crossover. Price is around $0.3219, and for me, this is more interesting than a simple green signal.
I’ve seen many MACD crossovers fail when volume doesn’t follow, so I’m not treating this as a guaranteed breakout. I want to see buyers defend the current area and build higher highs before getting too aggressive.
KAITO stands out because it sits in the AI + crypto narrative, where attention, data, and community activity are becoming valuable on-chain resources. That gives the project a strong narrative, but narrative alone isn’t enough. Token unlocks, selling pressure, weak volume, and broader market weakness can quickly ruin a setup.
My biggest lesson from trading these signals is simple: MACD tells me momentum may be changing, not where price must go next. I use it as confirmation alongside structure and volume.
I’m watching $0.3219 closely now.
Do you think KAITO can turn this 4H momentum into a sustained move?$KAITO
{spot}(KAITOUSDT)
$FF
{spot}(FFUSDT)
$AT
{spot}(ATUSDT)
: Watching the 4H Momentum Shift
I’m watching closely after the 4H MACD printed a bullish crossover. Price is around $0.3219, and for me, this is more interesting than a simple green signal.
I’ve seen many MACD crossovers fail when volume doesn’t follow, so I’m not treating this as a guaranteed breakout. I want to see buyers defend the current area and build higher highs before getting too aggressive.
KAITO stands out because it sits in the AI + crypto narrative, where attention, data, and community activity are becoming valuable on-chain resources. That gives the project a strong narrative, but narrative alone isn’t enough. Token unlocks, selling pressure, weak volume, and broader market weakness can quickly ruin a setup.
My biggest lesson from trading these signals is simple: MACD tells me momentum may be changing, not where price must go next. I use it as confirmation alongside structure and volume.
I’m watching $0.3219 closely now.
Do you think KAITO can turn this 4H momentum into a sustained move?$KAITO
$FF
$AT
I’m watching closely after the 4H MACD printed a bullish crossover. Price is around $0.3219, and for me, this is more interesting than a simple green signal.
I’ve seen many MACD crossovers fail when volume doesn’t follow, so I’m not treating this as a guaranteed breakout. I want to see buyers defend the current area and build higher highs before getting too aggressive.
KAITO stands out because it sits in the AI + crypto narrative, where attention, data, and community activity are becoming valuable on-chain resources. That gives the project a strong narrative, but narrative alone isn’t enough. Token unlocks, selling pressure, weak volume, and broader market weakness can quickly ruin a setup.
My biggest lesson from trading these signals is simple: MACD tells me momentum may be changing, not where price must go next. I use it as confirmation alongside structure and volume.
I’m watching $0.3219 closely now.
Do you think KAITO can turn this 4H momentum into a sustained move?$KAITO
$FF
$AT
1
714
·
--
is giving me a bearish signal on the 30m chart.
The MACD has crossed bearish, with price around $164.77. From my experience, I don’t treat one crossover as a guaranteed dump. I use it as a warning that momentum is losing strength, especially after a strong move.
What I’m watching now is how price reacts around the recent support zone. If sellers keep control and support breaks, downside pressure can build quickly. But if buyers reclaim momentum and the MACD turns back up, this bearish setup can fail.
One strength here is that MACD can help me spot momentum shifts before the move becomes obvious. The weakness is that on 30m charts, false signals happen often during choppy markets.
My biggest lesson from trading these setups is simple: I’d rather wait for confirmation than chase the first candle after a crossover.
I’m watching volume, support, and the next MACD candles closely.
Would you trade the bearish momentum or wait for confirmation?$SKHYB
{spot}(SKHYBUSDT)
{future}(SKHYUSDT)
is giving me a bearish signal on the 30m chart.
The MACD has crossed bearish, with price around $164.77. From my experience, I don’t treat one crossover as a guaranteed dump. I use it as a warning that momentum is losing strength, especially after a strong move.
What I’m watching now is how price reacts around the recent support zone. If sellers keep control and support breaks, downside pressure can build quickly. But if buyers reclaim momentum and the MACD turns back up, this bearish setup can fail.
One strength here is that MACD can help me spot momentum shifts before the move becomes obvious. The weakness is that on 30m charts, false signals happen often during choppy markets.
My biggest lesson from trading these setups is simple: I’d rather wait for confirmation than chase the first candle after a crossover.
I’m watching volume, support, and the next MACD candles closely.
Would you trade the bearish momentum or wait for confirmation?$SKHYB
The MACD has crossed bearish, with price around $164.77. From my experience, I don’t treat one crossover as a guaranteed dump. I use it as a warning that momentum is losing strength, especially after a strong move.
What I’m watching now is how price reacts around the recent support zone. If sellers keep control and support breaks, downside pressure can build quickly. But if buyers reclaim momentum and the MACD turns back up, this bearish setup can fail.
One strength here is that MACD can help me spot momentum shifts before the move becomes obvious. The weakness is that on 30m charts, false signals happen often during choppy markets.
My biggest lesson from trading these setups is simple: I’d rather wait for confirmation than chase the first candle after a crossover.
I’m watching volume, support, and the next MACD candles closely.
Would you trade the bearish momentum or wait for confirmation?$SKHYB
1
141
·
--
Рост
When Shorts Get Trapped
I’m watching after seeing a $1.8329K short liquidation around $0.05957. For me, this is less about the liquidation size and more about the reaction around that price.
I’ve seen this pattern many times in smaller crypto assets. When shorts build up too aggressively, even a small upward move can force positions to close, creating extra buying pressure. That can make the chart move faster than traders expect.
What I like about is the attention it can attract when volatility increases. But I’m also careful here. Smaller tokens can have thinner liquidity, sharp wicks, and fast reversals. A liquidation event alone doesn’t prove a trend has changed.
My experience taught me one thing: I never chase a candle just because liquidations appear. I wait for volume, structure, and confirmation before taking a position.
For now, $0.05957 is a level I’m watching closely. If buyers hold above it, momentum could stay interesting. If price loses it quickly, the liquidation may simply become a temporary spike.
How are you reading here?$TUT
{spot}(TUTUSDT)
$TRB
{spot}(TRBUSDT)
$WLD
{spot}(WLDUSDT)
When Shorts Get Trapped
I’m watching after seeing a $1.8329K short liquidation around $0.05957. For me, this is less about the liquidation size and more about the reaction around that price.
I’ve seen this pattern many times in smaller crypto assets. When shorts build up too aggressively, even a small upward move can force positions to close, creating extra buying pressure. That can make the chart move faster than traders expect.
What I like about is the attention it can attract when volatility increases. But I’m also careful here. Smaller tokens can have thinner liquidity, sharp wicks, and fast reversals. A liquidation event alone doesn’t prove a trend has changed.
My experience taught me one thing: I never chase a candle just because liquidations appear. I wait for volume, structure, and confirmation before taking a position.
For now, $0.05957 is a level I’m watching closely. If buyers hold above it, momentum could stay interesting. If price loses it quickly, the liquidation may simply become a temporary spike.
How are you reading here?$TUT
$TRB
$WLD
I’m watching after seeing a $1.8329K short liquidation around $0.05957. For me, this is less about the liquidation size and more about the reaction around that price.
I’ve seen this pattern many times in smaller crypto assets. When shorts build up too aggressively, even a small upward move can force positions to close, creating extra buying pressure. That can make the chart move faster than traders expect.
What I like about is the attention it can attract when volatility increases. But I’m also careful here. Smaller tokens can have thinner liquidity, sharp wicks, and fast reversals. A liquidation event alone doesn’t prove a trend has changed.
My experience taught me one thing: I never chase a candle just because liquidations appear. I wait for volume, structure, and confirmation before taking a position.
For now, $0.05957 is a level I’m watching closely. If buyers hold above it, momentum could stay interesting. If price loses it quickly, the liquidation may simply become a temporary spike.
How are you reading here?$TUT
$TRB
$WLD
267
·
--
#dusk @Dusk_Foundation $DUSK #dusk @Dusk_Foundation
Privacy in crypto is starting to look less like a luxury and more like basic infrastructure.
I’ve watched many privacy projects gain attention during hype cycles, but Dusk Network stands out to me because it is focused on financial applications, not just private transactions.
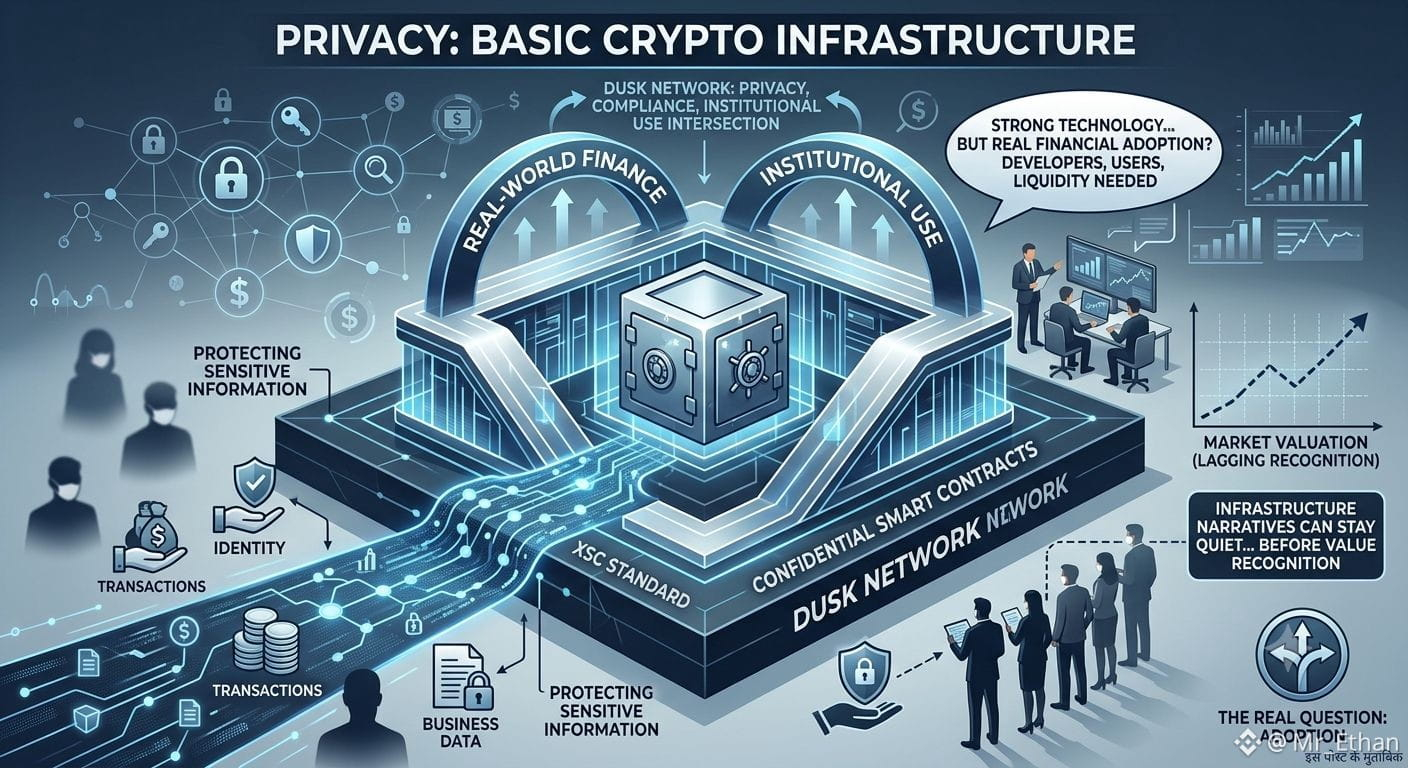
Dusk is a Layer-1 built around confidential smart contracts and its Confidential Security Contract (XSC) standard. In simple terms, it aims to let financial institutions use blockchain while keeping sensitive information protected.
That’s a strong idea. Real-world finance needs privacy around identities, transactions, and business data. Dusk is trying to solve that without giving up the benefits of programmable blockchain infrastructure.
But I’m not blindly bullish. Adoption is the biggest question. Competing privacy and compliance-focused networks are also improving, and strong technology means little without developers, users, liquidity, and real business activity.
One lesson I’ve learned from crypto is that infrastructure narratives can stay quiet for a long time before the market recognizes their value.
For me, Dusk is interesting because it sits at the intersection of privacy, compliance, and institutional blockchain use.
The real question is: can Dusk turn strong technology into real financial adoption?
{spot}(DUSKUSDT)
$BMT
{spot}(BMTUSDT)
$PORTAL
{spot}(PORTALUSDT)
#dusk @Dusk $DUSK #dusk @Dusk
Privacy in crypto is starting to look less like a luxury and more like basic infrastructure.
I’ve watched many privacy projects gain attention during hype cycles, but Dusk Network stands out to me because it is focused on financial applications, not just private transactions.
Dusk is a Layer-1 built around confidential smart contracts and its Confidential Security Contract (XSC) standard. In simple terms, it aims to let financial institutions use blockchain while keeping sensitive information protected.
That’s a strong idea. Real-world finance needs privacy around identities, transactions, and business data. Dusk is trying to solve that without giving up the benefits of programmable blockchain infrastructure.
But I’m not blindly bullish. Adoption is the biggest question. Competing privacy and compliance-focused networks are also improving, and strong technology means little without developers, users, liquidity, and real business activity.
One lesson I’ve learned from crypto is that infrastructure narratives can stay quiet for a long time before the market recognizes their value.
For me, Dusk is interesting because it sits at the intersection of privacy, compliance, and institutional blockchain use.
The real question is: can Dusk turn strong technology into real financial adoption?
$BMT
$PORTAL
Privacy in crypto is starting to look less like a luxury and more like basic infrastructure.
I’ve watched many privacy projects gain attention during hype cycles, but Dusk Network stands out to me because it is focused on financial applications, not just private transactions.
Dusk is a Layer-1 built around confidential smart contracts and its Confidential Security Contract (XSC) standard. In simple terms, it aims to let financial institutions use blockchain while keeping sensitive information protected.
That’s a strong idea. Real-world finance needs privacy around identities, transactions, and business data. Dusk is trying to solve that without giving up the benefits of programmable blockchain infrastructure.
But I’m not blindly bullish. Adoption is the biggest question. Competing privacy and compliance-focused networks are also improving, and strong technology means little without developers, users, liquidity, and real business activity.
One lesson I’ve learned from crypto is that infrastructure narratives can stay quiet for a long time before the market recognizes their value.
For me, Dusk is interesting because it sits at the intersection of privacy, compliance, and institutional blockchain use.
The real question is: can Dusk turn strong technology into real financial adoption?
$BMT
$PORTAL

4
3
129
·
--
has caught my attention because liquidation data often tells me more than a simple price move.
I’ve learned that when shorts get liquidated, it can create quick buying pressure, but I don’t treat that as an automatic signal to chase. For me, the real question is whether LAB can hold the move after the forced positions are cleared.
What I like is the opportunity created by volatility. Strong momentum can attract traders, liquidity, and fresh attention very quickly. But the weakness is obvious too: smaller tokens can move sharply in both directions, and thin liquidity can turn a good setup into a bad entry.
I’m watching support closely and looking for confirmation through volume and price structure. If LAB holds higher lows after this move, I’d take that more seriously than one sudden spike.
My biggest lesson from crypto is simple: liquidation is information, not confirmation. I’d rather miss part of a move than enter blindly after a squeeze.
I’m keeping LAB on my watchlist and waiting for the market to show its hand.
Would you trade the momentum here, or wait for a cleaner setup?
$LAB
{future}(LABUSDT)
$MMT
{spot}(MMTUSDT)
$RE
{spot}(REUSDT)
has caught my attention because liquidation data often tells me more than a simple price move.
I’ve learned that when shorts get liquidated, it can create quick buying pressure, but I don’t treat that as an automatic signal to chase. For me, the real question is whether LAB can hold the move after the forced positions are cleared.
What I like is the opportunity created by volatility. Strong momentum can attract traders, liquidity, and fresh attention very quickly. But the weakness is obvious too: smaller tokens can move sharply in both directions, and thin liquidity can turn a good setup into a bad entry.
I’m watching support closely and looking for confirmation through volume and price structure. If LAB holds higher lows after this move, I’d take that more seriously than one sudden spike.
My biggest lesson from crypto is simple: liquidation is information, not confirmation. I’d rather miss part of a move than enter blindly after a squeeze.
I’m keeping LAB on my watchlist and waiting for the market to show its hand.
Would you trade the momentum here, or wait for a cleaner setup?
$LAB
$MMT
$RE
I’ve learned that when shorts get liquidated, it can create quick buying pressure, but I don’t treat that as an automatic signal to chase. For me, the real question is whether LAB can hold the move after the forced positions are cleared.
What I like is the opportunity created by volatility. Strong momentum can attract traders, liquidity, and fresh attention very quickly. But the weakness is obvious too: smaller tokens can move sharply in both directions, and thin liquidity can turn a good setup into a bad entry.
I’m watching support closely and looking for confirmation through volume and price structure. If LAB holds higher lows after this move, I’d take that more seriously than one sudden spike.
My biggest lesson from crypto is simple: liquidation is information, not confirmation. I’d rather miss part of a move than enter blindly after a squeeze.
I’m keeping LAB on my watchlist and waiting for the market to show its hand.
Would you trade the momentum here, or wait for a cleaner setup?
$LAB
$MMT
$RE
1
476
·
--
Рост
is showing a small shift in momentum, and I’m watching it closely.
The 30m MACD has just printed a bullish crossover around $0.001613. From my experience, I don’t treat a crossover alone as a buy signal. I want to see price follow through, volume improve, and the next candles hold above the breakout area.
TLM has always been an interesting Web3 gaming token because Alien Worlds focuses on virtual economies, player activity, and on-chain ownership. That gives it more utility than a token driven only by speculation. Still, gaming tokens can be highly volatile, and liquidity can disappear quickly when market sentiment turns weak.
For me, the key strength here is momentum combined with ecosystem utility. The weakness is that MACD signals can easily become fakeouts during sideways markets.
I’ve learned that the best trades usually come from confirmation, not anticipation. If TLM holds above $0.00160 and buyers step in, I’d become more interested in the upside.
I’m curious: do you see this MACD crossover as the start of a stronger TLM move, or just another short-term bounce?
$BMT
{spot}(BMTUSDT)
$BTR
{future}(BTRUSDT)
$TLM
{spot}(TLMUSDT)
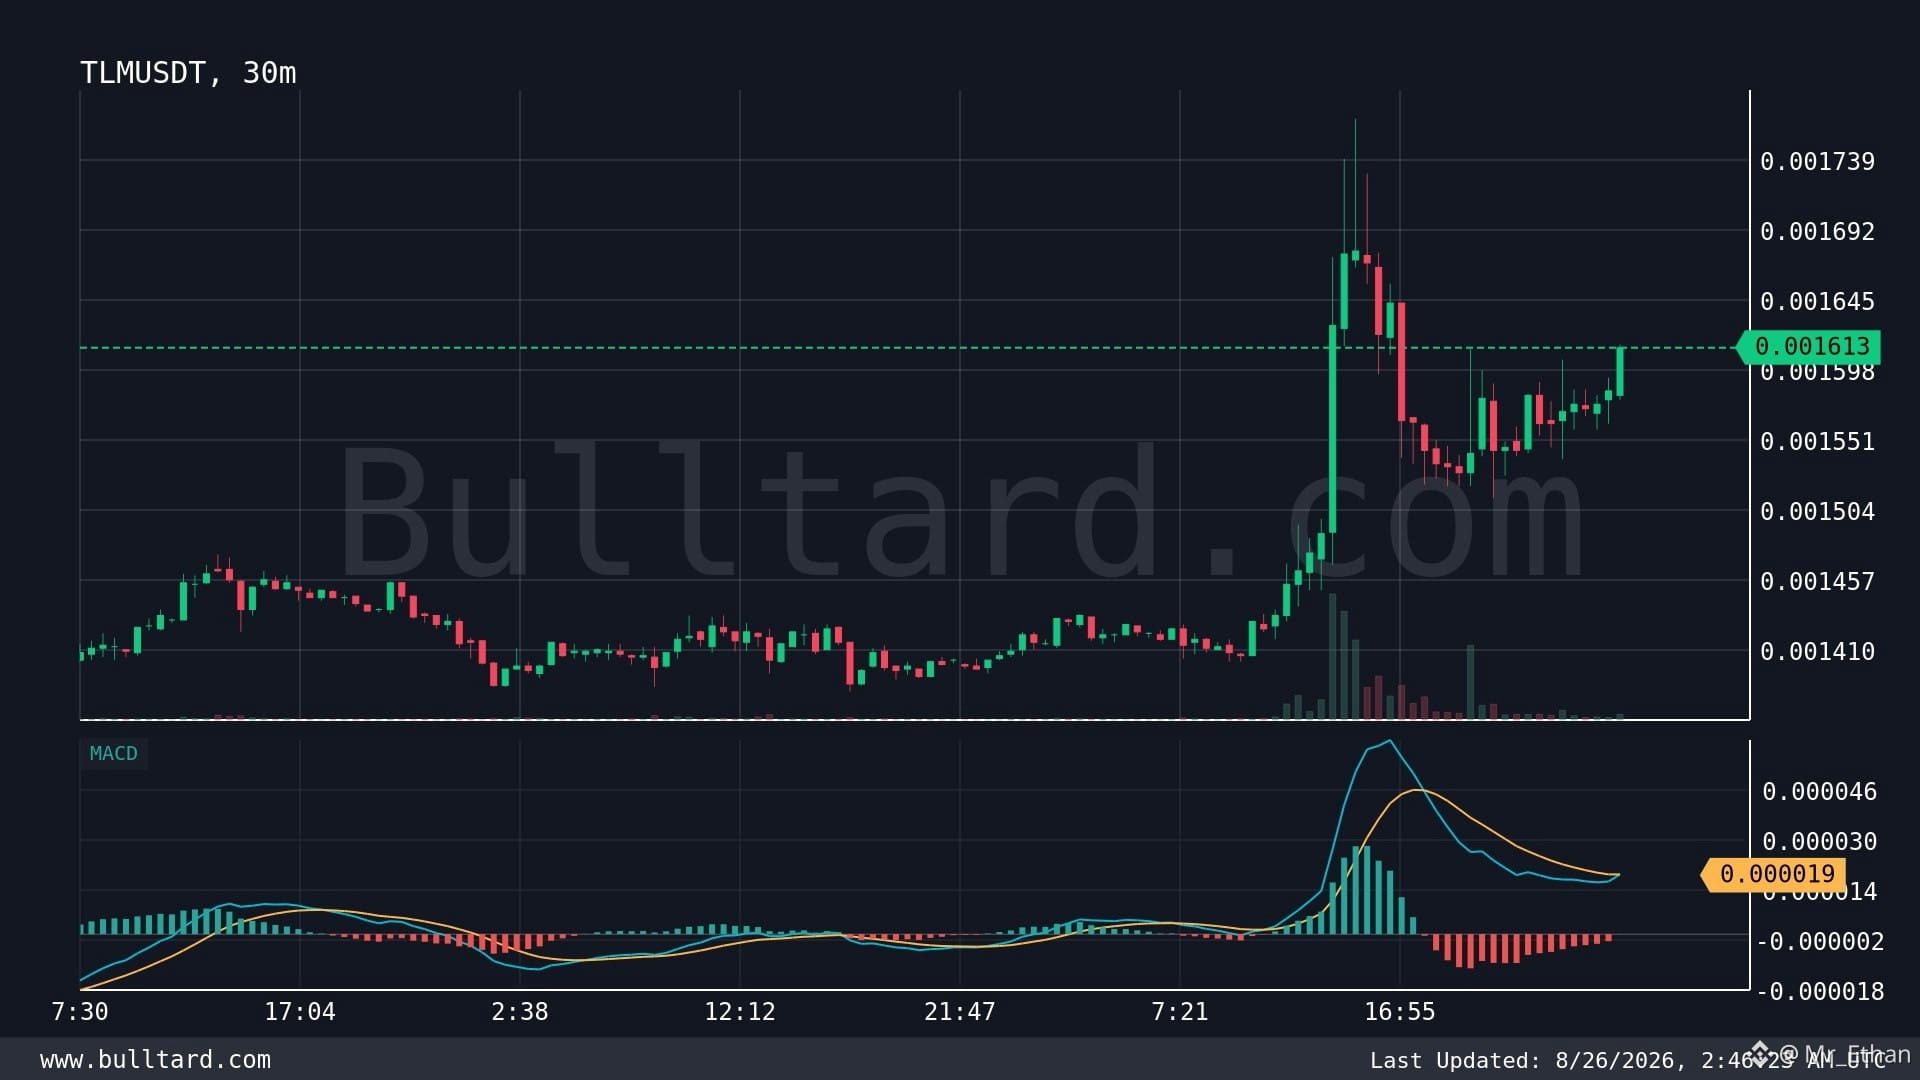
is showing a small shift in momentum, and I’m watching it closely.
The 30m MACD has just printed a bullish crossover around $0.001613. From my experience, I don’t treat a crossover alone as a buy signal. I want to see price follow through, volume improve, and the next candles hold above the breakout area.
TLM has always been an interesting Web3 gaming token because Alien Worlds focuses on virtual economies, player activity, and on-chain ownership. That gives it more utility than a token driven only by speculation. Still, gaming tokens can be highly volatile, and liquidity can disappear quickly when market sentiment turns weak.
For me, the key strength here is momentum combined with ecosystem utility. The weakness is that MACD signals can easily become fakeouts during sideways markets.
I’ve learned that the best trades usually come from confirmation, not anticipation. If TLM holds above $0.00160 and buyers step in, I’d become more interested in the upside.
I’m curious: do you see this MACD crossover as the start of a stronger TLM move, or just another short-term bounce?
$BMT
$BTR
$TLM
The 30m MACD has just printed a bullish crossover around $0.001613. From my experience, I don’t treat a crossover alone as a buy signal. I want to see price follow through, volume improve, and the next candles hold above the breakout area.
TLM has always been an interesting Web3 gaming token because Alien Worlds focuses on virtual economies, player activity, and on-chain ownership. That gives it more utility than a token driven only by speculation. Still, gaming tokens can be highly volatile, and liquidity can disappear quickly when market sentiment turns weak.
For me, the key strength here is momentum combined with ecosystem utility. The weakness is that MACD signals can easily become fakeouts during sideways markets.
I’ve learned that the best trades usually come from confirmation, not anticipation. If TLM holds above $0.00160 and buyers step in, I’d become more interested in the upside.
I’m curious: do you see this MACD crossover as the start of a stronger TLM move, or just another short-term bounce?
$BMT
$BTR
$TLM
303
·
--
Падение
Dusk is one of those projects I keep watching because privacy is slowly becoming a bigger part of the blockchain conversation.
I’ve seen many privacy narratives come and go, but Dusk Network feels more focused on a real problem: bringing confidential transactions and smart contracts into financial markets. Its Layer-1 is built around the Confidential Security Contract (XSC) standard, giving applications a way to work with sensitive data without exposing everything publicly.
What I like most is the financial angle. Institutions need privacy, compliance, and controlled data access. Dusk is trying to combine those needs with blockchain infrastructure.
But I’m not ignoring the risks. Adoption is still the biggest question. Strong technology means little if developers, institutions, and users don’t actually build on it. Competition from other privacy-focused chains is another challenge.
My biggest lesson from crypto is simple: I don’t invest only because a narrative sounds good. I watch usage, liquidity, development, and market behavior.
For me, DUSK is interesting because privacy could become infrastructure, not just a trading narrative.
Do you think confidential blockchain infrastructure will become essential for the next wave of financial adoption?
$TAC $PROM $DUSK
#dusk @Dusk_Foundation
{future}(TUTUSDT)
{future}(PROMUSDT)
{future}(TACUSDT)
Dusk is one of those projects I keep watching because privacy is slowly becoming a bigger part of the blockchain conversation.
I’ve seen many privacy narratives come and go, but Dusk Network feels more focused on a real problem: bringing confidential transactions and smart contracts into financial markets. Its Layer-1 is built around the Confidential Security Contract (XSC) standard, giving applications a way to work with sensitive data without exposing everything publicly.
What I like most is the financial angle. Institutions need privacy, compliance, and controlled data access. Dusk is trying to combine those needs with blockchain infrastructure.
But I’m not ignoring the risks. Adoption is still the biggest question. Strong technology means little if developers, institutions, and users don’t actually build on it. Competition from other privacy-focused chains is another challenge.
My biggest lesson from crypto is simple: I don’t invest only because a narrative sounds good. I watch usage, liquidity, development, and market behavior.
For me, DUSK is interesting because privacy could become infrastructure, not just a trading narrative.
Do you think confidential blockchain infrastructure will become essential for the next wave of financial adoption?
$TAC $PROM $DUSK
#dusk @Dusk
I’ve seen many privacy narratives come and go, but Dusk Network feels more focused on a real problem: bringing confidential transactions and smart contracts into financial markets. Its Layer-1 is built around the Confidential Security Contract (XSC) standard, giving applications a way to work with sensitive data without exposing everything publicly.
What I like most is the financial angle. Institutions need privacy, compliance, and controlled data access. Dusk is trying to combine those needs with blockchain infrastructure.
But I’m not ignoring the risks. Adoption is still the biggest question. Strong technology means little if developers, institutions, and users don’t actually build on it. Competition from other privacy-focused chains is another challenge.
My biggest lesson from crypto is simple: I don’t invest only because a narrative sounds good. I watch usage, liquidity, development, and market behavior.
For me, DUSK is interesting because privacy could become infrastructure, not just a trading narrative.
Do you think confidential blockchain infrastructure will become essential for the next wave of financial adoption?
$TAC $PROM $DUSK
#dusk @Dusk
✅ $TAC
100%
👆 $PROM
0%
💚 $LAB
0%
2 проголосовали • Голосование закрыто
137
·
--
Рост
is showing me why strong projects still need careful entries.
I’ve been watching Aerodrome closely, and I like what it brings to the Base ecosystem. It’s not just another token. Aerodrome is built around trading and liquidity, helping users swap assets while liquidity providers earn incentives.
What I like most is its connection to Base and the growing demand for on-chain liquidity. Compared with many smaller DEX tokens, has a clearer role inside an active ecosystem. That gives it a stronger fundamental story in my view.
But I’m not ignoring the risks. DeFi competition is intense, token emissions can create selling pressure, and can still move heavily with broader market sentiment. When liquidity dries up, even good setups can fail quickly.
I’ve learned from trading these cycles that fundamentals matter, but timing matters too. A strong project bought at the wrong moment can still hurt the portfolio.
I’m watching momentum, liquidity, and user activity rather than chasing every green candle.
Would you hold for the ecosystem growth, or wait for a better entry?
$AERO #aero @aero
{spot}(AEROUSDT)
$TUT
{spot}(TUTUSDT)
$TURTLE
{spot}(TURTLEUSDT)
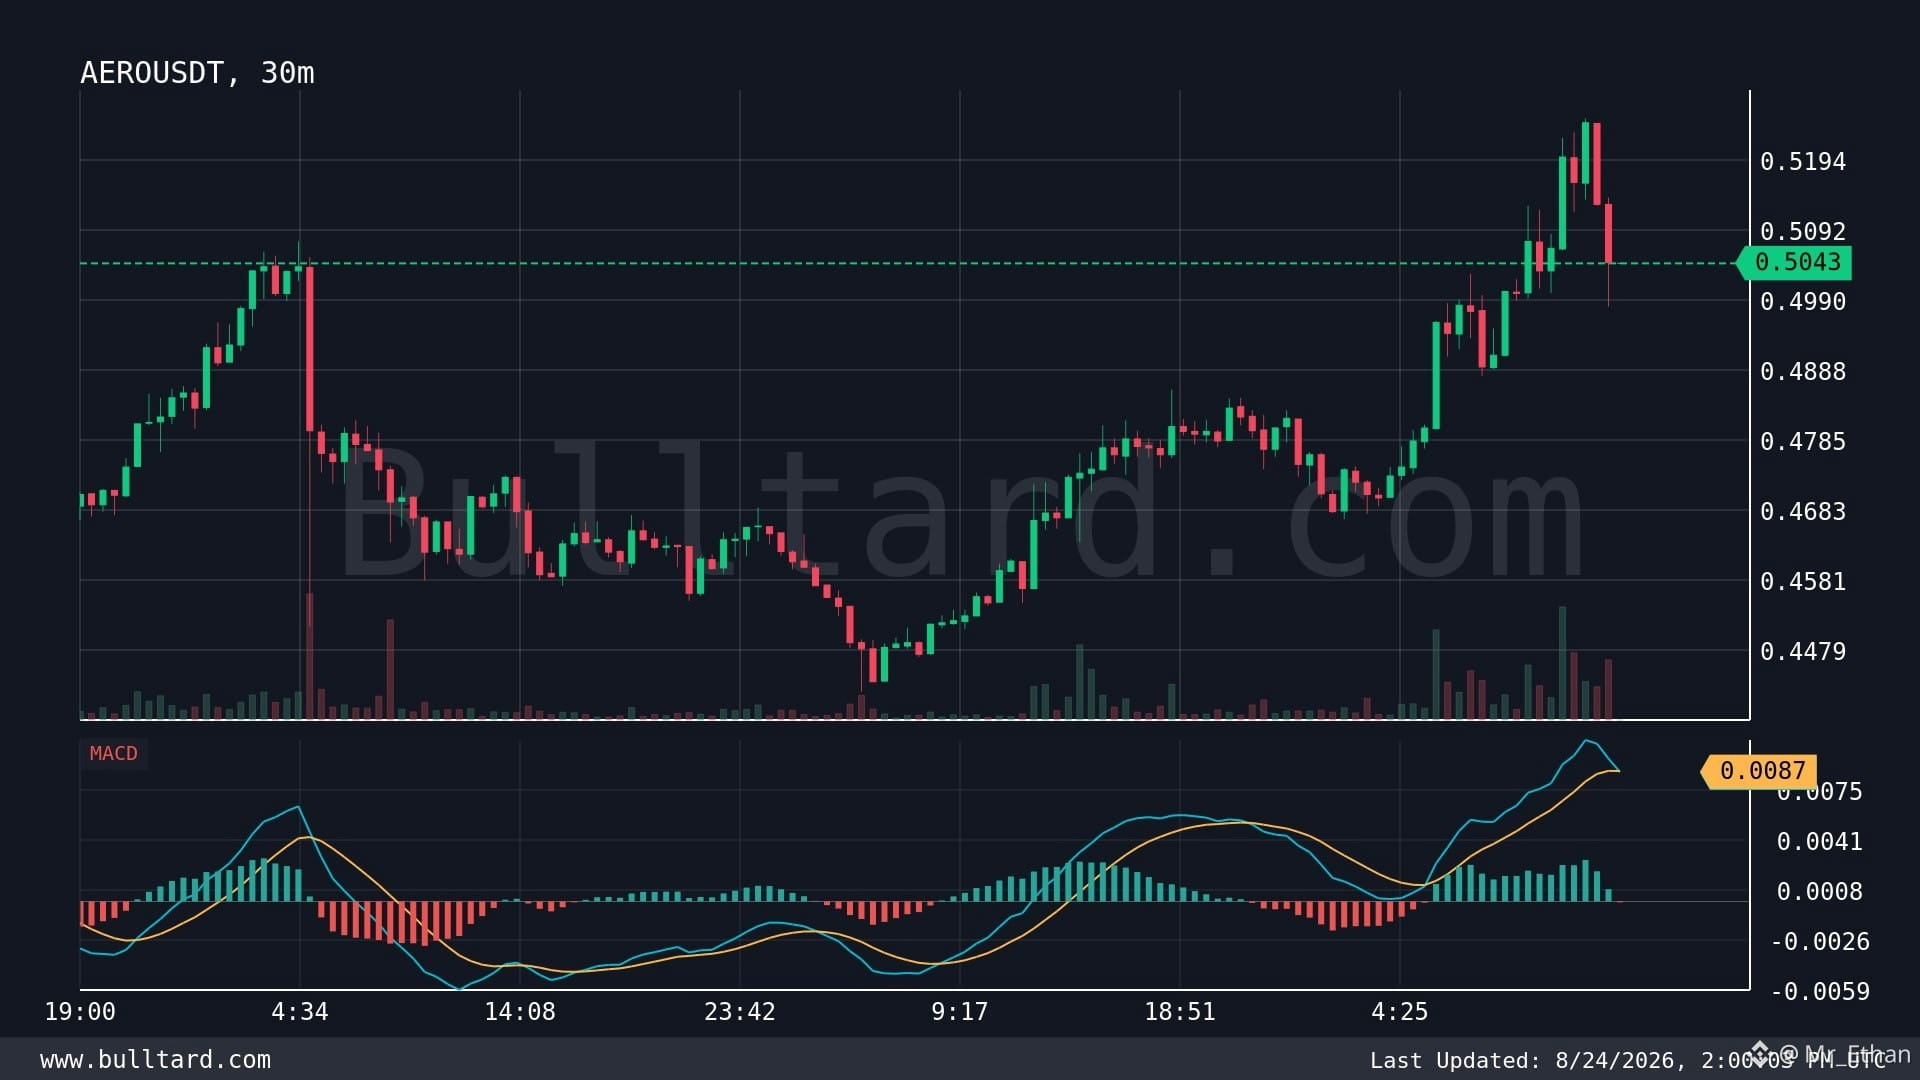
is showing me why strong projects still need careful entries.
I’ve been watching Aerodrome closely, and I like what it brings to the Base ecosystem. It’s not just another token. Aerodrome is built around trading and liquidity, helping users swap assets while liquidity providers earn incentives.
What I like most is its connection to Base and the growing demand for on-chain liquidity. Compared with many smaller DEX tokens, has a clearer role inside an active ecosystem. That gives it a stronger fundamental story in my view.
But I’m not ignoring the risks. DeFi competition is intense, token emissions can create selling pressure, and can still move heavily with broader market sentiment. When liquidity dries up, even good setups can fail quickly.
I’ve learned from trading these cycles that fundamentals matter, but timing matters too. A strong project bought at the wrong moment can still hurt the portfolio.
I’m watching momentum, liquidity, and user activity rather than chasing every green candle.
Would you hold for the ecosystem growth, or wait for a better entry?
$AERO #aero @Aero
$TUT
$TURTLE
I’ve been watching Aerodrome closely, and I like what it brings to the Base ecosystem. It’s not just another token. Aerodrome is built around trading and liquidity, helping users swap assets while liquidity providers earn incentives.
What I like most is its connection to Base and the growing demand for on-chain liquidity. Compared with many smaller DEX tokens, has a clearer role inside an active ecosystem. That gives it a stronger fundamental story in my view.
But I’m not ignoring the risks. DeFi competition is intense, token emissions can create selling pressure, and can still move heavily with broader market sentiment. When liquidity dries up, even good setups can fail quickly.
I’ve learned from trading these cycles that fundamentals matter, but timing matters too. A strong project bought at the wrong moment can still hurt the portfolio.
I’m watching momentum, liquidity, and user activity rather than chasing every green candle.
Would you hold for the ecosystem growth, or wait for a better entry?
$AERO #aero @Aero
$TUT
$TURTLE
292
·
--
Падение
is showing a bearish MACD crossover on the 30m chart, and I’m paying attention to it.
I’ve learned that these signals are useful, but they work best when I look at the bigger picture too. At around $0.2325, MET is now showing short-term weakness, which could mean sellers are gaining control.
What I like about MET is its role in the broader Web3 infrastructure space and the potential for real utility if adoption grows. But that strength doesn’t remove the risks. Crypto liquidity can shift quickly, and a bearish crossover can fail if buyers step back in with strong volume.
My main lesson from trading these setups is simple: I never treat one indicator as a guaranteed direction. I watch price structure, volume, support levels, and how BTC is behaving before making a decision.
For now, I’m cautious rather than chasing a move. If buyers reclaim momentum, the signal could quickly lose strength.
Would you wait for confirmation on $MET, or would you consider this bearish crossover an early warning?
$SUPER
{spot}(SUPERUSDT)
$UAI
{future}(UAIUSDT)
$MET
{spot}(METUSDT)
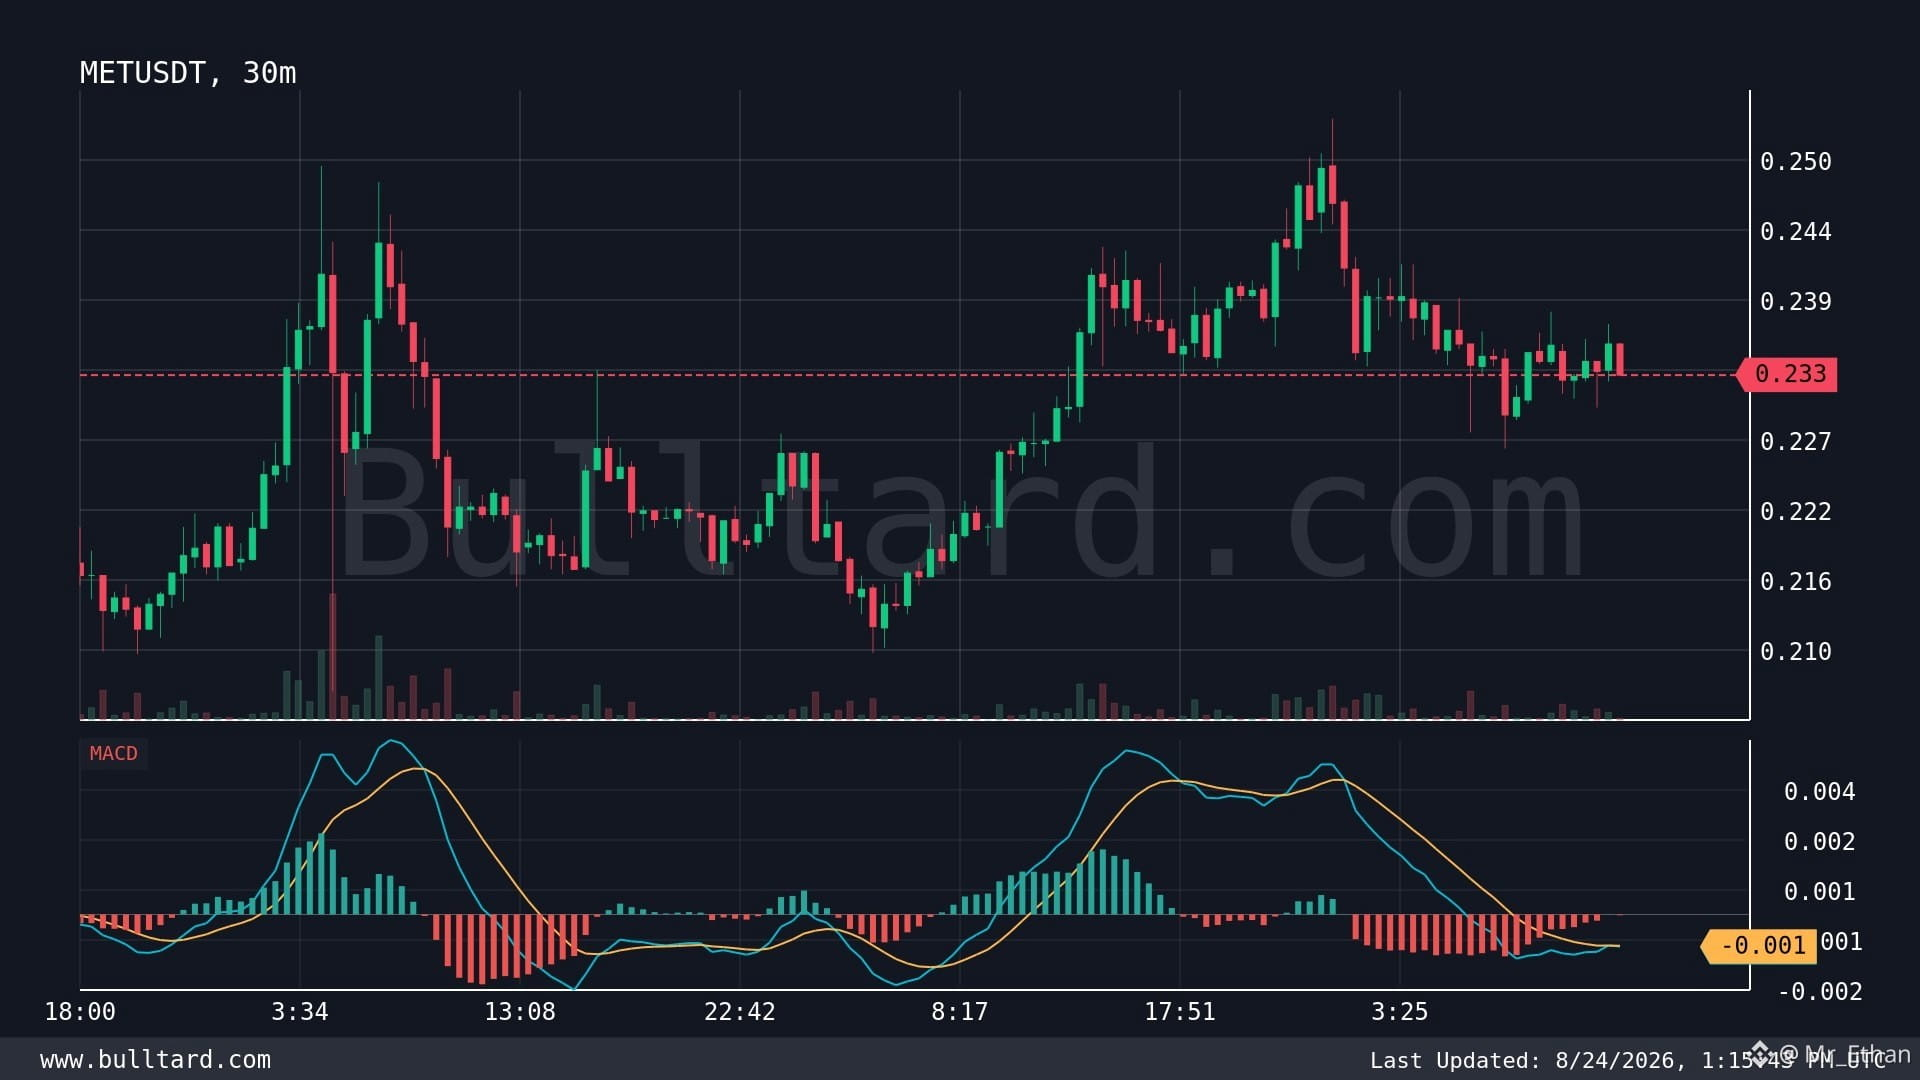
is showing a bearish MACD crossover on the 30m chart, and I’m paying attention to it.
I’ve learned that these signals are useful, but they work best when I look at the bigger picture too. At around $0.2325, MET is now showing short-term weakness, which could mean sellers are gaining control.
What I like about MET is its role in the broader Web3 infrastructure space and the potential for real utility if adoption grows. But that strength doesn’t remove the risks. Crypto liquidity can shift quickly, and a bearish crossover can fail if buyers step back in with strong volume.
My main lesson from trading these setups is simple: I never treat one indicator as a guaranteed direction. I watch price structure, volume, support levels, and how BTC is behaving before making a decision.
For now, I’m cautious rather than chasing a move. If buyers reclaim momentum, the signal could quickly lose strength.
Would you wait for confirmation on $MET , or would you consider this bearish crossover an early warning?
$SUPER
$UAI
$MET
I’ve learned that these signals are useful, but they work best when I look at the bigger picture too. At around $0.2325, MET is now showing short-term weakness, which could mean sellers are gaining control.
What I like about MET is its role in the broader Web3 infrastructure space and the potential for real utility if adoption grows. But that strength doesn’t remove the risks. Crypto liquidity can shift quickly, and a bearish crossover can fail if buyers step back in with strong volume.
My main lesson from trading these setups is simple: I never treat one indicator as a guaranteed direction. I watch price structure, volume, support levels, and how BTC is behaving before making a decision.
For now, I’m cautious rather than chasing a move. If buyers reclaim momentum, the signal could quickly lose strength.
Would you wait for confirmation on $MET , or would you consider this bearish crossover an early warning?
$SUPER
$UAI
$MET
1
2
270
·
--
Рост
Торговля за 30 дней $DUSK 82.7 USDT
$DUSK #dusk @Dusk_Foundation
DUSK is one of those projects I think deserves more attention when the market starts talking seriously about privacy and real financial use cases.
I’ve watched crypto narratives move from pure speculation toward infrastructure that can actually solve problems. That’s where Dusk Network gets interesting. It’s a Layer-1 built around privacy for financial applications, with confidential smart contracts and its Confidential Security Contract (XSC) standard.
What I like is the focus. Dusk isn’t trying to be everything at once. It targets a real problem: financial institutions need blockchain benefits without exposing sensitive transaction and business data.
The strength is clear utility, but I’m also realistic about the risks. Adoption is the biggest question. Strong technology alone doesn’t guarantee users, liquidity, or developer activity. Competition in privacy and institutional blockchain infrastructure is also serious.
One lesson I’ve learned from crypto is that narratives can create attention, but adoption creates lasting value. I’m watching DUSK more for execution than hype.
If privacy becomes a major requirement for on-chain finance, could Dusk become one of the networks that benefits?$PROM $TUT
{future}(TUTUSDT)
{future}(PROMUSDT)
$DUSK #dusk @Dusk
DUSK is one of those projects I think deserves more attention when the market starts talking seriously about privacy and real financial use cases.
I’ve watched crypto narratives move from pure speculation toward infrastructure that can actually solve problems. That’s where Dusk Network gets interesting. It’s a Layer-1 built around privacy for financial applications, with confidential smart contracts and its Confidential Security Contract (XSC) standard.
What I like is the focus. Dusk isn’t trying to be everything at once. It targets a real problem: financial institutions need blockchain benefits without exposing sensitive transaction and business data.
The strength is clear utility, but I’m also realistic about the risks. Adoption is the biggest question. Strong technology alone doesn’t guarantee users, liquidity, or developer activity. Competition in privacy and institutional blockchain infrastructure is also serious.
One lesson I’ve learned from crypto is that narratives can create attention, but adoption creates lasting value. I’m watching DUSK more for execution than hype.
If privacy becomes a major requirement for on-chain finance, could Dusk become one of the networks that benefits?$PROM $TUT
DUSK is one of those projects I think deserves more attention when the market starts talking seriously about privacy and real financial use cases.
I’ve watched crypto narratives move from pure speculation toward infrastructure that can actually solve problems. That’s where Dusk Network gets interesting. It’s a Layer-1 built around privacy for financial applications, with confidential smart contracts and its Confidential Security Contract (XSC) standard.
What I like is the focus. Dusk isn’t trying to be everything at once. It targets a real problem: financial institutions need blockchain benefits without exposing sensitive transaction and business data.
The strength is clear utility, but I’m also realistic about the risks. Adoption is the biggest question. Strong technology alone doesn’t guarantee users, liquidity, or developer activity. Competition in privacy and institutional blockchain infrastructure is also serious.
One lesson I’ve learned from crypto is that narratives can create attention, but adoption creates lasting value. I’m watching DUSK more for execution than hype.
If privacy becomes a major requirement for on-chain finance, could Dusk become one of the networks that benefits?$PROM $TUT

2
1
110
Войдите, чтобы посмотреть больше материала
Присоединяйтесь к пользователям криптовалют по всему миру на Binance Square
⚡️ Получайте новейшую и полезную информацию о криптоактивах.
💬 Нам доверяет крупнейшая в мире криптобиржа.
👍 Получите достоверные аналитические данные от верифицированных создателей контента.
Эл. почта/номер телефона
В тренде
FedMinutesFocusOnOctoberPause
Просмотров: 114,919
1,106 обсуждают
🚨 HIGH ALERT ‼️ PLEASE DON’T TRADE BLINDLY FOR THE NEXT HOUR 🚨
Guys, we have FOMC Minutes coming in less than 1 hour.
And after the kind of volatility we already saw today, I really don’t want anyone opening random high-leverage positions just before this release.
The biggest reaction I’m watching will be in Gold (XAU), Silver (XAG), BTC and ETH. Then coins like SOL and other highly leveraged mid/low-cap alts can exaggerate whatever move BTC makes.
Gold and Silver are especially sensitive tonight because the market is already reacting to the US dollar + Treasury yields, and both metals have been under heavy pressure ahead of the Fed minutes.
Briefly speaking
📉Hawkish Fed Minutes → Dollar/yields can push higher → pressure on BTC, crypto, Gold & silver
📈Dovish Fed Minutes → Dollar/yields can cool → BTC, Gold, Silver and risk assets can bounce hard.
And please remember the first candle can be a trap. We can get a pump, immediate dump, liquidations on both sides, and then the real direction.
So for now, protect your positions, reduce unnecessary leverage and don’t FOMO into the first move.
Tonight I’m watching $XAU , $XAG and $BTC first. These will tell us very quickly how the market is reading the Fed.
I will Update you guys on time
Follow @Panda Traders and Turn on Your notifications right now
#FedMinutesFocusOnOctoberPause
Panda Traders
·Лайков: 18
·Просмотров: 3.4k
BinanceLaunchesBinanceIntelligence
Просмотров: 1.1M
6,333 обсуждают
EvernorthDelaysNasdaqDebutToOct12
Просмотров: 7,503
223 обсуждают