
#asx
asx
Просмотров: 21,485
69 обсуждают
Популярные
Новые

·
--
Why Don't Australia's Spot Bitcoin ETFs Report Daily Flows Like the US Funds?$BTC | Ask how much money left Australia's spot Bitcoin ETFs last week and the honest answer is nobody outside the issuers knows yet. The ASX report SatoshiMacro tracks only publishes month end totals, added two to three weeks after the fact, while the US funds report net flows daily. That gap is the real story this month, not the price.
## What Australian investors actually see
Combined FUM across the four ASX listed spot Bitcoin ETFs sat at about A$458.7 million in October 2026. That total is built from VanEck's VBTC at A$303.7 million on a 0.45 percent management fee, iShares' IBIT at A$65.6 million on 0.25 percent, Betashares' QBTC at A$47.9 million on 0.45 percent, and DigitalX's BTXX at A$41.5 million on 0.49 percent. That is one number a month. There is no daily net flow column, no weekly creation and redemption count, nothing resembling the flow table that tracks the US funds unit by unit.
## How big is the gap against the US
US spot Bitcoin ETFs held about 1,282,351 BTC on 8 October 2026, worth more than US$100 billion. Australia's combined A$458.7 million is a rounding error against that, and the gap is not really a head start problem. The US funds launched in January 2024, only around five months before the first ASX listings went live. Scale explains some of the difference. Reporting cadence explains the rest.
## Why the lag actually bites
On the desk, the number I always wanted first was never the level, it was the direction. Australia's own data shows why that distinction matters here. Combined FUM peaked near A$486.7 million in September 2026, close to Bitcoin's price peak that month, then fell to A$458.7 million by October, a drop of roughly A$28 million. Was that redemptions, or just the fund marking down with the Bitcoin price while unit counts stayed flat? With only a month end total and no flow breakdown, an Australian investor cannot tell the difference. A US holder reading a daily net flow line for IBIT or FBTC can see that split the same afternoon it happens.
## A worked comparison
Picture two investors watching the same October pullback. The US holder checks a daily tracker and sees, day by day, whether money actually left the fund or the unit price simply fell with Bitcoin. The AU holder in VBTC or QBTC waits for the issuers to report, then for SatoshiMacro's own update cycle to add that month two to three weeks later, then has to guess at the redemption versus markdown split because the source report has never broken that number out. None of this reflects badly on the funds themselves. VBTC, IBIT, QBTC and BTXX are all standard ASX quoted products with normal issuer disclosure. It is a transparency gap in how the local market publishes data, nearly two years after the US approvals that this market is still catching up to.
## What I would actually do with this
My read is that the monthly snapshot is still perfectly usable for a long term allocation call, such as whether to hold a Bitcoin ETF inside an SMSF brokerage account rather than trading spot coin directly. It is close to useless for anyone trying to time entries off flow momentum, because by the time a trend becomes visible in the ASX report, the US market has already priced it through two or three fortnights of daily data. A trader working that short a horizon needs the US daily figures, and has to accept the AUD/USD currency exposure and W-8BEN paperwork that comes with holding a US listed fund instead of the local one.
## The honest limitation
This is a monthly accounting lag, not a verdict on fund quality, and it is worth saying plainly that SatoshiMacro's own tracker runs on the same two to three week reporting cycle as the issuers, so it inherits the blind spot it is describing rather than solving it. Treat the October figures as a snapshot of where the money sat, not a live read on where it is moving today.
Full fund by fund FUM and fee breakdown for Australia's four ASX listed spot Bitcoin ETFs is here.
https://satoshimacro.com/tools/crypto/etf-flows/australian-btc-etfs/?utm_source=binance_square&utm_medium=social&utm_campaign=autopilot_article
#SatoshiMacro #BitcoinETF #ASX #Bitcoin
Why Don't Australia's Spot Bitcoin ETFs Report Daily Flows Like the US Funds?
$BTC | Ask how much money left Australia's spot Bitcoin ETFs last week and the honest answer is nobody outside the issuers knows yet. The ASX report SatoshiMacro tracks only publishes month end totals, added two to three weeks after the fact, while the US funds report net flows daily. That gap is the real story this month, not the price.
## What Australian investors actually see
Combined FUM across the four ASX listed spot Bitcoin ETFs sat at about A$458.7 million in October 2026. That total is built from VanEck's VBTC at A$303.7 million on a 0.45 percent management fee, iShares' IBIT at A$65.6 million on 0.25 percent, Betashares' QBTC at A$47.9 million on 0.45 percent, and DigitalX's BTXX at A$41.5 million on 0.49 percent. That is one number a month. There is no daily net flow column, no weekly creation and redemption count, nothing resembling the flow table that tracks the US funds unit by unit.
## How big is the gap against the US
US spot Bitcoin ETFs held about 1,282,351 BTC on 8 October 2026, worth more than US$100 billion. Australia's combined A$458.7 million is a rounding error against that, and the gap is not really a head start problem. The US funds launched in January 2024, only around five months before the first ASX listings went live. Scale explains some of the difference. Reporting cadence explains the rest.
## Why the lag actually bites
On the desk, the number I always wanted first was never the level, it was the direction. Australia's own data shows why that distinction matters here. Combined FUM peaked near A$486.7 million in September 2026, close to Bitcoin's price peak that month, then fell to A$458.7 million by October, a drop of roughly A$28 million. Was that redemptions, or just the fund marking down with the Bitcoin price while unit counts stayed flat? With only a month end total and no flow breakdown, an Australian investor cannot tell the difference. A US holder reading a daily net flow line for IBIT or FBTC can see that split the same afternoon it happens.
## A worked comparison
Picture two investors watching the same October pullback. The US holder checks a daily tracker and sees, day by day, whether money actually left the fund or the unit price simply fell with Bitcoin. The AU holder in VBTC or QBTC waits for the issuers to report, then for SatoshiMacro's own update cycle to add that month two to three weeks later, then has to guess at the redemption versus markdown split because the source report has never broken that number out. None of this reflects badly on the funds themselves. VBTC, IBIT, QBTC and BTXX are all standard ASX quoted products with normal issuer disclosure. It is a transparency gap in how the local market publishes data, nearly two years after the US approvals that this market is still catching up to.
## What I would actually do with this
My read is that the monthly snapshot is still perfectly usable for a long term allocation call, such as whether to hold a Bitcoin ETF inside an SMSF brokerage account rather than trading spot coin directly. It is close to useless for anyone trying to time entries off flow momentum, because by the time a trend becomes visible in the ASX report, the US market has already priced it through two or three fortnights of daily data. A trader working that short a horizon needs the US daily figures, and has to accept the AUD/USD currency exposure and W-8BEN paperwork that comes with holding a US listed fund instead of the local one.
## The honest limitation
This is a monthly accounting lag, not a verdict on fund quality, and it is worth saying plainly that SatoshiMacro's own tracker runs on the same two to three week reporting cycle as the issuers, so it inherits the blind spot it is describing rather than solving it. Treat the October figures as a snapshot of where the money sat, not a live read on where it is moving today.
Full fund by fund FUM and fee breakdown for Australia's four ASX listed spot Bitcoin ETFs is here.
https://satoshimacro.com/tools/crypto/etf-flows/australian-btc-etfs/?utm_source=binance_square&utm_medium=social&utm_campaign=autopilot_article
#SatoshiMacro #BitcoinETF #ASX #Bitcoin
## What Australian investors actually see
Combined FUM across the four ASX listed spot Bitcoin ETFs sat at about A$458.7 million in October 2026. That total is built from VanEck's VBTC at A$303.7 million on a 0.45 percent management fee, iShares' IBIT at A$65.6 million on 0.25 percent, Betashares' QBTC at A$47.9 million on 0.45 percent, and DigitalX's BTXX at A$41.5 million on 0.49 percent. That is one number a month. There is no daily net flow column, no weekly creation and redemption count, nothing resembling the flow table that tracks the US funds unit by unit.
## How big is the gap against the US
US spot Bitcoin ETFs held about 1,282,351 BTC on 8 October 2026, worth more than US$100 billion. Australia's combined A$458.7 million is a rounding error against that, and the gap is not really a head start problem. The US funds launched in January 2024, only around five months before the first ASX listings went live. Scale explains some of the difference. Reporting cadence explains the rest.
## Why the lag actually bites
On the desk, the number I always wanted first was never the level, it was the direction. Australia's own data shows why that distinction matters here. Combined FUM peaked near A$486.7 million in September 2026, close to Bitcoin's price peak that month, then fell to A$458.7 million by October, a drop of roughly A$28 million. Was that redemptions, or just the fund marking down with the Bitcoin price while unit counts stayed flat? With only a month end total and no flow breakdown, an Australian investor cannot tell the difference. A US holder reading a daily net flow line for IBIT or FBTC can see that split the same afternoon it happens.
## A worked comparison
Picture two investors watching the same October pullback. The US holder checks a daily tracker and sees, day by day, whether money actually left the fund or the unit price simply fell with Bitcoin. The AU holder in VBTC or QBTC waits for the issuers to report, then for SatoshiMacro's own update cycle to add that month two to three weeks later, then has to guess at the redemption versus markdown split because the source report has never broken that number out. None of this reflects badly on the funds themselves. VBTC, IBIT, QBTC and BTXX are all standard ASX quoted products with normal issuer disclosure. It is a transparency gap in how the local market publishes data, nearly two years after the US approvals that this market is still catching up to.
## What I would actually do with this
My read is that the monthly snapshot is still perfectly usable for a long term allocation call, such as whether to hold a Bitcoin ETF inside an SMSF brokerage account rather than trading spot coin directly. It is close to useless for anyone trying to time entries off flow momentum, because by the time a trend becomes visible in the ASX report, the US market has already priced it through two or three fortnights of daily data. A trader working that short a horizon needs the US daily figures, and has to accept the AUD/USD currency exposure and W-8BEN paperwork that comes with holding a US listed fund instead of the local one.
## The honest limitation
This is a monthly accounting lag, not a verdict on fund quality, and it is worth saying plainly that SatoshiMacro's own tracker runs on the same two to three week reporting cycle as the issuers, so it inherits the blind spot it is describing rather than solving it. Treat the October figures as a snapshot of where the money sat, not a live read on where it is moving today.
Full fund by fund FUM and fee breakdown for Australia's four ASX listed spot Bitcoin ETFs is here.
https://satoshimacro.com/tools/crypto/etf-flows/australian-btc-etfs/?utm_source=binance_square&utm_medium=social&utm_campaign=autopilot_article
#SatoshiMacro #BitcoinETF #ASX #Bitcoin
103

·
--
📊 $SAND , $GALA , $ASX.US — игровые и токенизированные активы в фазе роста!
· #SAND — $0.04489 (+2.91%), консолидируется у EMA21 (0.04499), выше EMA50 (0.04337) и EMA200 (0.04319). RSI 51.6 — нейтрально. Сопротивление $0.04693 — пробой к $0.0498+. Поддержка $0.04499.
· #GALA — $0.001947 (+4.51%), выше всех EMA (21=0.001889, 50=0.001780, 200=0.001821). RSI 57.2 — пространство для роста. Сопротивление $0.002034 — пробой к $0.002117+. Поддержка $0.001889.
· #ASX (bStock) — $36.525 (+0.08%), ниже EMA21 (37.64) и EMA50 (37.43), но выше EMA200 (28.94). RSI 45.9 — почти перепроданность. Сопротивление $39.86 — пробой к $40+. Поддержка $32.60.
Вывод: SAND и GALA в тренде, ASX корректируется. Вход только на откатах!
🔥 Какая из них ваш фаворит? 👇
👉 Подпишись на сигналы!
#Trade 👇
{future}(SANDUSDT)
{future}(GALAUSDT)
{stock_us}(ASX.US)
📊 $SAND , $GALA , $ASX.US — игровые и токенизированные активы в фазе роста!
· #SAND — $0.04489 (+2.91%), консолидируется у EMA21 (0.04499), выше EMA50 (0.04337) и EMA200 (0.04319). RSI 51.6 — нейтрально. Сопротивление $0.04693 — пробой к $0.0498+. Поддержка $0.04499.
· #GALA — $0.001947 (+4.51%), выше всех EMA (21=0.001889, 50=0.001780, 200=0.001821). RSI 57.2 — пространство для роста. Сопротивление $0.002034 — пробой к $0.002117+. Поддержка $0.001889.
· #ASX (bStock) — $36.525 (+0.08%), ниже EMA21 (37.64) и EMA50 (37.43), но выше EMA200 (28.94). RSI 45.9 — почти перепроданность. Сопротивление $39.86 — пробой к $40+. Поддержка $32.60.
Вывод: SAND и GALA в тренде, ASX корректируется. Вход только на откатах!
🔥 Какая из них ваш фаворит? 👇
👉 Подпишись на сигналы!
#Trade 👇
· #SAND — $0.04489 (+2.91%), консолидируется у EMA21 (0.04499), выше EMA50 (0.04337) и EMA200 (0.04319). RSI 51.6 — нейтрально. Сопротивление $0.04693 — пробой к $0.0498+. Поддержка $0.04499.
· #GALA — $0.001947 (+4.51%), выше всех EMA (21=0.001889, 50=0.001780, 200=0.001821). RSI 57.2 — пространство для роста. Сопротивление $0.002034 — пробой к $0.002117+. Поддержка $0.001889.
· #ASX (bStock) — $36.525 (+0.08%), ниже EMA21 (37.64) и EMA50 (37.43), но выше EMA200 (28.94). RSI 45.9 — почти перепроданность. Сопротивление $39.86 — пробой к $40+. Поддержка $32.60.
Вывод: SAND и GALA в тренде, ASX корректируется. Вход только на откатах!
🔥 Какая из них ваш фаворит? 👇
👉 Подпишись на сигналы!
#Trade 👇
309

·
--
🦈 $ASX EARNINGS: WHY THE HEADLINE REVENUE FIGURE DOESN'T ADD UP 🔍
📊 The circulating $5.9B consensus revenue claim alongside a purported 90% year-over-year decline contradicts ASE's own monthly updates—which showed solid growth. This earnings setup demands deeper scrutiny, not surface-level panic.
💡 The real signal lies in management's commentary on AI packaging demand, customer utilization, and second-half 2026 guidance. With consensus EPS at ~$0.20, the stock's pullback reflects cautious positioning ahead of the release. 💬 Are you watching the headline or the conference call for the true read on semiconductor demand? 👇
⚠️ Not financial advice. Always manage your risk. 🛡️
🏷️ #ASX #Earnings #Semiconductor #AI #Packaging
🦈 📊
🦈 $ASX EARNINGS: WHY THE HEADLINE REVENUE FIGURE DOESN'T ADD UP 🔍
📊 The circulating $5.9B consensus revenue claim alongside a purported 90% year-over-year decline contradicts ASE's own monthly updates—which showed solid growth. This earnings setup demands deeper scrutiny, not surface-level panic.
💡 The real signal lies in management's commentary on AI packaging demand, customer utilization, and second-half 2026 guidance. With consensus EPS at ~$0.20, the stock's pullback reflects cautious positioning ahead of the release. 💬 Are you watching the headline or the conference call for the true read on semiconductor demand? 👇
⚠️ Not financial advice. Always manage your risk. 🛡️
🏷️ #ASX #Earnings #Semiconductor #AI #Packaging
🦈 📊
📊 The circulating $5.9B consensus revenue claim alongside a purported 90% year-over-year decline contradicts ASE's own monthly updates—which showed solid growth. This earnings setup demands deeper scrutiny, not surface-level panic.
💡 The real signal lies in management's commentary on AI packaging demand, customer utilization, and second-half 2026 guidance. With consensus EPS at ~$0.20, the stock's pullback reflects cautious positioning ahead of the release. 💬 Are you watching the headline or the conference call for the true read on semiconductor demand? 👇
⚠️ Not financial advice. Always manage your risk. 🛡️
🏷️ #ASX #Earnings #Semiconductor #AI #Packaging
🦈 📊
22

·
--
澳大利亚股市今日开门红,ASX200指数涨0.51%!市场情绪回暖,对风险资产是利好信号。澳股表现强势,是否预示着加密市场也要跟涨了?#股市回暖 #澳股 $BTC $ETH
Australian stocks opened strong today with ASX200 up 0.51%! Market sentiment is improving, which is good news for risk assets. Could this ASX strength signal a crypto rally coming soon? #MarketUptrend #ASX $BTC $ETH
澳大利亚股市今日开门红,ASX200指数涨0.51%!市场情绪回暖,对风险资产是利好信号。澳股表现强势,是否预示着加密市场也要跟涨了?#股市回暖 #澳股 $BTC $ETH
Australian stocks opened strong today with ASX200 up 0.51%! Market sentiment is improving, which is good news for risk assets. Could this ASX strength signal a crypto rally coming soon? #MarketUptrend #ASX $BTC $ETH
Australian stocks opened strong today with ASX200 up 0.51%! Market sentiment is improving, which is good news for risk assets. Could this ASX strength signal a crypto rally coming soon? #MarketUptrend #ASX $BTC $ETH
298

🚨 $ASX EARNINGS SETUP: THE REAL SIGNAL ISN'T THE HEADLINE 🦈
Body:
💡 Everyone's fixated on the supposed 90% revenue drop—but ASE's own monthly data tells a different story. Solid YoY growth doesn't line up with that fear narrative. 📊 The real edge here is the conference call, not the print. This company is the backbone of semiconductor packaging, and management's commentary on AI demand and utilization will reveal whether the cycle is accelerating or cooling.
📌 Consensus EPS sits at $0.20, but the stock pulled back ahead of the release—classic cautious positioning before a catalyst. 💬 Are you betting on a post-earnings squeeze or waiting for management to confirm the trend? 👇
⚠️ Not financial advice. Always manage your risk. 🛡️
🏷️ #ASX #Earnings #Semiconductors #AI #SmartMoney
🦈 💡
🚨 $ASX EARNINGS SETUP: THE REAL SIGNAL ISN'T THE HEADLINE 🦈
Body:
💡 Everyone's fixated on the supposed 90% revenue drop—but ASE's own monthly data tells a different story. Solid YoY growth doesn't line up with that fear narrative. 📊 The real edge here is the conference call, not the print. This company is the backbone of semiconductor packaging, and management's commentary on AI demand and utilization will reveal whether the cycle is accelerating or cooling.
📌 Consensus EPS sits at $0.20, but the stock pulled back ahead of the release—classic cautious positioning before a catalyst. 💬 Are you betting on a post-earnings squeeze or waiting for management to confirm the trend? 👇
⚠️ Not financial advice. Always manage your risk. 🛡️
🏷️ #ASX #Earnings #Semiconductors #AI #SmartMoney
🦈 💡
Body:
💡 Everyone's fixated on the supposed 90% revenue drop—but ASE's own monthly data tells a different story. Solid YoY growth doesn't line up with that fear narrative. 📊 The real edge here is the conference call, not the print. This company is the backbone of semiconductor packaging, and management's commentary on AI demand and utilization will reveal whether the cycle is accelerating or cooling.
📌 Consensus EPS sits at $0.20, but the stock pulled back ahead of the release—classic cautious positioning before a catalyst. 💬 Are you betting on a post-earnings squeeze or waiting for management to confirm the trend? 👇
⚠️ Not financial advice. Always manage your risk. 🛡️
🏷️ #ASX #Earnings #Semiconductors #AI #SmartMoney
🦈 💡
55
·
--
Which Of Australia's Four Spot Bitcoin ETFs Should You Actually Buy?$BTC | Which of Australia's four spot Bitcoin ETFs should you actually buy if you want ASX exposure instead of holding coins directly? Short answer: look past the headline name and compare the management fee first, because the gap between the cheapest and most expensive of the four is wider than most investors assume, then weigh that against how much FUM a fund has actually attracted.
As of August 2026 there are four spot Bitcoin ETFs quoted on the ASX, with combined funds under management of A$427.9 million. That is down from the series high of A$470.0 million set in October 2025, and only modestly above the A$437.6 million recorded a year earlier in August 2025. Two more products, EBTC and IBTC, trade on Cboe Australia but aren't captured in the ASX Investment Products Monthly Report SatoshiMacro's tracker is built from, so this comparison is deliberately scoped to the four ASX-listed names.
## Why four funds and not one
VanEck's VBTC was first to list, in June 2024, and it still carries the largest book at A$292.1 million. DigitalX's BTXX followed a month later in July 2024. Betashares' QBTC didn't arrive until February 2025, and iShares' IBIT, the ASX-listed sibling of the world's largest Bitcoin ETF, only landed in November 2025, five months behind the first mover. On the desk we used to call this the incumbency effect: the fund that gets there first usually keeps the largest share of flows even once cheaper or better-known competitors show up, because switching custodians and triggering a disposal event isn't free.
## The fee gap that actually matters
VBTC and QBTC both charge 0.45% per year. BTXX is the most expensive at 0.49%. IBIT undercuts all three at 0.25%, matching its US-listed counterpart almost to the basis point. On a long hold that difference compounds: 0.24% a year sounds trivial next to Bitcoin's own volatility, but over a five or ten year SMSF accumulation phase it is a real, certain drag that has nothing to do with whether Bitcoin goes up or down. My read is that the fee gap explains less of the flow picture than first-mover advantage does right now. IBIT only has A$50.2 million in FUM despite the cheapest fee on the board, well behind VBTC's A$292.1 million, which tells you most of the money that arrived in 2024 simply hasn't moved.
## What the FUM comparison actually tells you
Scale matters for a different reason than fees: liquidity and bid-ask spread on an ASX-quoted product generally track fund size, so a thinly traded ETF can cost you more at the point of buying or selling than its stated MER ever will. Combined ASX Bitcoin ETF FUM of roughly A$428 million is a rounding error against the "more than US$100 billion" sitting in US-listed spot Bitcoin ETFs, a gap of several hundred times given the ASX products arrived only five months after the US ones launched in January 2024. That is not a knock on the local market, it is a reminder that these are still genuinely small, developing vehicles rather than deep, heavily arbitraged products.
## SMSF and tax considerations
A listed ETF structure sidesteps a problem that trips up a lot of self-managed super fund trustees: it avoids the direct custody complications of a trust holding private keys, since the fund itself handles coin custody and the SMSF simply holds units like any other ASX security. That is general information, not financial or tax advice specific to your fund. For capital gains purposes the units are treated like any other asset disposal: hold them more than 12 months and an individual investor generally picks up the standard 50 percent CGT discount on the gain, the same treatment that applies to holding Bitcoin directly. The ETF wrapper changes custody and reporting, not the underlying tax event.
## Trader versus super fund: different question entirely
An active trader comparing these four funds is asking the wrong question. If you want to size a position up or down through the week, trade BTC CFDs or spot, where the spread and funding cost are transparent and you're not waiting on a monthly FUM print to tell you anything about liquidity. These ETFs are built for someone making a once-a-quarter or once-a-year allocation decision inside super or a brokerage account, not someone reacting to a weekend move. Conflating the two is how people end up disappointed with an instrument that was never designed for their use case.
## The honest limitation
This dataset updates monthly from the ASX Investment Products Monthly Report, so it is a lagging snapshot rather than a live read on flows, and it excludes the two Cboe-quoted products entirely because that venue doesn't publish comparable monthly figures. If you're trying to call short-term sentiment from ASX ETF flows the way people watch daily US spot ETF creations and redemptions, this isn't the right tool; it's built for a slower, quarter-by-quarter view of how Australian investors are actually accessing Bitcoin through super and brokerage accounts.
What I would actually do: for a straightforward SMSF allocation where I never plan to actively trade the position, the lower ongoing fee on IBIT is hard to ignore over a long horizon, even with less liquidity today than VBTC. For anyone who values the deepest, most established local fund and the tightest observed spreads, VBTC's two-year head start still shows up in the numbers.
https://satoshimacro.com/tools/crypto/etf-flows/australian-btc-etfs/?utm_source=binance_square&utm_medium=social&utm_campaign=autopilot_article
#SatoshiMacro #BitcoinETF #ASX #Bitcoin
Which Of Australia's Four Spot Bitcoin ETFs Should You Actually Buy?
$BTC | Which of Australia's four spot Bitcoin ETFs should you actually buy if you want ASX exposure instead of holding coins directly? Short answer: look past the headline name and compare the management fee first, because the gap between the cheapest and most expensive of the four is wider than most investors assume, then weigh that against how much FUM a fund has actually attracted.
As of August 2026 there are four spot Bitcoin ETFs quoted on the ASX, with combined funds under management of A$427.9 million. That is down from the series high of A$470.0 million set in October 2025, and only modestly above the A$437.6 million recorded a year earlier in August 2025. Two more products, EBTC and IBTC, trade on Cboe Australia but aren't captured in the ASX Investment Products Monthly Report SatoshiMacro's tracker is built from, so this comparison is deliberately scoped to the four ASX-listed names.
## Why four funds and not one
VanEck's VBTC was first to list, in June 2024, and it still carries the largest book at A$292.1 million. DigitalX's BTXX followed a month later in July 2024. Betashares' QBTC didn't arrive until February 2025, and iShares' IBIT, the ASX-listed sibling of the world's largest Bitcoin ETF, only landed in November 2025, five months behind the first mover. On the desk we used to call this the incumbency effect: the fund that gets there first usually keeps the largest share of flows even once cheaper or better-known competitors show up, because switching custodians and triggering a disposal event isn't free.
## The fee gap that actually matters
VBTC and QBTC both charge 0.45% per year. BTXX is the most expensive at 0.49%. IBIT undercuts all three at 0.25%, matching its US-listed counterpart almost to the basis point. On a long hold that difference compounds: 0.24% a year sounds trivial next to Bitcoin's own volatility, but over a five or ten year SMSF accumulation phase it is a real, certain drag that has nothing to do with whether Bitcoin goes up or down. My read is that the fee gap explains less of the flow picture than first-mover advantage does right now. IBIT only has A$50.2 million in FUM despite the cheapest fee on the board, well behind VBTC's A$292.1 million, which tells you most of the money that arrived in 2024 simply hasn't moved.
## What the FUM comparison actually tells you
Scale matters for a different reason than fees: liquidity and bid-ask spread on an ASX-quoted product generally track fund size, so a thinly traded ETF can cost you more at the point of buying or selling than its stated MER ever will. Combined ASX Bitcoin ETF FUM of roughly A$428 million is a rounding error against the "more than US$100 billion" sitting in US-listed spot Bitcoin ETFs, a gap of several hundred times given the ASX products arrived only five months after the US ones launched in January 2024. That is not a knock on the local market, it is a reminder that these are still genuinely small, developing vehicles rather than deep, heavily arbitraged products.
## SMSF and tax considerations
A listed ETF structure sidesteps a problem that trips up a lot of self-managed super fund trustees: it avoids the direct custody complications of a trust holding private keys, since the fund itself handles coin custody and the SMSF simply holds units like any other ASX security. That is general information, not financial or tax advice specific to your fund. For capital gains purposes the units are treated like any other asset disposal: hold them more than 12 months and an individual investor generally picks up the standard 50 percent CGT discount on the gain, the same treatment that applies to holding Bitcoin directly. The ETF wrapper changes custody and reporting, not the underlying tax event.
## Trader versus super fund: different question entirely
An active trader comparing these four funds is asking the wrong question. If you want to size a position up or down through the week, trade BTC CFDs or spot, where the spread and funding cost are transparent and you're not waiting on a monthly FUM print to tell you anything about liquidity. These ETFs are built for someone making a once-a-quarter or once-a-year allocation decision inside super or a brokerage account, not someone reacting to a weekend move. Conflating the two is how people end up disappointed with an instrument that was never designed for their use case.
## The honest limitation
This dataset updates monthly from the ASX Investment Products Monthly Report, so it is a lagging snapshot rather than a live read on flows, and it excludes the two Cboe-quoted products entirely because that venue doesn't publish comparable monthly figures. If you're trying to call short-term sentiment from ASX ETF flows the way people watch daily US spot ETF creations and redemptions, this isn't the right tool; it's built for a slower, quarter-by-quarter view of how Australian investors are actually accessing Bitcoin through super and brokerage accounts.
What I would actually do: for a straightforward SMSF allocation where I never plan to actively trade the position, the lower ongoing fee on IBIT is hard to ignore over a long horizon, even with less liquidity today than VBTC. For anyone who values the deepest, most established local fund and the tightest observed spreads, VBTC's two-year head start still shows up in the numbers.
https://satoshimacro.com/tools/crypto/etf-flows/australian-btc-etfs/?utm_source=binance_square&utm_medium=social&utm_campaign=autopilot_article
#SatoshiMacro #BitcoinETF #ASX #Bitcoin
As of August 2026 there are four spot Bitcoin ETFs quoted on the ASX, with combined funds under management of A$427.9 million. That is down from the series high of A$470.0 million set in October 2025, and only modestly above the A$437.6 million recorded a year earlier in August 2025. Two more products, EBTC and IBTC, trade on Cboe Australia but aren't captured in the ASX Investment Products Monthly Report SatoshiMacro's tracker is built from, so this comparison is deliberately scoped to the four ASX-listed names.
## Why four funds and not one
VanEck's VBTC was first to list, in June 2024, and it still carries the largest book at A$292.1 million. DigitalX's BTXX followed a month later in July 2024. Betashares' QBTC didn't arrive until February 2025, and iShares' IBIT, the ASX-listed sibling of the world's largest Bitcoin ETF, only landed in November 2025, five months behind the first mover. On the desk we used to call this the incumbency effect: the fund that gets there first usually keeps the largest share of flows even once cheaper or better-known competitors show up, because switching custodians and triggering a disposal event isn't free.
## The fee gap that actually matters
VBTC and QBTC both charge 0.45% per year. BTXX is the most expensive at 0.49%. IBIT undercuts all three at 0.25%, matching its US-listed counterpart almost to the basis point. On a long hold that difference compounds: 0.24% a year sounds trivial next to Bitcoin's own volatility, but over a five or ten year SMSF accumulation phase it is a real, certain drag that has nothing to do with whether Bitcoin goes up or down. My read is that the fee gap explains less of the flow picture than first-mover advantage does right now. IBIT only has A$50.2 million in FUM despite the cheapest fee on the board, well behind VBTC's A$292.1 million, which tells you most of the money that arrived in 2024 simply hasn't moved.
## What the FUM comparison actually tells you
Scale matters for a different reason than fees: liquidity and bid-ask spread on an ASX-quoted product generally track fund size, so a thinly traded ETF can cost you more at the point of buying or selling than its stated MER ever will. Combined ASX Bitcoin ETF FUM of roughly A$428 million is a rounding error against the "more than US$100 billion" sitting in US-listed spot Bitcoin ETFs, a gap of several hundred times given the ASX products arrived only five months after the US ones launched in January 2024. That is not a knock on the local market, it is a reminder that these are still genuinely small, developing vehicles rather than deep, heavily arbitraged products.
## SMSF and tax considerations
A listed ETF structure sidesteps a problem that trips up a lot of self-managed super fund trustees: it avoids the direct custody complications of a trust holding private keys, since the fund itself handles coin custody and the SMSF simply holds units like any other ASX security. That is general information, not financial or tax advice specific to your fund. For capital gains purposes the units are treated like any other asset disposal: hold them more than 12 months and an individual investor generally picks up the standard 50 percent CGT discount on the gain, the same treatment that applies to holding Bitcoin directly. The ETF wrapper changes custody and reporting, not the underlying tax event.
## Trader versus super fund: different question entirely
An active trader comparing these four funds is asking the wrong question. If you want to size a position up or down through the week, trade BTC CFDs or spot, where the spread and funding cost are transparent and you're not waiting on a monthly FUM print to tell you anything about liquidity. These ETFs are built for someone making a once-a-quarter or once-a-year allocation decision inside super or a brokerage account, not someone reacting to a weekend move. Conflating the two is how people end up disappointed with an instrument that was never designed for their use case.
## The honest limitation
This dataset updates monthly from the ASX Investment Products Monthly Report, so it is a lagging snapshot rather than a live read on flows, and it excludes the two Cboe-quoted products entirely because that venue doesn't publish comparable monthly figures. If you're trying to call short-term sentiment from ASX ETF flows the way people watch daily US spot ETF creations and redemptions, this isn't the right tool; it's built for a slower, quarter-by-quarter view of how Australian investors are actually accessing Bitcoin through super and brokerage accounts.
What I would actually do: for a straightforward SMSF allocation where I never plan to actively trade the position, the lower ongoing fee on IBIT is hard to ignore over a long horizon, even with less liquidity today than VBTC. For anyone who values the deepest, most established local fund and the tightest observed spreads, VBTC's two-year head start still shows up in the numbers.
https://satoshimacro.com/tools/crypto/etf-flows/australian-btc-etfs/?utm_source=binance_square&utm_medium=social&utm_campaign=autopilot_article
#SatoshiMacro #BitcoinETF #ASX #Bitcoin
1
103

·
--
Рост
Are you looking for the top performers of the day . If you are,then this post is for you.
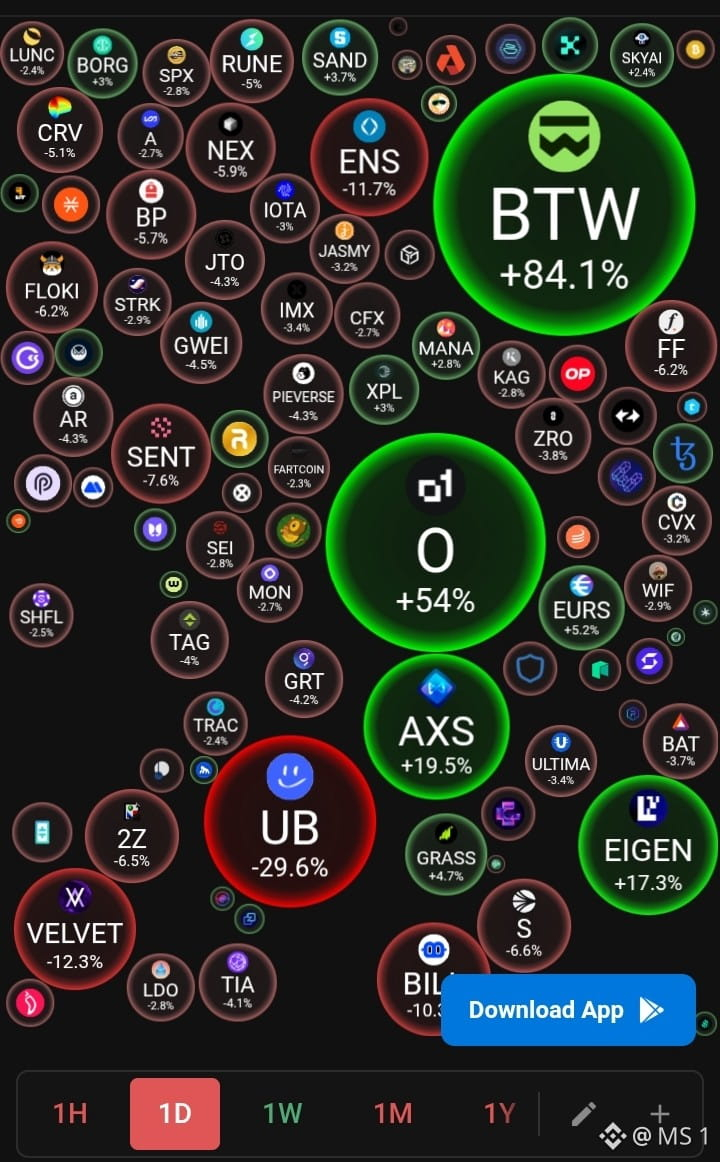
$BTW is more than 100% up in a single day . It is in strong buying zone because buyers are actively participating .
Trade here 👇$BTW long
{future}(BTWUSDT)
Trade here 👇$O
{alpha}(560x500a02a20b0b0a3f3efccfc0559543f5743bd1c4)
#O is #alphacoin and it is 2nd time jumping near 1$ zone.
Trade here
#ASX Long
{future}(AXSUSDT)
Are you looking for the top performers of the day . If you are,then this post is for you.
$BTW is more than 100% up in a single day . It is in strong buying zone because buyers are actively participating .
Trade here 👇$BTW long
Trade here 👇$O
#O is #alphacoin and it is 2nd time jumping near 1$ zone.
Trade here
#ASX Long
$BTW is more than 100% up in a single day . It is in strong buying zone because buyers are actively participating .
Trade here 👇$BTW long
Trade here 👇$O
#O is #alphacoin and it is 2nd time jumping near 1$ zone.
Trade here
#ASX Long
1
461

·
--
Рост
ŞHEMS X
·
--
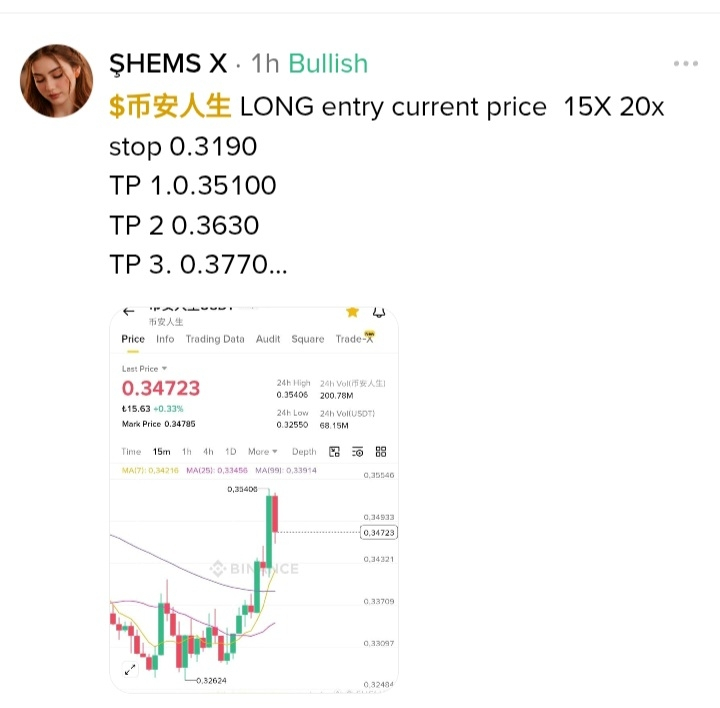
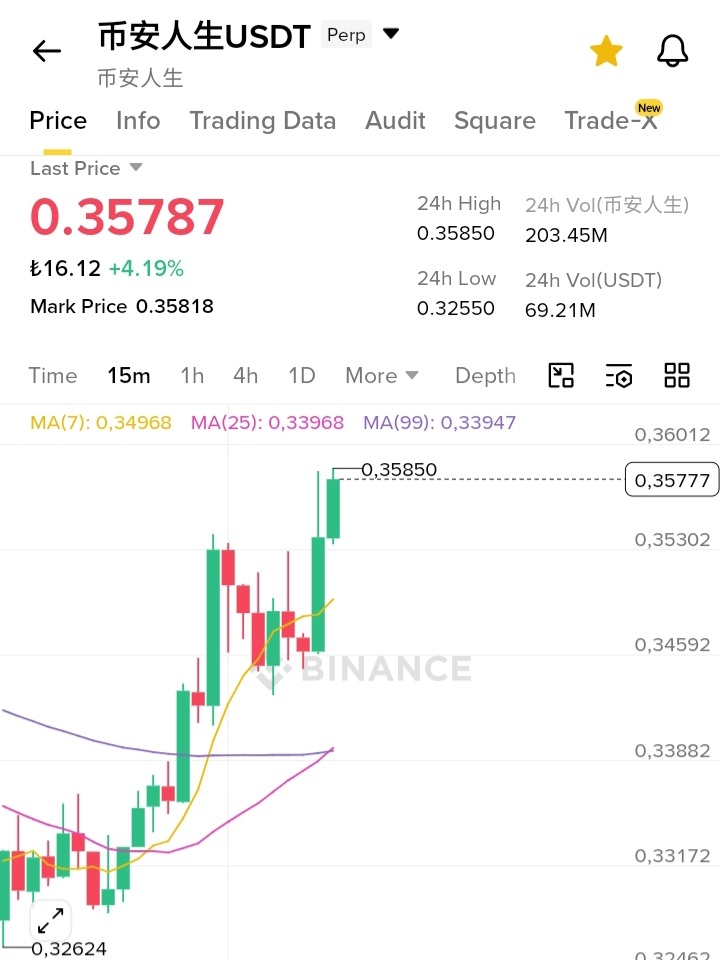
Рост$币安人生 LONG entry current price 15X 20x stop 0.3190
TP 1.0.35100
TP 2 0.3630
TP 3. 0.3770
TP 4 0.3900
If your KQ is strong, don't use a stop loss.
#ZEC #INCT #BSB #ARI3 #APE
TP 1.0.35100
TP 2 0.3630
TP 3. 0.3770
TP 4 0.3900
If your KQ is strong, don't use a stop loss.
#ZEC #INCT #BSB #ARI3 #APE
1
617

Cổ đông ASX kiện cựu giám đốc vì dự án blockchain thất bại
- Cổ đông của ASX có kế hoạch kiện các cựu giám đốc liên quan đến dự án blockchain thất bại.
- Dự án CHESS dựa trên blockchain của ASX đã thất bại, gây ra sự giám sát quản trị mới.
- ASX đã thừa nhận đã gây hiểu lầm cho thị trường về dự án này.
- Nguồn RSS chưa cung cấp thêm chi tiết về số tiền bồi thường hay thời gian cụ thể.
#BinanceSquare #CryptoNews #Blockchain #ASX
$btc $eth
#vlikevn Titanbot
Nguồn: CoinTelegraph
Cổ đông ASX kiện cựu giám đốc vì dự án blockchain thất bại
- Cổ đông của ASX có kế hoạch kiện các cựu giám đốc liên quan đến dự án blockchain thất bại.
- Dự án CHESS dựa trên blockchain của ASX đã thất bại, gây ra sự giám sát quản trị mới.
- ASX đã thừa nhận đã gây hiểu lầm cho thị trường về dự án này.
- Nguồn RSS chưa cung cấp thêm chi tiết về số tiền bồi thường hay thời gian cụ thể.
#BinanceSquare #CryptoNews #Blockchain #ASX
$btc $eth
#vlikevn Titanbot
Nguồn: CoinTelegraph
- Cổ đông của ASX có kế hoạch kiện các cựu giám đốc liên quan đến dự án blockchain thất bại.
- Dự án CHESS dựa trên blockchain của ASX đã thất bại, gây ra sự giám sát quản trị mới.
- ASX đã thừa nhận đã gây hiểu lầm cho thị trường về dự án này.
- Nguồn RSS chưa cung cấp thêm chi tiết về số tiền bồi thường hay thời gian cụ thể.
#BinanceSquare #CryptoNews #Blockchain #ASX
$btc $eth
#vlikevn Titanbot
Nguồn: CoinTelegraph
101

⛏️ WA Gold Launches Drilling at High-Potential Bullabulling Gold Shear Zone
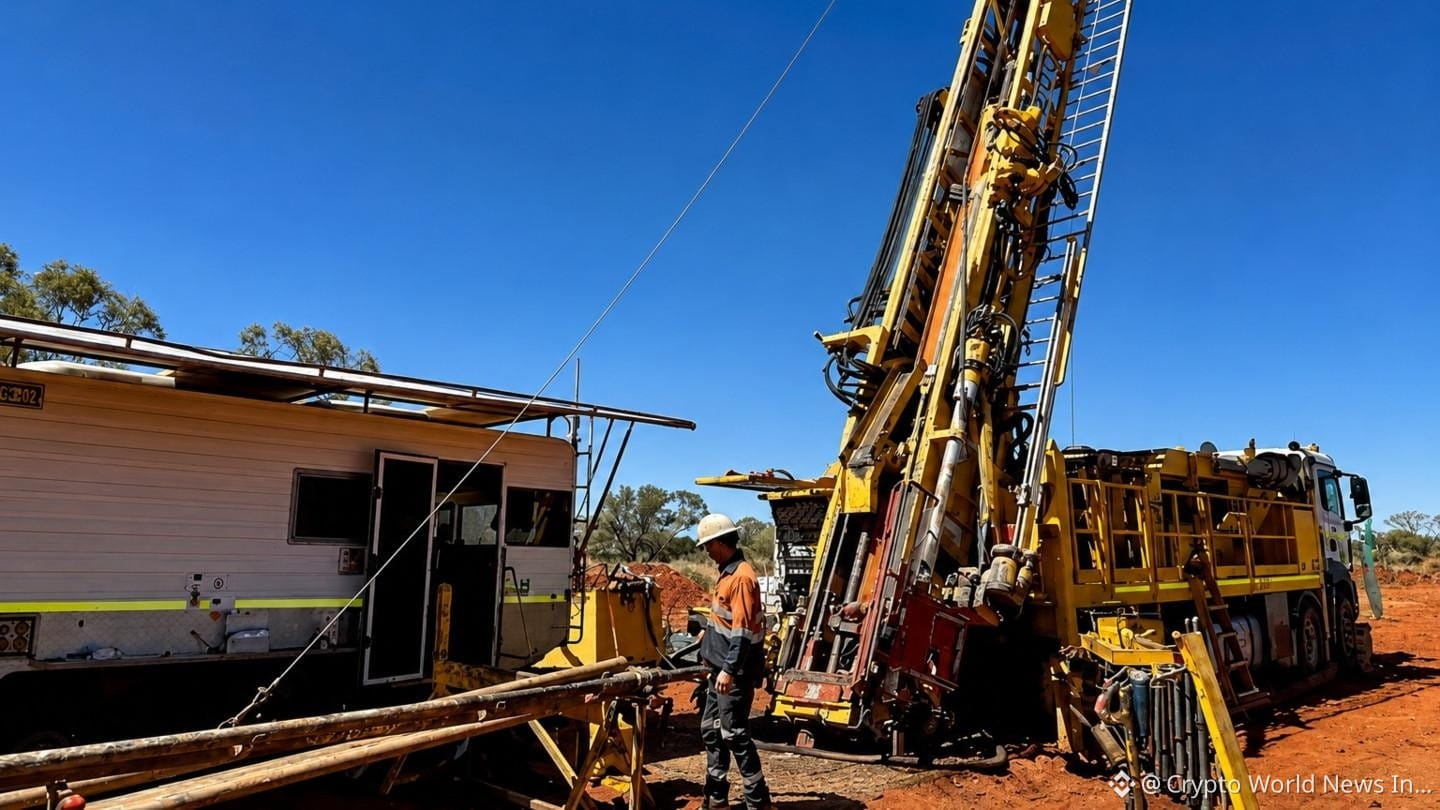
WA Gold (ASX: WAU) has begun a new drilling campaign at its Bullabulling Project in Western Australia, targeting the northern extension of one of the region's most prolific gold-bearing shear zones in a bid to unlock new discoveries.
🔹 Key Facts:
• The maiden program includes 46 aircore drill holes covering approximately 3,680 metres across eight drill lines.
• The Bullabulling Shear Zone hosts the neighboring 4.5-million-ounce Bullabulling Gold Mine, and WA Gold believes the mineralized structure extends into its tenure.
• Historical drilling in the area has returned high-grade intercepts, including 2m @ 18.1 g/t gold and 4m @ 10.12 g/t gold, supporting the project's exploration potential.
💡 Expert Insight:
Exploration success could significantly increase the project's value, but investors should remember that early-stage drilling is inherently high risk until assay results confirm the presence and scale of economic gold mineralization.
#Mining #ASX #WAGold #Bullabulling #Investing
$PAXG $XAUT $XAU
{future}(XAUUSDT)
{future}(XAUTUSDT)
{future}(PAXGUSDT)
⛏️ WA Gold Launches Drilling at High-Potential Bullabulling Gold Shear Zone
WA Gold (ASX: WAU) has begun a new drilling campaign at its Bullabulling Project in Western Australia, targeting the northern extension of one of the region's most prolific gold-bearing shear zones in a bid to unlock new discoveries.
🔹 Key Facts:
• The maiden program includes 46 aircore drill holes covering approximately 3,680 metres across eight drill lines.
• The Bullabulling Shear Zone hosts the neighboring 4.5-million-ounce Bullabulling Gold Mine, and WA Gold believes the mineralized structure extends into its tenure.
• Historical drilling in the area has returned high-grade intercepts, including 2m @ 18.1 g/t gold and 4m @ 10.12 g/t gold, supporting the project's exploration potential.
💡 Expert Insight:
Exploration success could significantly increase the project's value, but investors should remember that early-stage drilling is inherently high risk until assay results confirm the presence and scale of economic gold mineralization.
#Mining #ASX #WAGold #Bullabulling #Investing
$PAXG $XAUT $XAU
WA Gold (ASX: WAU) has begun a new drilling campaign at its Bullabulling Project in Western Australia, targeting the northern extension of one of the region's most prolific gold-bearing shear zones in a bid to unlock new discoveries.
🔹 Key Facts:
• The maiden program includes 46 aircore drill holes covering approximately 3,680 metres across eight drill lines.
• The Bullabulling Shear Zone hosts the neighboring 4.5-million-ounce Bullabulling Gold Mine, and WA Gold believes the mineralized structure extends into its tenure.
• Historical drilling in the area has returned high-grade intercepts, including 2m @ 18.1 g/t gold and 4m @ 10.12 g/t gold, supporting the project's exploration potential.
💡 Expert Insight:
Exploration success could significantly increase the project's value, but investors should remember that early-stage drilling is inherently high risk until assay results confirm the presence and scale of economic gold mineralization.
#Mining #ASX #WAGold #Bullabulling #Investing
$PAXG $XAUT $XAU
283

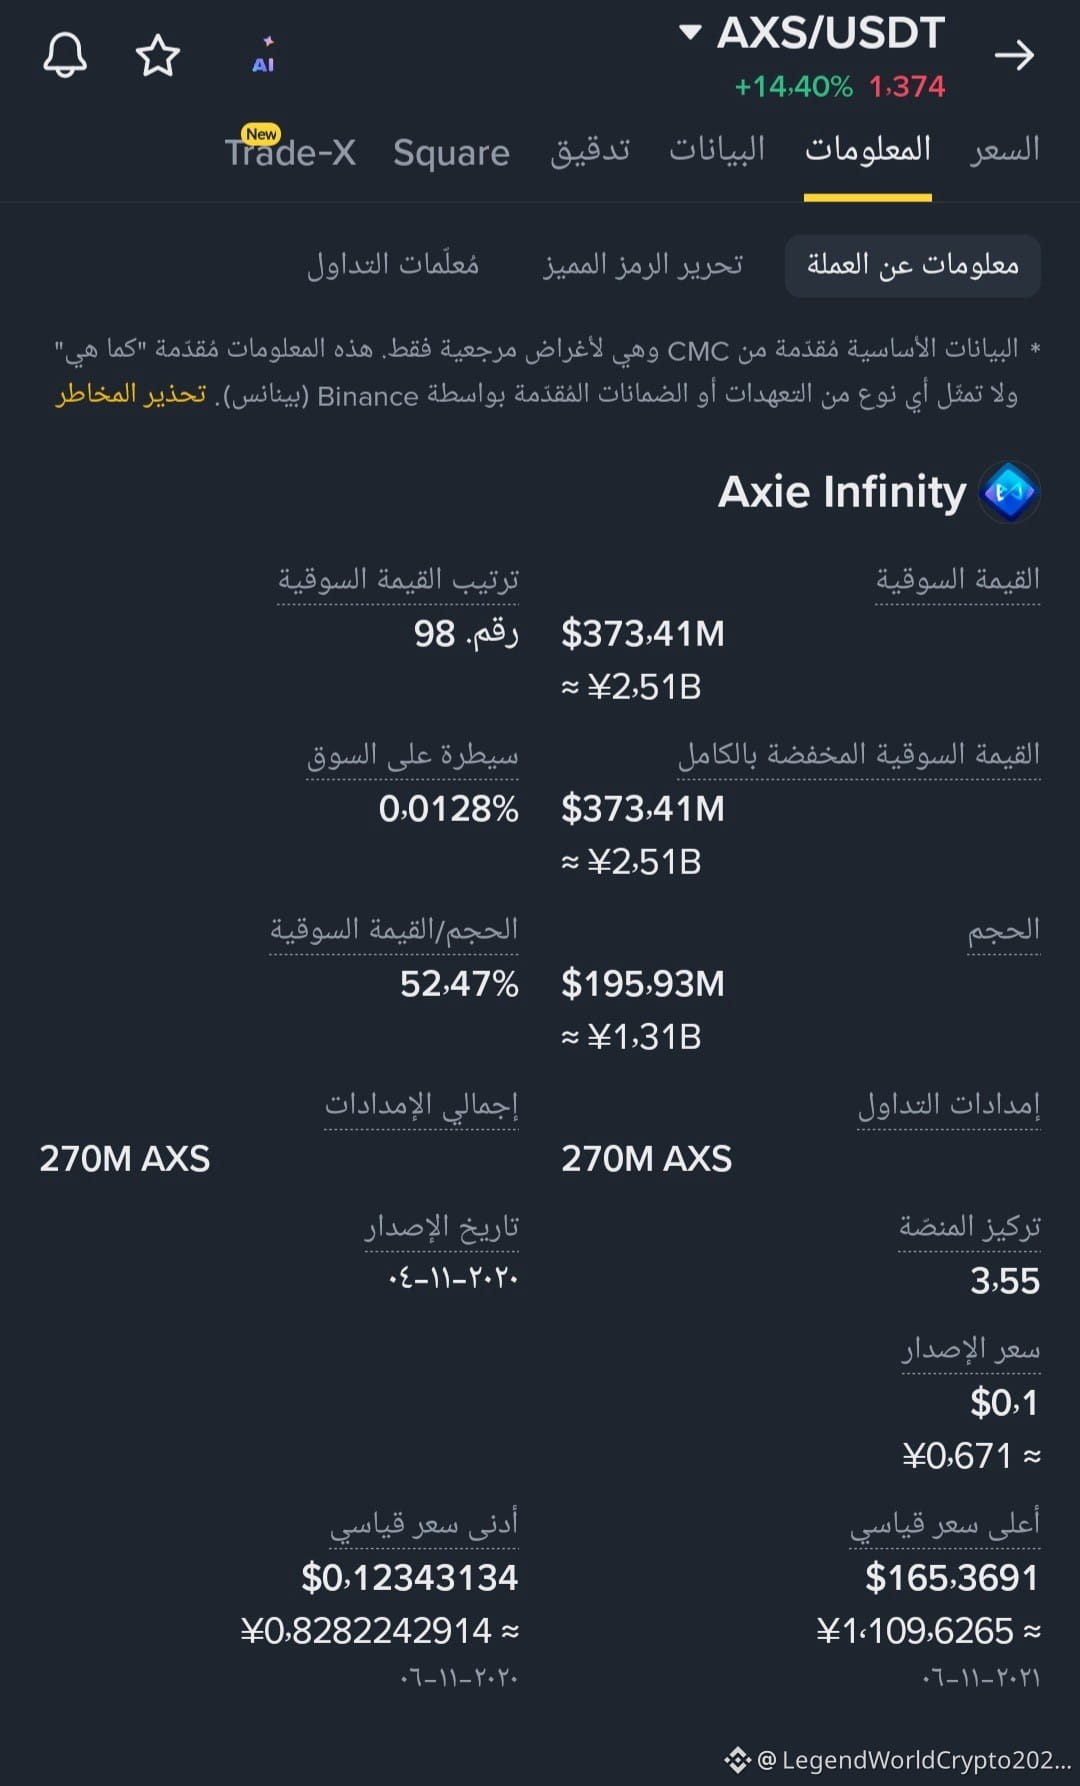
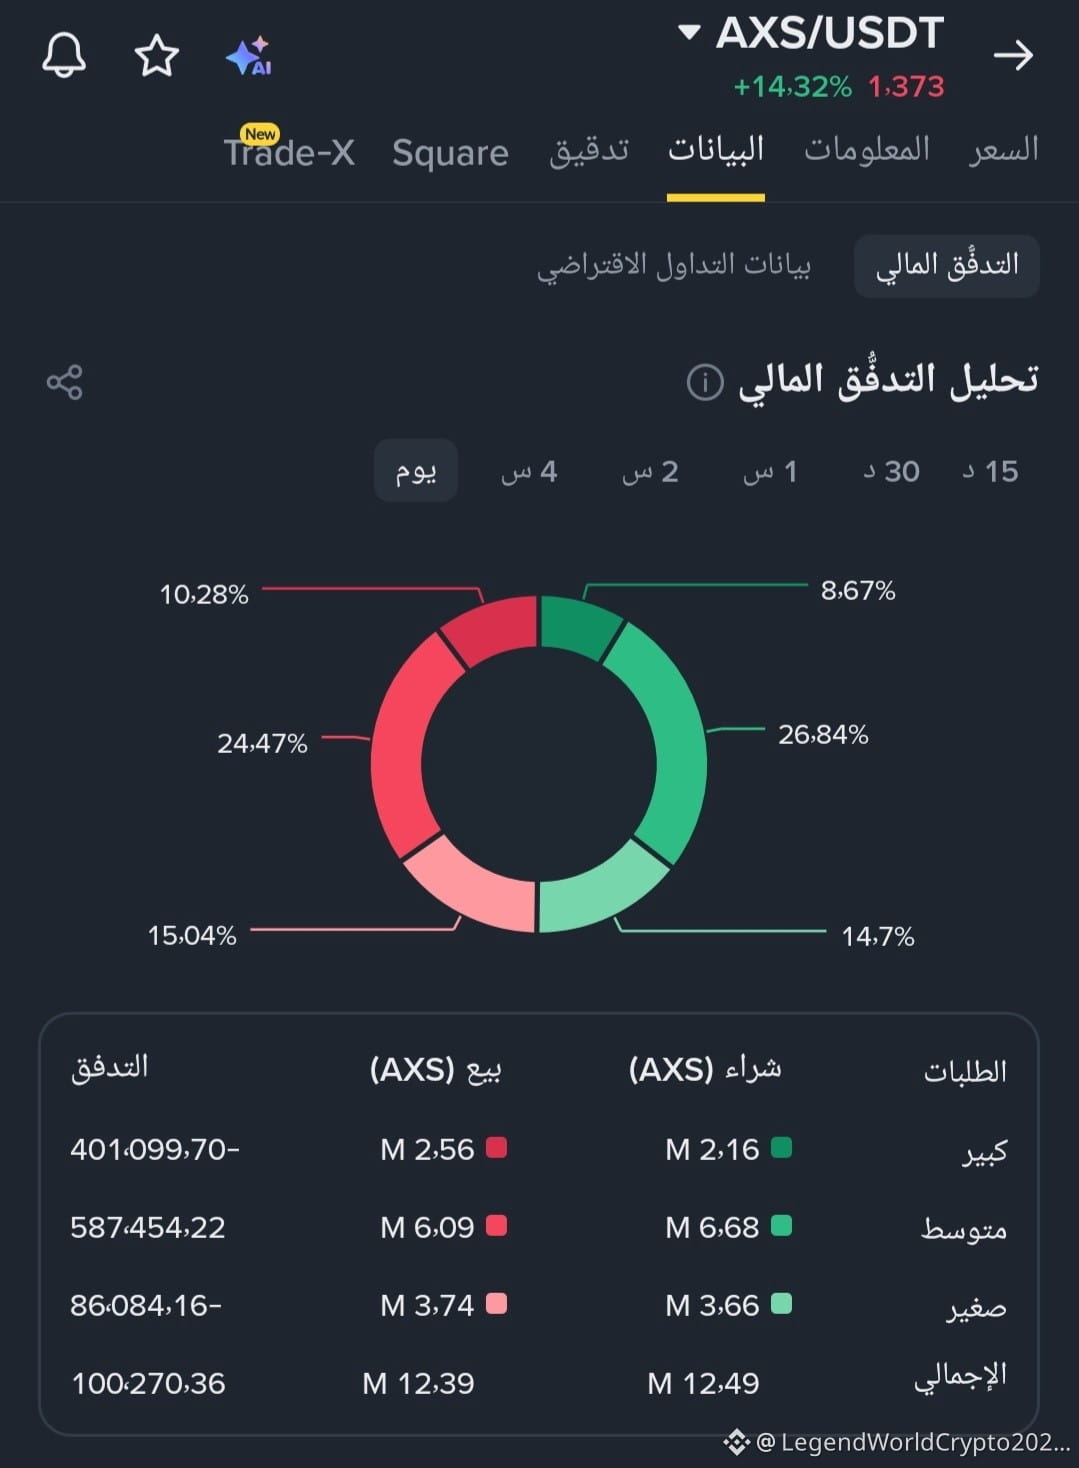
$AXS Will the Axie Infinity (AXS) bulls succeed in breaking through the resistance wall, or will they fall into the trap of a sudden correction?
{future}(AXSUSDT)
Here's a concise, professional digital summary for AXS (current price: $1.35):
🟢 1. Long Setup
Entry Zone: Between $1.25 and $1.32 (Strong structural support and retest of the accumulation bottom).
Targets (TP):
TP1: $1.48
TP2: $1.62
TP3: $1.85
Stop Loss (SL): 4-hour close below $1.15.
🔴 2. Short Setup
Entry Zone (Resistance): Between $1.55 and $1.70 (Strong supply zone and potential price rejection for speculators).
Targets (TP):
TP1: $1.40
TP2: $1.22
Stop Loss (SL): 4-hour close above $1.80.
📊 3. Technical Reasons in Brief (Rational)
Market View: The buy scenario hinges on the price rebounding from current demand zones and the bulls attempting to regain momentum after the recent consolidation. However, resistance around $1.60 suggests the potential for selling pressure and quick profit-taking, which could hinder further immediate upward movement
$AXS @Square-Creator-a204654497050 #ASX
#Legendworldcrypto2025
@LegendWorldCrypto2025
$AXS Will the Axie Infinity (AXS) bulls succeed in breaking through the resistance wall, or will they fall into the trap of a sudden correction?
Here's a concise, professional digital summary for AXS (current price: $1.35):
🟢 1. Long Setup
Entry Zone: Between $1.25 and $1.32 (Strong structural support and retest of the accumulation bottom).
Targets (TP):
TP1: $1.48
TP2: $1.62
TP3: $1.85
Stop Loss (SL): 4-hour close below $1.15.
🔴 2. Short Setup
Entry Zone (Resistance): Between $1.55 and $1.70 (Strong supply zone and potential price rejection for speculators).
Targets (TP):
TP1: $1.40
TP2: $1.22
Stop Loss (SL): 4-hour close above $1.80.
📊 3. Technical Reasons in Brief (Rational)
Market View: The buy scenario hinges on the price rebounding from current demand zones and the bulls attempting to regain momentum after the recent consolidation. However, resistance around $1.60 suggests the potential for selling pressure and quick profit-taking, which could hinder further immediate upward movement
$AXS @A X S #ASX
#Legendworldcrypto2025
@اسطورة عملات رقميه
Here's a concise, professional digital summary for AXS (current price: $1.35):
🟢 1. Long Setup
Entry Zone: Between $1.25 and $1.32 (Strong structural support and retest of the accumulation bottom).
Targets (TP):
TP1: $1.48
TP2: $1.62
TP3: $1.85
Stop Loss (SL): 4-hour close below $1.15.
🔴 2. Short Setup
Entry Zone (Resistance): Between $1.55 and $1.70 (Strong supply zone and potential price rejection for speculators).
Targets (TP):
TP1: $1.40
TP2: $1.22
Stop Loss (SL): 4-hour close above $1.80.
📊 3. Technical Reasons in Brief (Rational)
Market View: The buy scenario hinges on the price rebounding from current demand zones and the bulls attempting to regain momentum after the recent consolidation. However, resistance around $1.60 suggests the potential for selling pressure and quick profit-taking, which could hinder further immediate upward movement
$AXS @A X S #ASX
#Legendworldcrypto2025
@اسطورة عملات رقميه
40

·
--
Axie Infinity ($AXS ) remains a high-risk GameFi token that is trying to recover after a long multi-year downtrend. Recent ecosystem changes, including tokenomics adjustments and the introduction of bAXS, have reduced selling pressure and helped revive market interest.
{spot}(AXSUSDT)
attention to $AXS during GameFi rallies. could outperform many dormant gaming tokens. is still far below its historical highs, showing that long-term confidence has not fully returned.
User growth and ecosystem activity remain the key challenge; tokenomics alone may not sustain a rally. - Technical indicators have frequently shown weak or bearish trends despite short-term spikes. and deep pullbacks.
#ASX #binance #squarecreator
Axie Infinity ($AXS ) remains a high-risk GameFi token that is trying to recover after a long multi-year downtrend. Recent ecosystem changes, including tokenomics adjustments and the introduction of bAXS, have reduced selling pressure and helped revive market interest.
attention to $AXS during GameFi rallies. could outperform many dormant gaming tokens. is still far below its historical highs, showing that long-term confidence has not fully returned.
User growth and ecosystem activity remain the key challenge; tokenomics alone may not sustain a rally. - Technical indicators have frequently shown weak or bearish trends despite short-term spikes. and deep pullbacks.
#ASX #binance #squarecreator
attention to $AXS during GameFi rallies. could outperform many dormant gaming tokens. is still far below its historical highs, showing that long-term confidence has not fully returned.
User growth and ecosystem activity remain the key challenge; tokenomics alone may not sustain a rally. - Technical indicators have frequently shown weak or bearish trends despite short-term spikes. and deep pullbacks.
#ASX #binance #squarecreator
143
🚨 Pilbara Gold Extends Mt York Gold Mineralisation as Drilling Hits 50% Mark
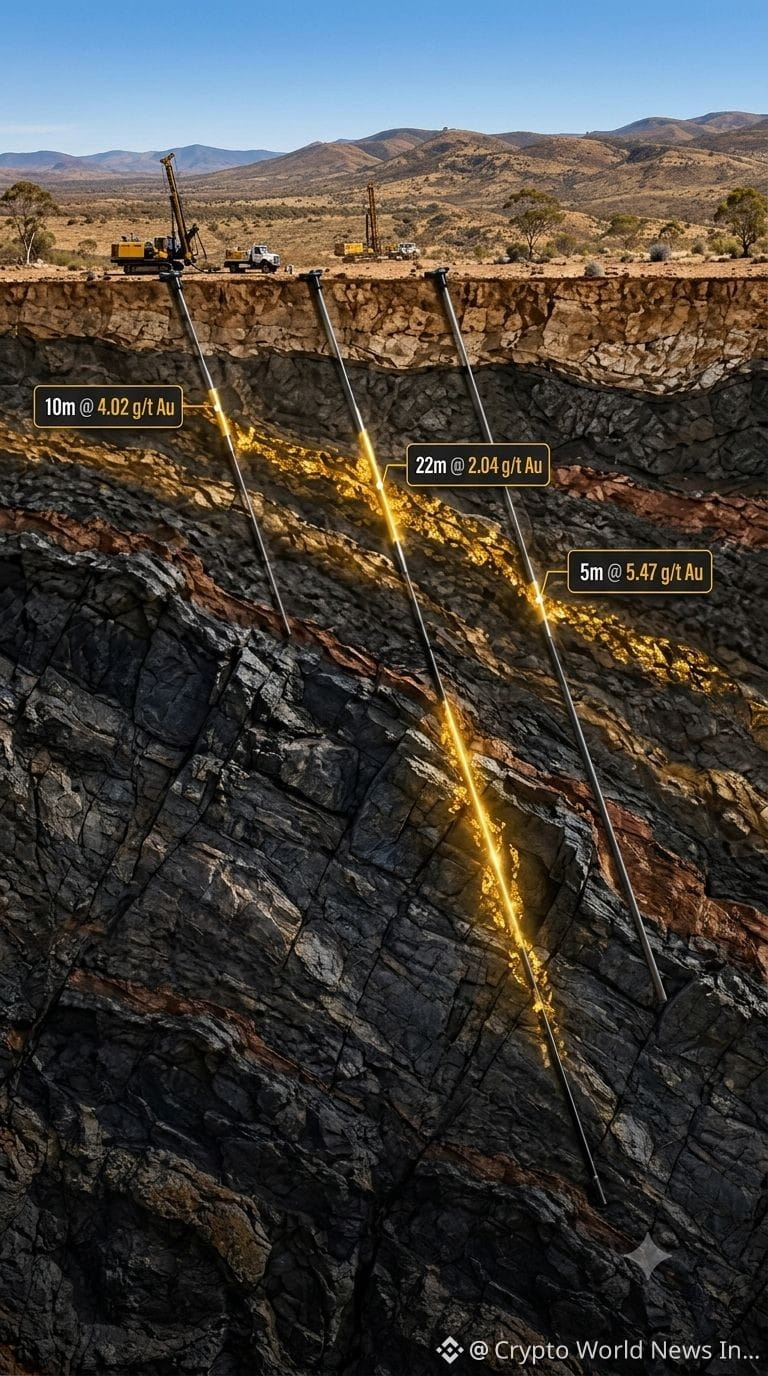
Pilbara Gold Ltd (ASX: PGL) has reported further strong drilling results from its flagship 2.1-million-ounce Mt York Gold Project in Western Australia, with mineralisation extended at depth across key areas of the project.
🔑 Key Points
• 2026 drilling program has reached the halfway mark
• New results extend gold mineralisation at Main Hill and Main Hill Extension
• Mineralisation continues below the current optimised pit shell and remains open at depth
• Around 28,635 metres of drilling has been completed from an expanded 60,000m campaign
• Five drill rigs are currently operating, with a sixth expected in September
• Results are aimed at supporting further resource growth and an updated Mineral Resource Estimate (MRE) targeted for early 2027
📊 Market Insight
The latest drilling strengthens the potential for Mt York’s existing 2.1Moz resource to grow further, while deeper mineralisation could become an important factor in the project’s future open-pit development strategy. Further assay results and the upcoming MRE could become key catalysts for ASX:PGL.
#Gold #PilbaraGold #MiningStocks #ASX #GoldMining $XAU $PAXG $XAUT
{future}(XAUTUSDT)
{future}(PAXGUSDT)
{future}(XAUUSDT)
🚨 Pilbara Gold Extends Mt York Gold Mineralisation as Drilling Hits 50% Mark
Pilbara Gold Ltd (ASX: PGL) has reported further strong drilling results from its flagship 2.1-million-ounce Mt York Gold Project in Western Australia, with mineralisation extended at depth across key areas of the project.
🔑 Key Points
• 2026 drilling program has reached the halfway mark
• New results extend gold mineralisation at Main Hill and Main Hill Extension
• Mineralisation continues below the current optimised pit shell and remains open at depth
• Around 28,635 metres of drilling has been completed from an expanded 60,000m campaign
• Five drill rigs are currently operating, with a sixth expected in September
• Results are aimed at supporting further resource growth and an updated Mineral Resource Estimate (MRE) targeted for early 2027
📊 Market Insight
The latest drilling strengthens the potential for Mt York’s existing 2.1Moz resource to grow further, while deeper mineralisation could become an important factor in the project’s future open-pit development strategy. Further assay results and the upcoming MRE could become key catalysts for ASX:PGL.
#Gold #PilbaraGold #MiningStocks #ASX #GoldMining $XAU $PAXG $XAUT
Pilbara Gold Ltd (ASX: PGL) has reported further strong drilling results from its flagship 2.1-million-ounce Mt York Gold Project in Western Australia, with mineralisation extended at depth across key areas of the project.
🔑 Key Points
• 2026 drilling program has reached the halfway mark
• New results extend gold mineralisation at Main Hill and Main Hill Extension
• Mineralisation continues below the current optimised pit shell and remains open at depth
• Around 28,635 metres of drilling has been completed from an expanded 60,000m campaign
• Five drill rigs are currently operating, with a sixth expected in September
• Results are aimed at supporting further resource growth and an updated Mineral Resource Estimate (MRE) targeted for early 2027
📊 Market Insight
The latest drilling strengthens the potential for Mt York’s existing 2.1Moz resource to grow further, while deeper mineralisation could become an important factor in the project’s future open-pit development strategy. Further assay results and the upcoming MRE could become key catalysts for ASX:PGL.
#Gold #PilbaraGold #MiningStocks #ASX #GoldMining $XAU $PAXG $XAUT
174

Войдите, чтобы посмотреть больше материала
Присоединяйтесь к пользователям криптовалют по всему миру на Binance Square
⚡️ Получайте новейшую и полезную информацию о криптоактивах.
💬 Нам доверяет крупнейшая в мире криптобиржа.
👍 Получите достоверные аналитические данные от верифицированных создателей контента.
Эл. почта/номер телефона
В тренде
1
#HuangExitNvidiaStrategyInFocus
Просмотров: 108,837
1,185 обсуждают
2
#AnthropicRejectsIPODelayValuationinQuestion
Просмотров: 719,466
5,403 обсуждают
3
#HedgeFundsCMEBitcoinNetShortsFall89%
Просмотров: 1,617
48 обсуждают
4
#BitMineReports$6.3BNetLossForFiscal2026
Просмотров: 14,082
136 обсуждают
5
#AnthropicIPOAboutSixTimesOversubscribed
Просмотров: 600
34 обсуждают
6
#SoFiExpandsSoFiUSDStablecoinToPolygon
Просмотров: 2,836
65 обсуждают
7
#TetherGoldXAUTCompletesKPMGAudit
Просмотров: 3,097
65 обсуждают
8
#ChipStocksExtendLossesAfterNvidiaCEOChange
Просмотров: 43,206
493 обсуждают
9
#TrezorConfirmsMaliciousImplantsIn3Safe5Devices
Просмотров: 966
29 обсуждают
10
#TradFiForBeginners
Просмотров: 539,720
3,758 обсуждают