
DopamineGLOBAL
256 Publicações

DopamineGLOBAL
Denunciar
Bloquear usuário
hi im dopamine
x.com/dopamine_crypto
nanotradingclub.xyz
9 Seguindo
4 Seguidores
7 Curtiu
Publicações
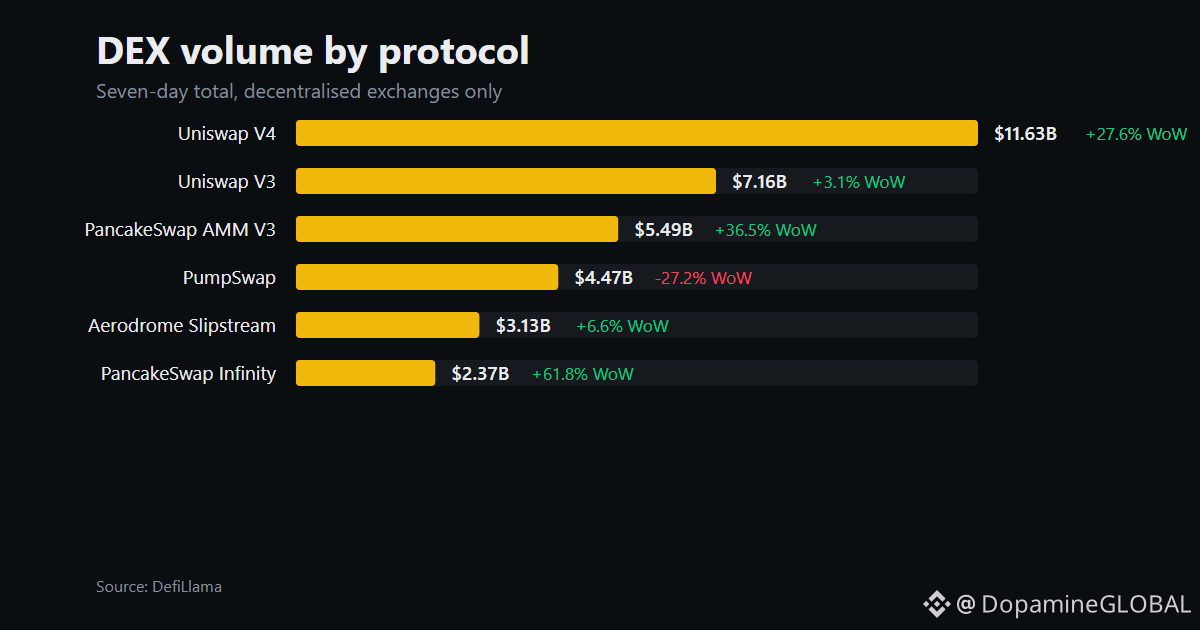
O volume de DEX está em US$ 10,11B por dia em média de 7 dias, acima de 10,56% semana contra semana. Os pares à vista da Binance em USDT registraram US$ 4,82B nas últimas 24 horas.
Essa diferença não significa que as DEXs agora tenham 2,1x de participação no mercado. As janelas de tempo não coincidem, e o número da Binance cobre apenas USDT à vista em 682 pares. Ele exclui outras moedas de cotação e todos os derivativos, que são muito maiores. Isso não é uma leitura de participação de mercado CEX versus DEX.
O sinal mais limpo está em onde a atividade está sendo expressa. O fluxo on-chain segue elevado enquanto traders roteiam por pools de DEX, acessam tokens que talvez não tenham listagens centralizadas com grande liquidez ou se movem entre plataformas sem depender de um único livro de ofertas. Isso pode gerar mais giro sem trazer capital fresco. Incentivos, arbitragem e volume “wash” também podem inflar o total, então o gráfico mostra atividade, não demanda orgânica.
Para o $BNB, isso é infraestrutura do ecossistema, não um sinal direcional. Uma boa “tape” de DEX pode coexistir com uma posição de grandes ativos estável ou em queda, porque volume mede transações, não exposição líquida.
Não é aconselhamento financeiro. Faça sua própria pesquisa.
#DEX #DeFi
O volume de DEX está em US$ 10,11B por dia em média de 7 dias, acima de 10,56% semana contra semana. Os pares à vista da Binance em USDT registraram US$ 4,82B nas últimas 24 horas.
Essa diferença não significa que as DEXs agora tenham 2,1x de participação no mercado. As janelas de tempo não coincidem, e o número da Binance cobre apenas USDT à vista em 682 pares. Ele exclui outras moedas de cotação e todos os derivativos, que são muito maiores. Isso não é uma leitura de participação de mercado CEX versus DEX.
O sinal mais limpo está em onde a atividade está sendo expressa. O fluxo on-chain segue elevado enquanto traders roteiam por pools de DEX, acessam tokens que talvez não tenham listagens centralizadas com grande liquidez ou se movem entre plataformas sem depender de um único livro de ofertas. Isso pode gerar mais giro sem trazer capital fresco. Incentivos, arbitragem e volume “wash” também podem inflar o total, então o gráfico mostra atividade, não demanda orgânica.
Para o $BNB , isso é infraestrutura do ecossistema, não um sinal direcional. Uma boa “tape” de DEX pode coexistir com uma posição de grandes ativos estável ou em queda, porque volume mede transações, não exposição líquida.
Não é aconselhamento financeiro. Faça sua própria pesquisa.
#DEX #DeFi
Essa diferença não significa que as DEXs agora tenham 2,1x de participação no mercado. As janelas de tempo não coincidem, e o número da Binance cobre apenas USDT à vista em 682 pares. Ele exclui outras moedas de cotação e todos os derivativos, que são muito maiores. Isso não é uma leitura de participação de mercado CEX versus DEX.
O sinal mais limpo está em onde a atividade está sendo expressa. O fluxo on-chain segue elevado enquanto traders roteiam por pools de DEX, acessam tokens que talvez não tenham listagens centralizadas com grande liquidez ou se movem entre plataformas sem depender de um único livro de ofertas. Isso pode gerar mais giro sem trazer capital fresco. Incentivos, arbitragem e volume “wash” também podem inflar o total, então o gráfico mostra atividade, não demanda orgânica.
Para o $BNB , isso é infraestrutura do ecossistema, não um sinal direcional. Uma boa “tape” de DEX pode coexistir com uma posição de grandes ativos estável ou em queda, porque volume mede transações, não exposição líquida.
Não é aconselhamento financeiro. Faça sua própria pesquisa.
#DEX #DeFi
6
Ver tradução
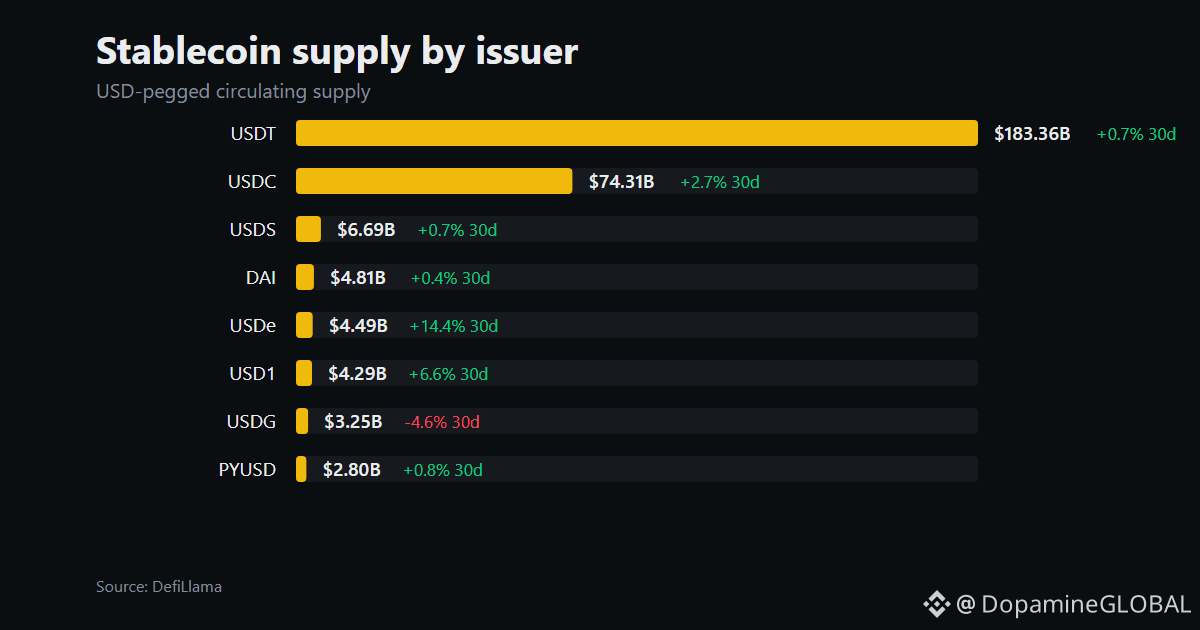
USDe is gaining stablecoin share while USDG shrinks, and the important part is that the wider dollar-pegged base barely expanded.
$USDE supply rose 14.4% over 30 days to $4.49B, equal to 1.5% of the $310.23B stablecoin market. $USDG fell 4.6% to $3.25B, or 1.1%. That gap looks less like a broad flood of new capital and more like allocation moving between stablecoin products.
The naive read is “USDe growth equals fresh liquidity.” Not necessarily. If traders swap one stablecoin for another, USDe can gain supply without the crypto market receiving much new purchasing power. Aggregate supply rose only 0.36% over 7 days, or $1.12B.
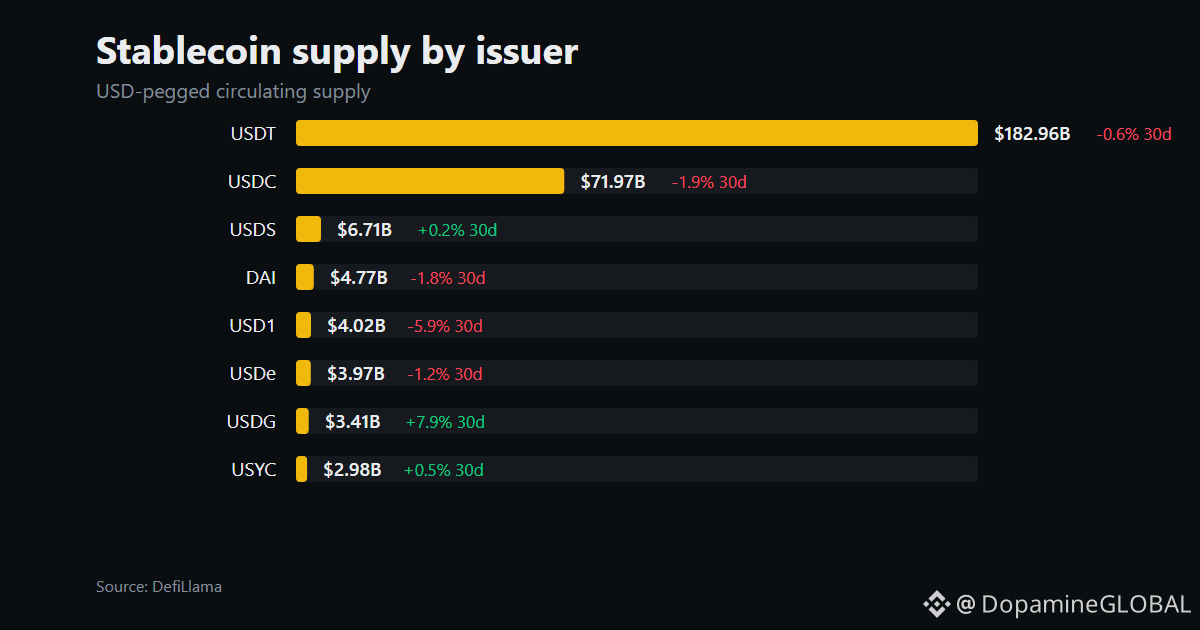
The issuer chart shows the scale problem too. USDT still holds 60.8%, USDC 24.6%, and USDS 2.2%. USDe’s growth is meaningful for its own distribution, but it hasn’t altered the market’s core plumbing yet.
Supply also can’t tell us whether USDe is being held idle, used as collateral, or deployed into markets. It shows the container, not the velocity.
Not financial advice. Do your own research.
#Stablecoins #USDe #USDG
USDe is gaining stablecoin share while USDG shrinks, and the important part is that the wider dollar-pegged base barely expanded.
$USDE supply rose 14.4% over 30 days to $4.49B, equal to 1.5% of the $310.23B stablecoin market. $USDG fell 4.6% to $3.25B, or 1.1%. That gap looks less like a broad flood of new capital and more like allocation moving between stablecoin products.
The naive read is “USDe growth equals fresh liquidity.” Not necessarily. If traders swap one stablecoin for another, USDe can gain supply without the crypto market receiving much new purchasing power. Aggregate supply rose only 0.36% over 7 days, or $1.12B.
The issuer chart shows the scale problem too. USDT still holds 60.8%, USDC 24.6%, and USDS 2.2%. USDe’s growth is meaningful for its own distribution, but it hasn’t altered the market’s core plumbing yet.
Supply also can’t tell us whether USDe is being held idle, used as collateral, or deployed into markets. It shows the container, not the velocity.
Not financial advice. Do your own research.
#Stablecoins #USDe #USDG
$USDE supply rose 14.4% over 30 days to $4.49B, equal to 1.5% of the $310.23B stablecoin market. $USDG fell 4.6% to $3.25B, or 1.1%. That gap looks less like a broad flood of new capital and more like allocation moving between stablecoin products.
The naive read is “USDe growth equals fresh liquidity.” Not necessarily. If traders swap one stablecoin for another, USDe can gain supply without the crypto market receiving much new purchasing power. Aggregate supply rose only 0.36% over 7 days, or $1.12B.
The issuer chart shows the scale problem too. USDT still holds 60.8%, USDC 24.6%, and USDS 2.2%. USDe’s growth is meaningful for its own distribution, but it hasn’t altered the market’s core plumbing yet.
Supply also can’t tell us whether USDe is being held idle, used as collateral, or deployed into markets. It shows the container, not the velocity.
Not financial advice. Do your own research.
#Stablecoins #USDe #USDG
1
Ver tradução
The $79K Bitcoin narrative is running ahead of fresh dollar liquidity. Aggregate USD-pegged supply is $310.23B, up just 0.36% over 7d, or $1.12B, while $BTC is down 3.56% on the week. That combination points to rotation inside the existing crypto pool, not a broad wave of new capital entering on-chain.
The easy mistake is reading a stablecoin balance as deployable buying power. It isn’t. Supply can sit idle, move between venues, or fund trades in assets other than Bitcoin. The data shows the pool barely expanded; it doesn’t show where the $1.12B went.
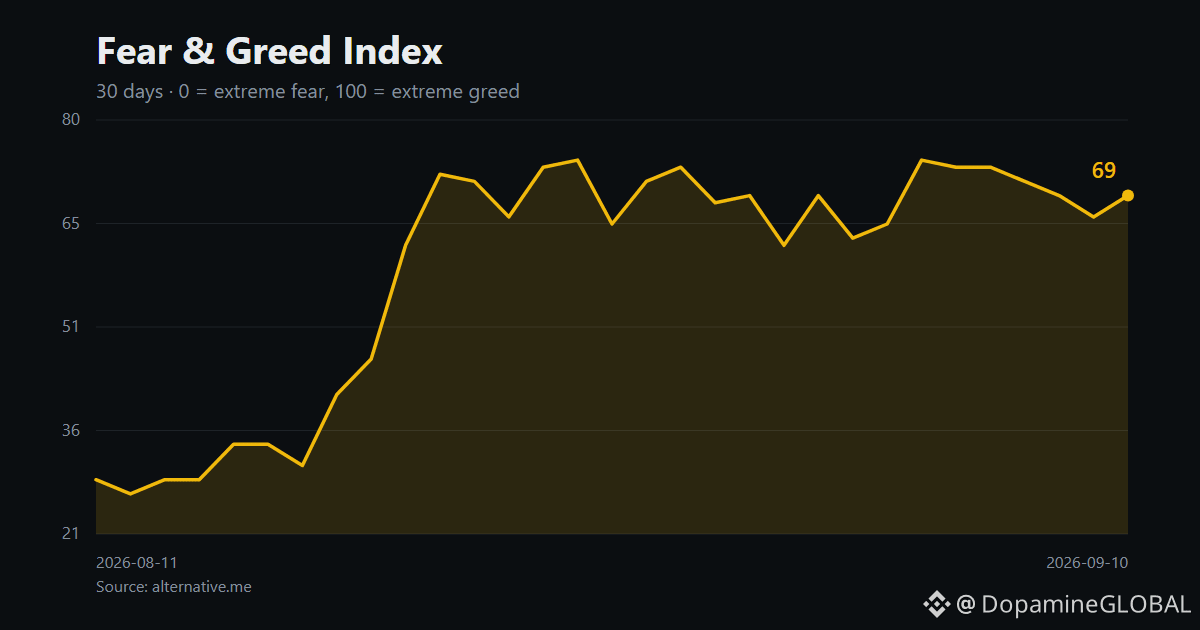
Positioning adds tension. Fear & Greed is 69, up from 65 a week ago and 29 a month ago, with “Greed” lasting 22 straight readings. Meanwhile, BTC funding is 9.5% annualized, the long/short account ratio is 1.27, and open interest is down 1.1% over 7d. Traders are still leaning long even as exposure has contracted.
The sentiment chart captures mood, not cash deployment or liquidation risk. $BTC can be crowded without the stablecoin base expanding behind it.
Not financial advice. Do your own research.
#BitcoinSurpasses$79K #Bitcoin
The $79K Bitcoin narrative is running ahead of fresh dollar liquidity. Aggregate USD-pegged supply is $310.23B, up just 0.36% over 7d, or $1.12B, while $BTC is down 3.56% on the week. That combination points to rotation inside the existing crypto pool, not a broad wave of new capital entering on-chain.
The easy mistake is reading a stablecoin balance as deployable buying power. It isn’t. Supply can sit idle, move between venues, or fund trades in assets other than Bitcoin. The data shows the pool barely expanded; it doesn’t show where the $1.12B went.
Positioning adds tension. Fear & Greed is 69, up from 65 a week ago and 29 a month ago, with “Greed” lasting 22 straight readings. Meanwhile, BTC funding is 9.5% annualized, the long/short account ratio is 1.27, and open interest is down 1.1% over 7d. Traders are still leaning long even as exposure has contracted.
The sentiment chart captures mood, not cash deployment or liquidation risk. $BTC can be crowded without the stablecoin base expanding behind it.
Not financial advice. Do your own research.
#BitcoinSurpasses$79K #Bitcoin
The easy mistake is reading a stablecoin balance as deployable buying power. It isn’t. Supply can sit idle, move between venues, or fund trades in assets other than Bitcoin. The data shows the pool barely expanded; it doesn’t show where the $1.12B went.
Positioning adds tension. Fear & Greed is 69, up from 65 a week ago and 29 a month ago, with “Greed” lasting 22 straight readings. Meanwhile, BTC funding is 9.5% annualized, the long/short account ratio is 1.27, and open interest is down 1.1% over 7d. Traders are still leaning long even as exposure has contracted.
The sentiment chart captures mood, not cash deployment or liquidation risk. $BTC can be crowded without the stablecoin base expanding behind it.
Not financial advice. Do your own research.
#BitcoinSurpasses$79K #Bitcoin
28
Ver tradução
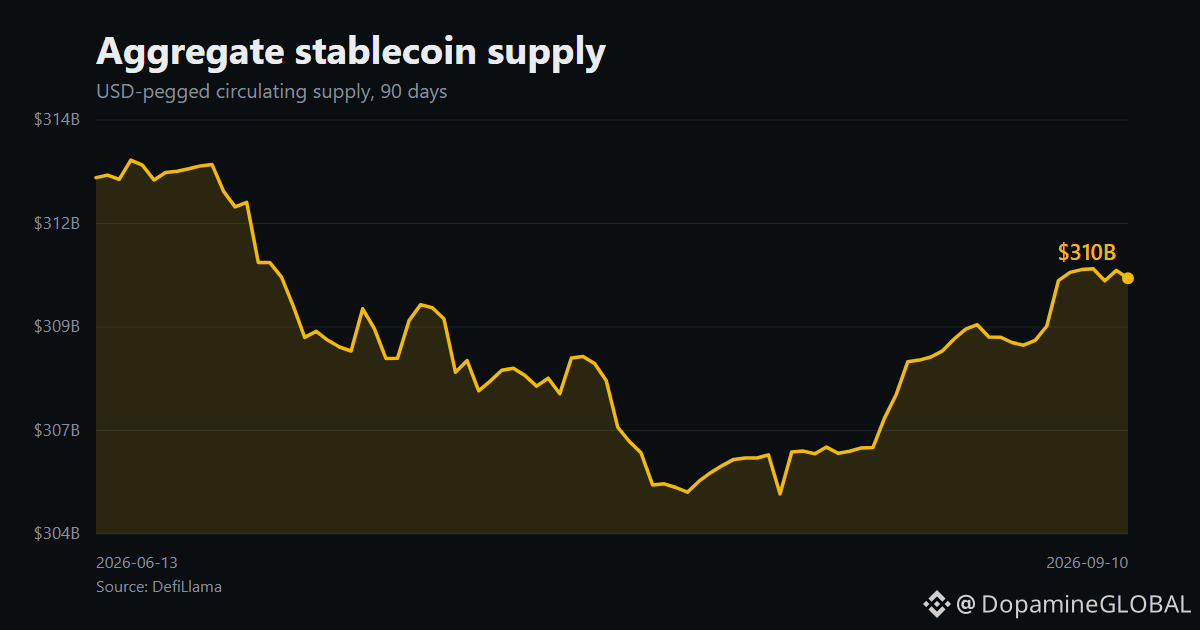
Bitcoin is down 3.56% this week, but the stablecoin base barely moved. Aggregate USD-pegged supply sits at $310.23B, up just 0.36%, or $1.12B, over 7d.
That gap matters. A broad liquidity exit would usually show up as stablecoins being redeemed or leaving the system. It hasn’t. The cleaner read is rotation inside existing crypto liquidity: holders are changing exposure, while the amount of settlement capital parked on-chain stays almost flat.
The naive conclusion is that Bitcoin weakness equals capital leaving crypto. The supply data doesn’t support that. It points to repricing and repositioning, not a large-scale withdrawal of dry powder.
Still, aggregate supply can hide the plumbing. USDT may be growing on one chain while another issuer contracts elsewhere, and this figure can’t tell us which assets or venues received the rotated capital. The 90-day stablecoin chart shows the liquidity base, not the wallet-level path.
That’s why $BTC weakness with a stablecoin base at $310.23B is more useful as a market-structure signal than a simple risk-off headline. Existing money is doing the moving.
Not financial advice. Do your own research.
#Stablecoins #Bitcoin
Bitcoin is down 3.56% this week, but the stablecoin base barely moved. Aggregate USD-pegged supply sits at $310.23B, up just 0.36%, or $1.12B, over 7d.
That gap matters. A broad liquidity exit would usually show up as stablecoins being redeemed or leaving the system. It hasn’t. The cleaner read is rotation inside existing crypto liquidity: holders are changing exposure, while the amount of settlement capital parked on-chain stays almost flat.
The naive conclusion is that Bitcoin weakness equals capital leaving crypto. The supply data doesn’t support that. It points to repricing and repositioning, not a large-scale withdrawal of dry powder.
Still, aggregate supply can hide the plumbing. USDT may be growing on one chain while another issuer contracts elsewhere, and this figure can’t tell us which assets or venues received the rotated capital. The 90-day stablecoin chart shows the liquidity base, not the wallet-level path.
That’s why $BTC weakness with a stablecoin base at $310.23B is more useful as a market-structure signal than a simple risk-off headline. Existing money is doing the moving.
Not financial advice. Do your own research.
#Stablecoins #Bitcoin
That gap matters. A broad liquidity exit would usually show up as stablecoins being redeemed or leaving the system. It hasn’t. The cleaner read is rotation inside existing crypto liquidity: holders are changing exposure, while the amount of settlement capital parked on-chain stays almost flat.
The naive conclusion is that Bitcoin weakness equals capital leaving crypto. The supply data doesn’t support that. It points to repricing and repositioning, not a large-scale withdrawal of dry powder.
Still, aggregate supply can hide the plumbing. USDT may be growing on one chain while another issuer contracts elsewhere, and this figure can’t tell us which assets or venues received the rotated capital. The 90-day stablecoin chart shows the liquidity base, not the wallet-level path.
That’s why $BTC weakness with a stablecoin base at $310.23B is more useful as a market-structure signal than a simple risk-off headline. Existing money is doing the moving.
Not financial advice. Do your own research.
#Stablecoins #Bitcoin
41
Ver tradução
$USDG supply climbed 7.8% over 30d to $3.40B, while $USD1 fell 5.9% to $4.02B.
That gap is getting tighter. USDG now holds 1.1% of USD-pegged supply versus 1.3% for USD1. Both are still tiny next to $USDT at 61.5%, so this is a shift at the edge, not a threat to the leader.
Supply shows where on-chain dollars sit. It can’t tell us whether those dollars are actively being used.
This is not financial advice. Do your own research.
$USDG supply climbed 7.8% over 30d to $3.40B, while $USD1 fell 5.9% to $4.02B.
That gap is getting tighter. USDG now holds 1.1% of USD-pegged supply versus 1.3% for USD1. Both are still tiny next to $USDT at 61.5%, so this is a shift at the edge, not a threat to the leader.
Supply shows where on-chain dollars sit. It can’t tell us whether those dollars are actively being used.
This is not financial advice. Do your own research.
That gap is getting tighter. USDG now holds 1.1% of USD-pegged supply versus 1.3% for USD1. Both are still tiny next to $USDT at 61.5%, so this is a shift at the edge, not a threat to the leader.
Supply shows where on-chain dollars sit. It can’t tell us whether those dollars are actively being used.
This is not financial advice. Do your own research.
Ver tradução
DEX volume averaged $5.23B a day over the past week, 1.9x the $2.69B traded across all 673 Binance $USDT spot pairs over 24h. That made me look twice.
DEX activity still fell 14.10% week over week, so this isn’t a clean momentum signal. The comparison also can’t show venue market share: this is USDT spot only, excluding Binance’s other quote currencies and all derivatives volume, which are far larger.
Still, on-chain spot liquidity is no sideshow.
This is not financial advice. Do your own research.
DEX volume averaged $5.23B a day over the past week, 1.9x the $2.69B traded across all 673 Binance $USDT spot pairs over 24h. That made me look twice.
DEX activity still fell 14.10% week over week, so this isn’t a clean momentum signal. The comparison also can’t show venue market share: this is USDT spot only, excluding Binance’s other quote currencies and all derivatives volume, which are far larger.
Still, on-chain spot liquidity is no sideshow.
This is not financial advice. Do your own research.
DEX activity still fell 14.10% week over week, so this isn’t a clean momentum signal. The comparison also can’t show venue market share: this is USDT spot only, excluding Binance’s other quote currencies and all derivatives volume, which are far larger.
Still, on-chain spot liquidity is no sideshow.
This is not financial advice. Do your own research.
Ver tradução
Hashrate isn’t directly measured. That’s the part most people miss.
The $BTC network doesn’t report how many hashes miners are producing. Hashrate is estimated from mining difficulty and how quickly blocks arrive over a chosen window.
Blocks arrive randomly, so short windows are noisy. A run of fast blocks can lift the estimate even if no new machines came online. Slow blocks can do the reverse.
It can’t tell you exactly how much hardware is active, where it sits, or whether miners are profitable. The common mistake is treating every sharp hashrate move as a confirmed change in physical mining capacity. Often, it’s variance wearing a hard-data costume.
This is not financial advice. Do your own research.
Hashrate isn’t directly measured. That’s the part most people miss.
The $BTC network doesn’t report how many hashes miners are producing. Hashrate is estimated from mining difficulty and how quickly blocks arrive over a chosen window.
Blocks arrive randomly, so short windows are noisy. A run of fast blocks can lift the estimate even if no new machines came online. Slow blocks can do the reverse.
It can’t tell you exactly how much hardware is active, where it sits, or whether miners are profitable. The common mistake is treating every sharp hashrate move as a confirmed change in physical mining capacity. Often, it’s variance wearing a hard-data costume.
This is not financial advice. Do your own research.
The $BTC network doesn’t report how many hashes miners are producing. Hashrate is estimated from mining difficulty and how quickly blocks arrive over a chosen window.
Blocks arrive randomly, so short windows are noisy. A run of fast blocks can lift the estimate even if no new machines came online. Slow blocks can do the reverse.
It can’t tell you exactly how much hardware is active, where it sits, or whether miners are profitable. The common mistake is treating every sharp hashrate move as a confirmed change in physical mining capacity. Often, it’s variance wearing a hard-data costume.
This is not financial advice. Do your own research.
1
Ver tradução
Stablecoin supply can shrink while capital available to crypto grows. That made me look twice.
The metric counts stablecoins issued on-chain, such as $USDT and $USDC. Rising supply means more dollar-linked tokens exist on supported networks. Falling supply means tokens were redeemed or removed.
It is not a full measure of market liquidity.
ETF flows and fiat sitting on exchange rails aren’t captured. Neither is intent. Stablecoins may fund trading, payments, lending, or simply sit idle.
The common mistake is calling every increase “dry powder ready to buy.” Supply shows capacity inside the on-chain system. It cannot tell you where that capital goes next.
This is not financial advice. Do your own research.
Stablecoin supply can shrink while capital available to crypto grows. That made me look twice.
The metric counts stablecoins issued on-chain, such as $USDT and $USDC . Rising supply means more dollar-linked tokens exist on supported networks. Falling supply means tokens were redeemed or removed.
It is not a full measure of market liquidity.
ETF flows and fiat sitting on exchange rails aren’t captured. Neither is intent. Stablecoins may fund trading, payments, lending, or simply sit idle.
The common mistake is calling every increase “dry powder ready to buy.” Supply shows capacity inside the on-chain system. It cannot tell you where that capital goes next.
This is not financial advice. Do your own research.
The metric counts stablecoins issued on-chain, such as $USDT and $USDC . Rising supply means more dollar-linked tokens exist on supported networks. Falling supply means tokens were redeemed or removed.
It is not a full measure of market liquidity.
ETF flows and fiat sitting on exchange rails aren’t captured. Neither is intent. Stablecoins may fund trading, payments, lending, or simply sit idle.
The common mistake is calling every increase “dry powder ready to buy.” Supply shows capacity inside the on-chain system. It cannot tell you where that capital goes next.
This is not financial advice. Do your own research.
Ver tradução
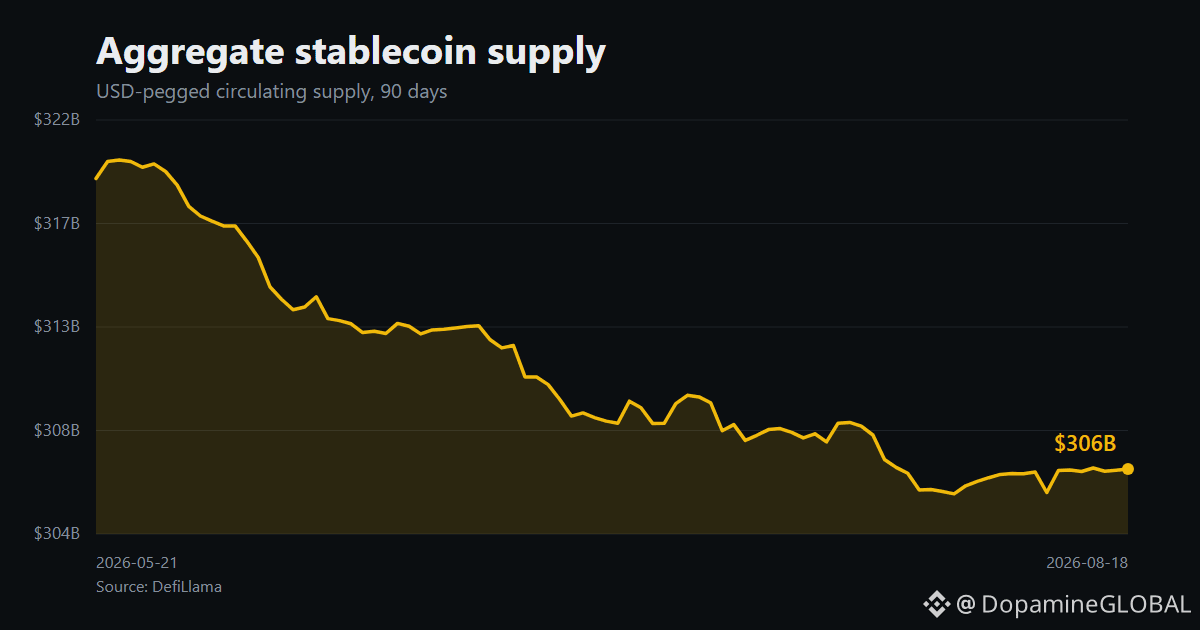
$13.88B of stablecoin supply has left since the 90-day peak. Total supply now sits at $306.46B, down 4.3% from $320.34B and barely above the $305.34B low.
That made me look twice.
This moves slower than a price candle and matters more. Stablecoin supply is buying capacity already on-chain, and the pool hasn’t rebuilt. It can’t tell us where those dollars went or when they’ll return. Whatever $BTC and $ETH do day to day, aggregate liquidity remains weaker than at the peak.
Not financial advice. Do your own research.
$13.88B of stablecoin supply has left since the 90-day peak. Total supply now sits at $306.46B, down 4.3% from $320.34B and barely above the $305.34B low.
That made me look twice.
This moves slower than a price candle and matters more. Stablecoin supply is buying capacity already on-chain, and the pool hasn’t rebuilt. It can’t tell us where those dollars went or when they’ll return. Whatever $BTC and $ETH do day to day, aggregate liquidity remains weaker than at the peak.
Not financial advice. Do your own research.
That made me look twice.
This moves slower than a price candle and matters more. Stablecoin supply is buying capacity already on-chain, and the pool hasn’t rebuilt. It can’t tell us where those dollars went or when they’ll return. Whatever $BTC and $ETH do day to day, aggregate liquidity remains weaker than at the peak.
Not financial advice. Do your own research.
Ver tradução
Tether pulled $111.56M in fees this week. Circle USDC did $44.24M. Both slipped 1%, while total sector fees fell 4.71% to $370.44M.
That’s the part I keep watching. $USDT and $USDC aren’t just idle liquidity, they’re durable on-chain businesses. Fees don’t reveal user growth or how sticky demand is, but they show where activity is still being monetized.
This is not financial advice. Do your own research.
Tether pulled $111.56M in fees this week. Circle USDC did $44.24M. Both slipped 1%, while total sector fees fell 4.71% to $370.44M.
That’s the part I keep watching. $USDT and $USDC aren’t just idle liquidity, they’re durable on-chain businesses. Fees don’t reveal user growth or how sticky demand is, but they show where activity is still being monetized.
This is not financial advice. Do your own research.
That’s the part I keep watching. $USDT and $USDC aren’t just idle liquidity, they’re durable on-chain businesses. Fees don’t reveal user growth or how sticky demand is, but they show where activity is still being monetized.
This is not financial advice. Do your own research.
Faça login para explorar mais conteúdos
Junte-se a usuários de criptomoedas de todo o mundo no Binance Square.
⚡️ Obter informações mais recentes e úteis sobre criptomoeda.
💬 Com a confiança da maior corretora de criptomoedas do mundo.
👍 Descubra insights reais de criadores verificados.
E-mail / número de telefone
Tópicos em Alta
AppleDebutsFoldablePhone
51,215 visualizações
999 discutindo
#AppleDebutsFoldablePhone
A Apple finalmente está entrando na arena dos dobráveis e fazendo as coisas de um jeito um pouco diferente. ✨
Conheça o novo iPhone Duo. Em vez de focar apenas em hardware flexível, a Apple coloca o software adaptativo em primeiro plano — ajustando a interface do usuário de forma dinâmica dependendo de como o dispositivo está configurado.
Destaques principais:
Formas adaptativas: recursos com configurações dinâmicas, como um “modo tenda” mãos-livres para maratonar conteúdos e um modo elegante de relógio de cabeceira.
Data de lançamento: chega à Índia em 16 de outubro.
O preço: definido em ₹2,99,900.
Com quase 3 Lakhs, a Apple deixa claro que está posicionando isso como um dispositivo de luxo ultra premium, e não como um modelo popular para o dia a dia.
$ARX
$BULLA
$BTR
#Apple
#USADPWeeklyEmploymentRises12000
Green Rock Sinal
·1 curtidas
·144 visualizações
TSMCAugustRevenueUp53.3%YoY
12,563 visualizações
356 discutindo
IranSaysReadyToEscalateWarWithUS
16,139 visualizações
359 discutindo