

highly skilled
14 Publicações

highly skilled
Denunciar
Bloquear usuário
baby
Trade aberto
28 dias
0 Seguindo
0 Seguidores
1 Curtiu
Publicações
Portfólio
Ver tradução
🟣$ETH
{spot}(ETHUSDT)
Current price: about $2,686. ETH is up roughly 1.1% over 24h and 7.8% over 7 days.
Technical picture:
🟢 Trend: Bullish overall
🟢 Support: $2,630, then $2,560
🔴 Resistance: $2,715–$2,800
🚀 A strong daily close above $2,800 would strengthen the breakout setup.
🎯 A technical target around $3,050 has been identified if the breakout continues.
⚠️ Below $2,560, the bullish structure becomes weaker; below $2,350–$2,360 would be a more significant warning level.
Professional read: ETH is currently in a bullish structure but facing strong resistance around $2.8K. RSI is around 63, so momentum is positive without yet being deeply overbought.
These are technical levels, not a guaranteed price prediction or financial advice.🟣 ETH — Today’s update
Current price: about $2,686. ETH is up roughly 1.1% over 24h and 7.8% over 7 days.
Technical picture:
🟢 Trend: Bullish overall
🟢 Support: $2,630, then $2,560
🔴 Resistance: $2,715–$2,800
🚀 A strong daily close above $2,800 would strengthen the breakout setup.
🟣$ETH
Current price: about $2,686. ETH is up roughly 1.1% over 24h and 7.8% over 7 days.
Technical picture:
🟢 Trend: Bullish overall
🟢 Support: $2,630, then $2,560
🔴 Resistance: $2,715–$2,800
🚀 A strong daily close above $2,800 would strengthen the breakout setup.
🎯 A technical target around $3,050 has been identified if the breakout continues.
⚠️ Below $2,560, the bullish structure becomes weaker; below $2,350–$2,360 would be a more significant warning level.
Professional read: ETH is currently in a bullish structure but facing strong resistance around $2.8K. RSI is around 63, so momentum is positive without yet being deeply overbought.
These are technical levels, not a guaranteed price prediction or financial advice.🟣 ETH — Today’s update
Current price: about $2,686. ETH is up roughly 1.1% over 24h and 7.8% over 7 days.
Technical picture:
🟢 Trend: Bullish overall
🟢 Support: $2,630, then $2,560
🔴 Resistance: $2,715–$2,800
🚀 A strong daily close above $2,800 would strengthen the breakout setup.
Current price: about $2,686. ETH is up roughly 1.1% over 24h and 7.8% over 7 days.
Technical picture:
🟢 Trend: Bullish overall
🟢 Support: $2,630, then $2,560
🔴 Resistance: $2,715–$2,800
🚀 A strong daily close above $2,800 would strengthen the breakout setup.
🎯 A technical target around $3,050 has been identified if the breakout continues.
⚠️ Below $2,560, the bullish structure becomes weaker; below $2,350–$2,360 would be a more significant warning level.
Professional read: ETH is currently in a bullish structure but facing strong resistance around $2.8K. RSI is around 63, so momentum is positive without yet being deeply overbought.
These are technical levels, not a guaranteed price prediction or financial advice.🟣 ETH — Today’s update
Current price: about $2,686. ETH is up roughly 1.1% over 24h and 7.8% over 7 days.
Technical picture:
🟢 Trend: Bullish overall
🟢 Support: $2,630, then $2,560
🔴 Resistance: $2,715–$2,800
🚀 A strong daily close above $2,800 would strengthen the breakout setup.
Ver tradução
$BTC —
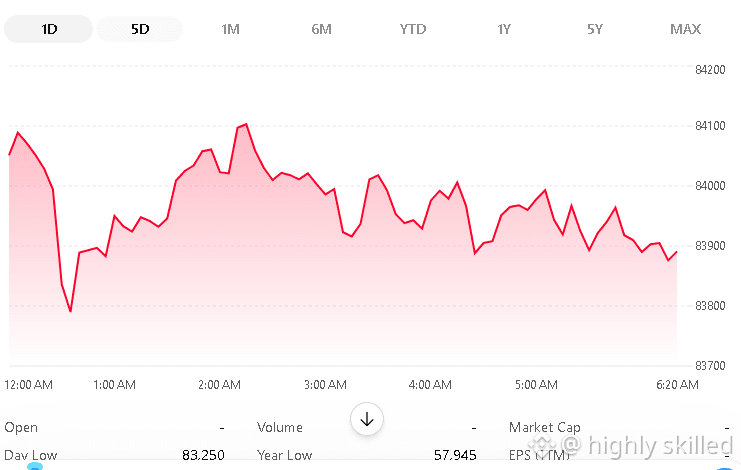
Current zone: ~$84K
Market structure: Bullish on the higher timeframe, but consolidating short-term.
BTC recently rejected around $87K, which is the major near-term resistance.
Daily technical indicators remain broadly positive: BTC is above its 50- and 200-period EMAs, while RSI is around 65, showing strong momentum but approaching an area where a pullback can occur.
U.S. spot BTC ETFs have recently seen strong inflows, supporting demand, although macro pressure from high Treasury yields remains a risk.
Key levels
LevelImportance$87,000🔴 Major resistance$85,000–86,000Resistance / breakout zone$83,000–84,000🟡 Current consolidation$82,600🟢 Important short-term support$79,500–81,000🟢 Stronger support zone
A technical forecast published yesterday identified $82,666 as an important control/support level and $85,044 as the key short-term resistance.
My technical reading
Above $87K: a confirmed breakout would materially improve the short-term structure.
Between $82.6K–$87K: likely range/consolidation; avoid assuming that every move is a breakout.
Below $82.6K: downside pressure increases, with the next areas around $81K and $79.5K becoming important.
So right now, I would describe BTC as bullish overall but not yet confirmed for another breakout. The $87K level is particularly important. $BTC
$BTC —
Current zone: ~$84K
Market structure: Bullish on the higher timeframe, but consolidating short-term.
BTC recently rejected around $87K, which is the major near-term resistance.
Daily technical indicators remain broadly positive: BTC is above its 50- and 200-period EMAs, while RSI is around 65, showing strong momentum but approaching an area where a pullback can occur.
U.S. spot BTC ETFs have recently seen strong inflows, supporting demand, although macro pressure from high Treasury yields remains a risk.
Key levels
LevelImportance$87,000🔴 Major resistance$85,000–86,000Resistance / breakout zone$83,000–84,000🟡 Current consolidation$82,600🟢 Important short-term support$79,500–81,000🟢 Stronger support zone
A technical forecast published yesterday identified $82,666 as an important control/support level and $85,044 as the key short-term resistance.
My technical reading
Above $87K: a confirmed breakout would materially improve the short-term structure.
Between $82.6K–$87K: likely range/consolidation; avoid assuming that every move is a breakout.
Below $82.6K: downside pressure increases, with the next areas around $81K and $79.5K becoming important.
So right now, I would describe BTC as bullish overall but not yet confirmed for another breakout. The $87K level is particularly important. $BTC
Current zone: ~$84K
Market structure: Bullish on the higher timeframe, but consolidating short-term.
BTC recently rejected around $87K, which is the major near-term resistance.
Daily technical indicators remain broadly positive: BTC is above its 50- and 200-period EMAs, while RSI is around 65, showing strong momentum but approaching an area where a pullback can occur.
U.S. spot BTC ETFs have recently seen strong inflows, supporting demand, although macro pressure from high Treasury yields remains a risk.
Key levels
LevelImportance$87,000🔴 Major resistance$85,000–86,000Resistance / breakout zone$83,000–84,000🟡 Current consolidation$82,600🟢 Important short-term support$79,500–81,000🟢 Stronger support zone
A technical forecast published yesterday identified $82,666 as an important control/support level and $85,044 as the key short-term resistance.
My technical reading
Above $87K: a confirmed breakout would materially improve the short-term structure.
Between $82.6K–$87K: likely range/consolidation; avoid assuming that every move is a breakout.
Below $82.6K: downside pressure increases, with the next areas around $81K and $79.5K becoming important.
So right now, I would describe BTC as bullish overall but not yet confirmed for another breakout. The $87K level is particularly important. $BTC
8
Dogecoin (DOGE)
cerca de US$ 0,098. O DOGE continua sendo uma criptomoeda altamente especulativa e movida principalmente pelo sentimento do mercado.
Ponto forte: enorme reconhecimento de marca, grande comunidade, alta liquidez e longa história no mercado.
Oferta: o DOGE não tem uma oferta máxima fixa; novas moedas continuam a entrar em circulação.
Atividade recente: grandes endereços acumularam cerca de 240 milhões de DOGE em um período reportado de cinco dias, embora as movimentações das carteiras não necessariamente comprovem uma intenção de alta.
Demanda por ETF: os ETFs de DOGE dos EUA tiveram entradas líquidas relativamente limitadas; a CoinDesk informou apenas um pouco mais de US$ 12 milhões em entradas acumuladas em três fundos monitorados ao longo de quase 10 meses, e a Bitwise anunciou planos para fechar seu fundo BWOW.
Risco principal: a avaliação do DOGE é fortemente influenciada pelo sentimento do mercado e pela demanda especulativa, enquanto a emissão contínua cria oferta adicional.
Principais níveis a observar: análises técnicas recentes identificaram aproximadamente US$ 0,093–US$ 0,094 como suporte e US$ 0,10 como uma área de resistência importante.
Em uma linha: o DOGE pode se mover muito rapidamente quando o sentimento de cripto/moeda meme fica forte, mas seus fundamentos e a oferta de tokens o tornam substancialmente mais especulativo do que ativos como BTC ou SOL. $DOGE
{spot}(DOGEUSDT)
Dogecoin (DOGE)
cerca de US$ 0,098. O DOGE continua sendo uma criptomoeda altamente especulativa e movida principalmente pelo sentimento do mercado.
Ponto forte: enorme reconhecimento de marca, grande comunidade, alta liquidez e longa história no mercado.
Oferta: o DOGE não tem uma oferta máxima fixa; novas moedas continuam a entrar em circulação.
Atividade recente: grandes endereços acumularam cerca de 240 milhões de DOGE em um período reportado de cinco dias, embora as movimentações das carteiras não necessariamente comprovem uma intenção de alta.
Demanda por ETF: os ETFs de DOGE dos EUA tiveram entradas líquidas relativamente limitadas; a CoinDesk informou apenas um pouco mais de US$ 12 milhões em entradas acumuladas em três fundos monitorados ao longo de quase 10 meses, e a Bitwise anunciou planos para fechar seu fundo BWOW.
Risco principal: a avaliação do DOGE é fortemente influenciada pelo sentimento do mercado e pela demanda especulativa, enquanto a emissão contínua cria oferta adicional.
Principais níveis a observar: análises técnicas recentes identificaram aproximadamente US$ 0,093–US$ 0,094 como suporte e US$ 0,10 como uma área de resistência importante.
Em uma linha: o DOGE pode se mover muito rapidamente quando o sentimento de cripto/moeda meme fica forte, mas seus fundamentos e a oferta de tokens o tornam substancialmente mais especulativo do que ativos como BTC ou SOL. $DOGE
cerca de US$ 0,098. O DOGE continua sendo uma criptomoeda altamente especulativa e movida principalmente pelo sentimento do mercado.
Ponto forte: enorme reconhecimento de marca, grande comunidade, alta liquidez e longa história no mercado.
Oferta: o DOGE não tem uma oferta máxima fixa; novas moedas continuam a entrar em circulação.
Atividade recente: grandes endereços acumularam cerca de 240 milhões de DOGE em um período reportado de cinco dias, embora as movimentações das carteiras não necessariamente comprovem uma intenção de alta.
Demanda por ETF: os ETFs de DOGE dos EUA tiveram entradas líquidas relativamente limitadas; a CoinDesk informou apenas um pouco mais de US$ 12 milhões em entradas acumuladas em três fundos monitorados ao longo de quase 10 meses, e a Bitwise anunciou planos para fechar seu fundo BWOW.
Risco principal: a avaliação do DOGE é fortemente influenciada pelo sentimento do mercado e pela demanda especulativa, enquanto a emissão contínua cria oferta adicional.
Principais níveis a observar: análises técnicas recentes identificaram aproximadamente US$ 0,093–US$ 0,094 como suporte e US$ 0,10 como uma área de resistência importante.
Em uma linha: o DOGE pode se mover muito rapidamente quando o sentimento de cripto/moeda meme fica forte, mas seus fundamentos e a oferta de tokens o tornam substancialmente mais especulativo do que ativos como BTC ou SOL. $DOGE
15
Ver tradução
TRON (TRX) — short analysis
Current price: about $0.338.
Main strength: TRON has become a major USDT/stablecoin settlement network. It currently carries more than $94B of USDT, and cumulative network transaction volume recently passed $30T.
Adoption: TRON has more than 405M accounts and over 15B transactions, showing substantial network usage.
Institutional catalyst: The Canary Staked TRX ETF (TRXS) launched in the U.S. in September 2026, providing regulated market exposure to TRX.
Risk: TRX's value is heavily connected to stablecoin activity on TRON, while governance is relatively concentrated. Competition from Ethereum, Solana and other payment/stablecoin networks is another risk.
Tokenomics: TRX has a burn mechanism, but recent TRONSCAN data shows net supply increases on several recent days, so it's better not to assume TRX is automatically deflationary.
In one sentence: TRX has a strong real-world use case around USDT transfers and stablecoin payments, but its price still depends on broader crypto demand and continued network adoption.
If you're comparing TRX vs SOL vs XRP, I can give you a concise fundamental comparison. $TRX
{spot}(TRXUSDT)
TRON (TRX) — short analysis
Current price: about $0.338.
Main strength: TRON has become a major USDT/stablecoin settlement network. It currently carries more than $94B of USDT, and cumulative network transaction volume recently passed $30T.
Adoption: TRON has more than 405M accounts and over 15B transactions, showing substantial network usage.
Institutional catalyst: The Canary Staked TRX ETF (TRXS) launched in the U.S. in September 2026, providing regulated market exposure to TRX.
Risk: TRX's value is heavily connected to stablecoin activity on TRON, while governance is relatively concentrated. Competition from Ethereum, Solana and other payment/stablecoin networks is another risk.
Tokenomics: TRX has a burn mechanism, but recent TRONSCAN data shows net supply increases on several recent days, so it's better not to assume TRX is automatically deflationary.
In one sentence: TRX has a strong real-world use case around USDT transfers and stablecoin payments, but its price still depends on broader crypto demand and continued network adoption.
If you're comparing TRX vs SOL vs XRP, I can give you a concise fundamental comparison. $TRX
Current price: about $0.338.
Main strength: TRON has become a major USDT/stablecoin settlement network. It currently carries more than $94B of USDT, and cumulative network transaction volume recently passed $30T.
Adoption: TRON has more than 405M accounts and over 15B transactions, showing substantial network usage.
Institutional catalyst: The Canary Staked TRX ETF (TRXS) launched in the U.S. in September 2026, providing regulated market exposure to TRX.
Risk: TRX's value is heavily connected to stablecoin activity on TRON, while governance is relatively concentrated. Competition from Ethereum, Solana and other payment/stablecoin networks is another risk.
Tokenomics: TRX has a burn mechanism, but recent TRONSCAN data shows net supply increases on several recent days, so it's better not to assume TRX is automatically deflationary.
In one sentence: TRX has a strong real-world use case around USDT transfers and stablecoin payments, but its price still depends on broader crypto demand and continued network adoption.
If you're comparing TRX vs SOL vs XRP, I can give you a concise fundamental comparison. $TRX
3
Ver tradução
Solana (SOL) —
SOL is a high-beta Layer-1 crypto asset: unlike USDT/USDC, its value depends heavily on Solana network adoption, activity, and overall crypto-market demand.
Current price: around $117 on Sept. 25–26, 2026.
Network activity: Solana recently surpassed 5 billion monthly on-chain transactions, indicating strong usage.
Technology: Solana recently reduced target slot time from 300ms to 250ms, improving update/finality speed, although this change doesn't increase transaction capacity.
Catalyst: The ecosystem is pushing further into payments, stablecoins, tokenized assets and institutional adoption.
Risk: SOL is considerably more volatile than stablecoins, and its price can fall sharply when broader crypto sentiment weakens.
Short-term technical picture: Around $100–$106 is an important support/resistance area cited by recent technical analysis; holding above it would keep the recent recovery structure intact, while losing ~$100 would weaken that setup.
Bottom line: SOL has strong network activity and an expanding ecosystem, but it remains a high-risk/high-volatility asset. It is fundamentally very different from USDT/USDC: you're buying exposure to the growth and economics of the Solana network, not a dollar substitute.
$SOL
{spot}(SOLUSDT)
Solana (SOL) —
SOL is a high-beta Layer-1 crypto asset: unlike USDT/USDC, its value depends heavily on Solana network adoption, activity, and overall crypto-market demand.
Current price: around $117 on Sept. 25–26, 2026.
Network activity: Solana recently surpassed 5 billion monthly on-chain transactions, indicating strong usage.
Technology: Solana recently reduced target slot time from 300ms to 250ms, improving update/finality speed, although this change doesn't increase transaction capacity.
Catalyst: The ecosystem is pushing further into payments, stablecoins, tokenized assets and institutional adoption.
Risk: SOL is considerably more volatile than stablecoins, and its price can fall sharply when broader crypto sentiment weakens.
Short-term technical picture: Around $100–$106 is an important support/resistance area cited by recent technical analysis; holding above it would keep the recent recovery structure intact, while losing ~$100 would weaken that setup.
Bottom line: SOL has strong network activity and an expanding ecosystem, but it remains a high-risk/high-volatility asset. It is fundamentally very different from USDT/USDC: you're buying exposure to the growth and economics of the Solana network, not a dollar substitute.
$SOL
SOL is a high-beta Layer-1 crypto asset: unlike USDT/USDC, its value depends heavily on Solana network adoption, activity, and overall crypto-market demand.
Current price: around $117 on Sept. 25–26, 2026.
Network activity: Solana recently surpassed 5 billion monthly on-chain transactions, indicating strong usage.
Technology: Solana recently reduced target slot time from 300ms to 250ms, improving update/finality speed, although this change doesn't increase transaction capacity.
Catalyst: The ecosystem is pushing further into payments, stablecoins, tokenized assets and institutional adoption.
Risk: SOL is considerably more volatile than stablecoins, and its price can fall sharply when broader crypto sentiment weakens.
Short-term technical picture: Around $100–$106 is an important support/resistance area cited by recent technical analysis; holding above it would keep the recent recovery structure intact, while losing ~$100 would weaken that setup.
Bottom line: SOL has strong network activity and an expanding ecosystem, but it remains a high-risk/high-volatility asset. It is fundamentally very different from USDT/USDC: you're buying exposure to the growth and economics of the Solana network, not a dollar substitute.
$SOL
USDC (USD Coin) O USDC é uma stablecoin lastreada ao dólar americano emitida pela Circle Internet Group. Assim como o USDT, seu objetivo é permanecer por volta de US$ 1; portanto, em geral, você não deveria comprar USDC esperando valorização do preço.
Em 21 de setembro de 2026, a Circle informou cerca de US$ 74,6 bilhões em USDC em circulação.
Por que o USDC é interessante
1. Estrutura de reservas
A Circle afirma que o USDC é lastreado 100% por caixa altamente líquido e ativos equivalentes a caixa. A maior parte das reservas é mantida por meio do Circle Reserve Fund, um fundo de mercado monetário governamental que pode deter Treasuries dos EUA de curto prazo, operações compromissadas (repos) overnight de Treasuries e caixa.
2. Transparência
A Circle diz que fornece divulgações semanais das reservas e recebe, mensalmente, uma verificação de terceiros de uma empresa de auditoria “Big Four”. Isso é uma parte importante para avaliar o risco das stablecoins.
3. Adoção em crescimento
A Circle informou que a circulação de USDC atingiu US$ 73,3 bilhões no fim do 2º trimestre de 2026, alta de 19% em relação ao ano anterior. No mesmo período, o volume de transações on-chain do 2º trimestre chegou a US$ 14,8 trilhões, alta de 151% em relação ao ano anterior.
4. Posição regulatória
A Lei U.S. GENIUS Act estabeleceu uma estrutura federal para stablecoins. A Circle afirma que o USDC foi projetado para atender a essa estrutura e enfatiza sua emissão regulada e sua estrutura de reservas.
USDC vs USDT
USDCUSDTMetaUS$ 1US$ 1EmissorCircleTetherUso principalLiquidez/pagamentos em dólarLiquidez para negociação em dólarTransparência das reservasAltaAlta, mas com estrutura diferentePosicionamento regulatório dos EUAForteMais complexoTamanho do ecossistemaMuito grandeEm geral, maiorPotencial de crescimento de preçoPraticamente nenhumPraticamente nenhumPrincipal riscoRisco da Circle/regulatório/bancárioRisco da Tether/reserva/regulatório
O ponto importante
$USDC
{spot}(USDCUSDT)
USDC (USD Coin) O USDC é uma stablecoin lastreada ao dólar americano emitida pela Circle Internet Group. Assim como o USDT, seu objetivo é permanecer por volta de US$ 1; portanto, em geral, você não deveria comprar USDC esperando valorização do preço.
Em 21 de setembro de 2026, a Circle informou cerca de US$ 74,6 bilhões em USDC em circulação.
Por que o USDC é interessante
1. Estrutura de reservas
A Circle afirma que o USDC é lastreado 100% por caixa altamente líquido e ativos equivalentes a caixa. A maior parte das reservas é mantida por meio do Circle Reserve Fund, um fundo de mercado monetário governamental que pode deter Treasuries dos EUA de curto prazo, operações compromissadas (repos) overnight de Treasuries e caixa.
2. Transparência
A Circle diz que fornece divulgações semanais das reservas e recebe, mensalmente, uma verificação de terceiros de uma empresa de auditoria “Big Four”. Isso é uma parte importante para avaliar o risco das stablecoins.
3. Adoção em crescimento
A Circle informou que a circulação de USDC atingiu US$ 73,3 bilhões no fim do 2º trimestre de 2026, alta de 19% em relação ao ano anterior. No mesmo período, o volume de transações on-chain do 2º trimestre chegou a US$ 14,8 trilhões, alta de 151% em relação ao ano anterior.
4. Posição regulatória
A Lei U.S. GENIUS Act estabeleceu uma estrutura federal para stablecoins. A Circle afirma que o USDC foi projetado para atender a essa estrutura e enfatiza sua emissão regulada e sua estrutura de reservas.
USDC vs USDT
USDCUSDTMetaUS$ 1US$ 1EmissorCircleTetherUso principalLiquidez/pagamentos em dólarLiquidez para negociação em dólarTransparência das reservasAltaAlta, mas com estrutura diferentePosicionamento regulatório dos EUAForteMais complexoTamanho do ecossistemaMuito grandeEm geral, maiorPotencial de crescimento de preçoPraticamente nenhumPraticamente nenhumPrincipal riscoRisco da Circle/regulatório/bancárioRisco da Tether/reserva/regulatório
O ponto importante
$USDC
Em 21 de setembro de 2026, a Circle informou cerca de US$ 74,6 bilhões em USDC em circulação.
Por que o USDC é interessante
1. Estrutura de reservas
A Circle afirma que o USDC é lastreado 100% por caixa altamente líquido e ativos equivalentes a caixa. A maior parte das reservas é mantida por meio do Circle Reserve Fund, um fundo de mercado monetário governamental que pode deter Treasuries dos EUA de curto prazo, operações compromissadas (repos) overnight de Treasuries e caixa.
2. Transparência
A Circle diz que fornece divulgações semanais das reservas e recebe, mensalmente, uma verificação de terceiros de uma empresa de auditoria “Big Four”. Isso é uma parte importante para avaliar o risco das stablecoins.
3. Adoção em crescimento
A Circle informou que a circulação de USDC atingiu US$ 73,3 bilhões no fim do 2º trimestre de 2026, alta de 19% em relação ao ano anterior. No mesmo período, o volume de transações on-chain do 2º trimestre chegou a US$ 14,8 trilhões, alta de 151% em relação ao ano anterior.
4. Posição regulatória
A Lei U.S. GENIUS Act estabeleceu uma estrutura federal para stablecoins. A Circle afirma que o USDC foi projetado para atender a essa estrutura e enfatiza sua emissão regulada e sua estrutura de reservas.
USDC vs USDT
USDCUSDTMetaUS$ 1US$ 1EmissorCircleTetherUso principalLiquidez/pagamentos em dólarLiquidez para negociação em dólarTransparência das reservasAltaAlta, mas com estrutura diferentePosicionamento regulatório dos EUAForteMais complexoTamanho do ecossistemaMuito grandeEm geral, maiorPotencial de crescimento de preçoPraticamente nenhumPraticamente nenhumPrincipal riscoRisco da Circle/regulatório/bancárioRisco da Tether/reserva/regulatório
O ponto importante
$USDC
Ver tradução
XRP analysis — September 26, 2026
XRP is currently around $1.55–$1.60. Recent trading has been stronger, with XRP testing the $1.60 resistance after recovering from the ~$1.00 area earlier in the year. FXStreet+1
Key levels
$1.50–$1.53: near-term support
$1.60: major immediate resistance
$1.65–$1.70: next resistance / recent high area
$2.00: major psychological resistance
$1.40: important downside level
$1.30–$1.35: deeper support area
A current technical report says XRP remains constructive above roughly $1.53, while another identifies $1.60 as a significant supply/resistance area. CryptoRank+1
What could move XRP
Positive factors
U.S.-listed spot XRP ETFs have recently recorded several consecutive days of inflows; one report put cumulative inflows at about $53M through Sept. 24. FXStreet
XRP's recovery from ~$1 toward $1.60 has restored bullish momentum.
XRP Ledger development and institutional adoption remain important longer-term factors. CoinDesk
Risks
Failure to break $1.60–$1.70 could result in another consolidation/pullback.
Crypto-wide volatility remains high.
There is an important debate about how much Ripple's business growth translates into actual XRP demand; Ripple CEO Brad Garlinghouse recently said stablecoins can be preferable for some payment use cases. 24/7 Wall St.
Simple chart view
Bullish scenario:
$1.53 → $1.60 → $1.70 → $2.00
Bearish scenario:
$1.53 ❌ → $1.40 → $1.30
The most important thing I'd watch right now is whether XRP can establish a daily close above $1.60 and then challenge $1.70. A rejection around $1.60 would make the $1.50/$1.40 levels more important.
If you want, I can also make you a visual XRP chart showing entry/support/resistance + bullish/bearish zones, similar to the picture you asked about earlier. $XRP
{spot}(XRPUSDT)
XRP analysis — September 26, 2026
XRP is currently around $1.55–$1.60. Recent trading has been stronger, with XRP testing the $1.60 resistance after recovering from the ~$1.00 area earlier in the year. FXStreet+1
Key levels
$1.50–$1.53: near-term support
$1.60: major immediate resistance
$1.65–$1.70: next resistance / recent high area
$2.00: major psychological resistance
$1.40: important downside level
$1.30–$1.35: deeper support area
A current technical report says XRP remains constructive above roughly $1.53, while another identifies $1.60 as a significant supply/resistance area. CryptoRank+1
What could move XRP
Positive factors
U.S.-listed spot XRP ETFs have recently recorded several consecutive days of inflows; one report put cumulative inflows at about $53M through Sept. 24. FXStreet
XRP's recovery from ~$1 toward $1.60 has restored bullish momentum.
XRP Ledger development and institutional adoption remain important longer-term factors. CoinDesk
Risks
Failure to break $1.60–$1.70 could result in another consolidation/pullback.
Crypto-wide volatility remains high.
There is an important debate about how much Ripple's business growth translates into actual XRP demand; Ripple CEO Brad Garlinghouse recently said stablecoins can be preferable for some payment use cases. 24/7 Wall St.
Simple chart view
Bullish scenario:
$1.53 → $1.60 → $1.70 → $2.00
Bearish scenario:
$1.53 ❌ → $1.40 → $1.30
The most important thing I'd watch right now is whether XRP can establish a daily close above $1.60 and then challenge $1.70. A rejection around $1.60 would make the $1.50/$1.40 levels more important.
If you want, I can also make you a visual XRP chart showing entry/support/resistance + bullish/bearish zones, similar to the picture you asked about earlier. $XRP
XRP is currently around $1.55–$1.60. Recent trading has been stronger, with XRP testing the $1.60 resistance after recovering from the ~$1.00 area earlier in the year. FXStreet+1
Key levels
$1.50–$1.53: near-term support
$1.60: major immediate resistance
$1.65–$1.70: next resistance / recent high area
$2.00: major psychological resistance
$1.40: important downside level
$1.30–$1.35: deeper support area
A current technical report says XRP remains constructive above roughly $1.53, while another identifies $1.60 as a significant supply/resistance area. CryptoRank+1
What could move XRP
Positive factors
U.S.-listed spot XRP ETFs have recently recorded several consecutive days of inflows; one report put cumulative inflows at about $53M through Sept. 24. FXStreet
XRP's recovery from ~$1 toward $1.60 has restored bullish momentum.
XRP Ledger development and institutional adoption remain important longer-term factors. CoinDesk
Risks
Failure to break $1.60–$1.70 could result in another consolidation/pullback.
Crypto-wide volatility remains high.
There is an important debate about how much Ripple's business growth translates into actual XRP demand; Ripple CEO Brad Garlinghouse recently said stablecoins can be preferable for some payment use cases. 24/7 Wall St.
Simple chart view
Bullish scenario:
$1.53 → $1.60 → $1.70 → $2.00
Bearish scenario:
$1.53 ❌ → $1.40 → $1.30
The most important thing I'd watch right now is whether XRP can establish a daily close above $1.60 and then challenge $1.70. A rejection around $1.60 would make the $1.50/$1.40 levels more important.
If you want, I can also make you a visual XRP chart showing entry/support/resistance + bullish/bearish zones, similar to the picture you asked about earlier. $XRP
1
Ver tradução
If you mean Official Trump (TRUMP), the Solana-based meme coin:
Current price: about $2.12
24h: about +0.9%
7 days: about +3.2%
30 days: about −18.9%
1 year: about −71.6%
ATH: $82 on Jan. 19, 2025 — so it remains roughly 97.4% below ATH. OKX
Technical picture
At ~$2.12, TRUMP is still a very high-volatility meme asset. The recent 7-day recovery is relatively modest compared with the much larger longer-term decline. I would watch:
$2.00: important psychological support
$2.60–$2.70: near-term resistance zone
$3.00: major psychological level
Above $3, momentum would need to be accompanied by substantially stronger volume to make the move more convincing.
Biggest issue: token unlocks
This is particularly important for TRUMP. The token has a 1 billion maximum supply, with tokens released over time. A scheduled unlock on Oct. 18, 2026 is expected to release about 28.7 million TRUMP, around 2.9% of total supply and approximately 3.8% of current market cap. Tokenomics.com+1
That creates potential supply pressure, although an unlock does not automatically mean the price will fall.
My scenario framework
ScenarioWhat I'd watch BullishHold ~$2 and break $2.60–$2.70 with strong volume NeutralRange between ~$2 and ~$2.60 BearishLose ~$2 and fail to recover it
TRUMP is fundamentally different from BTC/ETH: its valuation is heavily tied to brand, political attention, community sentiment and speculation, rather than network utility. CoinDesk also notes that 80% of the total supply was allocated to Trump-affiliated entities subject to the unlocking schedule. CoinDesk
If you want, I can also do a TRUMP vs BTC vs ETH vs BNB analysis with the current price, market cap, support/resistance and possible 2026 scenarios side-by-side. $TRUMP
{spot}(TRUMPUSDT)
If you mean Official Trump (TRUMP), the Solana-based meme coin:
Current price: about $2.12
24h: about +0.9%
7 days: about +3.2%
30 days: about −18.9%
1 year: about −71.6%
ATH: $82 on Jan. 19, 2025 — so it remains roughly 97.4% below ATH. OKX
Technical picture
At ~$2.12, TRUMP is still a very high-volatility meme asset. The recent 7-day recovery is relatively modest compared with the much larger longer-term decline. I would watch:
$2.00: important psychological support
$2.60–$2.70: near-term resistance zone
$3.00: major psychological level
Above $3, momentum would need to be accompanied by substantially stronger volume to make the move more convincing.
Biggest issue: token unlocks
This is particularly important for TRUMP. The token has a 1 billion maximum supply, with tokens released over time. A scheduled unlock on Oct. 18, 2026 is expected to release about 28.7 million TRUMP, around 2.9% of total supply and approximately 3.8% of current market cap. Tokenomics.com+1
That creates potential supply pressure, although an unlock does not automatically mean the price will fall.
My scenario framework
ScenarioWhat I'd watch BullishHold ~$2 and break $2.60–$2.70 with strong volume NeutralRange between ~$2 and ~$2.60 BearishLose ~$2 and fail to recover it
TRUMP is fundamentally different from BTC/ETH: its valuation is heavily tied to brand, political attention, community sentiment and speculation, rather than network utility. CoinDesk also notes that 80% of the total supply was allocated to Trump-affiliated entities subject to the unlocking schedule. CoinDesk
If you want, I can also do a TRUMP vs BTC vs ETH vs BNB analysis with the current price, market cap, support/resistance and possible 2026 scenarios side-by-side. $TRUMP
Current price: about $2.12
24h: about +0.9%
7 days: about +3.2%
30 days: about −18.9%
1 year: about −71.6%
ATH: $82 on Jan. 19, 2025 — so it remains roughly 97.4% below ATH. OKX
Technical picture
At ~$2.12, TRUMP is still a very high-volatility meme asset. The recent 7-day recovery is relatively modest compared with the much larger longer-term decline. I would watch:
$2.00: important psychological support
$2.60–$2.70: near-term resistance zone
$3.00: major psychological level
Above $3, momentum would need to be accompanied by substantially stronger volume to make the move more convincing.
Biggest issue: token unlocks
This is particularly important for TRUMP. The token has a 1 billion maximum supply, with tokens released over time. A scheduled unlock on Oct. 18, 2026 is expected to release about 28.7 million TRUMP, around 2.9% of total supply and approximately 3.8% of current market cap. Tokenomics.com+1
That creates potential supply pressure, although an unlock does not automatically mean the price will fall.
My scenario framework
ScenarioWhat I'd watch BullishHold ~$2 and break $2.60–$2.70 with strong volume NeutralRange between ~$2 and ~$2.60 BearishLose ~$2 and fail to recover it
TRUMP is fundamentally different from BTC/ETH: its valuation is heavily tied to brand, political attention, community sentiment and speculation, rather than network utility. CoinDesk also notes that 80% of the total supply was allocated to Trump-affiliated entities subject to the unlocking schedule. CoinDesk
If you want, I can also do a TRUMP vs BTC vs ETH vs BNB analysis with the current price, market cap, support/resistance and possible 2026 scenarios side-by-side. $TRUMP
222
BTC, ETH e BNB em 26 de set. de 2026. Os preços variam ligeiramente por exchange; a CoinMarketCap atualmente mostra BTC ~$83,988, ETH ~$2,690 e BNB ~$774,5. CoinMarketCap
Preços atuais: BTC, ETH e BNB
Preços aproximados em USD da CoinMarketCap em 26 de set. de 2026.
BTCETHBNB
Preço
BTC — Bitcoin
Preço: ~$83,988
7 dias: +3,47% CoinMarketCap
O BTC continua sendo o principal motor do mercado. A dominância do Bitcoin está em torno de 58,6%, o que significa que uma grande parcela do capital cripto ainda está concentrada no BTC. CoinMarketCap
O movimento recente acima de US$ 80K foi construtivo, mas o BTC também está se aproximando de uma área em que pode surgir venda anterior.
Zonas importantes para observar: aproximadamente US$ 80K como território de suporte/psicológico e US$ 85K–US$ 86K como a área imediata de alta.
Um movimento sustentado acima das máximas recentes fortaleceria a estrutura de alta; perder US$ 80K deixaria o gráfico de curto prazo mais vulnerável.
ETH — Ethereum
Preço: ~$2,690
7 dias: +2,53% CoinMarketCap
O ETH tem um setup particularmente interessante.
A Reuters informou que o ETH rompeu acima de uma resistência técnica em torno de US$ 2.661,52 após uma grande alta no fim de agosto. A análise técnica deles identificou aproximadamente US$ 2.775–US$ 2.825 como uma área intermediária e US$ 3.050 como um possível alvo técnico, observando também que cair abaixo de cerca de US$ 2.560–US$ 2.565 enfraqueceria o setup. Reuters
Então eu observaria:
US$ 2.560–US$ 2.565: nível importante de baixa
US$ 2.775–US$ 2.825: próxima grande área de resistência
~US$ 3.050: objetivo técnico maior se o momentum continuar
O ETH também participou recentemente de forma forte da alta mais ampla do mercado cripto; ele ganhou cerca de 7,3% no movimento de 18 de set. CoinDesk
BNB — BNB
Preço: ~$774,5
7 dias: +1,76% CoinMarketCap
O BNB está se comportando de forma um pouco diferente de ETH/BTC:
Ele ainda está acima de US$ 700 e manteve-se relativamente bem.
Seu ganho de 7 dias é menor do que o do BTC e do ETH, sugerindo um momentum de curto prazo um pouco menor.
US$ 750–US$ 760 é uma área que eu observaria como suporte.
US$ 800 é um nível óbvio de resistência psicológica. $BNB
{spot}(BNBUSDT)
$BTC
{spot}(BTCUSDT)
$ETH
{spot}(ETHUSDT)
BTC, ETH e BNB em 26 de set. de 2026. Os preços variam ligeiramente por exchange; a CoinMarketCap atualmente mostra BTC ~$83,988, ETH ~$2,690 e BNB ~$774,5. CoinMarketCap
Preços atuais: BTC, ETH e BNB
Preços aproximados em USD da CoinMarketCap em 26 de set. de 2026.
BTCETHBNB
Preço
BTC — Bitcoin
Preço: ~$83,988
7 dias: +3,47% CoinMarketCap
O BTC continua sendo o principal motor do mercado. A dominância do Bitcoin está em torno de 58,6%, o que significa que uma grande parcela do capital cripto ainda está concentrada no BTC. CoinMarketCap
O movimento recente acima de US$ 80K foi construtivo, mas o BTC também está se aproximando de uma área em que pode surgir venda anterior.
Zonas importantes para observar: aproximadamente US$ 80K como território de suporte/psicológico e US$ 85K–US$ 86K como a área imediata de alta.
Um movimento sustentado acima das máximas recentes fortaleceria a estrutura de alta; perder US$ 80K deixaria o gráfico de curto prazo mais vulnerável.
ETH — Ethereum
Preço: ~$2,690
7 dias: +2,53% CoinMarketCap
O ETH tem um setup particularmente interessante.
A Reuters informou que o ETH rompeu acima de uma resistência técnica em torno de US$ 2.661,52 após uma grande alta no fim de agosto. A análise técnica deles identificou aproximadamente US$ 2.775–US$ 2.825 como uma área intermediária e US$ 3.050 como um possível alvo técnico, observando também que cair abaixo de cerca de US$ 2.560–US$ 2.565 enfraqueceria o setup. Reuters
Então eu observaria:
US$ 2.560–US$ 2.565: nível importante de baixa
US$ 2.775–US$ 2.825: próxima grande área de resistência
~US$ 3.050: objetivo técnico maior se o momentum continuar
O ETH também participou recentemente de forma forte da alta mais ampla do mercado cripto; ele ganhou cerca de 7,3% no movimento de 18 de set. CoinDesk
BNB — BNB
Preço: ~$774,5
7 dias: +1,76% CoinMarketCap
O BNB está se comportando de forma um pouco diferente de ETH/BTC:
Ele ainda está acima de US$ 700 e manteve-se relativamente bem.
Seu ganho de 7 dias é menor do que o do BTC e do ETH, sugerindo um momentum de curto prazo um pouco menor.
US$ 750–US$ 760 é uma área que eu observaria como suporte.
US$ 800 é um nível óbvio de resistência psicológica. $BNB
$BTC
$ETH
Preços atuais: BTC, ETH e BNB
Preços aproximados em USD da CoinMarketCap em 26 de set. de 2026.
BTCETHBNB
Preço
BTC — Bitcoin
Preço: ~$83,988
7 dias: +3,47% CoinMarketCap
O BTC continua sendo o principal motor do mercado. A dominância do Bitcoin está em torno de 58,6%, o que significa que uma grande parcela do capital cripto ainda está concentrada no BTC. CoinMarketCap
O movimento recente acima de US$ 80K foi construtivo, mas o BTC também está se aproximando de uma área em que pode surgir venda anterior.
Zonas importantes para observar: aproximadamente US$ 80K como território de suporte/psicológico e US$ 85K–US$ 86K como a área imediata de alta.
Um movimento sustentado acima das máximas recentes fortaleceria a estrutura de alta; perder US$ 80K deixaria o gráfico de curto prazo mais vulnerável.
ETH — Ethereum
Preço: ~$2,690
7 dias: +2,53% CoinMarketCap
O ETH tem um setup particularmente interessante.
A Reuters informou que o ETH rompeu acima de uma resistência técnica em torno de US$ 2.661,52 após uma grande alta no fim de agosto. A análise técnica deles identificou aproximadamente US$ 2.775–US$ 2.825 como uma área intermediária e US$ 3.050 como um possível alvo técnico, observando também que cair abaixo de cerca de US$ 2.560–US$ 2.565 enfraqueceria o setup. Reuters
Então eu observaria:
US$ 2.560–US$ 2.565: nível importante de baixa
US$ 2.775–US$ 2.825: próxima grande área de resistência
~US$ 3.050: objetivo técnico maior se o momentum continuar
O ETH também participou recentemente de forma forte da alta mais ampla do mercado cripto; ele ganhou cerca de 7,3% no movimento de 18 de set. CoinDesk
BNB — BNB
Preço: ~$774,5
7 dias: +1,76% CoinMarketCap
O BNB está se comportando de forma um pouco diferente de ETH/BTC:
Ele ainda está acima de US$ 700 e manteve-se relativamente bem.
Seu ganho de 7 dias é menor do que o do BTC e do ETH, sugerindo um momentum de curto prazo um pouco menor.
US$ 750–US$ 760 é uma área que eu observaria como suporte.
US$ 800 é um nível óbvio de resistência psicológica. $BNB
$BTC
$ETH
40
$BTC mid-autumn festival vá até a casa da minha namorada, posso entrar pela porta???
Ver original
Classificação de Compartilhamento de Negócios · Nº 1
B
BTCUSDT
Perp
10X
Encerrado
Lucro/Prejuízo Realizado (USDT)
+3,088,671.39
+169.40%
#PolymarketBankFailureBetsDrawFDICConcern #BlackRockBuildsTokenizedPortfoliosForOndo #BitwiseFilesToListNEARETFOnNYSEArca
$BTC mid-autumn festival vá até a casa da minha namorada, posso entrar pela porta???
Ver original
Classificação de Compartilhamento de Negócios · Nº 1
B
BTCUSDT
Perp
10X
Encerrado
Lucro/Prejuízo Realizado (USDT)
+3,088,671.39
+169.40%
#PolymarketBankFailureBetsDrawFDICConcern #BlackRockBuildsTokenizedPortfoliosForOndo #BitwiseFilesToListNEARETFOnNYSEArca
Ver original
Classificação de Compartilhamento de Negócios · Nº 1
B
BTCUSDT
Perp
10X
Encerrado
Lucro/Prejuízo Realizado (USDT)
+3,088,671.39
+169.40%
#PolymarketBankFailureBetsDrawFDICConcern #BlackRockBuildsTokenizedPortfoliosForOndo #BitwiseFilesToListNEARETFOnNYSEArca
1
1
252
$BNB
A BNB está sendo negociada em torno de US$ 772–$776, após recuar da máxima de setembro perto de US$ 807. Dados recentes mostram que a BNB subiu fortemente a partir de cerca de US$ 683 no início de setembro, mas o momentum diminuiu nas últimas sessões. OKX+1
Resistência: US$ 800–$807
Suporte próximo: US$ 760–$770
Suporte mais forte: cerca de US$ 735–$740
Estrutura de mercado: ainda acima dos níveis do início de setembro, mas o momentum de curto prazo enfraqueceu.
Catalisador-chave: a atividade do ecossistema da Binance continua relevante; a Binance também anunciou um investimento de US$ 100 milhões na Circle em 22 de setembro. Reuters
Risco: a fiscalização regulatória continua sendo um fator, com a Reuters reportando uma investigação nos EUA sobre possíveis violações de sanções pela Binance. A Binance disse que adota uma abordagem de tolerância zero para violações de sanções. Reuters
Conclusão: a BNB está atualmente em uma fase de recuo/consolidação. Manter a região de US$ 760 preservaria a estrutura recente, enquanto um movimento sustentado acima de US$ 807 marcaria um desenvolvimento técnico significativo. Esta é uma análise de mercado, não aconselhamento financeiro.
#BNB金铲子挖矿 #QNTRises39%
#BNBToken
$BNB
A BNB está sendo negociada em torno de US$ 772–$776, após recuar da máxima de setembro perto de US$ 807. Dados recentes mostram que a BNB subiu fortemente a partir de cerca de US$ 683 no início de setembro, mas o momentum diminuiu nas últimas sessões. OKX+1
Resistência: US$ 800–$807
Suporte próximo: US$ 760–$770
Suporte mais forte: cerca de US$ 735–$740
Estrutura de mercado: ainda acima dos níveis do início de setembro, mas o momentum de curto prazo enfraqueceu.
Catalisador-chave: a atividade do ecossistema da Binance continua relevante; a Binance também anunciou um investimento de US$ 100 milhões na Circle em 22 de setembro. Reuters
Risco: a fiscalização regulatória continua sendo um fator, com a Reuters reportando uma investigação nos EUA sobre possíveis violações de sanções pela Binance. A Binance disse que adota uma abordagem de tolerância zero para violações de sanções. Reuters
Conclusão: a BNB está atualmente em uma fase de recuo/consolidação. Manter a região de US$ 760 preservaria a estrutura recente, enquanto um movimento sustentado acima de US$ 807 marcaria um desenvolvimento técnico significativo. Esta é uma análise de mercado, não aconselhamento financeiro.
#BNB金铲子挖矿 #QNTRises39%
#BNBToken
A BNB está sendo negociada em torno de US$ 772–$776, após recuar da máxima de setembro perto de US$ 807. Dados recentes mostram que a BNB subiu fortemente a partir de cerca de US$ 683 no início de setembro, mas o momentum diminuiu nas últimas sessões. OKX+1
Resistência: US$ 800–$807
Suporte próximo: US$ 760–$770
Suporte mais forte: cerca de US$ 735–$740
Estrutura de mercado: ainda acima dos níveis do início de setembro, mas o momentum de curto prazo enfraqueceu.
Catalisador-chave: a atividade do ecossistema da Binance continua relevante; a Binance também anunciou um investimento de US$ 100 milhões na Circle em 22 de setembro. Reuters
Risco: a fiscalização regulatória continua sendo um fator, com a Reuters reportando uma investigação nos EUA sobre possíveis violações de sanções pela Binance. A Binance disse que adota uma abordagem de tolerância zero para violações de sanções. Reuters
Conclusão: a BNB está atualmente em uma fase de recuo/consolidação. Manter a região de US$ 760 preservaria a estrutura recente, enquanto um movimento sustentado acima de US$ 807 marcaria um desenvolvimento técnico significativo. Esta é uma análise de mercado, não aconselhamento financeiro.
#BNB金铲子挖矿 #QNTRises39%
#BNBToken
71
$ETH
$ETH está sendo negociado em torno de US$ 2.690, com alta de aproximadamente 0,3% nas últimas 24h, e cerca de US$ 14,8B em volume diário. CoinMarketCap
Tendência: o momento de curto prazo é construtivo. A Reuters informou que o ETH rompeu acima da faixa de resistência de US$ 2.661, com metas técnicas em torno de US$ 3.050 e, potencialmente, US$ 3.395–US$ 3.445 se o impulso continuar. Reuters
Suporte principal: por volta de US$ 2.626, seguido de aproximadamente US$ 2.545. Uma manutenção abaixo desses níveis enfraqueceria o cenário atual. CoinMarketCap
Resistência: US$ 2.775–US$ 2.825 é a próxima zona importante; acima disso, US$ 3.050 se torna um
{spot}(ETHUSDT)
orte técnico relevante.
Demanda institucional: os ETFs de ETH à vista dos EUA registraram fortes entradas recentemente, incluindo US$ 270M em 21 de setembro e US$ 162,2M em 22 de setembro. farside.co.uk+1
Conclusão:'s gráfico atualmente tem uma estrutura construtiva, mas US$ 2.775–US$ 2.825 é um teste importante. Manter acima de ~US$ 2.626 preserva o impulso de alta recente; perder esse nível aumentaria o risco de queda.
Esta é uma análise de mercado, não uma previsão nem uma recomendação de investimento.
$ETH #CoinMarketCapCompletesCoinglassAcquisition #SECSaysBuybacksUpgradesDontMakeTokenSecurity #CircleTetherFreezeBitgetHackerWallet
$ETH
$ETH está sendo negociado em torno de US$ 2.690, com alta de aproximadamente 0,3% nas últimas 24h, e cerca de US$ 14,8B em volume diário. CoinMarketCap
Tendência: o momento de curto prazo é construtivo. A Reuters informou que o ETH rompeu acima da faixa de resistência de US$ 2.661, com metas técnicas em torno de US$ 3.050 e, potencialmente, US$ 3.395–US$ 3.445 se o impulso continuar. Reuters
Suporte principal: por volta de US$ 2.626, seguido de aproximadamente US$ 2.545. Uma manutenção abaixo desses níveis enfraqueceria o cenário atual. CoinMarketCap
Resistência: US$ 2.775–US$ 2.825 é a próxima zona importante; acima disso, US$ 3.050 se torna um
orte técnico relevante.
Demanda institucional: os ETFs de ETH à vista dos EUA registraram fortes entradas recentemente, incluindo US$ 270M em 21 de setembro e US$ 162,2M em 22 de setembro. farside.co.uk+1
Conclusão:'s gráfico atualmente tem uma estrutura construtiva, mas US$ 2.775–US$ 2.825 é um teste importante. Manter acima de ~US$ 2.626 preserva o impulso de alta recente; perder esse nível aumentaria o risco de queda.
Esta é uma análise de mercado, não uma previsão nem uma recomendação de investimento.
$ETH #CoinMarketCapCompletesCoinglassAcquisition #SECSaysBuybacksUpgradesDontMakeTokenSecurity #CircleTetherFreezeBitgetHackerWallet
$ETH está sendo negociado em torno de US$ 2.690, com alta de aproximadamente 0,3% nas últimas 24h, e cerca de US$ 14,8B em volume diário. CoinMarketCap
Tendência: o momento de curto prazo é construtivo. A Reuters informou que o ETH rompeu acima da faixa de resistência de US$ 2.661, com metas técnicas em torno de US$ 3.050 e, potencialmente, US$ 3.395–US$ 3.445 se o impulso continuar. Reuters
Suporte principal: por volta de US$ 2.626, seguido de aproximadamente US$ 2.545. Uma manutenção abaixo desses níveis enfraqueceria o cenário atual. CoinMarketCap
Resistência: US$ 2.775–US$ 2.825 é a próxima zona importante; acima disso, US$ 3.050 se torna um
orte técnico relevante.
Demanda institucional: os ETFs de ETH à vista dos EUA registraram fortes entradas recentemente, incluindo US$ 270M em 21 de setembro e US$ 162,2M em 22 de setembro. farside.co.uk+1
Conclusão:'s gráfico atualmente tem uma estrutura construtiva, mas US$ 2.775–US$ 2.825 é um teste importante. Manter acima de ~US$ 2.626 preserva o impulso de alta recente; perder esse nível aumentaria o risco de queda.
Esta é uma análise de mercado, não uma previsão nem uma recomendação de investimento.
$ETH #CoinMarketCapCompletesCoinglassAcquisition #SECSaysBuybacksUpgradesDontMakeTokenSecurity #CircleTetherFreezeBitgetHackerWallet
85
Faça login para explorar mais conteúdos
Junte-se a usuários de criptomoedas de todo o mundo no Binance Square.
⚡️ Obter informações mais recentes e úteis sobre criptomoeda.
💬 Com a confiança da maior corretora de criptomoedas do mundo.
👍 Descubra insights reais de criadores verificados.
E-mail / número de telefone
Tópicos em Alta
CircleMints500MUSDCOnSolana
4,233 visualizações
265 discutindo
💰 MASSIVO: Circle Minta US$ 500M em $USDC na Solana!
A Circle acabou de cunhar 500 Milhões de $USDC na Solana em 2 transações ($250M + $250M) em 25 de setembro, em apenas 5,5 horas! 🚀
Agora a Solana tem $7,48B+ de dominância em $USDC — mais de 50% do seu fornecimento total de stablecoins de $14,7B.
Por que Solana?
⚡️ Velocidade: 65k TPS
💸 Taxas baixas: $0,00025
🔥 Hub de DeFi: Jupiter, Raydium em alta
Este é um dos maiores mintings em um único dia & é um sinal claro de GRANDE demanda institucional pelo ecossistema da Solana.
Touro para $SOL? 👇
#Circle #USDC #Solana #Stablecoin #DeFi#circlemints500musdconsolana
True News
·8 curtidas
·3.5k visualizações
PolymarketBankFailureBetsDrawFDICConcern
16,616 visualizações
502 discutindo
BlackRockBuildsTokenizedPortfoliosForOndo
12,720 visualizações
345 discutindo