
haseeb_khan000
14 ໂພສ

haseeb_khan000
ລາຍງານ
ບລັອກຜູ້ໃຊ້
Trader & Market Analyst Charts | Analysis | Strategies Knowledge Distributor Learn • Analyze • Grow
3 ກໍາລັງຕິດຕາມ
0 ຜູ້ຕິດຕາມ
1 Liked
ໂພສ
·
--
ສັນຍານກະທິງ
#BTC
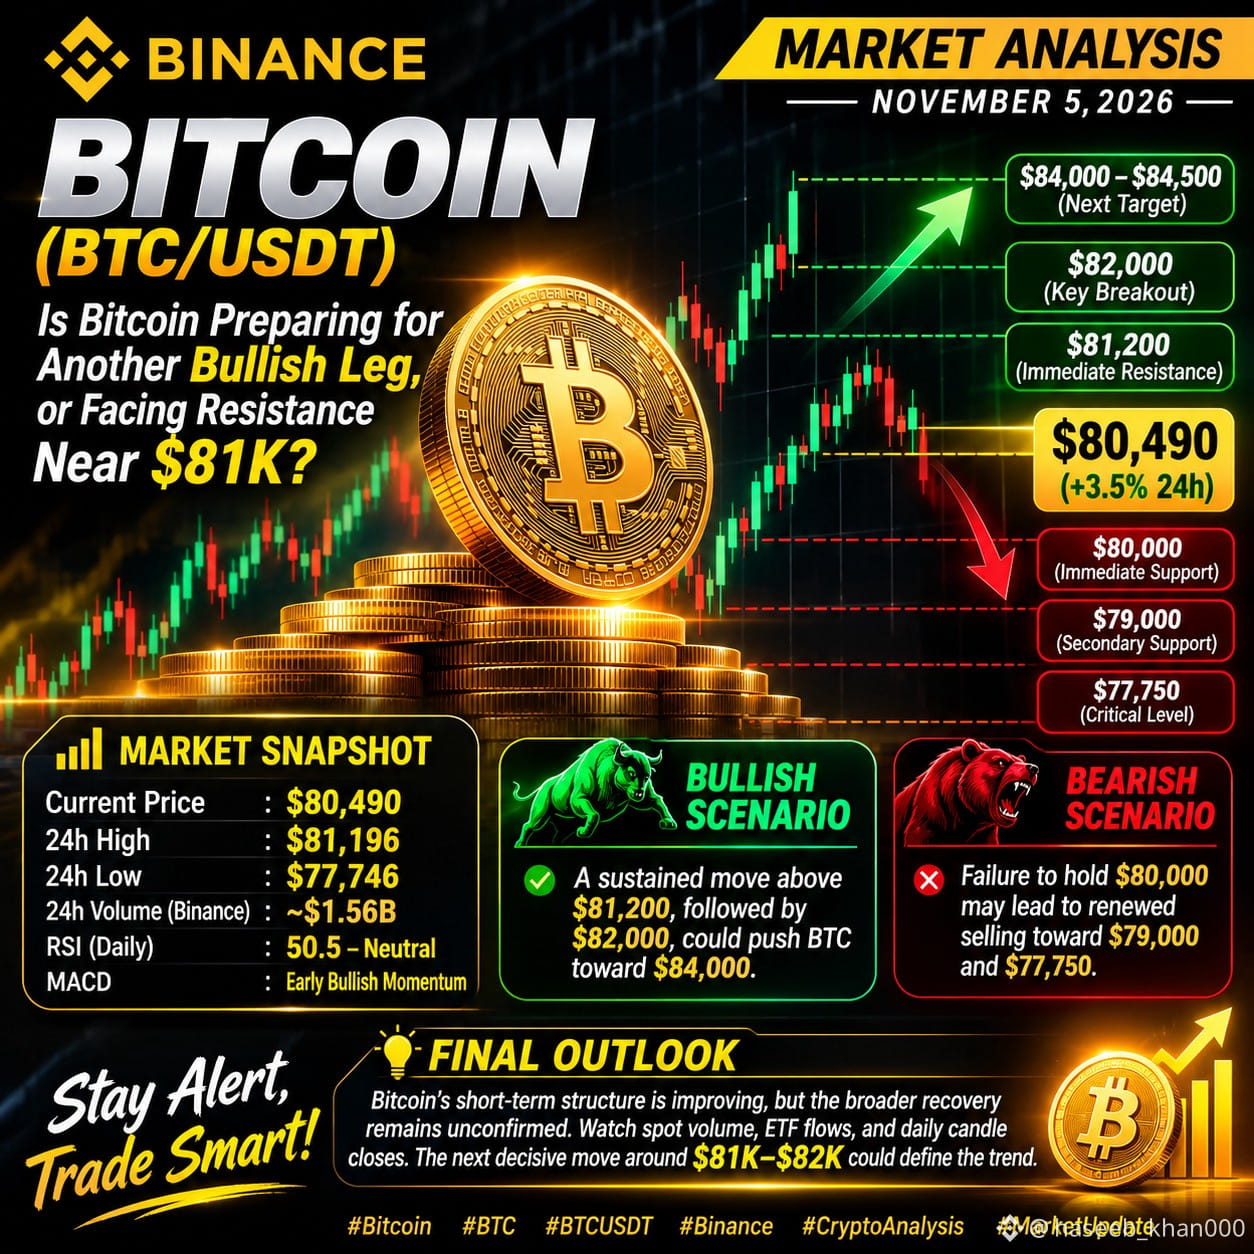
🚨 BITCOIN (BTC/USDT) — ADVANCED MARKET ANALYSIS | NOVEMBER 5, 2026
Is Bitcoin Preparing for Another Bullish Leg, or Facing Resistance Near $81K?
Bitcoin is showing renewed strength after recovering from its recent seven-week low. BTC is trading around $80,490, with approximately 3.5% gains over the last 24 hours.
However, the recovery needs confirmation before a broader bullish reversal can be established.
📊 MARKET STRUCTURE
Current Price: ~$80,490
24H High: $81,196
24H Low: $77,746
24H Spot Volume (Binance): ~$1.56B
RSI (Daily): 50.5 — Neutral
MACD: Early bullish momentum
🔍 KEY TECHNICAL LEVELS
Resistance:
$81,200 — Immediate resistance
$82,000 — Important breakout zone
$84,000–$84,500 — Next upside region
Support:
$80,000 — Immediate pivot
$79,000 — Secondary support
$77,750 — Critical downside level
📈 MARKET MOMENTUM
Bitcoin's recovery is supported by increased spot trading activity and significant short liquidations. However, relatively modest growth in futures open interest suggests that short covering, rather than aggressive fresh positioning, contributed substantially to the rally.
⚡ WHAT COMES NEXT?
Bullish Scenario: A sustained move above $81,200, followed by a confirmed breakout above $82,000, could strengthen the recovery toward $84,000.
Bearish Scenario: Failure to maintain $80,000 could expose BTC to renewed selling pressure toward $79,000 and potentially $77,750.
🎯 FINAL MARKET OUTLOOK
Bitcoin's short-term structure is improving, but the broader recovery remains unconfirmed. Watch spot volume, ETF flows, derivatives positioning, and daily candle closes for stronger confirmation.
The next decisive move around $81K–$82K could define Bitcoin's near-term direction.
#BTC #BTCUSDT #Binance #BitcoinPrice
{future}(BTCUSDT)
#BTC
🚨 BITCOIN (BTC/USDT) — ADVANCED MARKET ANALYSIS | NOVEMBER 5, 2026
Is Bitcoin Preparing for Another Bullish Leg, or Facing Resistance Near $81K?
Bitcoin is showing renewed strength after recovering from its recent seven-week low. BTC is trading around $80,490, with approximately 3.5% gains over the last 24 hours.
However, the recovery needs confirmation before a broader bullish reversal can be established.
📊 MARKET STRUCTURE
Current Price: ~$80,490
24H High: $81,196
24H Low: $77,746
24H Spot Volume (Binance): ~$1.56B
RSI (Daily): 50.5 — Neutral
MACD: Early bullish momentum
🔍 KEY TECHNICAL LEVELS
Resistance:
$81,200 — Immediate resistance
$82,000 — Important breakout zone
$84,000–$84,500 — Next upside region
Support:
$80,000 — Immediate pivot
$79,000 — Secondary support
$77,750 — Critical downside level
📈 MARKET MOMENTUM
Bitcoin's recovery is supported by increased spot trading activity and significant short liquidations. However, relatively modest growth in futures open interest suggests that short covering, rather than aggressive fresh positioning, contributed substantially to the rally.
⚡ WHAT COMES NEXT?
Bullish Scenario: A sustained move above $81,200, followed by a confirmed breakout above $82,000, could strengthen the recovery toward $84,000.
Bearish Scenario: Failure to maintain $80,000 could expose BTC to renewed selling pressure toward $79,000 and potentially $77,750.
🎯 FINAL MARKET OUTLOOK
Bitcoin's short-term structure is improving, but the broader recovery remains unconfirmed. Watch spot volume, ETF flows, derivatives positioning, and daily candle closes for stronger confirmation.
The next decisive move around $81K–$82K could define Bitcoin's near-term direction.
#BTC #BTCUSDT #Binance #BitcoinPrice
🚨 BITCOIN (BTC/USDT) — ADVANCED MARKET ANALYSIS | NOVEMBER 5, 2026
Is Bitcoin Preparing for Another Bullish Leg, or Facing Resistance Near $81K?
Bitcoin is showing renewed strength after recovering from its recent seven-week low. BTC is trading around $80,490, with approximately 3.5% gains over the last 24 hours.
However, the recovery needs confirmation before a broader bullish reversal can be established.
📊 MARKET STRUCTURE
Current Price: ~$80,490
24H High: $81,196
24H Low: $77,746
24H Spot Volume (Binance): ~$1.56B
RSI (Daily): 50.5 — Neutral
MACD: Early bullish momentum
🔍 KEY TECHNICAL LEVELS
Resistance:
$81,200 — Immediate resistance
$82,000 — Important breakout zone
$84,000–$84,500 — Next upside region
Support:
$80,000 — Immediate pivot
$79,000 — Secondary support
$77,750 — Critical downside level
📈 MARKET MOMENTUM
Bitcoin's recovery is supported by increased spot trading activity and significant short liquidations. However, relatively modest growth in futures open interest suggests that short covering, rather than aggressive fresh positioning, contributed substantially to the rally.
⚡ WHAT COMES NEXT?
Bullish Scenario: A sustained move above $81,200, followed by a confirmed breakout above $82,000, could strengthen the recovery toward $84,000.
Bearish Scenario: Failure to maintain $80,000 could expose BTC to renewed selling pressure toward $79,000 and potentially $77,750.
🎯 FINAL MARKET OUTLOOK
Bitcoin's short-term structure is improving, but the broader recovery remains unconfirmed. Watch spot volume, ETF flows, derivatives positioning, and daily candle closes for stronger confirmation.
The next decisive move around $81K–$82K could define Bitcoin's near-term direction.
#BTC #BTCUSDT #Binance #BitcoinPrice
63
#virtual
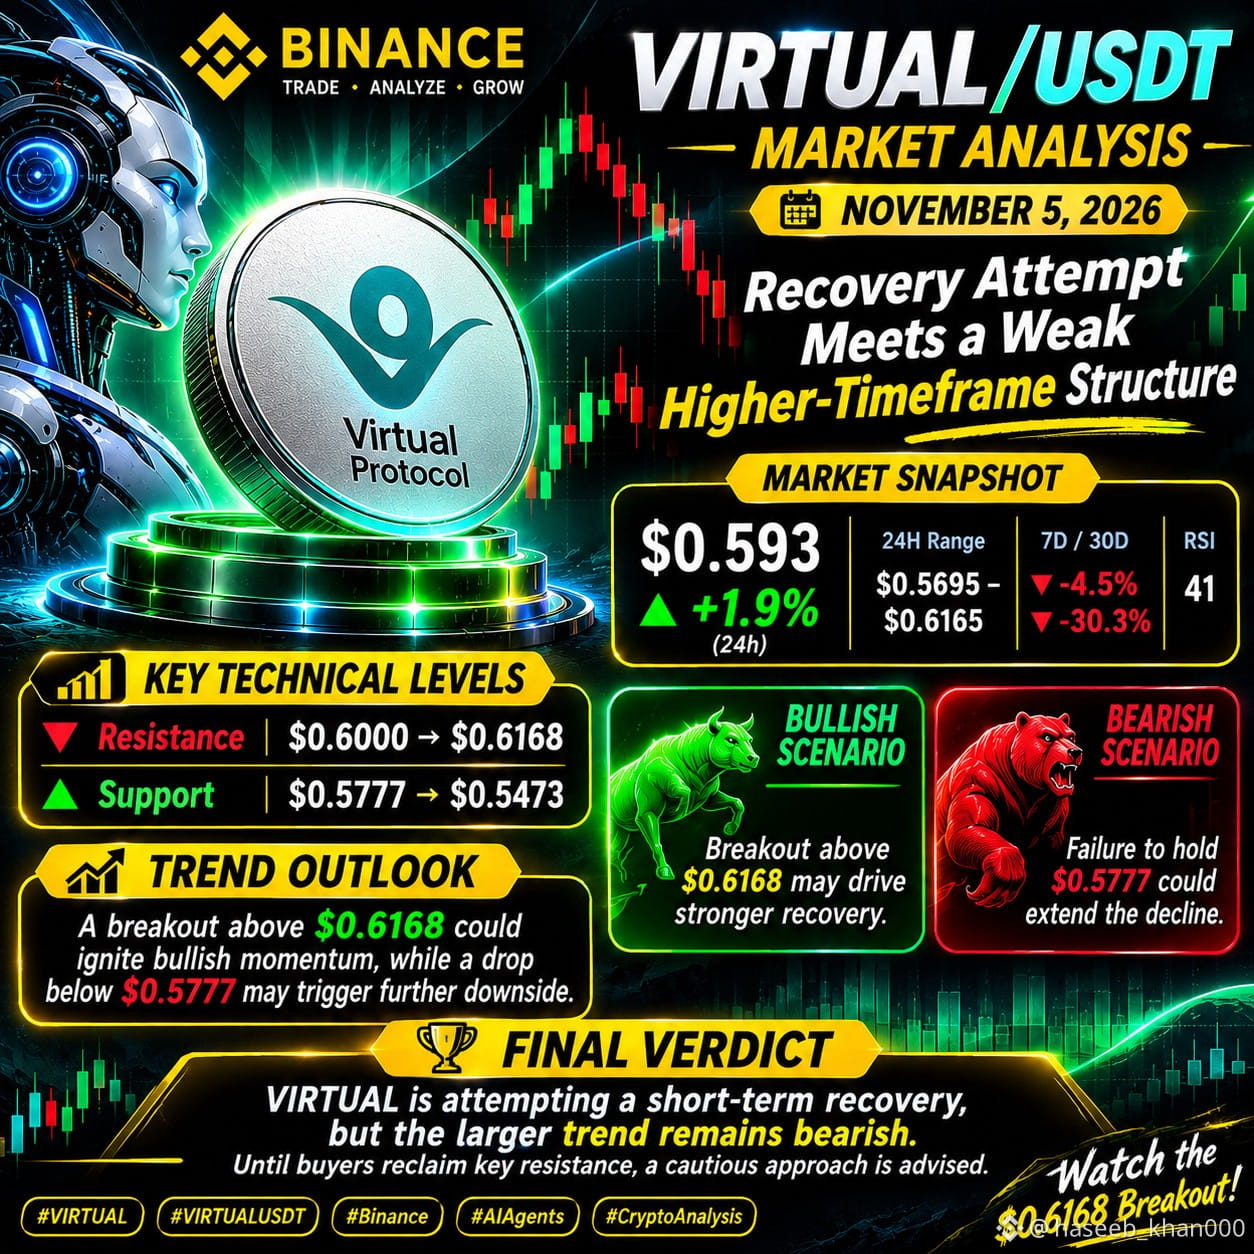
⚡ VIRTUAL/USDT | MARKET STRUCTURE & TREND OUTLOOK
Recovery Attempt Meets a Weak Higher-Timeframe Structure
VIRTUAL is showing early signs of stabilization around $0.593, following a modest 48-hour recovery. However, the broader technical picture remains cautious, with weekly and monthly performance still reflecting persistent selling pressure.
Price Structure:
Trading near $0.593, VIRTUAL remains below a critical resistance zone. RSI around 41 indicates that bullish momentum has yet to establish meaningful strength.
Critical Market Zones
- Supply Zone: $0.6000–$0.6168
- Immediate Demand: $0.5777
- Major Downside Support: $0.5473
What Comes Next?
A decisive move above $0.6168, supported by stronger volume, could signal a shift in short-term market structure. Conversely, losing $0.5777 would weaken the recovery and reopen downside risk.
Analyst's Perspective:
The current move represents a recovery attempt, not a confirmed trend reversal. Until buyers reclaim resistance with conviction, a cautious market outlook remains justified.
#VIRTUAL #virtualusdt #AIAgents
{future}(VIRTUALUSDT)
#CryptoMarket
#virtual
⚡ VIRTUAL/USDT | MARKET STRUCTURE & TREND OUTLOOK
Recovery Attempt Meets a Weak Higher-Timeframe Structure
VIRTUAL is showing early signs of stabilization around $0.593, following a modest 48-hour recovery. However, the broader technical picture remains cautious, with weekly and monthly performance still reflecting persistent selling pressure.
Price Structure:
Trading near $0.593, VIRTUAL remains below a critical resistance zone. RSI around 41 indicates that bullish momentum has yet to establish meaningful strength.
Critical Market Zones
- Supply Zone: $0.6000–$0.6168
- Immediate Demand: $0.5777
- Major Downside Support: $0.5473
What Comes Next?
A decisive move above $0.6168, supported by stronger volume, could signal a shift in short-term market structure. Conversely, losing $0.5777 would weaken the recovery and reopen downside risk.
Analyst's Perspective:
The current move represents a recovery attempt, not a confirmed trend reversal. Until buyers reclaim resistance with conviction, a cautious market outlook remains justified.
#VIRTUAL #virtualusdt #AIAgents
#CryptoMarket
⚡ VIRTUAL/USDT | MARKET STRUCTURE & TREND OUTLOOK
Recovery Attempt Meets a Weak Higher-Timeframe Structure
VIRTUAL is showing early signs of stabilization around $0.593, following a modest 48-hour recovery. However, the broader technical picture remains cautious, with weekly and monthly performance still reflecting persistent selling pressure.
Price Structure:
Trading near $0.593, VIRTUAL remains below a critical resistance zone. RSI around 41 indicates that bullish momentum has yet to establish meaningful strength.
Critical Market Zones
- Supply Zone: $0.6000–$0.6168
- Immediate Demand: $0.5777
- Major Downside Support: $0.5473
What Comes Next?
A decisive move above $0.6168, supported by stronger volume, could signal a shift in short-term market structure. Conversely, losing $0.5777 would weaken the recovery and reopen downside risk.
Analyst's Perspective:
The current move represents a recovery attempt, not a confirmed trend reversal. Until buyers reclaim resistance with conviction, a cautious market outlook remains justified.
#VIRTUAL #virtualusdt #AIAgents
#CryptoMarket
3
$RENDER
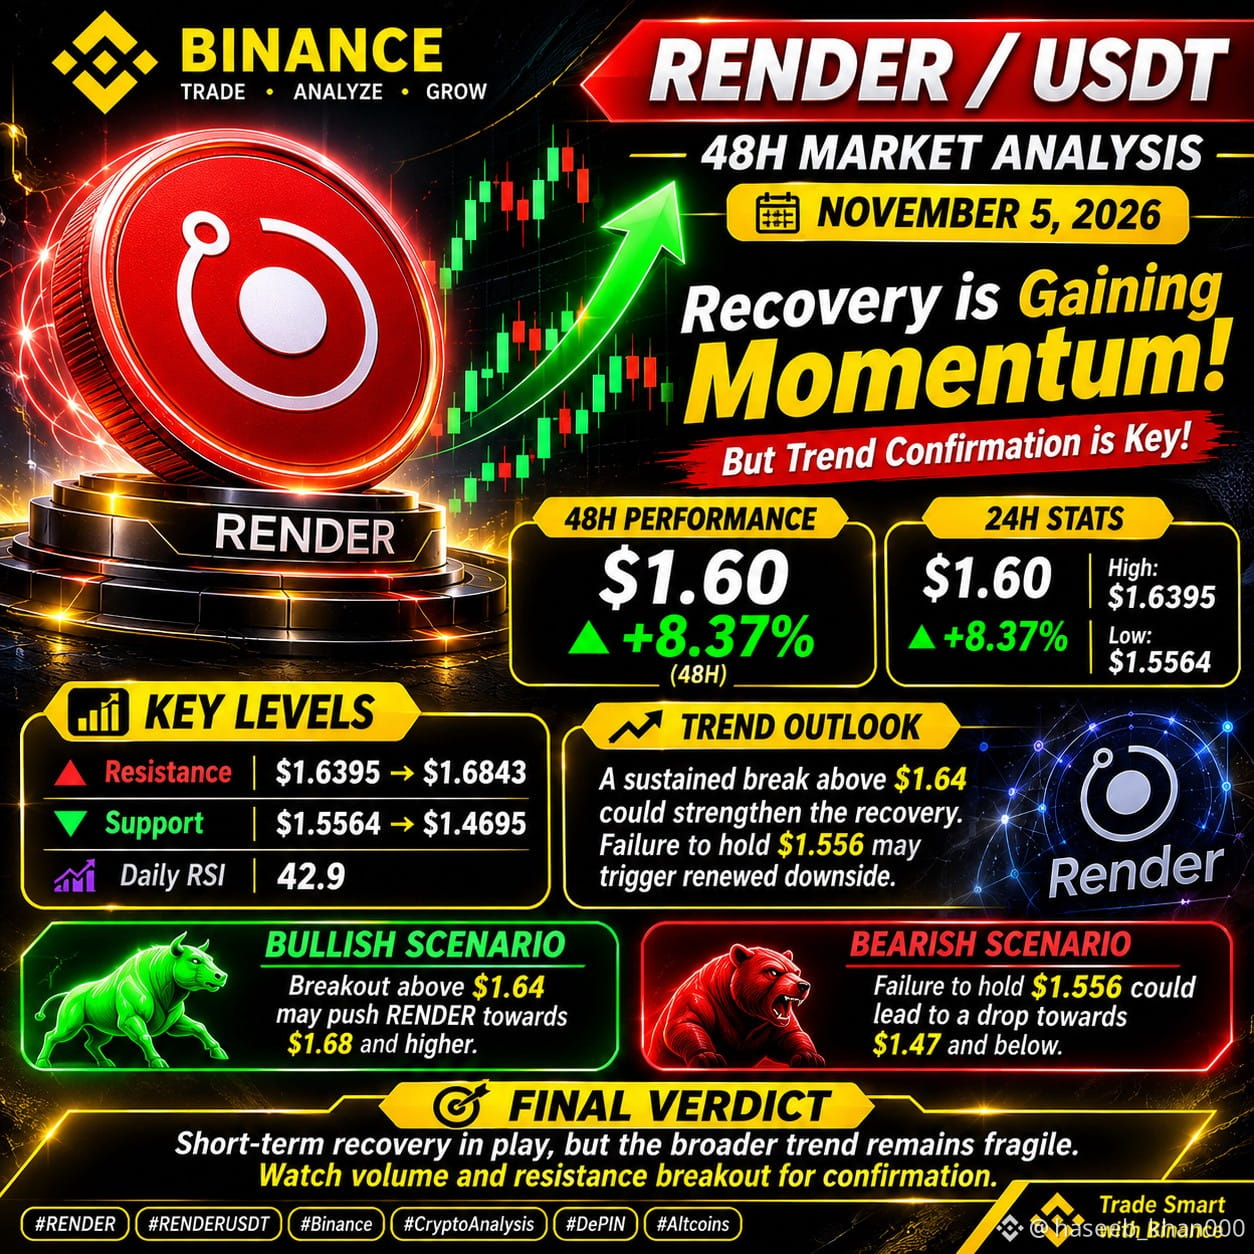
🚨 RENDER/USDT — 48H MARKET ANALYSIS |
Recovery is gaining momentum, but trend confirmation remains critical.
RENDER has rebounded nearly 8% from its recent $1.49 area, currently trading around $1.60. Buyers have regained short-term momentum, while derivatives data shows open interest declining — a sign that the rally still needs stronger participation.
Key Levels
Resistance: $1.6395 → $1.6843
Support: $1.5564 → $1.4695
Daily RSI: 42.9
Trend Outlook A sustained break above $1.64 could strengthen the recovery. Failure to hold $1.556 may expose the market to renewed downside pressure.
Final Verdict: Short-term recovery is visible, but the broader trend remains fragile. Volume expansion and a confirmed resistance breakout are essential before calling a genuine reversal.
#RENDER #Binance #AI
#CryptoAnalysis #MarketUpdate
{future}(RENDERUSDT)
$RENDER
🚨 RENDER/USDT — 48H MARKET ANALYSIS |
Recovery is gaining momentum, but trend confirmation remains critical.
RENDER has rebounded nearly 8% from its recent $1.49 area, currently trading around $1.60. Buyers have regained short-term momentum, while derivatives data shows open interest declining — a sign that the rally still needs stronger participation.
Key Levels
Resistance: $1.6395 → $1.6843
Support: $1.5564 → $1.4695
Daily RSI: 42.9
Trend Outlook A sustained break above $1.64 could strengthen the recovery. Failure to hold $1.556 may expose the market to renewed downside pressure.
Final Verdict: Short-term recovery is visible, but the broader trend remains fragile. Volume expansion and a confirmed resistance breakout are essential before calling a genuine reversal.
#RENDER #Binance #AI
#CryptoAnalysis #MarketUpdate
🚨 RENDER/USDT — 48H MARKET ANALYSIS |
Recovery is gaining momentum, but trend confirmation remains critical.
RENDER has rebounded nearly 8% from its recent $1.49 area, currently trading around $1.60. Buyers have regained short-term momentum, while derivatives data shows open interest declining — a sign that the rally still needs stronger participation.
Key Levels
Resistance: $1.6395 → $1.6843
Support: $1.5564 → $1.4695
Daily RSI: 42.9
Trend Outlook A sustained break above $1.64 could strengthen the recovery. Failure to hold $1.556 may expose the market to renewed downside pressure.
Final Verdict: Short-term recovery is visible, but the broader trend remains fragile. Volume expansion and a confirmed resistance breakout are essential before calling a genuine reversal.
#RENDER #Binance #AI
#CryptoAnalysis #MarketUpdate
98
#FETUSD
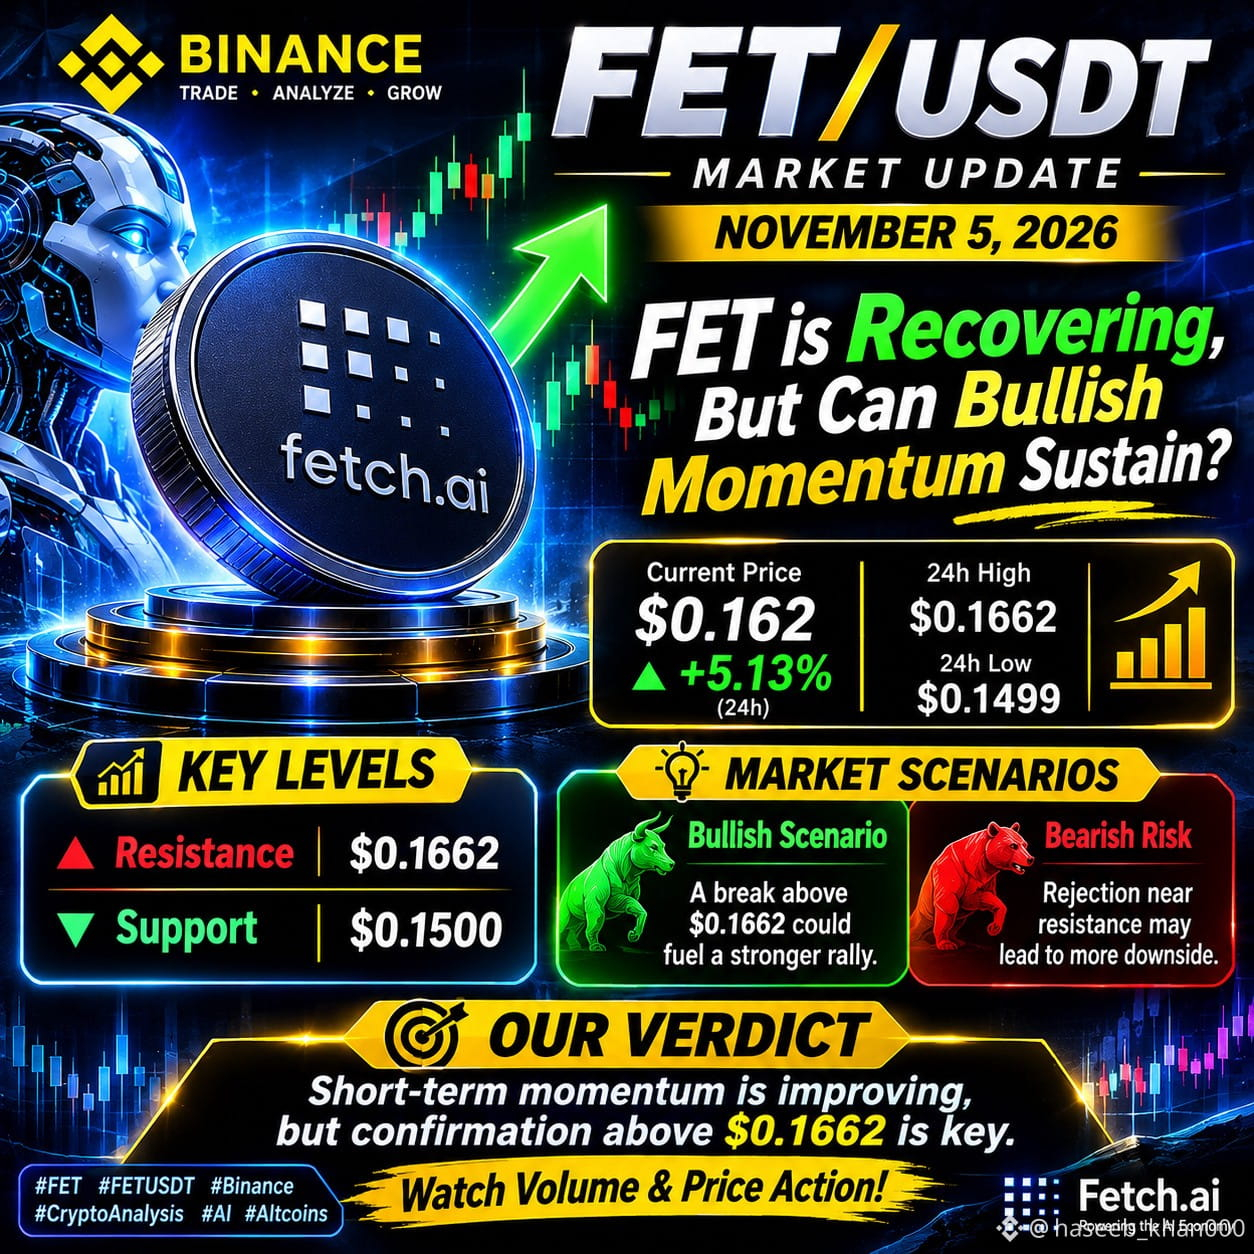
🚨 FET/USDT — MARKET UPDATE |
FET is recovering, but can bullish momentum sustain?
FET is trading near $0.162, up approximately 5.1% in 24 hours, with reported trading activity rising. However, futures open interest has eased, suggesting the price recovery is not yet fully confirmed by derivatives positioning.
🔹 Key Resistance: $0.1662
🔹 Key Support: $0.1500
🔹 Bullish Scenario: A sustained break above $0.1662 could strengthen recovery momentum.
🔹 Risk: Rejection near resistance may bring renewed selling pressure.
Market View: Short-term momentum is improving, but confirmation above resistance remains important. Watch volume and price action before drawing a stronger conclusion.
#FETUSDT #Binance #Altcoins #MarketAnalysis
{future}(FETUSDT)
#FETUSD
🚨 FET/USDT — MARKET UPDATE |
FET is recovering, but can bullish momentum sustain?
FET is trading near $0.162, up approximately 5.1% in 24 hours, with reported trading activity rising. However, futures open interest has eased, suggesting the price recovery is not yet fully confirmed by derivatives positioning.
🔹 Key Resistance: $0.1662
🔹 Key Support: $0.1500
🔹 Bullish Scenario: A sustained break above $0.1662 could strengthen recovery momentum.
🔹 Risk: Rejection near resistance may bring renewed selling pressure.
Market View: Short-term momentum is improving, but confirmation above resistance remains important. Watch volume and price action before drawing a stronger conclusion.
#FETUSDT #Binance #Altcoins #MarketAnalysis
🚨 FET/USDT — MARKET UPDATE |
FET is recovering, but can bullish momentum sustain?
FET is trading near $0.162, up approximately 5.1% in 24 hours, with reported trading activity rising. However, futures open interest has eased, suggesting the price recovery is not yet fully confirmed by derivatives positioning.
🔹 Key Resistance: $0.1662
🔹 Key Support: $0.1500
🔹 Bullish Scenario: A sustained break above $0.1662 could strengthen recovery momentum.
🔹 Risk: Rejection near resistance may bring renewed selling pressure.
Market View: Short-term momentum is improving, but confirmation above resistance remains important. Watch volume and price action before drawing a stronger conclusion.
#FETUSDT #Binance #Altcoins #MarketAnalysis
214
#TAO/USDT
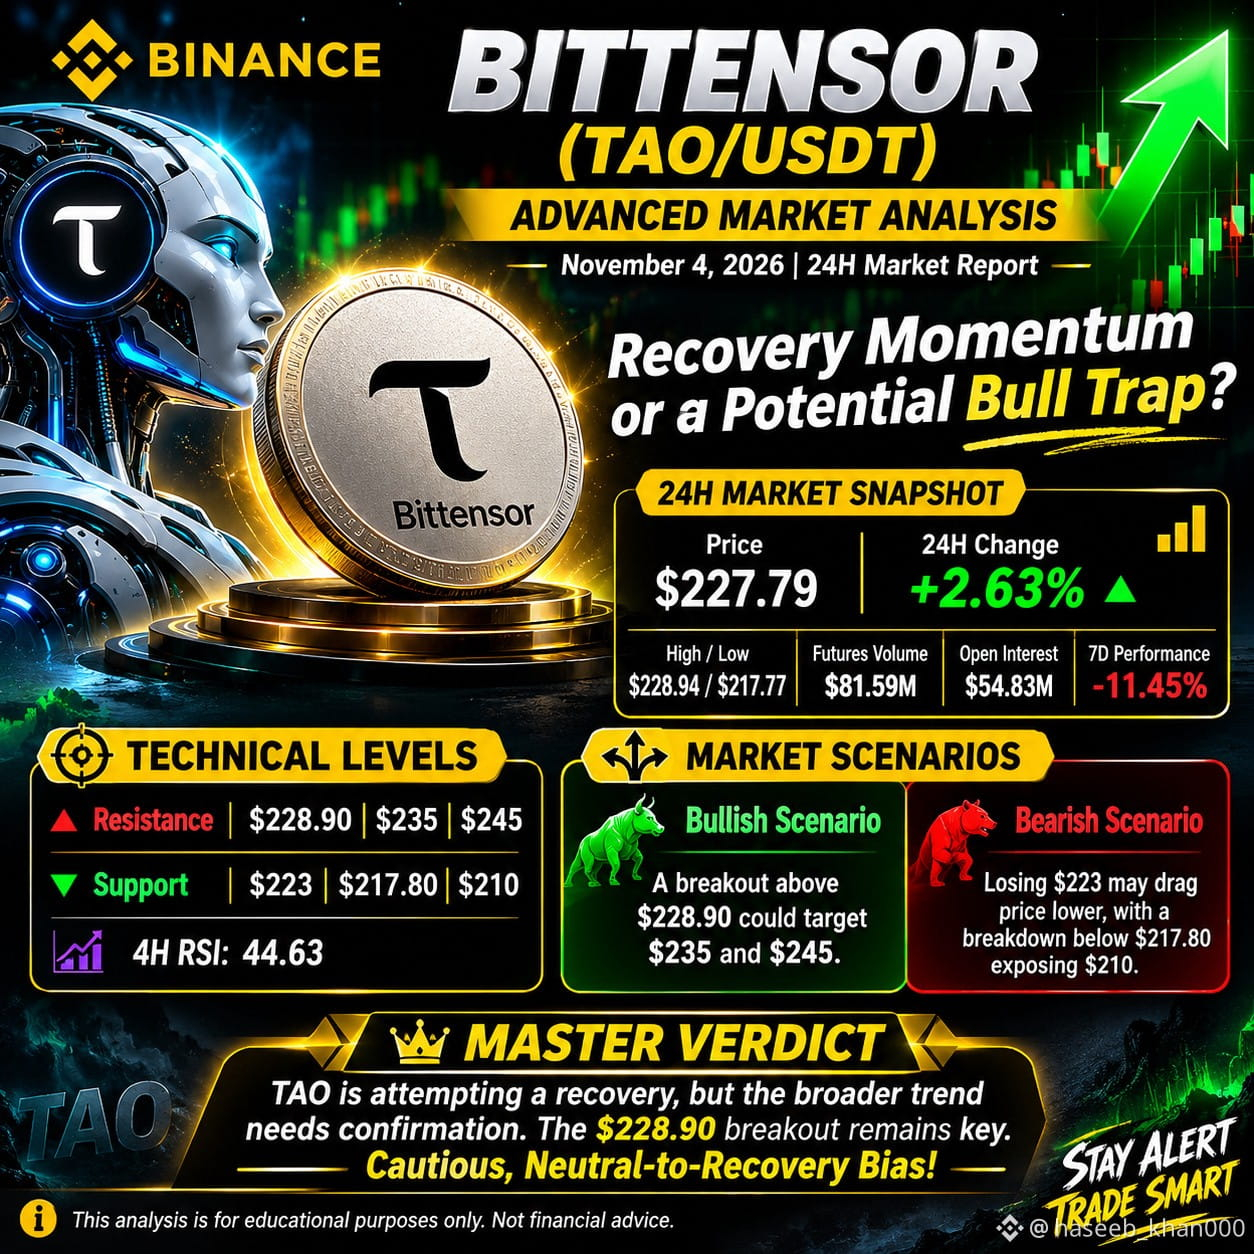
🚨 TAO/USDT — INSTITUTIONAL-LEVEL MARKET OUTLOOK
Recovery Momentum or a Potential Bull Trap?
Bittensor (TAO) is showing early recovery signals, gaining 2.63% in 24 hours. However, its broader structure remains under pressure, making confirmation crucial before calling a bullish reversal.
📊 24H MARKET SNAPSHOT
- Price: $227.79
- Change: +2.63%
- High / Low: $228.94 / $217.77
- Futures Volume: $81.59M
- Open Interest: $54.83M
- Weekly Performance: -11.45%
🔍 CRITICAL TECHNICAL LEVELS
Resistance: $228.90 | $235 | $245
Support: $223 | $217.80 | $210
4H RSI: 44.63 — Momentum remains below bullish territory.
📈 MARKET SCENARIOS
Bullish: A decisive breakout above $228.90 with strong volume could open the way toward $235 and $245.
Bearish: Losing $223 may weaken recovery momentum, while a breakdown below $217.80 could expose $210.
🧠 MASTER VERDICT
TAO is attempting a recovery, but the broader trend has yet to confirm a reversal. The $228.90 breakout remains the key trigger. Until then, a cautious, neutral-to-recovery bias is justified.
{future}(TAOUSDT)
#AI #CryptoAnalysis #Altcoins #binanacesquare
#TAO/USDT
🚨 TAO/USDT — INSTITUTIONAL-LEVEL MARKET OUTLOOK
Recovery Momentum or a Potential Bull Trap?
Bittensor (TAO) is showing early recovery signals, gaining 2.63% in 24 hours. However, its broader structure remains under pressure, making confirmation crucial before calling a bullish reversal.
📊 24H MARKET SNAPSHOT
- Price: $227.79
- Change: +2.63%
- High / Low: $228.94 / $217.77
- Futures Volume: $81.59M
- Open Interest: $54.83M
- Weekly Performance: -11.45%
🔍 CRITICAL TECHNICAL LEVELS
Resistance: $228.90 | $235 | $245
Support: $223 | $217.80 | $210
4H RSI: 44.63 — Momentum remains below bullish territory.
📈 MARKET SCENARIOS
Bullish: A decisive breakout above $228.90 with strong volume could open the way toward $235 and $245.
Bearish: Losing $223 may weaken recovery momentum, while a breakdown below $217.80 could expose $210.
🧠 MASTER VERDICT
TAO is attempting a recovery, but the broader trend has yet to confirm a reversal. The $228.90 breakout remains the key trigger. Until then, a cautious, neutral-to-recovery bias is justified.
#AI #CryptoAnalysis #Altcoins #binanacesquare
🚨 TAO/USDT — INSTITUTIONAL-LEVEL MARKET OUTLOOK
Recovery Momentum or a Potential Bull Trap?
Bittensor (TAO) is showing early recovery signals, gaining 2.63% in 24 hours. However, its broader structure remains under pressure, making confirmation crucial before calling a bullish reversal.
📊 24H MARKET SNAPSHOT
- Price: $227.79
- Change: +2.63%
- High / Low: $228.94 / $217.77
- Futures Volume: $81.59M
- Open Interest: $54.83M
- Weekly Performance: -11.45%
🔍 CRITICAL TECHNICAL LEVELS
Resistance: $228.90 | $235 | $245
Support: $223 | $217.80 | $210
4H RSI: 44.63 — Momentum remains below bullish territory.
📈 MARKET SCENARIOS
Bullish: A decisive breakout above $228.90 with strong volume could open the way toward $235 and $245.
Bearish: Losing $223 may weaken recovery momentum, while a breakdown below $217.80 could expose $210.
🧠 MASTER VERDICT
TAO is attempting a recovery, but the broader trend has yet to confirm a reversal. The $228.90 breakout remains the key trigger. Until then, a cautious, neutral-to-recovery bias is justified.
#AI #CryptoAnalysis #Altcoins #binanacesquare
1
296
#ICP/USTD
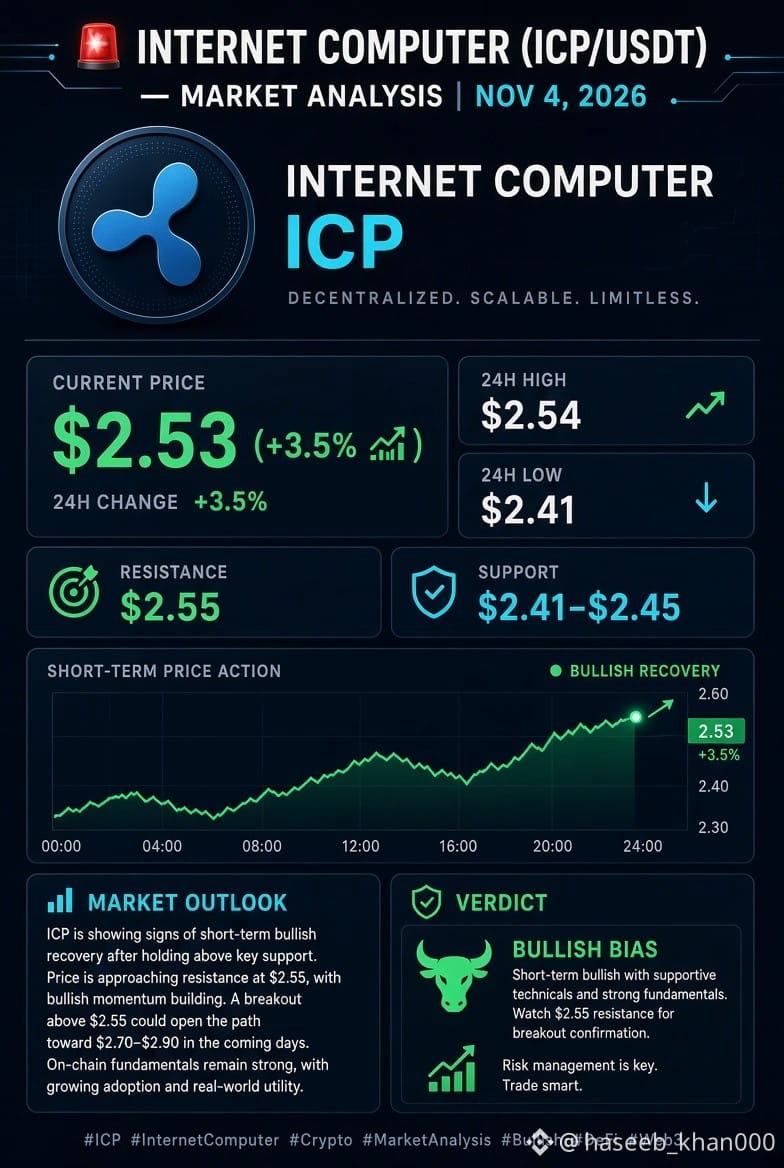
🚨 INTERNET COMPUTER (ICP/USDT) — MARKET ANALYSIS
ICP is showing a bullish short-term recovery, trading near $2.53 (+3.5% in 24H) on Binance. Price has rebounded from the $2.41 support zone and is approaching the critical $2.54–$2.55 resistance area.
📊 Key Market Insights:
24H High: $2.54
24H Low: $2.41
Resistance: $2.55
Support: $2.41–$2.45
Short-Term Trend: Bullish recovery
🔍 Market Outlook: A confirmed breakout above $2.55 could strengthen bullish momentum. However, rejection at resistance may trigger another consolidation phase.
Verdict: ICP is showing improving short-term strength, but confirmation above resistance remains essential.
{future}(ICPUSDT)
#CryptoAnalysis #Altcoins #CryptoMarket #TradingUpdate
#ICP/USTD
🚨 INTERNET COMPUTER (ICP/USDT) — MARKET ANALYSIS
ICP is showing a bullish short-term recovery, trading near $2.53 (+3.5% in 24H) on Binance. Price has rebounded from the $2.41 support zone and is approaching the critical $2.54–$2.55 resistance area.
📊 Key Market Insights:
24H High: $2.54
24H Low: $2.41
Resistance: $2.55
Support: $2.41–$2.45
Short-Term Trend: Bullish recovery
🔍 Market Outlook: A confirmed breakout above $2.55 could strengthen bullish momentum. However, rejection at resistance may trigger another consolidation phase.
Verdict: ICP is showing improving short-term strength, but confirmation above resistance remains essential.
#CryptoAnalysis #Altcoins #CryptoMarket #TradingUpdate
🚨 INTERNET COMPUTER (ICP/USDT) — MARKET ANALYSIS
ICP is showing a bullish short-term recovery, trading near $2.53 (+3.5% in 24H) on Binance. Price has rebounded from the $2.41 support zone and is approaching the critical $2.54–$2.55 resistance area.
📊 Key Market Insights:
24H High: $2.54
24H Low: $2.41
Resistance: $2.55
Support: $2.41–$2.45
Short-Term Trend: Bullish recovery
🔍 Market Outlook: A confirmed breakout above $2.55 could strengthen bullish momentum. However, rejection at resistance may trigger another consolidation phase.
Verdict: ICP is showing improving short-term strength, but confirmation above resistance remains essential.
#CryptoAnalysis #Altcoins #CryptoMarket #TradingUpdate
138
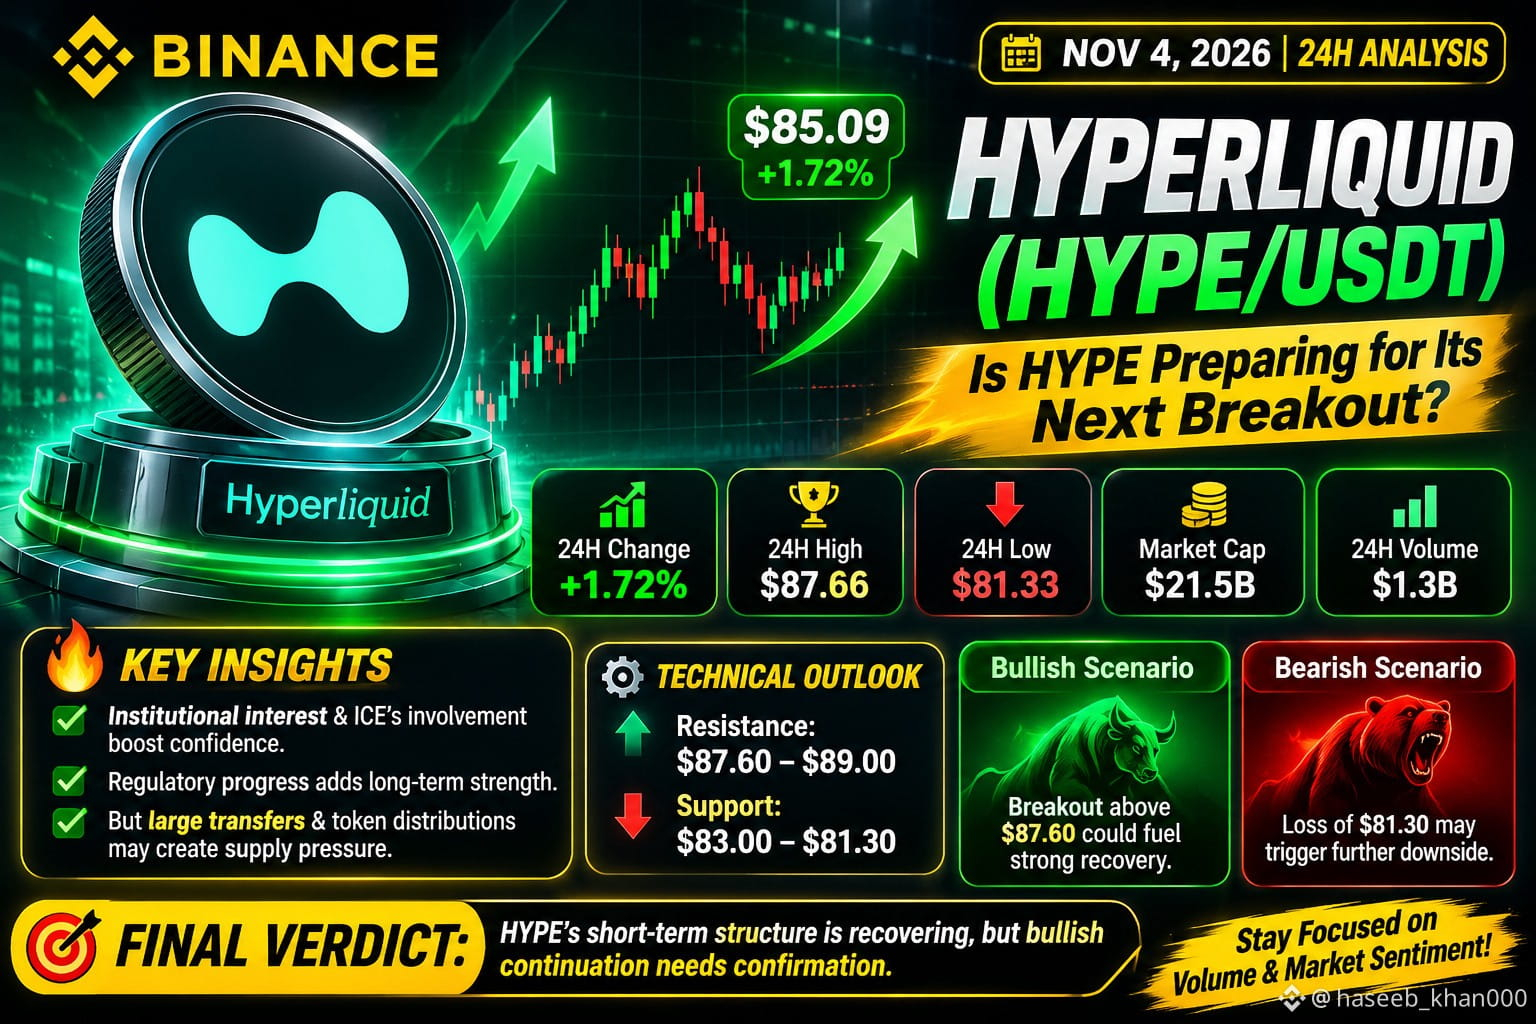
$HYPE 🚨 HYPERLIQUID (HYPE/USDT) — ADVANCED MARKET ANALYSIS |
Is HYPE Preparing for Its Next Breakout or Facing Another Rejection?
HYPE is showing renewed bullish momentum, trading around $85.09, up approximately 1.72% over 24 hours. Price recently recovered from $81.33, but resistance near $87.66 remains a critical hurdle.
📊 Key Market Insights
24H Change: +1.72%
24H High: $87.66
24H Low: $81.33
Market Cap: $21.5B
24H Volume: $1.3B
🔥 Fundamental Catalysts: Institutional interest surrounding Hyperliquid's infrastructure, ICE's planned involvement in a US perpetual futures venue, and recent regulatory developments are attracting attention. However, large exchange transfers and upcoming token distributions remain potential supply-side risks.
🎯 Technical Outlook:
Resistance: $87.60–$89.00
Support: $83.00–$81.30
{future}(HYPEUSDT)
Bullish Scenario: A convincing breakout above $87.60 could strengthen recovery momentum.
Bearish Scenario: Losing $81.30 could expose HYPE to further downside pressure.
⚡ Final Verdict: HYPE's short-term structure is recovering, but bullish continuation still requires confirmation. Rising institutional attention is constructive, while supply pressure and market positioning demand caution.
Stay focused on volume, resistance reactions, and broader market sentiment.
#HYPEUSDT #Binance #CryptoAnalysis #Altcoins #CryptoMarket
$HYPE 🚨 HYPERLIQUID (HYPE/USDT) — ADVANCED MARKET ANALYSIS |
Is HYPE Preparing for Its Next Breakout or Facing Another Rejection?
HYPE is showing renewed bullish momentum, trading around $85.09, up approximately 1.72% over 24 hours. Price recently recovered from $81.33, but resistance near $87.66 remains a critical hurdle.
📊 Key Market Insights
24H Change: +1.72%
24H High: $87.66
24H Low: $81.33
Market Cap: $21.5B
24H Volume: $1.3B
🔥 Fundamental Catalysts: Institutional interest surrounding Hyperliquid's infrastructure, ICE's planned involvement in a US perpetual futures venue, and recent regulatory developments are attracting attention. However, large exchange transfers and upcoming token distributions remain potential supply-side risks.
🎯 Technical Outlook:
Resistance: $87.60–$89.00
Support: $83.00–$81.30
Bullish Scenario: A convincing breakout above $87.60 could strengthen recovery momentum.
Bearish Scenario: Losing $81.30 could expose HYPE to further downside pressure.
⚡ Final Verdict: HYPE's short-term structure is recovering, but bullish continuation still requires confirmation. Rising institutional attention is constructive, while supply pressure and market positioning demand caution.
Stay focused on volume, resistance reactions, and broader market sentiment.
#HYPEUSDT #Binance #CryptoAnalysis #Altcoins #CryptoMarket
Is HYPE Preparing for Its Next Breakout or Facing Another Rejection?
HYPE is showing renewed bullish momentum, trading around $85.09, up approximately 1.72% over 24 hours. Price recently recovered from $81.33, but resistance near $87.66 remains a critical hurdle.
📊 Key Market Insights
24H Change: +1.72%
24H High: $87.66
24H Low: $81.33
Market Cap: $21.5B
24H Volume: $1.3B
🔥 Fundamental Catalysts: Institutional interest surrounding Hyperliquid's infrastructure, ICE's planned involvement in a US perpetual futures venue, and recent regulatory developments are attracting attention. However, large exchange transfers and upcoming token distributions remain potential supply-side risks.
🎯 Technical Outlook:
Resistance: $87.60–$89.00
Support: $83.00–$81.30
Bullish Scenario: A convincing breakout above $87.60 could strengthen recovery momentum.
Bearish Scenario: Losing $81.30 could expose HYPE to further downside pressure.
⚡ Final Verdict: HYPE's short-term structure is recovering, but bullish continuation still requires confirmation. Rising institutional attention is constructive, while supply pressure and market positioning demand caution.
Stay focused on volume, resistance reactions, and broader market sentiment.
#HYPEUSDT #Binance #CryptoAnalysis #Altcoins #CryptoMarket
103
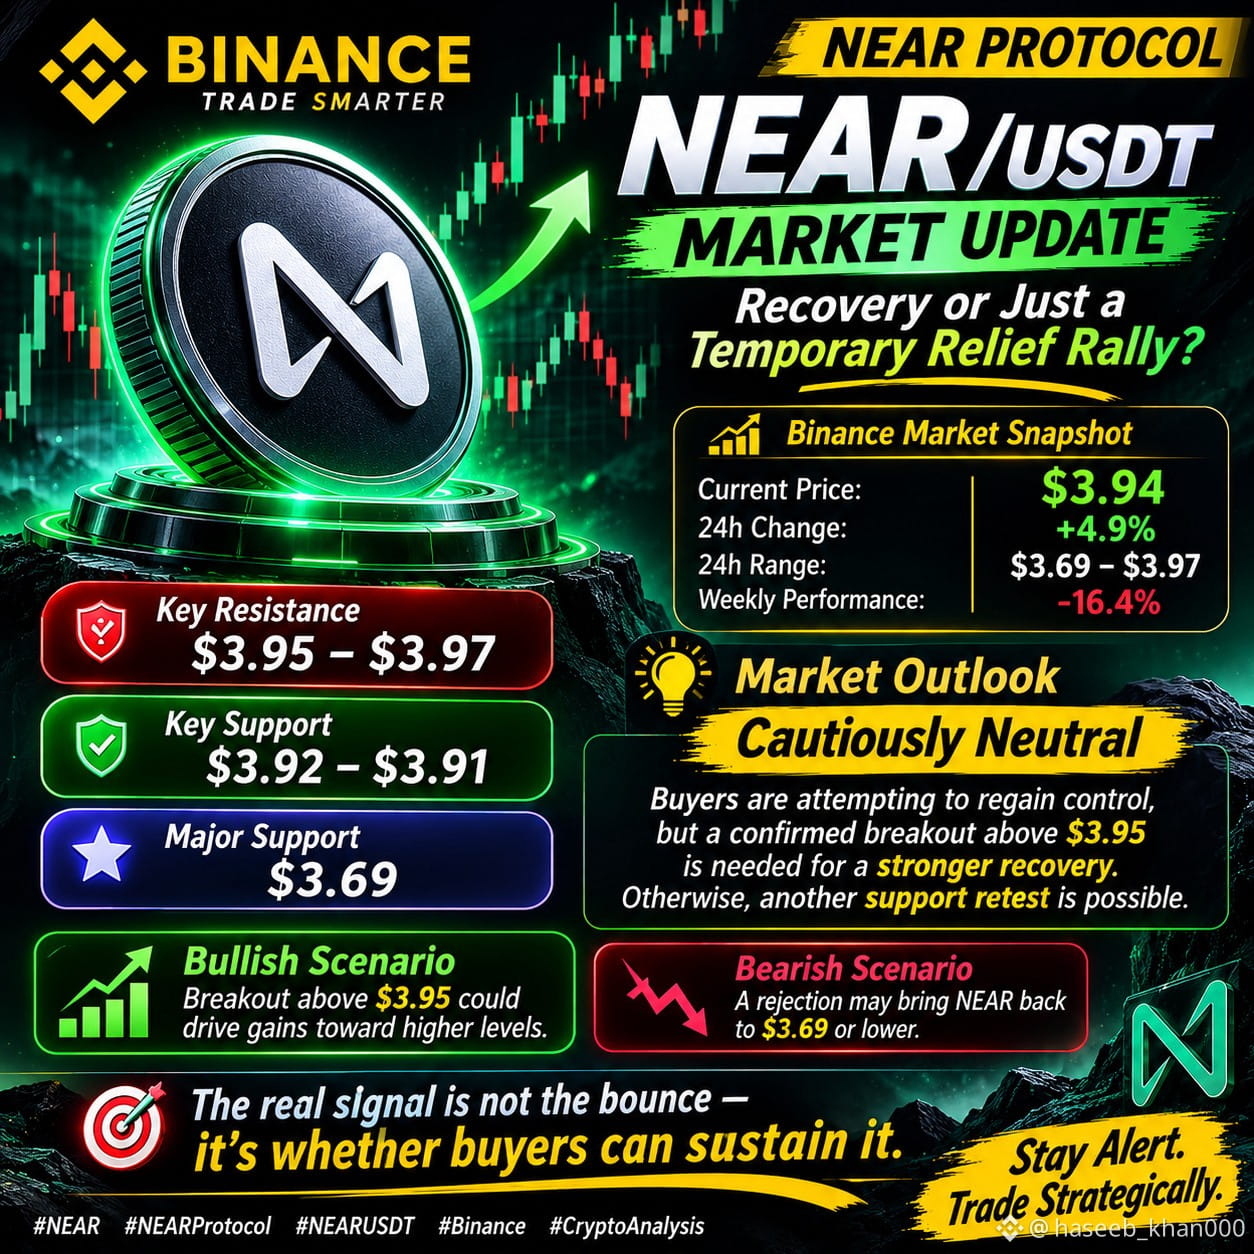
$NEAR 🚨 NEAR/USDT — BINANCE MARKET STRUCTURE UPDATE
Recovery or Just a Temporary Relief Rally?
NEAR is showing a short-term rebound, but its broader market structure remains under pressure.
📊 Binance Market Snapshot:
- Price: ~$3.94
- 24H Change: +4.9%
- 24H Range: $3.69–$3.97
- Weekly Performance: -16.4%
🔴 Resistance: $3.95–$3.97
🟢 Support: $3.92–$3.91
🎯 Major Support: $3.69
Market Bias: Cautiously Neutral
Buyers are attempting to regain control, but sustained volume and a confirmed breakout above resistance are needed to strengthen the recovery.
A rejection could expose NEAR to another support retest.
The real signal is not the bounce — it's whether buyers can sustain it.
{future}(NEARUSDT)
#NEAR #NEARUSDT #Binance #CryptoMarket #TechnicalAnalysis #Altcoins
$NEAR 🚨 NEAR/USDT — BINANCE MARKET STRUCTURE UPDATE
Recovery or Just a Temporary Relief Rally?
NEAR is showing a short-term rebound, but its broader market structure remains under pressure.
📊 Binance Market Snapshot:
- Price: ~$3.94
- 24H Change: +4.9%
- 24H Range: $3.69–$3.97
- Weekly Performance: -16.4%
🔴 Resistance: $3.95–$3.97
🟢 Support: $3.92–$3.91
🎯 Major Support: $3.69
Market Bias: Cautiously Neutral
Buyers are attempting to regain control, but sustained volume and a confirmed breakout above resistance are needed to strengthen the recovery.
A rejection could expose NEAR to another support retest.
The real signal is not the bounce — it's whether buyers can sustain it.
#NEAR #NEARUSDT #Binance #CryptoMarket #TechnicalAnalysis #Altcoins
Recovery or Just a Temporary Relief Rally?
NEAR is showing a short-term rebound, but its broader market structure remains under pressure.
📊 Binance Market Snapshot:
- Price: ~$3.94
- 24H Change: +4.9%
- 24H Range: $3.69–$3.97
- Weekly Performance: -16.4%
🔴 Resistance: $3.95–$3.97
🟢 Support: $3.92–$3.91
🎯 Major Support: $3.69
Market Bias: Cautiously Neutral
Buyers are attempting to regain control, but sustained volume and a confirmed breakout above resistance are needed to strengthen the recovery.
A rejection could expose NEAR to another support retest.
The real signal is not the bounce — it's whether buyers can sustain it.
#NEAR #NEARUSDT #Binance #CryptoMarket #TechnicalAnalysis #Altcoins
125
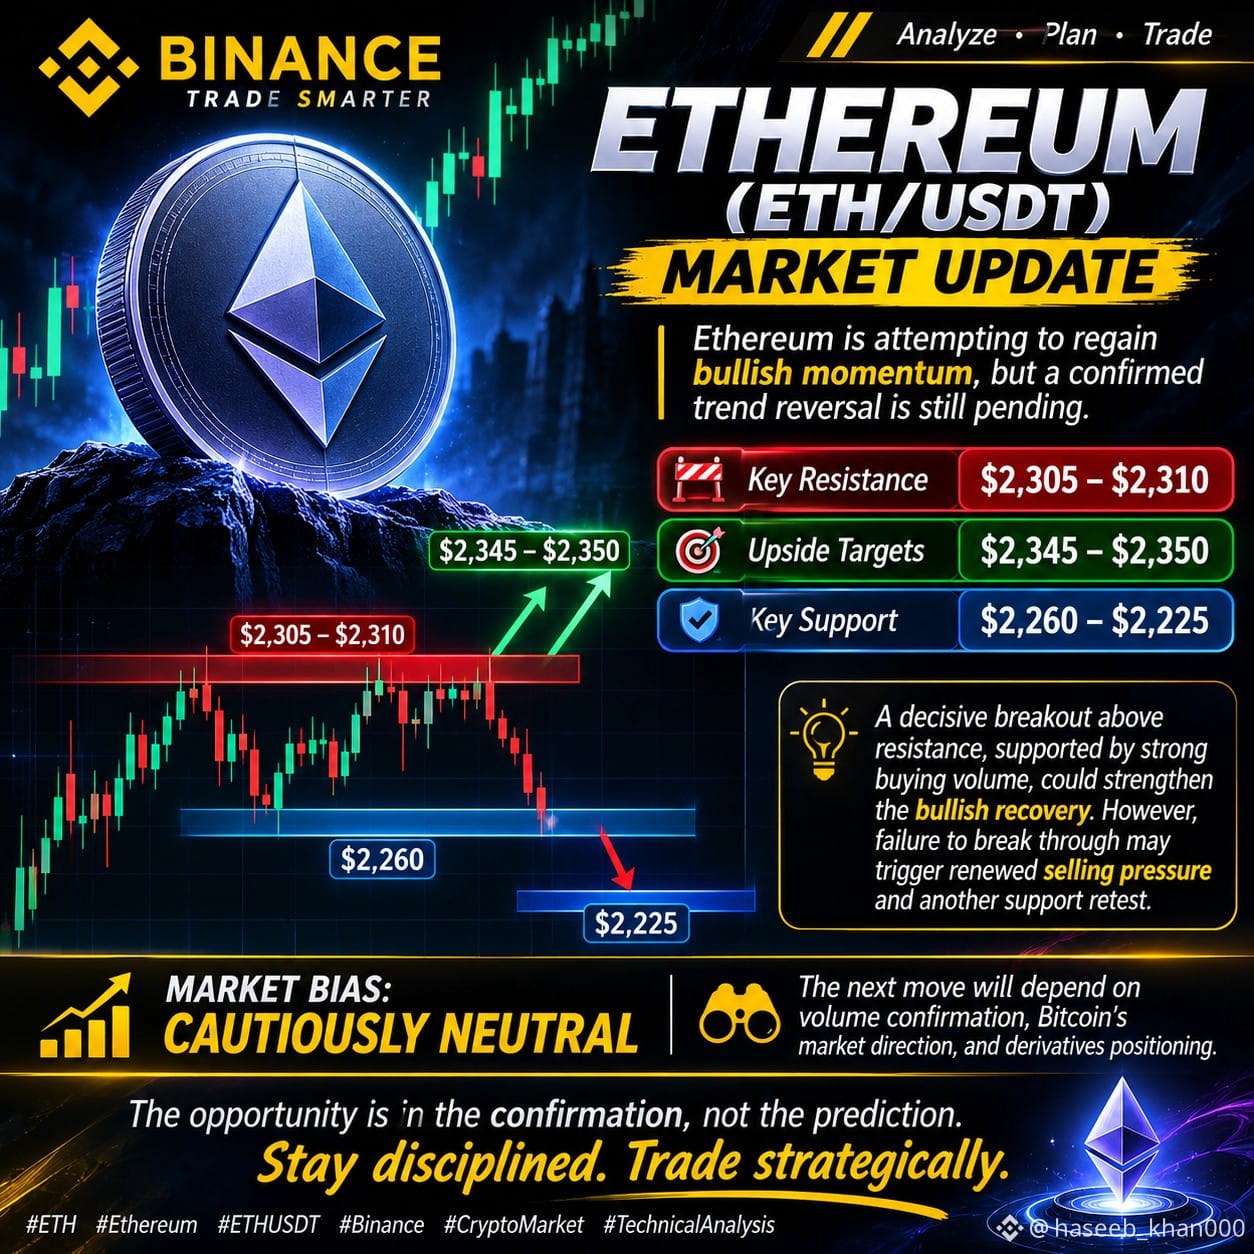
$ETH 🚨 ETHEREUM (ETH/USDT) — CRITICAL MARKET OUTLOOK
{spot}(ETHUSDT)
Ethereum is attempting to regain bullish momentum, but a confirmed trend reversal is still pending.
📈 Key Resistance: $2,305–$2,310
🎯 Upside Targets: $2,345–$2,350
🛡️ Key Support: $2,260–$2,225
A decisive breakout above resistance, supported by strong buying volume, could strengthen the bullish recovery. However, failure to break through may trigger renewed selling pressure and another support retest.
Market Bias: CAUTIOUSLY NEUTRAL
The next move will depend on volume confirmation, Bitcoin's market direction, and derivatives positioning.
The opportunity is in the confirmation, not the prediction. Stay disciplined. Trade strategically.
#ETH #Ethereum #ETHUSDT #Binance #CryptoMarket #TechnicalAnalysis #CryptoTrading
$ETH 🚨 ETHEREUM (ETH/USDT) — CRITICAL MARKET OUTLOOK
Ethereum is attempting to regain bullish momentum, but a confirmed trend reversal is still pending.
📈 Key Resistance: $2,305–$2,310
🎯 Upside Targets: $2,345–$2,350
🛡️ Key Support: $2,260–$2,225
A decisive breakout above resistance, supported by strong buying volume, could strengthen the bullish recovery. However, failure to break through may trigger renewed selling pressure and another support retest.
Market Bias: CAUTIOUSLY NEUTRAL
The next move will depend on volume confirmation, Bitcoin's market direction, and derivatives positioning.
The opportunity is in the confirmation, not the prediction. Stay disciplined. Trade strategically.
#ETH #Ethereum #ETHUSDT #Binance #CryptoMarket #TechnicalAnalysis #CryptoTrading
Ethereum is attempting to regain bullish momentum, but a confirmed trend reversal is still pending.
📈 Key Resistance: $2,305–$2,310
🎯 Upside Targets: $2,345–$2,350
🛡️ Key Support: $2,260–$2,225
A decisive breakout above resistance, supported by strong buying volume, could strengthen the bullish recovery. However, failure to break through may trigger renewed selling pressure and another support retest.
Market Bias: CAUTIOUSLY NEUTRAL
The next move will depend on volume confirmation, Bitcoin's market direction, and derivatives positioning.
The opportunity is in the confirmation, not the prediction. Stay disciplined. Trade strategically.
#ETH #Ethereum #ETHUSDT #Binance #CryptoMarket #TechnicalAnalysis #CryptoTrading
45
$RUNE 🚨 THORCHAIN (RUNE/USDT) — MARKET ANALYSIS
Is RUNE Entering a Sustainable Recovery or Facing Another Temporary Rebound?
THORChain (RUNE) is gaining renewed market attention following a notable price surge. Nevertheless, its broader trend remains uncertain, with technical resistance and fundamental risks shaping the outlook.
📊 MARKET OVERVIEW
- Current price: $0.62–$0.64
- 24H gains: Approximately 12–14%
- Market capitalization: $205M–$211M
- Trading activity: Increasing market participation.
🐂 BULLISH CATALYSTS
- Improving short-term momentum.
- Recovery above key moving averages.
- Progress on previous solvency concerns.
- Potential restoration of investor confidence.
🐻 BEARISH RISKS
- Broader weekly trend remains bearish.
- Inconclusive MACD confirmation.
- Cross-chain operational disruptions.
- Persistent regulatory uncertainty.
🎯 KEY PRICE LEVELS
- $0.5775 — Support
- $0.635–$0.661 — Immediate resistance
- $0.7899 — Major resistance
- $1.17 — Higher resistance reference
📈 MARKET OUTLOOK
A decisive breakout above resistance, supported by sustained volume and improving fundamentals, could strengthen the recovery narrative.
Conversely, renewed selling pressure and weakening support could expose RUNE to further downside.
🧠 FINAL VERDICT
RUNE is displaying encouraging short-term momentum, but a confirmed trend reversal remains elusive. Sustainable upside will depend on stronger demand, technical confirmation and renewed confidence in THORChain's ecosystem.
{future}(RUNEUSDT)
$RUNE 🚨 THORCHAIN (RUNE/USDT) — MARKET ANALYSIS
Is RUNE Entering a Sustainable Recovery or Facing Another Temporary Rebound?
THORChain (RUNE) is gaining renewed market attention following a notable price surge. Nevertheless, its broader trend remains uncertain, with technical resistance and fundamental risks shaping the outlook.
📊 MARKET OVERVIEW
- Current price: $0.62–$0.64
- 24H gains: Approximately 12–14%
- Market capitalization: $205M–$211M
- Trading activity: Increasing market participation.
🐂 BULLISH CATALYSTS
- Improving short-term momentum.
- Recovery above key moving averages.
- Progress on previous solvency concerns.
- Potential restoration of investor confidence.
🐻 BEARISH RISKS
- Broader weekly trend remains bearish.
- Inconclusive MACD confirmation.
- Cross-chain operational disruptions.
- Persistent regulatory uncertainty.
🎯 KEY PRICE LEVELS
- $0.5775 — Support
- $0.635–$0.661 — Immediate resistance
- $0.7899 — Major resistance
- $1.17 — Higher resistance reference
📈 MARKET OUTLOOK
A decisive breakout above resistance, supported by sustained volume and improving fundamentals, could strengthen the recovery narrative.
Conversely, renewed selling pressure and weakening support could expose RUNE to further downside.
🧠 FINAL VERDICT
RUNE is displaying encouraging short-term momentum, but a confirmed trend reversal remains elusive. Sustainable upside will depend on stronger demand, technical confirmation and renewed confidence in THORChain's ecosystem.
Is RUNE Entering a Sustainable Recovery or Facing Another Temporary Rebound?
THORChain (RUNE) is gaining renewed market attention following a notable price surge. Nevertheless, its broader trend remains uncertain, with technical resistance and fundamental risks shaping the outlook.
📊 MARKET OVERVIEW
- Current price: $0.62–$0.64
- 24H gains: Approximately 12–14%
- Market capitalization: $205M–$211M
- Trading activity: Increasing market participation.
🐂 BULLISH CATALYSTS
- Improving short-term momentum.
- Recovery above key moving averages.
- Progress on previous solvency concerns.
- Potential restoration of investor confidence.
🐻 BEARISH RISKS
- Broader weekly trend remains bearish.
- Inconclusive MACD confirmation.
- Cross-chain operational disruptions.
- Persistent regulatory uncertainty.
🎯 KEY PRICE LEVELS
- $0.5775 — Support
- $0.635–$0.661 — Immediate resistance
- $0.7899 — Major resistance
- $1.17 — Higher resistance reference
📈 MARKET OUTLOOK
A decisive breakout above resistance, supported by sustained volume and improving fundamentals, could strengthen the recovery narrative.
Conversely, renewed selling pressure and weakening support could expose RUNE to further downside.
🧠 FINAL VERDICT
RUNE is displaying encouraging short-term momentum, but a confirmed trend reversal remains elusive. Sustainable upside will depend on stronger demand, technical confirmation and renewed confidence in THORChain's ecosystem.

104
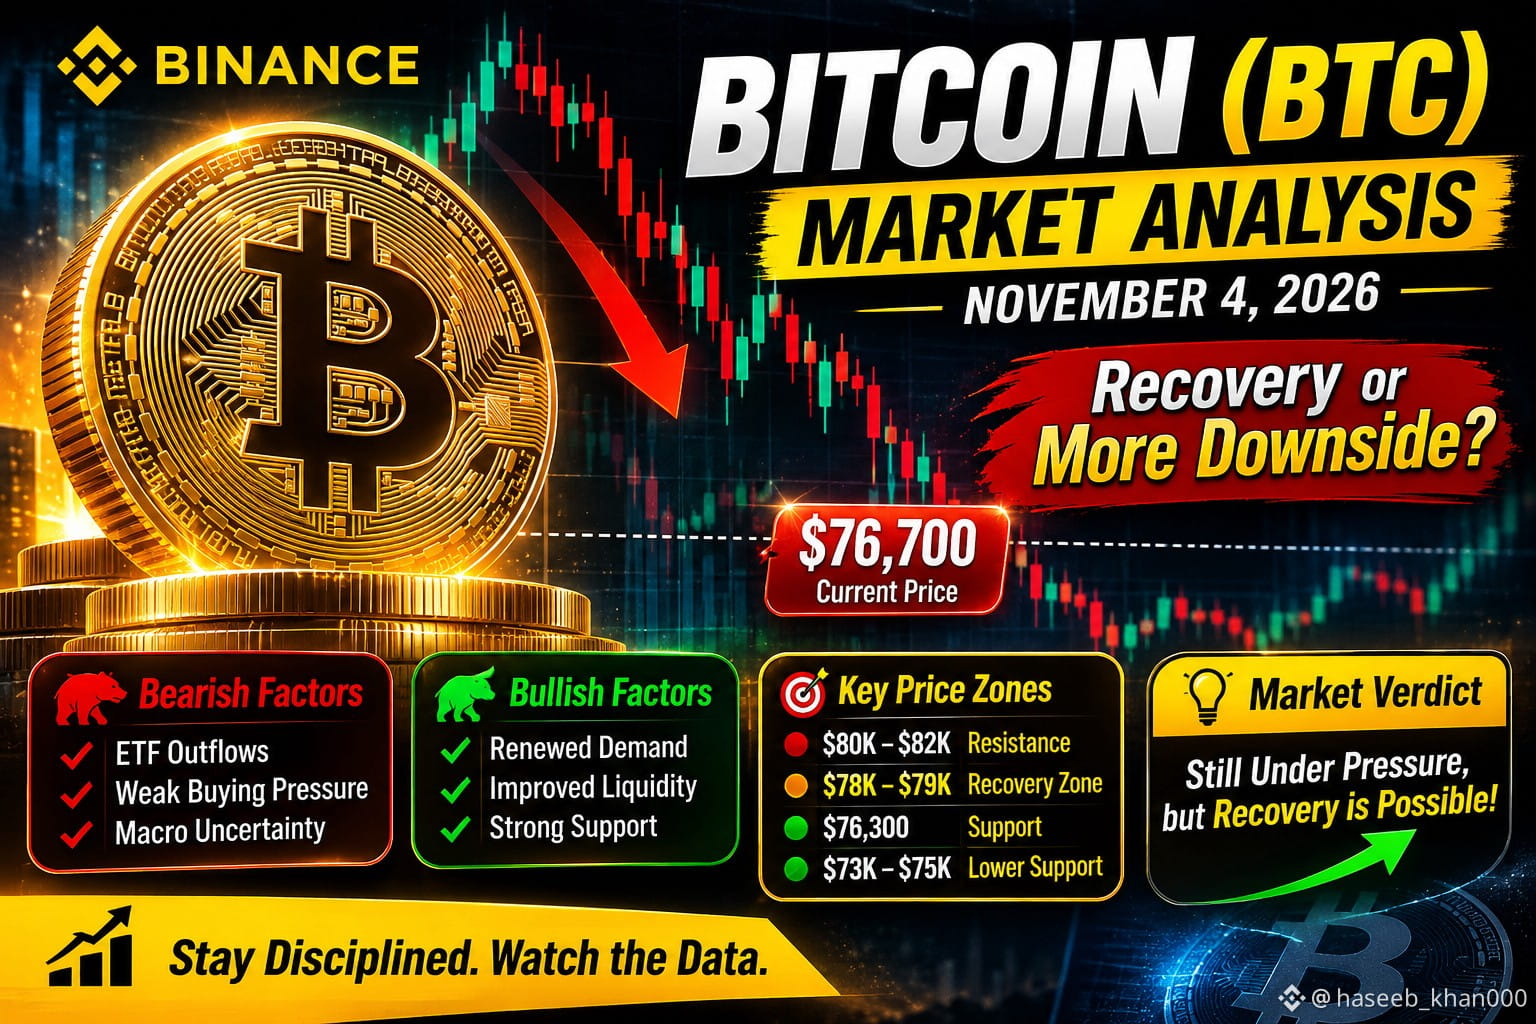
🚨 BITCOIN (BTC)
Is Bitcoin Preparing for a Recovery or Facing Further Downside Pressure?
Bitcoin is navigating a challenging market environment, with institutional ETF outflows, weakening sentiment and increased derivatives activity creating short-term uncertainty.
📊 Market Overview
- BTC recently traded around $76,700–$76,900.
- Spot Bitcoin ETFs recorded approximately $399M in outflows.
- Futures activity and liquidations increased significantly.
- Market sentiment remains in the Fear zone.
🐻 Bearish Outlook
Continued ETF outflows, weak buying pressure and macroeconomic uncertainty could limit Bitcoin's recovery.
🐂 Bullish Outlook
Renewed institutional demand, stronger spot volume and improved liquidity could support a potential rebound.
🎯 Key Price Levels
- $76,300 — Recent price reference.
- $78K–$79K — Recovery zone.
- $80K–$82K — Major resistance region.
- $73K–$75K — Lower support reference.
🧠 Market Verdict
Bitcoin remains under short-term pressure, but its broader outlook is not necessarily broken. A sustainable recovery will require stronger spot demand, institutional inflows and confirmation from market volume.
Stay disciplined. Watch the data. Never confuse market volatility with a confirmed trend reversal.
{future}(BTCUSDT)
🚨 BITCOIN (BTC)
Is Bitcoin Preparing for a Recovery or Facing Further Downside Pressure?
Bitcoin is navigating a challenging market environment, with institutional ETF outflows, weakening sentiment and increased derivatives activity creating short-term uncertainty.
📊 Market Overview
- BTC recently traded around $76,700–$76,900.
- Spot Bitcoin ETFs recorded approximately $399M in outflows.
- Futures activity and liquidations increased significantly.
- Market sentiment remains in the Fear zone.
🐻 Bearish Outlook
Continued ETF outflows, weak buying pressure and macroeconomic uncertainty could limit Bitcoin's recovery.
🐂 Bullish Outlook
Renewed institutional demand, stronger spot volume and improved liquidity could support a potential rebound.
🎯 Key Price Levels
- $76,300 — Recent price reference.
- $78K–$79K — Recovery zone.
- $80K–$82K — Major resistance region.
- $73K–$75K — Lower support reference.
🧠 Market Verdict
Bitcoin remains under short-term pressure, but its broader outlook is not necessarily broken. A sustainable recovery will require stronger spot demand, institutional inflows and confirmation from market volume.
Stay disciplined. Watch the data. Never confuse market volatility with a confirmed trend reversal.
Is Bitcoin Preparing for a Recovery or Facing Further Downside Pressure?
Bitcoin is navigating a challenging market environment, with institutional ETF outflows, weakening sentiment and increased derivatives activity creating short-term uncertainty.
📊 Market Overview
- BTC recently traded around $76,700–$76,900.
- Spot Bitcoin ETFs recorded approximately $399M in outflows.
- Futures activity and liquidations increased significantly.
- Market sentiment remains in the Fear zone.
🐻 Bearish Outlook
Continued ETF outflows, weak buying pressure and macroeconomic uncertainty could limit Bitcoin's recovery.
🐂 Bullish Outlook
Renewed institutional demand, stronger spot volume and improved liquidity could support a potential rebound.
🎯 Key Price Levels
- $76,300 — Recent price reference.
- $78K–$79K — Recovery zone.
- $80K–$82K — Major resistance region.
- $73K–$75K — Lower support reference.
🧠 Market Verdict
Bitcoin remains under short-term pressure, but its broader outlook is not necessarily broken. A sustainable recovery will require stronger spot demand, institutional inflows and confirmation from market volume.
Stay disciplined. Watch the data. Never confuse market volatility with a confirmed trend reversal.
68
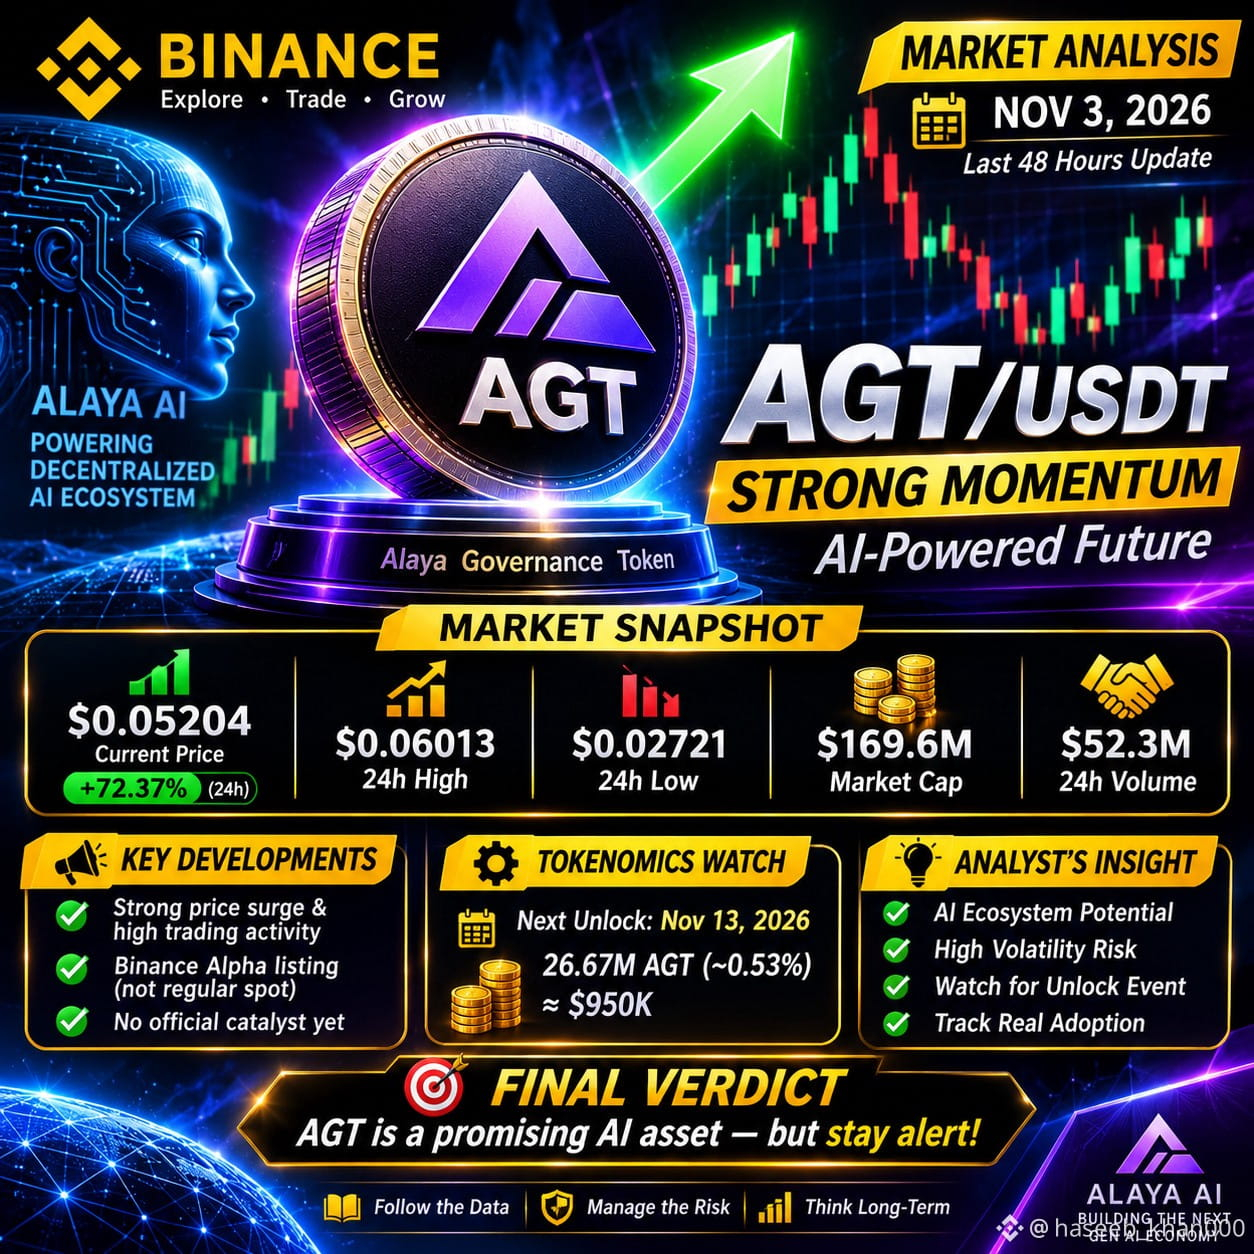
$AGT 🚨 AGT TOKEN — MASTER MARKET ANALYSIS
📊 NOVEMBER 3, 2026 | MARKET & FUNDAMENTAL UPDATE
🔥 1. MARKET OVERVIEW
💰 Price: $0.05204
📈 24H Change: +72.37%
🔺 24H High: $0.06013
🔻 24H Low: $0.02721
📊 Market Cap: $169.6M
💹 24H Volume: $52.3M
Market data snapshot from Binance, November 3, 2026.
📰 2. LATEST MARKET DEVELOPMENTS
🔹 AGT has experienced significant price appreciation and increased trading activity.
🔹 Market attention around AI-related crypto projects has contributed to growing interest in the sector.
🔹 AGT is featured on Binance Alpha, but is not currently listed for regular Binance spot trading.
🔹 No independently verified official announcement has established a specific catalyst for the entire recent rally.
🧠 3. FUNDAMENTAL ANALYSIS
Alaya AI focuses on decentralized AI data infrastructure.
Its ecosystem combines:
• AI data contributions
• Governance participation
• Staking utility
• Data marketplace development
• NFT-based ecosystem incentives
📊 4. TOKENOMICS WATCH
Maximum Supply: 5 Billion AGT
Upcoming Unlock:
📅 November 13, 2026
🔓 26.67 Million AGT
💵 Estimated Value: $950K
This represents approximately 0.53% of maximum supply and deserves attention when evaluating future supply dynamics.
⚠️ 5. KEY MARKET RISKS
• Extreme short-term volatility
• Potential profit-taking after a rapid rally
• Upcoming token unlock
• Liquidity and market-depth uncertainty
• Dependence on actual AI ecosystem adoption
🎯 6. PROFESSIONAL ANALYST'S VIEW
AGT is attracting attention through its strong market momentum and AI-focused ecosystem.
However, sustainable growth requires more than price appreciation. Real platform adoption, token utility, transparent supply management and consistent development will be essential.
FINAL VERDICT
{future}(AGTUSDT)
AGT is an interesting AI-sector asset worth monitoring from a research perspective. Its recent momentum is significant, but volatility and upcoming token-supply changes deserve equal attention.
$AGT 🚨 AGT TOKEN — MASTER MARKET ANALYSIS
📊 NOVEMBER 3, 2026 | MARKET & FUNDAMENTAL UPDATE
🔥 1. MARKET OVERVIEW
💰 Price: $0.05204
📈 24H Change: +72.37%
🔺 24H High: $0.06013
🔻 24H Low: $0.02721
📊 Market Cap: $169.6M
💹 24H Volume: $52.3M
Market data snapshot from Binance, November 3, 2026.
📰 2. LATEST MARKET DEVELOPMENTS
🔹 AGT has experienced significant price appreciation and increased trading activity.
🔹 Market attention around AI-related crypto projects has contributed to growing interest in the sector.
🔹 AGT is featured on Binance Alpha, but is not currently listed for regular Binance spot trading.
🔹 No independently verified official announcement has established a specific catalyst for the entire recent rally.
🧠 3. FUNDAMENTAL ANALYSIS
Alaya AI focuses on decentralized AI data infrastructure.
Its ecosystem combines:
• AI data contributions
• Governance participation
• Staking utility
• Data marketplace development
• NFT-based ecosystem incentives
📊 4. TOKENOMICS WATCH
Maximum Supply: 5 Billion AGT
Upcoming Unlock:
📅 November 13, 2026
🔓 26.67 Million AGT
💵 Estimated Value: $950K
This represents approximately 0.53% of maximum supply and deserves attention when evaluating future supply dynamics.
⚠️ 5. KEY MARKET RISKS
• Extreme short-term volatility
• Potential profit-taking after a rapid rally
• Upcoming token unlock
• Liquidity and market-depth uncertainty
• Dependence on actual AI ecosystem adoption
🎯 6. PROFESSIONAL ANALYST'S VIEW
AGT is attracting attention through its strong market momentum and AI-focused ecosystem.
However, sustainable growth requires more than price appreciation. Real platform adoption, token utility, transparent supply management and consistent development will be essential.
FINAL VERDICT
AGT is an interesting AI-sector asset worth monitoring from a research perspective. Its recent momentum is significant, but volatility and upcoming token-supply changes deserve equal attention.
📊 NOVEMBER 3, 2026 | MARKET & FUNDAMENTAL UPDATE
🔥 1. MARKET OVERVIEW
💰 Price: $0.05204
📈 24H Change: +72.37%
🔺 24H High: $0.06013
🔻 24H Low: $0.02721
📊 Market Cap: $169.6M
💹 24H Volume: $52.3M
Market data snapshot from Binance, November 3, 2026.
📰 2. LATEST MARKET DEVELOPMENTS
🔹 AGT has experienced significant price appreciation and increased trading activity.
🔹 Market attention around AI-related crypto projects has contributed to growing interest in the sector.
🔹 AGT is featured on Binance Alpha, but is not currently listed for regular Binance spot trading.
🔹 No independently verified official announcement has established a specific catalyst for the entire recent rally.
🧠 3. FUNDAMENTAL ANALYSIS
Alaya AI focuses on decentralized AI data infrastructure.
Its ecosystem combines:
• AI data contributions
• Governance participation
• Staking utility
• Data marketplace development
• NFT-based ecosystem incentives
📊 4. TOKENOMICS WATCH
Maximum Supply: 5 Billion AGT
Upcoming Unlock:
📅 November 13, 2026
🔓 26.67 Million AGT
💵 Estimated Value: $950K
This represents approximately 0.53% of maximum supply and deserves attention when evaluating future supply dynamics.
⚠️ 5. KEY MARKET RISKS
• Extreme short-term volatility
• Potential profit-taking after a rapid rally
• Upcoming token unlock
• Liquidity and market-depth uncertainty
• Dependence on actual AI ecosystem adoption
🎯 6. PROFESSIONAL ANALYST'S VIEW
AGT is attracting attention through its strong market momentum and AI-focused ecosystem.
However, sustainable growth requires more than price appreciation. Real platform adoption, token utility, transparent supply management and consistent development will be essential.
FINAL VERDICT
AGT is an interesting AI-sector asset worth monitoring from a research perspective. Its recent momentum is significant, but volatility and upcoming token-supply changes deserve equal attention.
237
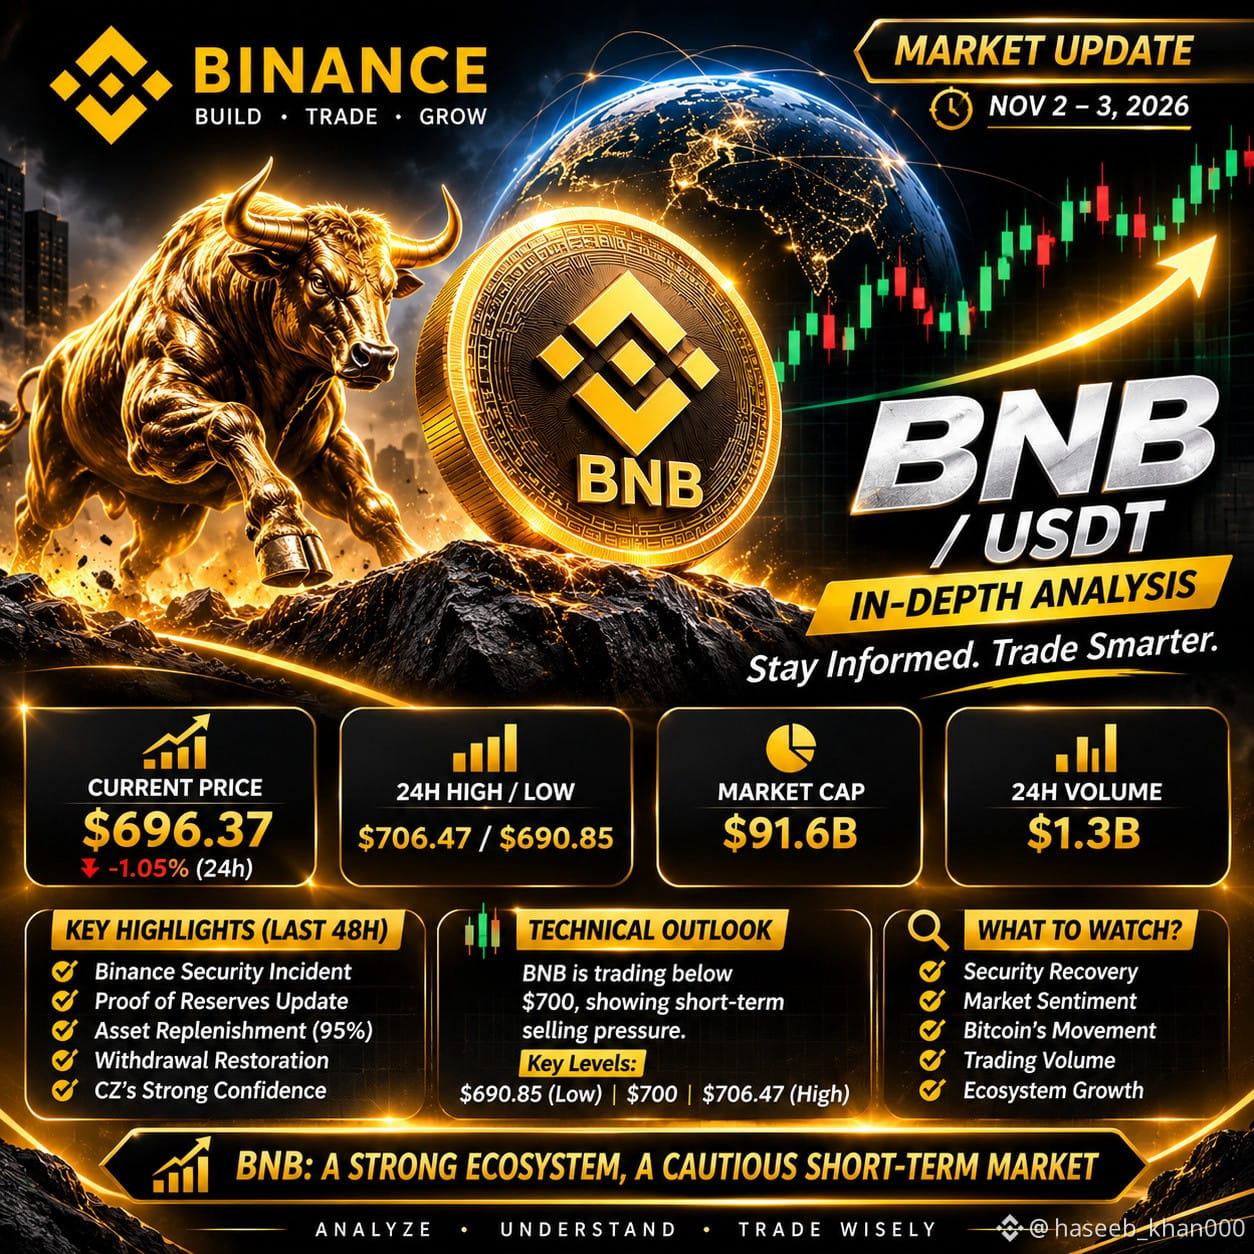
🚨 BNB/USDT | PROFESSIONAL MARKET UPDATE
📊 November 3, 2026 | Last 48 Hours
📍 MARKET OVERVIEW
💰 Price: $696.37
📉 24H Change: -1.05%
🔺 24H High: $706.47
🔻 24H Low: $690.85
📊 Market Cap: $91.6B
💹 24H Volume: $1.3B
📰 KEY MARKET DEVELOPMENTS
🔹 Binance security incident and recovery efforts remain in focus.
🔹 Updated Zero-Knowledge Proof of Reserves verification covering 10 major assets.
🔹 Management reported approximately 95% asset replenishment.
🔹 Withdrawal services are progressively being restored.
🔹 Binance leadership reported normalized customer flows and strong financial health.
📈 TECHNICAL MARKET OUTLOOK
BNB is trading below the psychological $700 level, indicating short-term selling pressure.
Key price references:
• $690.85 — 24H Low
• $700 — Psychological Level
• $706.47 — 24H High
🔍 WHAT'S NEXT?
Monitor Binance recovery updates, Bitcoin's direction, trading volume, market sentiment and ecosystem developments.
💡 ANALYST'S INSIGHT
BNB's long-term ecosystem relevance remains important, but short-term market sentiment, liquidity and exchange confidence deserve close attention.
🎯 FINAL VERDICT
The current outlook remains cautious. Market participants should prioritize research, risk awareness and independent analysis rather than emotional decisions.
{future}(BNBUSDT)
🚨 BNB/USDT | PROFESSIONAL MARKET UPDATE
📊 November 3, 2026 | Last 48 Hours
📍 MARKET OVERVIEW
💰 Price: $696.37
📉 24H Change: -1.05%
🔺 24H High: $706.47
🔻 24H Low: $690.85
📊 Market Cap: $91.6B
💹 24H Volume: $1.3B
📰 KEY MARKET DEVELOPMENTS
🔹 Binance security incident and recovery efforts remain in focus.
🔹 Updated Zero-Knowledge Proof of Reserves verification covering 10 major assets.
🔹 Management reported approximately 95% asset replenishment.
🔹 Withdrawal services are progressively being restored.
🔹 Binance leadership reported normalized customer flows and strong financial health.
📈 TECHNICAL MARKET OUTLOOK
BNB is trading below the psychological $700 level, indicating short-term selling pressure.
Key price references:
• $690.85 — 24H Low
• $700 — Psychological Level
• $706.47 — 24H High
🔍 WHAT'S NEXT?
Monitor Binance recovery updates, Bitcoin's direction, trading volume, market sentiment and ecosystem developments.
💡 ANALYST'S INSIGHT
BNB's long-term ecosystem relevance remains important, but short-term market sentiment, liquidity and exchange confidence deserve close attention.
🎯 FINAL VERDICT
The current outlook remains cautious. Market participants should prioritize research, risk awareness and independent analysis rather than emotional decisions.
📊 November 3, 2026 | Last 48 Hours
📍 MARKET OVERVIEW
💰 Price: $696.37
📉 24H Change: -1.05%
🔺 24H High: $706.47
🔻 24H Low: $690.85
📊 Market Cap: $91.6B
💹 24H Volume: $1.3B
📰 KEY MARKET DEVELOPMENTS
🔹 Binance security incident and recovery efforts remain in focus.
🔹 Updated Zero-Knowledge Proof of Reserves verification covering 10 major assets.
🔹 Management reported approximately 95% asset replenishment.
🔹 Withdrawal services are progressively being restored.
🔹 Binance leadership reported normalized customer flows and strong financial health.
📈 TECHNICAL MARKET OUTLOOK
BNB is trading below the psychological $700 level, indicating short-term selling pressure.
Key price references:
• $690.85 — 24H Low
• $700 — Psychological Level
• $706.47 — 24H High
🔍 WHAT'S NEXT?
Monitor Binance recovery updates, Bitcoin's direction, trading volume, market sentiment and ecosystem developments.
💡 ANALYST'S INSIGHT
BNB's long-term ecosystem relevance remains important, but short-term market sentiment, liquidity and exchange confidence deserve close attention.
🎯 FINAL VERDICT
The current outlook remains cautious. Market participants should prioritize research, risk awareness and independent analysis rather than emotional decisions.
63
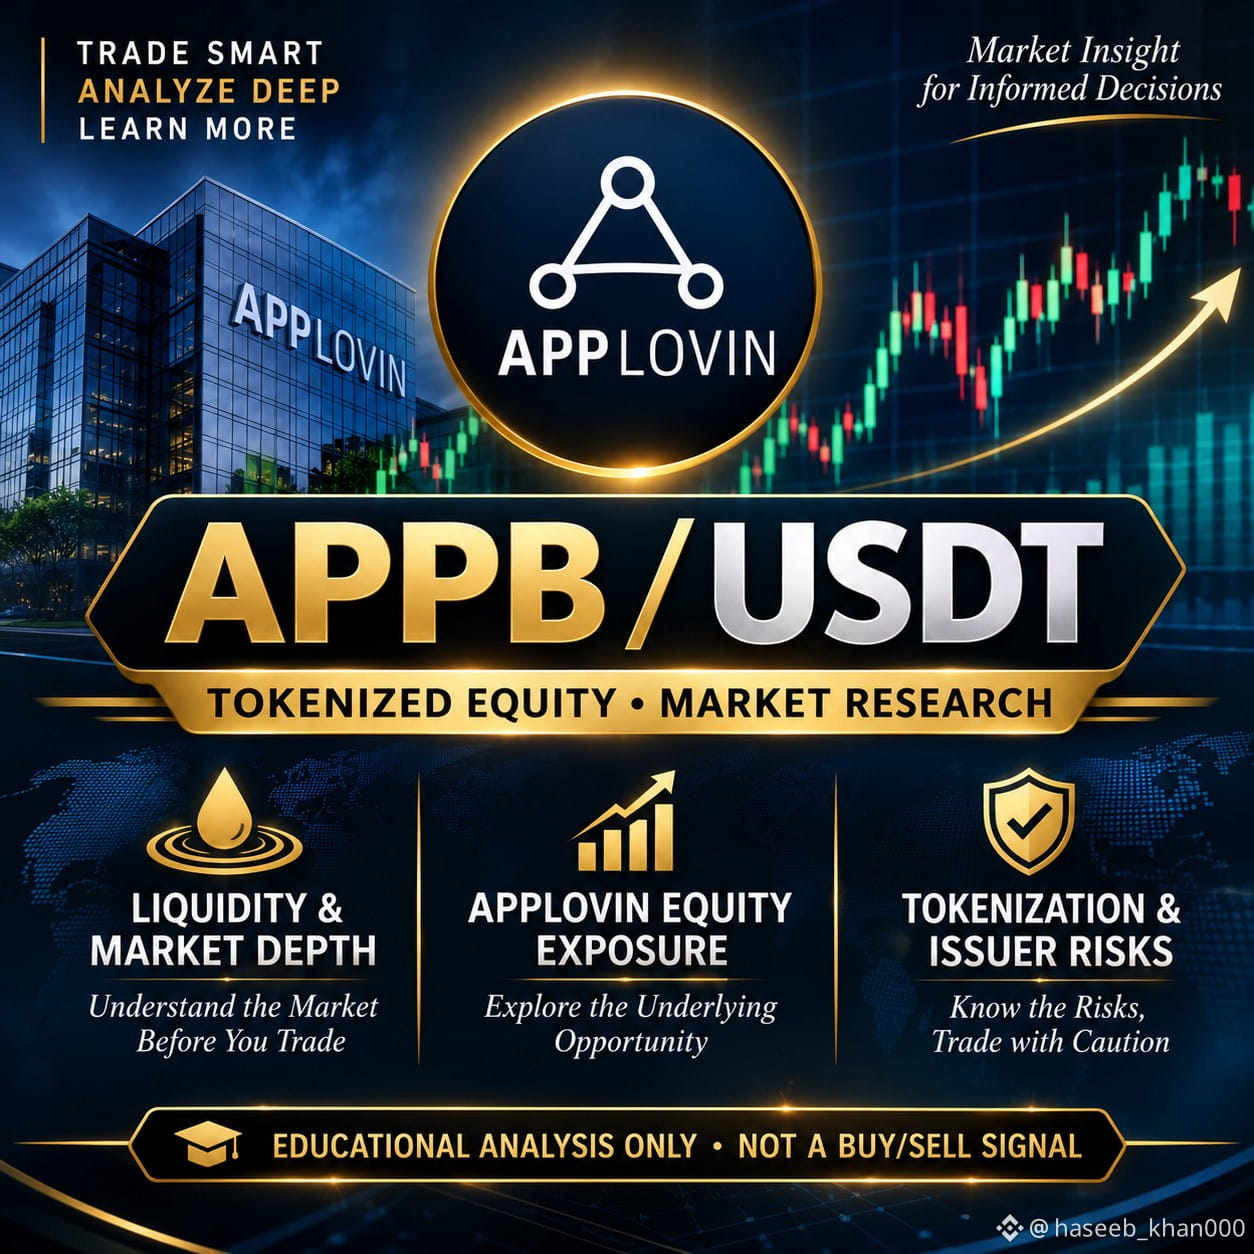
$APPB 📊 APPB/USDT — THE MARKET INSIGHT
Understanding an asset requires more than watching green and red candles.
APPB represents tokenized exposure to AppLovin Corp. Its market deserves attention across three important dimensions:
🔹 Liquidity: Understand market depth and trading activity.
🔹 Underlying Asset: Monitor AppLovin's equity performance.
🔹 Risk Factors: Consider tokenization, issuer, platform and regulatory risks.
💡 A professional analyst studies the asset, understands the risks, and avoids emotional decisions.
Remember: Market research comes before market participation.
📈 Trade Smart. Analyze Deep. Learn More.
#APPB #USDT
$APPB 📊 APPB/USDT — THE MARKET INSIGHT
Understanding an asset requires more than watching green and red candles.
APPB represents tokenized exposure to AppLovin Corp. Its market deserves attention across three important dimensions:
🔹 Liquidity: Understand market depth and trading activity.
🔹 Underlying Asset: Monitor AppLovin's equity performance.
🔹 Risk Factors: Consider tokenization, issuer, platform and regulatory risks.
💡 A professional analyst studies the asset, understands the risks, and avoids emotional decisions.
Remember: Market research comes before market participation.
📈 Trade Smart. Analyze Deep. Learn More.
#APPB #USDT
Understanding an asset requires more than watching green and red candles.
APPB represents tokenized exposure to AppLovin Corp. Its market deserves attention across three important dimensions:
🔹 Liquidity: Understand market depth and trading activity.
🔹 Underlying Asset: Monitor AppLovin's equity performance.
🔹 Risk Factors: Consider tokenization, issuer, platform and regulatory risks.
💡 A professional analyst studies the asset, understands the risks, and avoids emotional decisions.
Remember: Market research comes before market participation.
📈 Trade Smart. Analyze Deep. Learn More.
#APPB #USDT
153
ເຂົ້າສູ່ລະບົບເພື່ອສຳຫຼວດເນື້ອຫາເພີ່ມເຕີມ
ເຂົ້າຮ່ວມກຸ່ມຜູ້ໃຊ້ຄຣິບໂຕທົ່ວໂລກໃນ Binance Square.
⚡️ ໄດ້ຮັບຂໍ້ມູນຫຼ້າສຸດ ແລະ ທີ່ມີປະໂຫຍດກ່ຽວກັບຄຣິບໂຕ.
💬 ໄດ້ຮັບຄວາມໄວ້ວາງໃຈຈາກຕະຫຼາດແລກປ່ຽນຄຣິບໂຕທີ່ໃຫຍ່ທີ່ສຸດໃນໂລກ.
👍 ຄົ້ນຫາຂໍ້ມູນເຊີງເລິກທີ່ແທ້ຈາກນັກສ້າງທີ່ໄດ້ຮັບການຢືນຢັນ.
ອີເມວ / ເບີໂທລະສັບ
ຫົວຂໍ້ທີ່ກໍາລັງນິຍົມ
BinanceReopensWithdrawalsForMoreAssets
663,042 ຄັ້ງທີ່ເບິ່ງ
3,272 ກຳລັງສົນທະນາ
Security Incident | Recovery Update #8: Withdrawals for More Assets to Reopen (2026-11-05)
Binance Announcement
·205 ຖືກໃຈ
·716.6k ຄັ້ງທີ່ເບິ່ງ
BTCRebounds80K
161,926 ຄັ້ງທີ່ເບິ່ງ
1,524 ກຳລັງສົນທະນາ
Binance98PercentReplenished
82,666 ຄັ້ງທີ່ເບິ່ງ
1,043 ກຳລັງສົນທະນາ