
CryptoHaiduc
168 ໂພສ

CryptoHaiduc
ລາຍງານ
ບລັອກຜູ້ໃຊ້
ເປີດການຊື້ຂາຍ
ຜູ້ຊື້ຂາຍຊົ່ວຄາວ
5.1 ປີ
0 ກໍາລັງຕິດຕາມ
77 ຜູ້ຕິດຕາມ
346 Liked
ໂພສ
Portfolio
ທັງໝົດ
ວົງຢືມ
ວີດີໂອ
ປັກໝຸດ
·
--
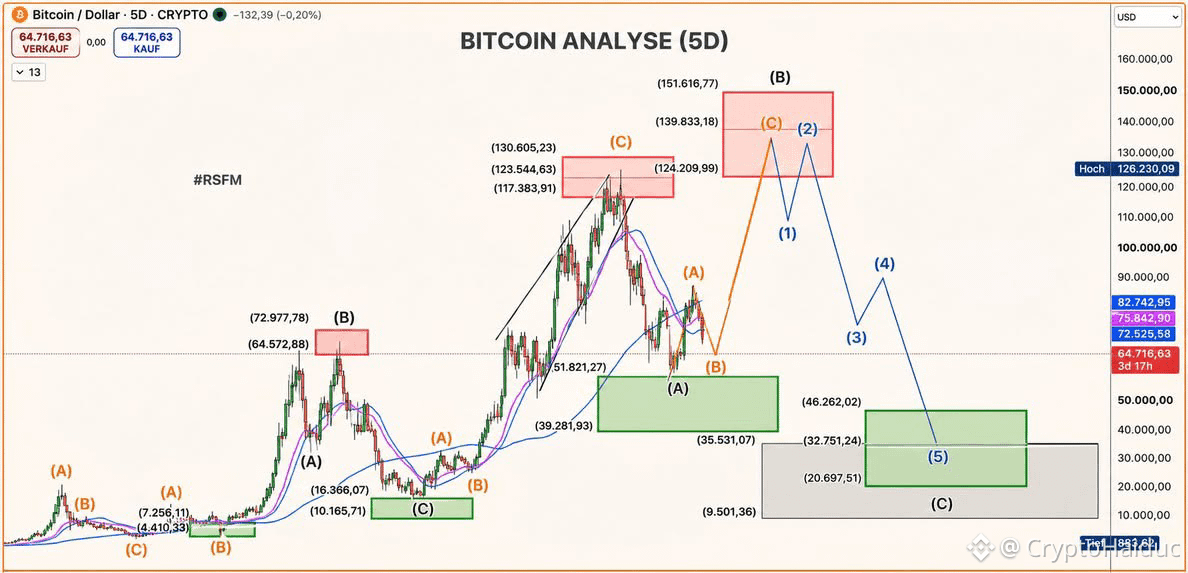
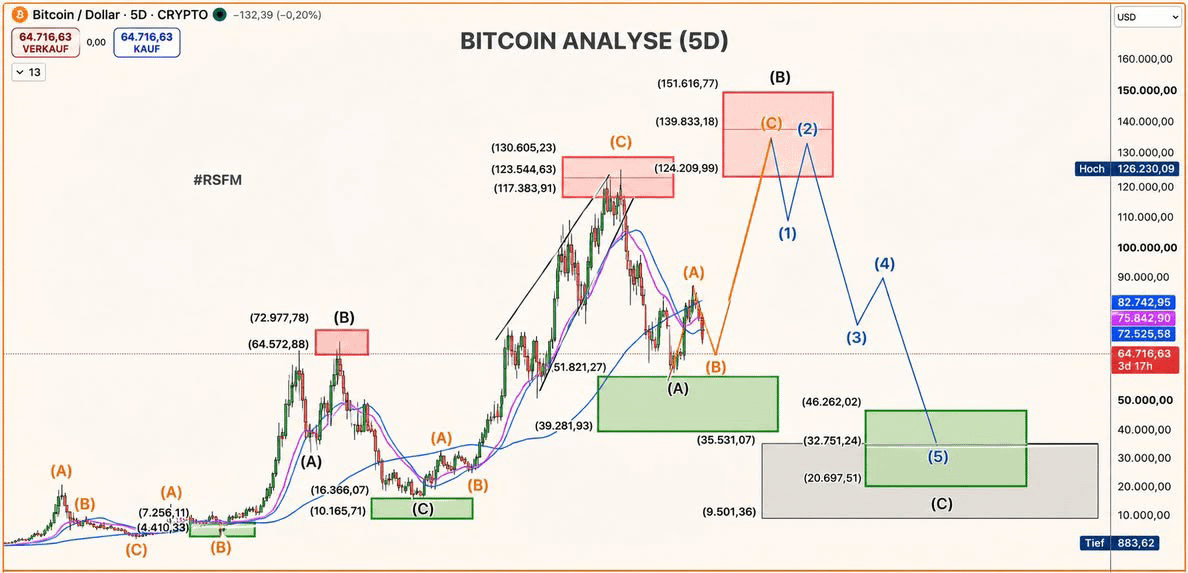
Bitcoin to $40K–$50K? What the Macro Elliott Wave Count Says 📉📊
When price action gets volatile, stepping back to look at higher-timeframe market structure helps filter out the daily noise. According to a long-term Elliott Wave projection, Bitcoin could still face a deeper corrective leg toward the $40,000–$50,000 zone.
Here is the core structural breakdown:
📌 The Wave (C) Trajectory: The broader market appears to be unfolding within a large-scale corrective Wave (C). Historically, this final corrective phase seeks out major historical demand zones to fully reset market leverage before a new multi-year impulse can begin.
📌 Sentiment vs. Structure: Retail sentiment swings wildly after every sharp move—turning euphoric on relief bounces and fearful on flushes. While technical wave counts map out probabilistic liquidity targets, short-term execution remains heavily dictated by macroeconomic shifts and geopolitical headlines
‼️ The Risk Management Perspective:
A wave count is a roadmap, not a guarantee. Whether price sweeps the $40K–$50K liquidity pocket or invalidates the bearish count early, trying to catch falling knives with high leverage is a losing game. Scaling into spot positions gradually at major structural levels remains the highest-probability approach. 🛡️
👇Do you think $BTC actually visits the $40K–$50K zone to complete this macro correction, or will institutional spot demand step in much higher? Drop your game plan below! 💬🔥
$BTC
#bitcoin #BTC #Elliottwave #cryptotrading #BinanceSquare
{spot}(BTCUSDT)
Bitcoin to $40K–$50K? What the Macro Elliott Wave Count Says 📉📊
When price action gets volatile, stepping back to look at higher-timeframe market structure helps filter out the daily noise. According to a long-term Elliott Wave projection, Bitcoin could still face a deeper corrective leg toward the $40,000–$50,000 zone.
Here is the core structural breakdown:
📌 The Wave (C) Trajectory: The broader market appears to be unfolding within a large-scale corrective Wave (C). Historically, this final corrective phase seeks out major historical demand zones to fully reset market leverage before a new multi-year impulse can begin.
📌 Sentiment vs. Structure: Retail sentiment swings wildly after every sharp move—turning euphoric on relief bounces and fearful on flushes. While technical wave counts map out probabilistic liquidity targets, short-term execution remains heavily dictated by macroeconomic shifts and geopolitical headlines
‼️ The Risk Management Perspective:
A wave count is a roadmap, not a guarantee. Whether price sweeps the $40K–$50K liquidity pocket or invalidates the bearish count early, trying to catch falling knives with high leverage is a losing game. Scaling into spot positions gradually at major structural levels remains the highest-probability approach. 🛡️
👇Do you think $BTC actually visits the $40K–$50K zone to complete this macro correction, or will institutional spot demand step in much higher? Drop your game plan below! 💬🔥
$BTC
#bitcoin #BTC #Elliottwave #cryptotrading #BinanceSquare
When price action gets volatile, stepping back to look at higher-timeframe market structure helps filter out the daily noise. According to a long-term Elliott Wave projection, Bitcoin could still face a deeper corrective leg toward the $40,000–$50,000 zone.
Here is the core structural breakdown:
📌 The Wave (C) Trajectory: The broader market appears to be unfolding within a large-scale corrective Wave (C). Historically, this final corrective phase seeks out major historical demand zones to fully reset market leverage before a new multi-year impulse can begin.
📌 Sentiment vs. Structure: Retail sentiment swings wildly after every sharp move—turning euphoric on relief bounces and fearful on flushes. While technical wave counts map out probabilistic liquidity targets, short-term execution remains heavily dictated by macroeconomic shifts and geopolitical headlines
‼️ The Risk Management Perspective:
A wave count is a roadmap, not a guarantee. Whether price sweeps the $40K–$50K liquidity pocket or invalidates the bearish count early, trying to catch falling knives with high leverage is a losing game. Scaling into spot positions gradually at major structural levels remains the highest-probability approach. 🛡️
👇Do you think $BTC actually visits the $40K–$50K zone to complete this macro correction, or will institutional spot demand step in much higher? Drop your game plan below! 💬🔥
$BTC
#bitcoin #BTC #Elliottwave #cryptotrading #BinanceSquare
34
1
20
19.8k
ປັກໝຸດ
·
--
🚨 DON'T GET CAUGHT IN THE BITCOIN TRAP!
Bitcoin is following the pattern I predicted weeks ago. This could be the final bull trap of the cycle.
Remember, I called Bitcoin's $17K bottom in 2022 and $126K top in 2025, both in advance.
Don't mistake a temporary bounce for a trend reversal. Stay cautious and protect your capital.
Follow me for my next Bitcoin call! 📉
🚨 DON'T GET CAUGHT IN THE BITCOIN TRAP!
Bitcoin is following the pattern I predicted weeks ago. This could be the final bull trap of the cycle.
Remember, I called Bitcoin's $17K bottom in 2022 and $126K top in 2025, both in advance.
Don't mistake a temporary bounce for a trend reversal. Stay cautious and protect your capital.
Follow me for my next Bitcoin call! 📉
Bitcoin is following the pattern I predicted weeks ago. This could be the final bull trap of the cycle.
Remember, I called Bitcoin's $17K bottom in 2022 and $126K top in 2025, both in advance.
Don't mistake a temporary bounce for a trend reversal. Stay cautious and protect your capital.
Follow me for my next Bitcoin call! 📉
1
49
7.2k
·
--
ຢືນຢັນແລ້ວ
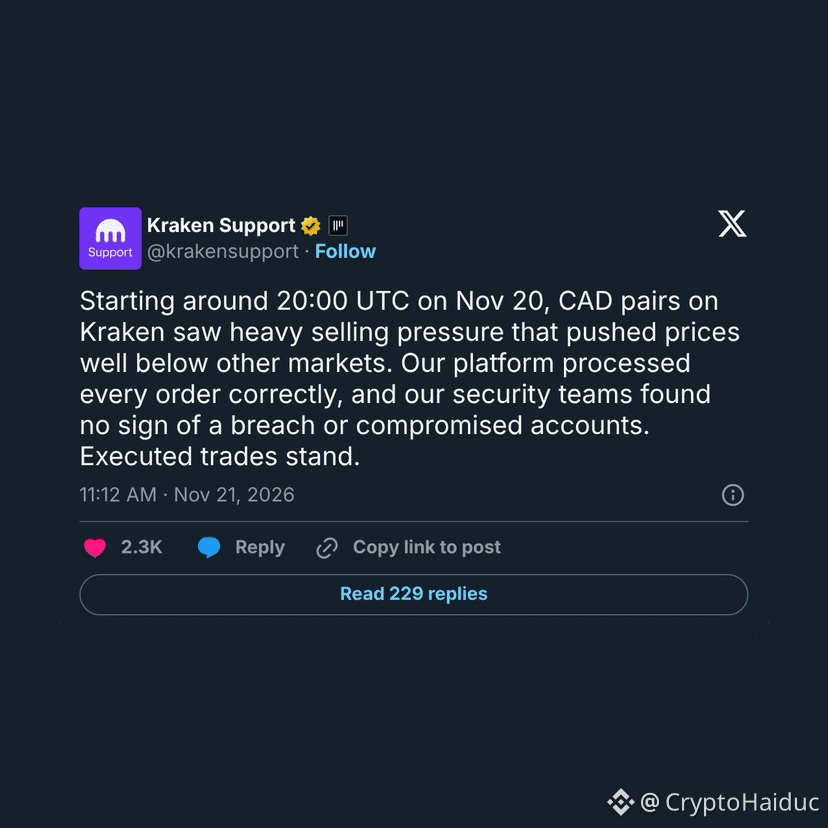
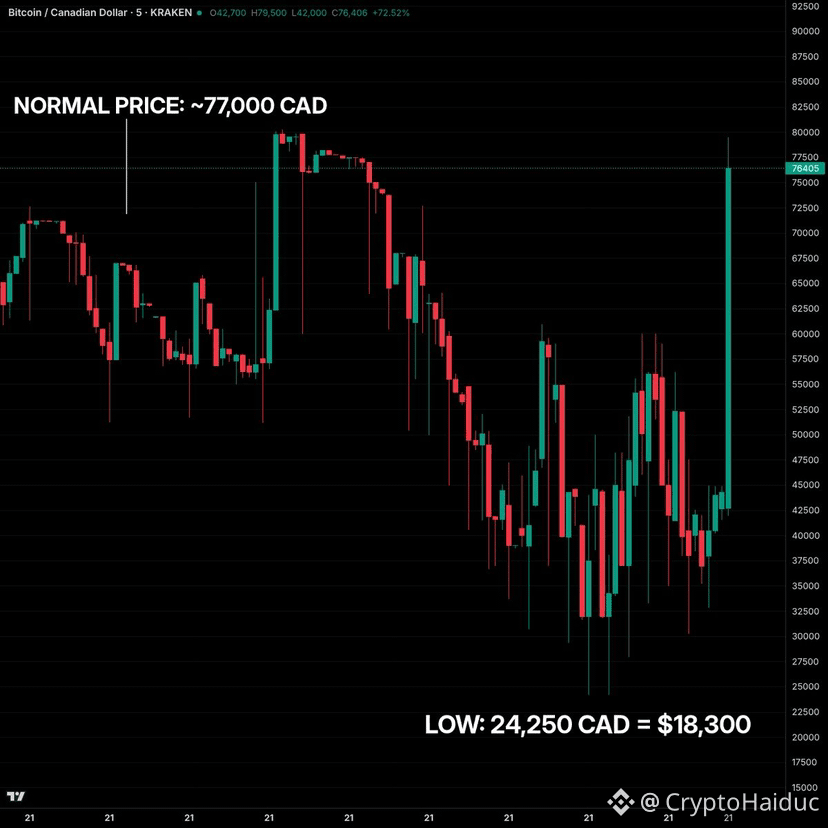
Kraken vs. Binance: Bitcoin Sold at ~$18,300 on Kraken While Trading at $57K Everywhere Else 🚨⚠️
If you ever needed a real-world stress test on why trading venue liquidity is a core risk-management pillar, look at what just unfolded on Kraken’s BTC/CAD pair.
While global Bitcoin hovered near the mid-$50,000s, heavy sell pressure against thin Canadian dollar order books and deposit/arbitrage friction sent BTC/CAD down to 24,250 CAD (roughly ~$16,900 - $18,300 USD depending on FX conversion) - a massive dislocation of roughly 68% - 71% below broader market pricing.
🔴 What Happened & Why "Executed Trades Stand" Hurts
📌 Sell orders overwhelmed thin CAD buy-side depth, while deposit limits and slow CAD inflows delayed arbitrage from quickly closing the gap.
📌 #Kraken confirmed there was no security breach or compromised accounts, stating that orders were processed normally and executed trades stand—meaning bargain buyers kept cheap fills, while sellers or stop-losses on that thin book took severe price slippage.
📌 That is the harsh reality of low-liquidity pairs during acute market stress: when order book depth thins out, execution price can detach violently from global benchmarks.
🛡️ Kraken vs. #Binance : Why We Appreciate Being on Binance
Comparing localized order-book dislocations against tier-1 global liquidity highlights the practical edge of trading where depth and participation are deepest:
1️⃣ Order Book Depth & Liquidity Cushion: Deep global liquidity and heavy active market-maker participation help absorb sharp order flow without isolated books snapping as easily.
2️⃣ Tighter Alignment With Global Price Discovery: High-volume venues generally maintain much tighter alignment with global reference prices during fast cascades, reducing extreme localized slippage risk.
3️⃣ Operational Resilience Under Stress: Even in volatile sessions where liquidations spike across the market, deep books and high-throughput matching engines are critical to executing risk controls cleanly.
$BTC
#BTC #BinanceSquare
{spot}(BTCUSDT)
Kraken vs. Binance: Bitcoin Sold at ~$18,300 on Kraken While Trading at $57K Everywhere Else 🚨⚠️
If you ever needed a real-world stress test on why trading venue liquidity is a core risk-management pillar, look at what just unfolded on Kraken’s BTC/CAD pair.
While global Bitcoin hovered near the mid-$50,000s, heavy sell pressure against thin Canadian dollar order books and deposit/arbitrage friction sent BTC/CAD down to 24,250 CAD (roughly ~$16,900 - $18,300 USD depending on FX conversion) - a massive dislocation of roughly 68% - 71% below broader market pricing.
🔴 What Happened & Why "Executed Trades Stand" Hurts
📌 Sell orders overwhelmed thin CAD buy-side depth, while deposit limits and slow CAD inflows delayed arbitrage from quickly closing the gap.
📌 #Kraken confirmed there was no security breach or compromised accounts, stating that orders were processed normally and executed trades stand—meaning bargain buyers kept cheap fills, while sellers or stop-losses on that thin book took severe price slippage.
📌 That is the harsh reality of low-liquidity pairs during acute market stress: when order book depth thins out, execution price can detach violently from global benchmarks.
🛡️ Kraken vs. #Binance : Why We Appreciate Being on Binance
Comparing localized order-book dislocations against tier-1 global liquidity highlights the practical edge of trading where depth and participation are deepest:
1️⃣ Order Book Depth & Liquidity Cushion: Deep global liquidity and heavy active market-maker participation help absorb sharp order flow without isolated books snapping as easily.
2️⃣ Tighter Alignment With Global Price Discovery: High-volume venues generally maintain much tighter alignment with global reference prices during fast cascades, reducing extreme localized slippage risk.
3️⃣ Operational Resilience Under Stress: Even in volatile sessions where liquidations spike across the market, deep books and high-throughput matching engines are critical to executing risk controls cleanly.
$BTC
#BTC #BinanceSquare
If you ever needed a real-world stress test on why trading venue liquidity is a core risk-management pillar, look at what just unfolded on Kraken’s BTC/CAD pair.
While global Bitcoin hovered near the mid-$50,000s, heavy sell pressure against thin Canadian dollar order books and deposit/arbitrage friction sent BTC/CAD down to 24,250 CAD (roughly ~$16,900 - $18,300 USD depending on FX conversion) - a massive dislocation of roughly 68% - 71% below broader market pricing.
🔴 What Happened & Why "Executed Trades Stand" Hurts
📌 Sell orders overwhelmed thin CAD buy-side depth, while deposit limits and slow CAD inflows delayed arbitrage from quickly closing the gap.
📌 #Kraken confirmed there was no security breach or compromised accounts, stating that orders were processed normally and executed trades stand—meaning bargain buyers kept cheap fills, while sellers or stop-losses on that thin book took severe price slippage.
📌 That is the harsh reality of low-liquidity pairs during acute market stress: when order book depth thins out, execution price can detach violently from global benchmarks.
🛡️ Kraken vs. #Binance : Why We Appreciate Being on Binance
Comparing localized order-book dislocations against tier-1 global liquidity highlights the practical edge of trading where depth and participation are deepest:
1️⃣ Order Book Depth & Liquidity Cushion: Deep global liquidity and heavy active market-maker participation help absorb sharp order flow without isolated books snapping as easily.
2️⃣ Tighter Alignment With Global Price Discovery: High-volume venues generally maintain much tighter alignment with global reference prices during fast cascades, reducing extreme localized slippage risk.
3️⃣ Operational Resilience Under Stress: Even in volatile sessions where liquidations spike across the market, deep books and high-throughput matching engines are critical to executing risk controls cleanly.
$BTC
#BTC #BinanceSquare
1
127
·
--
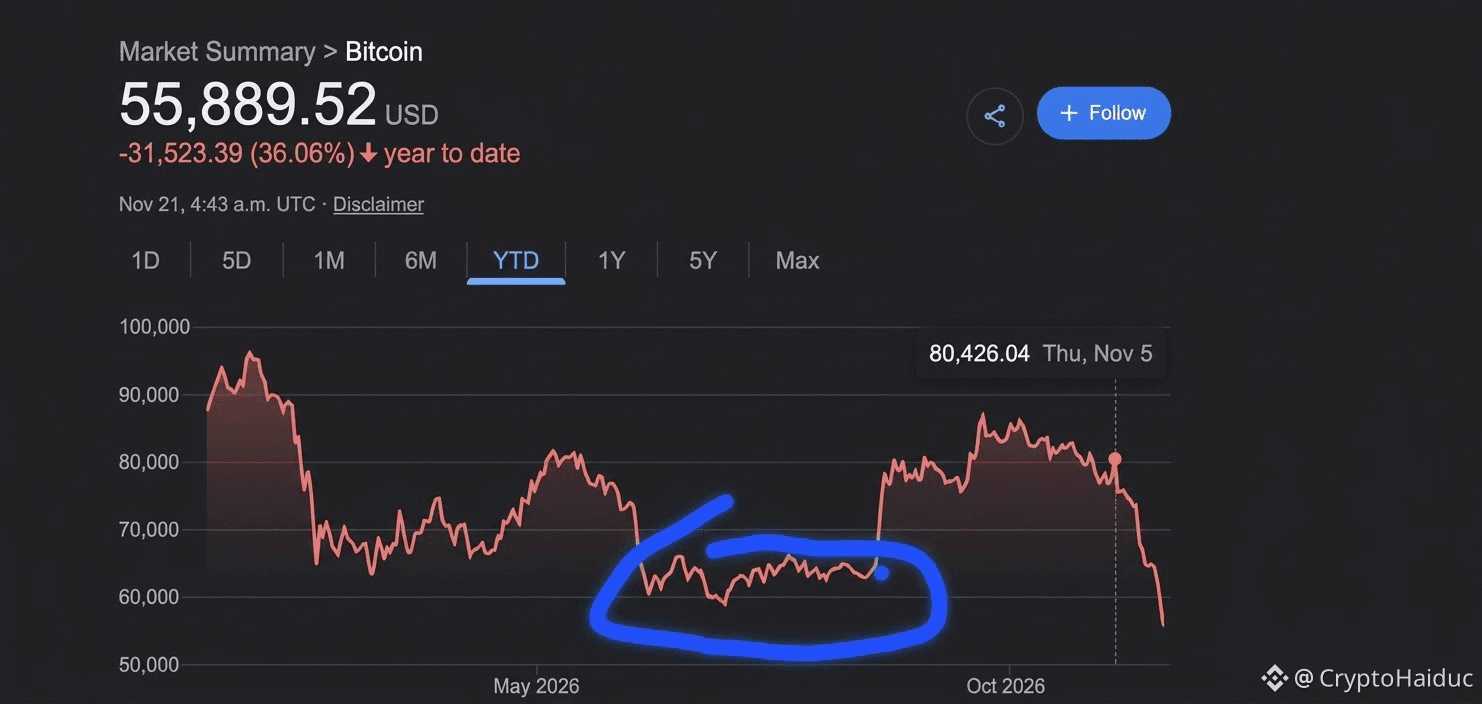
❓Think It’s Cheap Enough to Buy the Dip? Here’s What a Real Bottom Looks Like 📉🧠
When prices pull back sharply and red candles dominate your screen, the urge to go all-in on "cheap" entries is hard to resist. Before deploying heavy capital, take a step back and check whether we are actually looking at a true structural bottom - or just a discount on the way to a deeper flush.
Real market bottoms rarely feel comfortable or obvious. Here is what they typically look like under the hood:
1️⃣ Peak Apathy & Despair (Not Peak Hype) 💎
📌 True bottoms form when retail gets exhausted, stops checking charts every 5 minutes, & gives up on quick bounces.
📌 If social feeds are still full of "easy bounce" calls & aggressive dip-buying bravado, capitulation may not be finished yet
2️⃣ Leverage Flushed & Liquidity Cleared 💥
📌 Over-leveraged longs get wiped out, Open Interest cools off, & forced liquidations run out of fuel.
📌 Macro liquidity pressures (like tighter funding, equity deleveraging, or major capital drains) start easing rather than accelerating
3️⃣ Price Stops Making New Lows & Demand Absorbs Supply 🛡️
📌 A bottom isn't just a red candle - it’s a structural base where sellers run out of size & spot bids consistently absorb incoming supply.
📌Higher-timeframe support levels hold on retests instead of acting as brief speed bumps.
💡 How to Play It Without Getting Wrecked:
🛑🫷No Leverage: High leverage turns a "cheap" entry into a forced liquidation if price wicks lower.
⚖️ Scale in Tranches: If you are accumulating spot for the long term, divide your capital into planned tranches across key structural zones rather than blowing everything at once.
💰Respect Liquidity: A dip isn't cheap just because it fell - it's only an opportunity if your risk management survives another leg down. ⚠️
Are you scaling into spot in small tranches right now, or waiting for clearer confirmation that sellers are exhausted? Drop your strategy below! 💬
$BTC #cryptotrading #BinanceSquare
{spot}(BTCUSDT)
❓Think It’s Cheap Enough to Buy the Dip? Here’s What a Real Bottom Looks Like 📉🧠
When prices pull back sharply and red candles dominate your screen, the urge to go all-in on "cheap" entries is hard to resist. Before deploying heavy capital, take a step back and check whether we are actually looking at a true structural bottom - or just a discount on the way to a deeper flush.
Real market bottoms rarely feel comfortable or obvious. Here is what they typically look like under the hood:
1️⃣ Peak Apathy & Despair (Not Peak Hype) 💎
📌 True bottoms form when retail gets exhausted, stops checking charts every 5 minutes, & gives up on quick bounces.
📌 If social feeds are still full of "easy bounce" calls & aggressive dip-buying bravado, capitulation may not be finished yet
2️⃣ Leverage Flushed & Liquidity Cleared 💥
📌 Over-leveraged longs get wiped out, Open Interest cools off, & forced liquidations run out of fuel.
📌 Macro liquidity pressures (like tighter funding, equity deleveraging, or major capital drains) start easing rather than accelerating
3️⃣ Price Stops Making New Lows & Demand Absorbs Supply 🛡️
📌 A bottom isn't just a red candle - it’s a structural base where sellers run out of size & spot bids consistently absorb incoming supply.
📌Higher-timeframe support levels hold on retests instead of acting as brief speed bumps.
💡 How to Play It Without Getting Wrecked:
🛑🫷No Leverage: High leverage turns a "cheap" entry into a forced liquidation if price wicks lower.
⚖️ Scale in Tranches: If you are accumulating spot for the long term, divide your capital into planned tranches across key structural zones rather than blowing everything at once.
💰Respect Liquidity: A dip isn't cheap just because it fell - it's only an opportunity if your risk management survives another leg down. ⚠️
Are you scaling into spot in small tranches right now, or waiting for clearer confirmation that sellers are exhausted? Drop your strategy below! 💬
$BTC #cryptotrading #BinanceSquare
When prices pull back sharply and red candles dominate your screen, the urge to go all-in on "cheap" entries is hard to resist. Before deploying heavy capital, take a step back and check whether we are actually looking at a true structural bottom - or just a discount on the way to a deeper flush.
Real market bottoms rarely feel comfortable or obvious. Here is what they typically look like under the hood:
1️⃣ Peak Apathy & Despair (Not Peak Hype) 💎
📌 True bottoms form when retail gets exhausted, stops checking charts every 5 minutes, & gives up on quick bounces.
📌 If social feeds are still full of "easy bounce" calls & aggressive dip-buying bravado, capitulation may not be finished yet
2️⃣ Leverage Flushed & Liquidity Cleared 💥
📌 Over-leveraged longs get wiped out, Open Interest cools off, & forced liquidations run out of fuel.
📌 Macro liquidity pressures (like tighter funding, equity deleveraging, or major capital drains) start easing rather than accelerating
3️⃣ Price Stops Making New Lows & Demand Absorbs Supply 🛡️
📌 A bottom isn't just a red candle - it’s a structural base where sellers run out of size & spot bids consistently absorb incoming supply.
📌Higher-timeframe support levels hold on retests instead of acting as brief speed bumps.
💡 How to Play It Without Getting Wrecked:
🛑🫷No Leverage: High leverage turns a "cheap" entry into a forced liquidation if price wicks lower.
⚖️ Scale in Tranches: If you are accumulating spot for the long term, divide your capital into planned tranches across key structural zones rather than blowing everything at once.
💰Respect Liquidity: A dip isn't cheap just because it fell - it's only an opportunity if your risk management survives another leg down. ⚠️
Are you scaling into spot in small tranches right now, or waiting for clearer confirmation that sellers are exhausted? Drop your strategy below! 💬
$BTC #cryptotrading #BinanceSquare
1
132
·
--
Well, we are heading there, aren't we? Cheap Bitcoin on the market. 💆♂️
$BTC
{spot}(BTCUSDT)
Well, we are heading there, aren't we? Cheap Bitcoin on the market. 💆♂️
$BTC
$BTC
CryptoHaiduc
·
--
Bitcoin to $40K–$50K? What the Macro Elliott Wave Count Says 📉📊
When price action gets volatile, stepping back to look at higher-timeframe market structure helps filter out the daily noise. According to a long-term Elliott Wave projection, Bitcoin could still face a deeper corrective leg toward the $40,000–$50,000 zone.
Here is the core structural breakdown:
📌 The Wave (C) Trajectory: The broader market appears to be unfolding within a large-scale corrective Wave (C). Historically, this final corrective phase seeks out major historical demand zones to fully reset market leverage before a new multi-year impulse can begin.
📌 Sentiment vs. Structure: Retail sentiment swings wildly after every sharp move—turning euphoric on relief bounces and fearful on flushes. While technical wave counts map out probabilistic liquidity targets, short-term execution remains heavily dictated by macroeconomic shifts and geopolitical headlines
‼️ The Risk Management Perspective:
A wave count is a roadmap, not a guarantee. Whether price sweeps the $40K–$50K liquidity pocket or invalidates the bearish count early, trying to catch falling knives with high leverage is a losing game. Scaling into spot positions gradually at major structural levels remains the highest-probability approach. 🛡️
👇Do you think $BTC actually visits the $40K–$50K zone to complete this macro correction, or will institutional spot demand step in much higher? Drop your game plan below! 💬🔥
$BTC
#bitcoin #BTC #Elliottwave #cryptotrading #BinanceSquare
When price action gets volatile, stepping back to look at higher-timeframe market structure helps filter out the daily noise. According to a long-term Elliott Wave projection, Bitcoin could still face a deeper corrective leg toward the $40,000–$50,000 zone.
Here is the core structural breakdown:
📌 The Wave (C) Trajectory: The broader market appears to be unfolding within a large-scale corrective Wave (C). Historically, this final corrective phase seeks out major historical demand zones to fully reset market leverage before a new multi-year impulse can begin.
📌 Sentiment vs. Structure: Retail sentiment swings wildly after every sharp move—turning euphoric on relief bounces and fearful on flushes. While technical wave counts map out probabilistic liquidity targets, short-term execution remains heavily dictated by macroeconomic shifts and geopolitical headlines
‼️ The Risk Management Perspective:
A wave count is a roadmap, not a guarantee. Whether price sweeps the $40K–$50K liquidity pocket or invalidates the bearish count early, trying to catch falling knives with high leverage is a losing game. Scaling into spot positions gradually at major structural levels remains the highest-probability approach. 🛡️
👇Do you think $BTC actually visits the $40K–$50K zone to complete this macro correction, or will institutional spot demand step in much higher? Drop your game plan below! 💬🔥
$BTC
#bitcoin #BTC #Elliottwave #cryptotrading #BinanceSquare
3
1
120
·
--
BTC goes under 50K 🐻
BTC holds steadily above 50K 🐂
5 ມື້ທີ່ຍັງເຫຼືອ
2
1
228
·
--
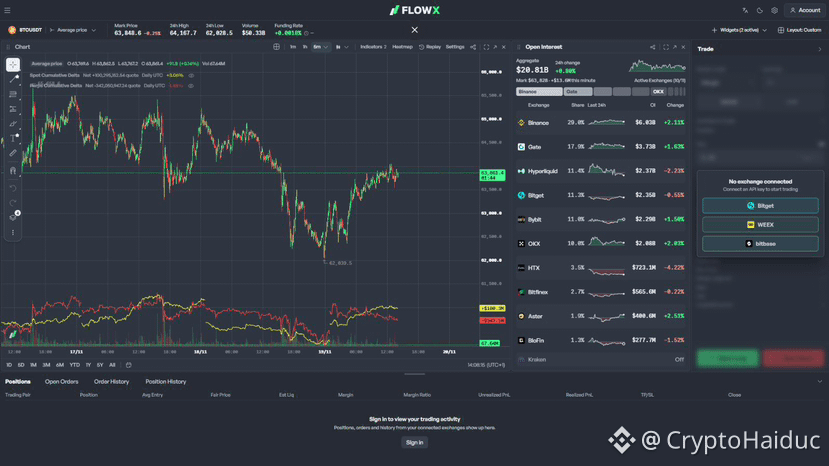
🚨 Why Is Bitcoin Bouncing While Perps Are Still Selling? Order Flow Breakdown 📊⚡
Price action often looks contradictory on the surface until you separate spot demand from derivative positioning. Order flow data is flashing a classic short-squeeze setup.
1️⃣ Spot Absorption vs. Aggressive Perp Selling 🛡️
Yesterday, $BTC flushed down to $62,000 as perpetual futures sold aggressively and new shorts piled into the breakdown.
Today, spot buyers stepped back in with $100M in net BTC purchases, while perps still recorded $342M in net selling.
Even with futures selling outpacing spot buying by more than 3-to-1, price bounced from $62K back toward $63,800. When perps sell into a rising price, passive institutional spot bids are absorbing the entire supply.
2️⃣ Trapped Shorts & Crowded Open Interest 🎯
Total Open Interest (OI) actually climbed +0.80% to $20.81B during this move.
This confirms that the aggressive shorts opened on the way down haven't closed—they are trapped and sitting underwater on a bounce.
Notably, Binance alone holds $6.03B of that open interest-nearly 30% of the entire global market.
3️⃣ The Market Maker Playbook & Squeeze Trigger 🧠
Smart liquidity providers don't rush a squeeze. While perps keep pressing shorts at the lows, market makers let spot absorb the flow and allow late shorts to get comfortable. Every new short opened down here adds future buy-stop fuel above current price.
The 3-Step Squeeze Checklist:
📌 Perp Exhaustion: Futures selling dries up and Cumulative Volume Delta (CVD) turns upward.
📌 OI Stagnation: Open Interest stops climbing because late short-sellers run out of ammunition.
📌 Spot Continuation: Real spot buying steps in and pushes price higher.
‼️ The Risk Management Takeaway:
Once those three signals align, a crowded short trade with zero liquidity left to sell into transforms into a violent upward squeeze. Don't chase shorts at structural lows just because futures CVD looks red - that is the fuel being built for the move up.
$BTC #BTC #Binance
{spot}(BTCUSDT)
🚨 Why Is Bitcoin Bouncing While Perps Are Still Selling? Order Flow Breakdown 📊⚡
Price action often looks contradictory on the surface until you separate spot demand from derivative positioning. Order flow data is flashing a classic short-squeeze setup.
1️⃣ Spot Absorption vs. Aggressive Perp Selling 🛡️
Yesterday, $BTC flushed down to $62,000 as perpetual futures sold aggressively and new shorts piled into the breakdown.
Today, spot buyers stepped back in with $100M in net BTC purchases, while perps still recorded $342M in net selling.
Even with futures selling outpacing spot buying by more than 3-to-1, price bounced from $62K back toward $63,800. When perps sell into a rising price, passive institutional spot bids are absorbing the entire supply.
2️⃣ Trapped Shorts & Crowded Open Interest 🎯
Total Open Interest (OI) actually climbed +0.80% to $20.81B during this move.
This confirms that the aggressive shorts opened on the way down haven't closed—they are trapped and sitting underwater on a bounce.
Notably, Binance alone holds $6.03B of that open interest-nearly 30% of the entire global market.
3️⃣ The Market Maker Playbook & Squeeze Trigger 🧠
Smart liquidity providers don't rush a squeeze. While perps keep pressing shorts at the lows, market makers let spot absorb the flow and allow late shorts to get comfortable. Every new short opened down here adds future buy-stop fuel above current price.
The 3-Step Squeeze Checklist:
📌 Perp Exhaustion: Futures selling dries up and Cumulative Volume Delta (CVD) turns upward.
📌 OI Stagnation: Open Interest stops climbing because late short-sellers run out of ammunition.
📌 Spot Continuation: Real spot buying steps in and pushes price higher.
‼️ The Risk Management Takeaway:
Once those three signals align, a crowded short trade with zero liquidity left to sell into transforms into a violent upward squeeze. Don't chase shorts at structural lows just because futures CVD looks red - that is the fuel being built for the move up.
$BTC #BTC #Binance
Price action often looks contradictory on the surface until you separate spot demand from derivative positioning. Order flow data is flashing a classic short-squeeze setup.
1️⃣ Spot Absorption vs. Aggressive Perp Selling 🛡️
Yesterday, $BTC flushed down to $62,000 as perpetual futures sold aggressively and new shorts piled into the breakdown.
Today, spot buyers stepped back in with $100M in net BTC purchases, while perps still recorded $342M in net selling.
Even with futures selling outpacing spot buying by more than 3-to-1, price bounced from $62K back toward $63,800. When perps sell into a rising price, passive institutional spot bids are absorbing the entire supply.
2️⃣ Trapped Shorts & Crowded Open Interest 🎯
Total Open Interest (OI) actually climbed +0.80% to $20.81B during this move.
This confirms that the aggressive shorts opened on the way down haven't closed—they are trapped and sitting underwater on a bounce.
Notably, Binance alone holds $6.03B of that open interest-nearly 30% of the entire global market.
3️⃣ The Market Maker Playbook & Squeeze Trigger 🧠
Smart liquidity providers don't rush a squeeze. While perps keep pressing shorts at the lows, market makers let spot absorb the flow and allow late shorts to get comfortable. Every new short opened down here adds future buy-stop fuel above current price.
The 3-Step Squeeze Checklist:
📌 Perp Exhaustion: Futures selling dries up and Cumulative Volume Delta (CVD) turns upward.
📌 OI Stagnation: Open Interest stops climbing because late short-sellers run out of ammunition.
📌 Spot Continuation: Real spot buying steps in and pushes price higher.
‼️ The Risk Management Takeaway:
Once those three signals align, a crowded short trade with zero liquidity left to sell into transforms into a violent upward squeeze. Don't chase shorts at structural lows just because futures CVD looks red - that is the fuel being built for the move up.
$BTC #BTC #Binance
1
179
·
--
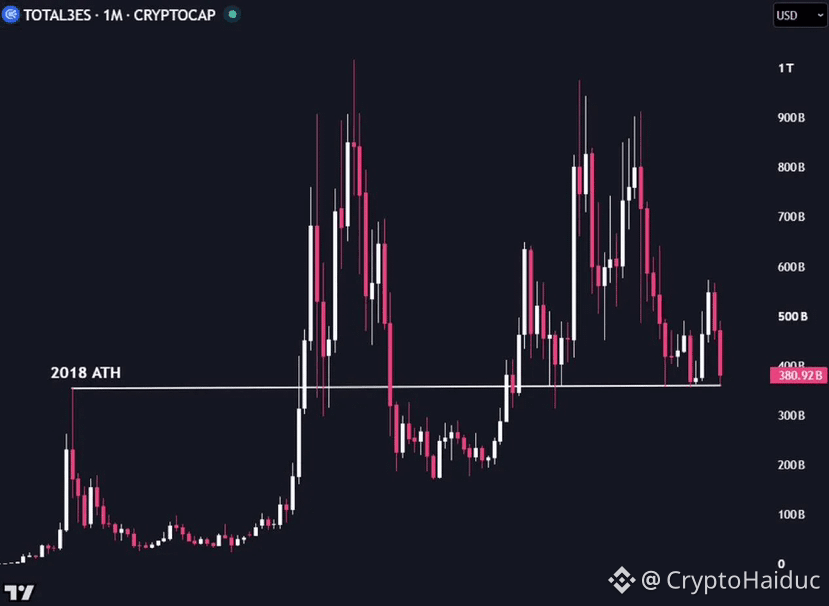
🚨 Altcoin Market Cap: Why Accumulating Now Beats 90% of the Market 📊🚀
‼️ Most retail traders wait for green candles and social media hype before buying altcoins - guaranteeing they enter at the worst possible risk-to-reward ratios. Looking closely at the broader Altcoin Market Cap (TOTAL2 / TOTAL3) structure right now reveals a rare asymmetric window.
➡️ Here is why scaling into high-conviction altcoins during this phase puts you ahead of the curve:
1️⃣ Structural Advantage Over the Crowd 🧠
📌 Accumulating while sentiment is muted and market cap sits at key macro support gives you an immediate edge over 80%–90% of market participants.
📌 By the time retail realizes the trend has shifted, early spot accumulators are already sitting on cushioned entries and playing with house money.
2️⃣ Risk-to-Reward Optimization ⚖️
📌 Buying into capitulation and sideways compression drastically reduces your downside exposure compared to chasing breakouts.
📌 You don’t need to catch the exact bottom tick- building a position gradually inside structural demand zones ensures an optimal average entry price before liquidity rotates back down the risk curve.
3️⃣ Execution Strategy: Spot & Patience 🛡️
📌 No Leverage: Altcoin volatility will wipe out over-leveraged positions long before the macro expansion begins.
📌 Tranche Accumulation (DCA): Deploy capital systematically into fundamentally strong ecosystems rather than going all-in on a single candle.
👇 Are you already scaling into your favorite altcoins at these market cap levels, or are you waiting for Bitcoin dominance to break down first? Drop your top spot picks below! 💬🔥
#altcoins #cryptotrading #Altseason #BinanceSquare #ETH
$ETH
{spot}(ETHUSDT)
$SOL
{spot}(SOLUSDT)
$BNB
{spot}(BNBUSDT)
🚨 Altcoin Market Cap: Why Accumulating Now Beats 90% of the Market 📊🚀
‼️ Most retail traders wait for green candles and social media hype before buying altcoins - guaranteeing they enter at the worst possible risk-to-reward ratios. Looking closely at the broader Altcoin Market Cap (TOTAL2 / TOTAL3) structure right now reveals a rare asymmetric window.
➡️ Here is why scaling into high-conviction altcoins during this phase puts you ahead of the curve:
1️⃣ Structural Advantage Over the Crowd 🧠
📌 Accumulating while sentiment is muted and market cap sits at key macro support gives you an immediate edge over 80%–90% of market participants.
📌 By the time retail realizes the trend has shifted, early spot accumulators are already sitting on cushioned entries and playing with house money.
2️⃣ Risk-to-Reward Optimization ⚖️
📌 Buying into capitulation and sideways compression drastically reduces your downside exposure compared to chasing breakouts.
📌 You don’t need to catch the exact bottom tick- building a position gradually inside structural demand zones ensures an optimal average entry price before liquidity rotates back down the risk curve.
3️⃣ Execution Strategy: Spot & Patience 🛡️
📌 No Leverage: Altcoin volatility will wipe out over-leveraged positions long before the macro expansion begins.
📌 Tranche Accumulation (DCA): Deploy capital systematically into fundamentally strong ecosystems rather than going all-in on a single candle.
👇 Are you already scaling into your favorite altcoins at these market cap levels, or are you waiting for Bitcoin dominance to break down first? Drop your top spot picks below! 💬🔥
#altcoins #cryptotrading #Altseason #BinanceSquare #ETH
$ETH
$SOL
$BNB
‼️ Most retail traders wait for green candles and social media hype before buying altcoins - guaranteeing they enter at the worst possible risk-to-reward ratios. Looking closely at the broader Altcoin Market Cap (TOTAL2 / TOTAL3) structure right now reveals a rare asymmetric window.
➡️ Here is why scaling into high-conviction altcoins during this phase puts you ahead of the curve:
1️⃣ Structural Advantage Over the Crowd 🧠
📌 Accumulating while sentiment is muted and market cap sits at key macro support gives you an immediate edge over 80%–90% of market participants.
📌 By the time retail realizes the trend has shifted, early spot accumulators are already sitting on cushioned entries and playing with house money.
2️⃣ Risk-to-Reward Optimization ⚖️
📌 Buying into capitulation and sideways compression drastically reduces your downside exposure compared to chasing breakouts.
📌 You don’t need to catch the exact bottom tick- building a position gradually inside structural demand zones ensures an optimal average entry price before liquidity rotates back down the risk curve.
3️⃣ Execution Strategy: Spot & Patience 🛡️
📌 No Leverage: Altcoin volatility will wipe out over-leveraged positions long before the macro expansion begins.
📌 Tranche Accumulation (DCA): Deploy capital systematically into fundamentally strong ecosystems rather than going all-in on a single candle.
👇 Are you already scaling into your favorite altcoins at these market cap levels, or are you waiting for Bitcoin dominance to break down first? Drop your top spot picks below! 💬🔥
#altcoins #cryptotrading #Altseason #BinanceSquare #ETH
$ETH
$SOL
$BNB
1
118
·
--
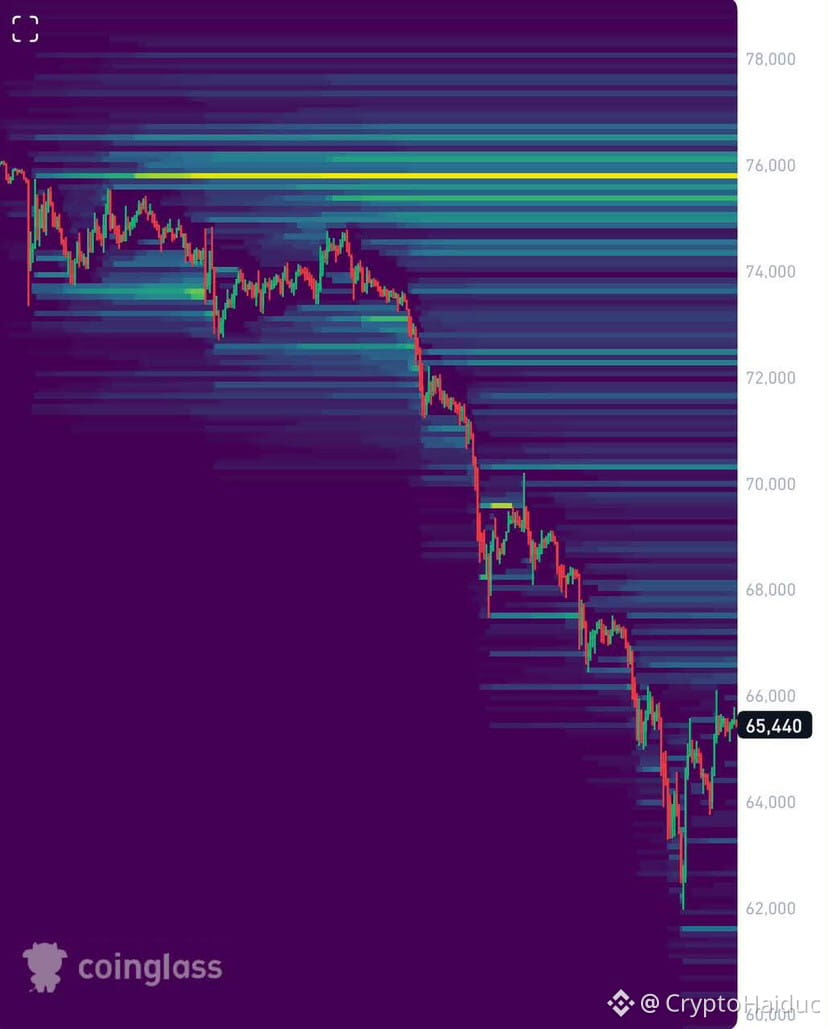
🔍 BITCOIN: LOWER LIQUIDITY IS DRYING UP. IS THE MARKET READY FOR A REBOUND? 📊
Following a massive flush down to $62,000, the market displayed a strong buyer reaction, with price recovering back toward $65,400.
Coinglass liquidation heatmap data shows that a significant portion of the downside liquidity pool has already been swept. Meanwhile, the nearest major liquidity cluster sits above—targeted around the $75,800 zone. ⚡
📉 Key Levels to Watch:
* Resistance: $66,000–$66,500 (immediate hurdle) | $68,000–$69,000 (subsequent recovery targets)
* Support: $64,000 (crucial pivot support) | $62,000 (recent flush low)
* Upside Magnet: $75,800 (major upper liquidity pocket) 🎯
📈 Scenarios:
🟢 Bullish Recovery Scenario:
If BTC holds the $64,000 floor and manages to consolidate above $66,000–$66,500 backed by a successful retest, the path opens up toward $68,000–$69,000. From there, momentum tracking toward $72,000+ comes into play.
🔴 Bearish Continuation Scenario:
If price loses $64,000 and any relief attempt back above fails, the probability of retesting the $62,000 low increases dramatically. A breakdown below $62,000 exposes the $60,000–$61,000 zone.
➡️ My Perspective:
I am currently leaning slightly toward a continuation of the relief bounce. After such an aggressive liquidity sweep and mass position liquidation, the local recovery risk-reward looks compelling.
However, keep this in mind: a cleared lower order book doesn't completely rule out a retest of lows later on. Market structure requires confirmation.
‼️ Bottom Line:
Monitoring the reaction around $64,000–$66,500 closely. Holding support and flipping overhead resistance confirms recovery continuation, while a loss of $64,000 invalidates the immediate bullish thesis. ⚠️
Do you think we push toward the $70,000–$75,800 liquidity cluster next, or will the market drop back down to hunt liquidity below $62,000 first?
$BTC
#bitcoin #BTC #cryptotrading #liquidity #BinanceSquareFamily
{spot}(BTCUSDT)
🔍 BITCOIN: LOWER LIQUIDITY IS DRYING UP. IS THE MARKET READY FOR A REBOUND? 📊
Following a massive flush down to $62,000, the market displayed a strong buyer reaction, with price recovering back toward $65,400.
Coinglass liquidation heatmap data shows that a significant portion of the downside liquidity pool has already been swept. Meanwhile, the nearest major liquidity cluster sits above—targeted around the $75,800 zone. ⚡
📉 Key Levels to Watch:
* Resistance: $66,000–$66,500 (immediate hurdle) | $68,000–$69,000 (subsequent recovery targets)
* Support: $64,000 (crucial pivot support) | $62,000 (recent flush low)
* Upside Magnet: $75,800 (major upper liquidity pocket) 🎯
📈 Scenarios:
🟢 Bullish Recovery Scenario:
If BTC holds the $64,000 floor and manages to consolidate above $66,000–$66,500 backed by a successful retest, the path opens up toward $68,000–$69,000. From there, momentum tracking toward $72,000+ comes into play.
🔴 Bearish Continuation Scenario:
If price loses $64,000 and any relief attempt back above fails, the probability of retesting the $62,000 low increases dramatically. A breakdown below $62,000 exposes the $60,000–$61,000 zone.
➡️ My Perspective:
I am currently leaning slightly toward a continuation of the relief bounce. After such an aggressive liquidity sweep and mass position liquidation, the local recovery risk-reward looks compelling.
However, keep this in mind: a cleared lower order book doesn't completely rule out a retest of lows later on. Market structure requires confirmation.
‼️ Bottom Line:
Monitoring the reaction around $64,000–$66,500 closely. Holding support and flipping overhead resistance confirms recovery continuation, while a loss of $64,000 invalidates the immediate bullish thesis. ⚠️
Do you think we push toward the $70,000–$75,800 liquidity cluster next, or will the market drop back down to hunt liquidity below $62,000 first?
$BTC
#bitcoin #BTC #cryptotrading #liquidity #BinanceSquareFamily
Following a massive flush down to $62,000, the market displayed a strong buyer reaction, with price recovering back toward $65,400.
Coinglass liquidation heatmap data shows that a significant portion of the downside liquidity pool has already been swept. Meanwhile, the nearest major liquidity cluster sits above—targeted around the $75,800 zone. ⚡
📉 Key Levels to Watch:
* Resistance: $66,000–$66,500 (immediate hurdle) | $68,000–$69,000 (subsequent recovery targets)
* Support: $64,000 (crucial pivot support) | $62,000 (recent flush low)
* Upside Magnet: $75,800 (major upper liquidity pocket) 🎯
📈 Scenarios:
🟢 Bullish Recovery Scenario:
If BTC holds the $64,000 floor and manages to consolidate above $66,000–$66,500 backed by a successful retest, the path opens up toward $68,000–$69,000. From there, momentum tracking toward $72,000+ comes into play.
🔴 Bearish Continuation Scenario:
If price loses $64,000 and any relief attempt back above fails, the probability of retesting the $62,000 low increases dramatically. A breakdown below $62,000 exposes the $60,000–$61,000 zone.
➡️ My Perspective:
I am currently leaning slightly toward a continuation of the relief bounce. After such an aggressive liquidity sweep and mass position liquidation, the local recovery risk-reward looks compelling.
However, keep this in mind: a cleared lower order book doesn't completely rule out a retest of lows later on. Market structure requires confirmation.
‼️ Bottom Line:
Monitoring the reaction around $64,000–$66,500 closely. Holding support and flipping overhead resistance confirms recovery continuation, while a loss of $64,000 invalidates the immediate bullish thesis. ⚠️
Do you think we push toward the $70,000–$75,800 liquidity cluster next, or will the market drop back down to hunt liquidity below $62,000 first?
$BTC
#bitcoin #BTC #cryptotrading #liquidity #BinanceSquareFamily
1
239
·
--
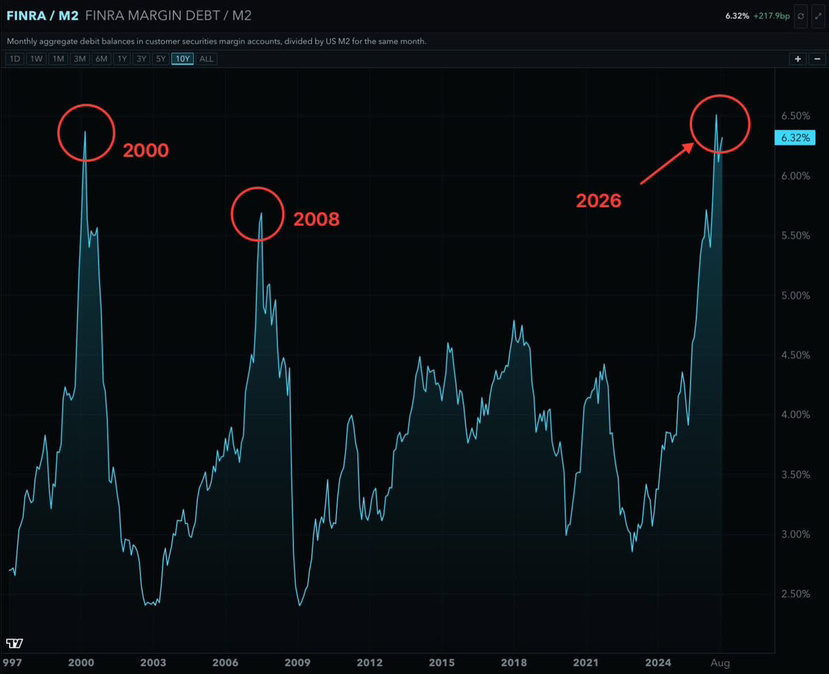
‼️ Record Margin Debt Meets M2 Liquidity ⚠️📉
⏳ History rarely repeats itself exactly, but it often rhymes in terrifying ways. Take a close look at the macro setup unfolding in the U.S. markets right now.
The chart maps the exact ratio between U.S. stock market leverage (margin debt) and the M2 money supply.
🚨 The Warning Sign:
This ratio has reached critically unprecedented highs. Historically, we have only seen readings at this extreme level twice before:
➡️ Right before the explosive peak of the dot-com bubble (2000).
➡️ Just prior to the catastrophic collapse of the subprime mortgage/housing bubble (2008).
📊 What Does This Mean for Markets?
When speculative leverage detaches from underlying fiat liquidity to this degree, systemic vulnerability skyrockets. A heavily leveraged market leaves zero margin for error when macro winds shift or liquidity tightens.
While equities push the limits, risk-on assets across the board—including crypto—feel the eventual shockwaves of macro deleveraging.
💡 THE BIG QUESTION:
Do you think central banks will step in with another liquidity wave to rescue the market this time, or are we heading toward a historic structural flush?
$BTC
#MacroEconomics #Leverage #liquidity #BinanceSquareFamily #MarketAnalysis
{spot}(BTCUSDT)
‼️ Record Margin Debt Meets M2 Liquidity ⚠️📉
⏳ History rarely repeats itself exactly, but it often rhymes in terrifying ways. Take a close look at the macro setup unfolding in the U.S. markets right now.
The chart maps the exact ratio between U.S. stock market leverage (margin debt) and the M2 money supply.
🚨 The Warning Sign:
This ratio has reached critically unprecedented highs. Historically, we have only seen readings at this extreme level twice before:
➡️ Right before the explosive peak of the dot-com bubble (2000).
➡️ Just prior to the catastrophic collapse of the subprime mortgage/housing bubble (2008).
📊 What Does This Mean for Markets?
When speculative leverage detaches from underlying fiat liquidity to this degree, systemic vulnerability skyrockets. A heavily leveraged market leaves zero margin for error when macro winds shift or liquidity tightens.
While equities push the limits, risk-on assets across the board—including crypto—feel the eventual shockwaves of macro deleveraging.
💡 THE BIG QUESTION:
Do you think central banks will step in with another liquidity wave to rescue the market this time, or are we heading toward a historic structural flush?
$BTC
#MacroEconomics #Leverage #liquidity #BinanceSquareFamily #MarketAnalysis
⏳ History rarely repeats itself exactly, but it often rhymes in terrifying ways. Take a close look at the macro setup unfolding in the U.S. markets right now.
The chart maps the exact ratio between U.S. stock market leverage (margin debt) and the M2 money supply.
🚨 The Warning Sign:
This ratio has reached critically unprecedented highs. Historically, we have only seen readings at this extreme level twice before:
➡️ Right before the explosive peak of the dot-com bubble (2000).
➡️ Just prior to the catastrophic collapse of the subprime mortgage/housing bubble (2008).
📊 What Does This Mean for Markets?
When speculative leverage detaches from underlying fiat liquidity to this degree, systemic vulnerability skyrockets. A heavily leveraged market leaves zero margin for error when macro winds shift or liquidity tightens.
While equities push the limits, risk-on assets across the board—including crypto—feel the eventual shockwaves of macro deleveraging.
💡 THE BIG QUESTION:
Do you think central banks will step in with another liquidity wave to rescue the market this time, or are we heading toward a historic structural flush?
$BTC
#MacroEconomics #Leverage #liquidity #BinanceSquareFamily #MarketAnalysis
1
128
·
--
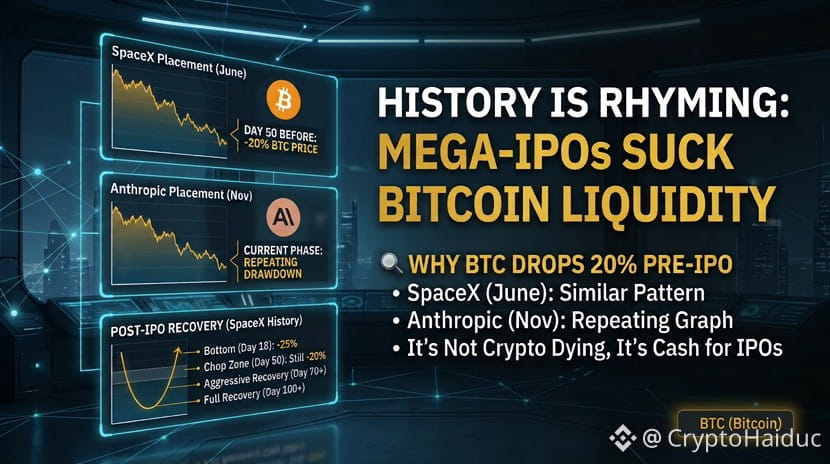
‼️ History is Rhyming: Why Mega-IPOs Are Sucking Liquidity Out of Bitcoin 📊📉
➡️ Macro markets rarely move by coincidence. Notice a familiar pattern?
🔸June: SpaceX triggers a massive liquidity event targeting $75 billion. Exactly 50 days prior, Bitcoin sheds roughly a fifth of its value.
🔸 November: Anthropic’s massive placement is slated with a valuation up to $64 billion. The chart behavior? Almost an exact carbon copy.
🔍 The Mechanics: Why BTC is First in Line?
Why does this happen? Giant equity placements act as a massive liquidity vacuum. To fund applications and secure allocations, funds and private investors need immediate cash. They liquidate whatever trades fastest and offers 24/7 liquidity. Bitcoin takes the first hit.
This isn't "crypto dying." It’s simply institutional capital stepping out of the room temporarily.
⏳ The Aftermath: What Happened After the SpaceX Event?
Looking back at the historical timeline tracked by market analysts:
🔸Day 18 post-placement: Local bottom reached (approx. -25%).
🔸 Day 50: Prices still hovering near -20%.
🔸 Day 70: A sharp, aggressive expansion phase kicks in.
🔸 Day 100: Price fully recovers and trades higher than pre-drop levels.
If history repeats, projections point toward the $90K range by late February. But remember a crucial detail: after the placement, prices bled for another three weeks and chopped sideways in a deep drawdown for two months.
Even in the best-case scenario, the playbook is always the same: First it hurts, then it gets boring, and only then does it pump. And historical precedent is a guideline, not a guarantee.
💡 The Risk Management Takeaway:
If you're positioning for the eventual recovery bounce, do it with spot assets and in tranches. Leverage does not survive this type of macro-liquidity flush. ⚠️
❓Are you accumulating this liquidity dip incrementally, or are you sitting on cash until the macro dust settles?
$BTC
#bitcoin #BTC #MacroEconomics #CryptoTrading #BinanceSquareFamily
{spot}(BTCUSDT)
‼️ History is Rhyming: Why Mega-IPOs Are Sucking Liquidity Out of Bitcoin 📊📉
➡️ Macro markets rarely move by coincidence. Notice a familiar pattern?
🔸June: SpaceX triggers a massive liquidity event targeting $75 billion. Exactly 50 days prior, Bitcoin sheds roughly a fifth of its value.
🔸 November: Anthropic’s massive placement is slated with a valuation up to $64 billion. The chart behavior? Almost an exact carbon copy.
🔍 The Mechanics: Why BTC is First in Line?
Why does this happen? Giant equity placements act as a massive liquidity vacuum. To fund applications and secure allocations, funds and private investors need immediate cash. They liquidate whatever trades fastest and offers 24/7 liquidity. Bitcoin takes the first hit.
This isn't "crypto dying." It’s simply institutional capital stepping out of the room temporarily.
⏳ The Aftermath: What Happened After the SpaceX Event?
Looking back at the historical timeline tracked by market analysts:
🔸Day 18 post-placement: Local bottom reached (approx. -25%).
🔸 Day 50: Prices still hovering near -20%.
🔸 Day 70: A sharp, aggressive expansion phase kicks in.
🔸 Day 100: Price fully recovers and trades higher than pre-drop levels.
If history repeats, projections point toward the $90K range by late February. But remember a crucial detail: after the placement, prices bled for another three weeks and chopped sideways in a deep drawdown for two months.
Even in the best-case scenario, the playbook is always the same: First it hurts, then it gets boring, and only then does it pump. And historical precedent is a guideline, not a guarantee.
💡 The Risk Management Takeaway:
If you're positioning for the eventual recovery bounce, do it with spot assets and in tranches. Leverage does not survive this type of macro-liquidity flush. ⚠️
❓Are you accumulating this liquidity dip incrementally, or are you sitting on cash until the macro dust settles?
$BTC
#bitcoin #BTC #MacroEconomics #CryptoTrading #BinanceSquareFamily
➡️ Macro markets rarely move by coincidence. Notice a familiar pattern?
🔸June: SpaceX triggers a massive liquidity event targeting $75 billion. Exactly 50 days prior, Bitcoin sheds roughly a fifth of its value.
🔸 November: Anthropic’s massive placement is slated with a valuation up to $64 billion. The chart behavior? Almost an exact carbon copy.
🔍 The Mechanics: Why BTC is First in Line?
Why does this happen? Giant equity placements act as a massive liquidity vacuum. To fund applications and secure allocations, funds and private investors need immediate cash. They liquidate whatever trades fastest and offers 24/7 liquidity. Bitcoin takes the first hit.
This isn't "crypto dying." It’s simply institutional capital stepping out of the room temporarily.
⏳ The Aftermath: What Happened After the SpaceX Event?
Looking back at the historical timeline tracked by market analysts:
🔸Day 18 post-placement: Local bottom reached (approx. -25%).
🔸 Day 50: Prices still hovering near -20%.
🔸 Day 70: A sharp, aggressive expansion phase kicks in.
🔸 Day 100: Price fully recovers and trades higher than pre-drop levels.
If history repeats, projections point toward the $90K range by late February. But remember a crucial detail: after the placement, prices bled for another three weeks and chopped sideways in a deep drawdown for two months.
Even in the best-case scenario, the playbook is always the same: First it hurts, then it gets boring, and only then does it pump. And historical precedent is a guideline, not a guarantee.
💡 The Risk Management Takeaway:
If you're positioning for the eventual recovery bounce, do it with spot assets and in tranches. Leverage does not survive this type of macro-liquidity flush. ⚠️
❓Are you accumulating this liquidity dip incrementally, or are you sitting on cash until the macro dust settles?
$BTC
#bitcoin #BTC #MacroEconomics #CryptoTrading #BinanceSquareFamily
1
464
·
--
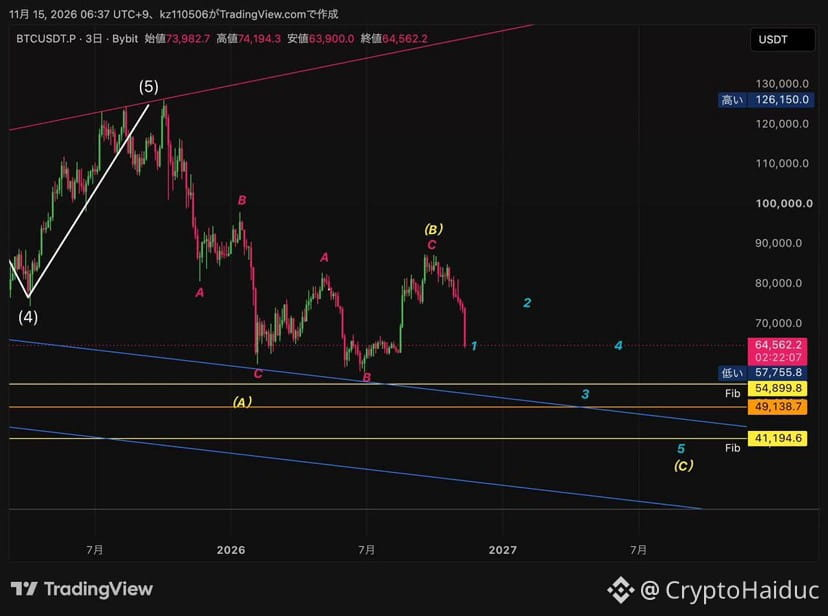
The Elliott Wave Bearish Case: Are We Heading to $41K? 📉📊
➡️ Crypto markets move in cycles, and every parabolic impulse eventually demands a structural reset. A closer look at the higher-timeframe Elliott Wave count reveals a compelling macro perspective that every risk-managed trader should consider.
1️⃣ The Completed Macro Impulse
Bullet The impulsive rally peaking near $126,000 marked the termination of Wave 5, signaling the completion of the previous multi-year bull cycle.
Bullet Following this peak, the initial sharp correction down to $58,000 acted as Wave A.
2️⃣ The Fakeout Bounce & Wave C Initiation
Bullet The subsequent recovery rally toward $87,000 served merely as a corrective Wave B relief bounce rather than a trend continuation.
Bullet We are now looking at the potential unfolding of Wave C, which historically matches or exceeds the magnitude of the initial Wave A decline.
3️⃣ Fibonacci Downside Targets & Timeline
Bullet Key structural Fibonacci extension levels to monitor: $54,900, $49,100, and $41,200.
Bullet According to this specific macro count, the ultimate completion of Wave C points toward a longer-term basing phase extending into 2028.
Remember: Elliott Wave analysis is a probabilistic scenario mapping, not a guarantee. Markets remain dynamic, and invalidation levels shift with incoming order flow.
💡 THE BIG QUESTION:
If this macro bearish scenario plays out and lower targets are tested, at what exact price point do you plan to aggressively accumulate $BTC for the next cycle? Let’s discuss below! 👇
#bitcoin #BTC #Elliottwave #cryptotrading #BinanceSquare
The Elliott Wave Bearish Case: Are We Heading to $41K? 📉📊
➡️ Crypto markets move in cycles, and every parabolic impulse eventually demands a structural reset. A closer look at the higher-timeframe Elliott Wave count reveals a compelling macro perspective that every risk-managed trader should consider.
1️⃣ The Completed Macro Impulse
Bullet The impulsive rally peaking near $126,000 marked the termination of Wave 5, signaling the completion of the previous multi-year bull cycle.
Bullet Following this peak, the initial sharp correction down to $58,000 acted as Wave A.
2️⃣ The Fakeout Bounce & Wave C Initiation
Bullet The subsequent recovery rally toward $87,000 served merely as a corrective Wave B relief bounce rather than a trend continuation.
Bullet We are now looking at the potential unfolding of Wave C, which historically matches or exceeds the magnitude of the initial Wave A decline.
3️⃣ Fibonacci Downside Targets & Timeline
Bullet Key structural Fibonacci extension levels to monitor: $54,900, $49,100, and $41,200.
Bullet According to this specific macro count, the ultimate completion of Wave C points toward a longer-term basing phase extending into 2028.
Remember: Elliott Wave analysis is a probabilistic scenario mapping, not a guarantee. Markets remain dynamic, and invalidation levels shift with incoming order flow.
💡 THE BIG QUESTION:
If this macro bearish scenario plays out and lower targets are tested, at what exact price point do you plan to aggressively accumulate $BTC for the next cycle? Let’s discuss below! 👇
#bitcoin #BTC #Elliottwave #cryptotrading #BinanceSquare
➡️ Crypto markets move in cycles, and every parabolic impulse eventually demands a structural reset. A closer look at the higher-timeframe Elliott Wave count reveals a compelling macro perspective that every risk-managed trader should consider.
1️⃣ The Completed Macro Impulse
Bullet The impulsive rally peaking near $126,000 marked the termination of Wave 5, signaling the completion of the previous multi-year bull cycle.
Bullet Following this peak, the initial sharp correction down to $58,000 acted as Wave A.
2️⃣ The Fakeout Bounce & Wave C Initiation
Bullet The subsequent recovery rally toward $87,000 served merely as a corrective Wave B relief bounce rather than a trend continuation.
Bullet We are now looking at the potential unfolding of Wave C, which historically matches or exceeds the magnitude of the initial Wave A decline.
3️⃣ Fibonacci Downside Targets & Timeline
Bullet Key structural Fibonacci extension levels to monitor: $54,900, $49,100, and $41,200.
Bullet According to this specific macro count, the ultimate completion of Wave C points toward a longer-term basing phase extending into 2028.
Remember: Elliott Wave analysis is a probabilistic scenario mapping, not a guarantee. Markets remain dynamic, and invalidation levels shift with incoming order flow.
💡 THE BIG QUESTION:
If this macro bearish scenario plays out and lower targets are tested, at what exact price point do you plan to aggressively accumulate $BTC for the next cycle? Let’s discuss below! 👇
#bitcoin #BTC #Elliottwave #cryptotrading #BinanceSquare
1
161

·
--
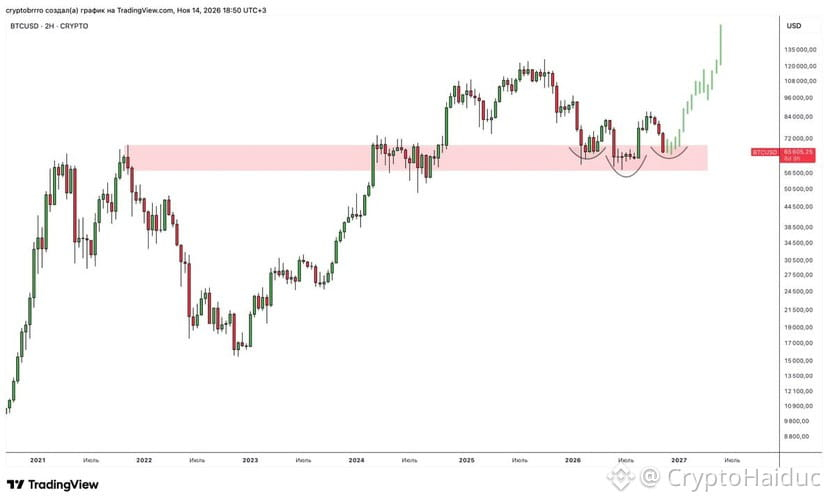
The Ultimate Mirror Level: Is This the Setup for $124K Bitcoin? 📊🔥
😵💫 Market psychology is playing out exactly as expected. Right when retail sentiment plummets into deep disappointment and disbelief, the charts are setting up a high-confluence macro structure.
Here is why this current price zone deserves your full attention:
1️⃣ The Power of the Mirror Level 🛑🟢
We are sitting right at a major macro support zone - the previous cycle’s All-Time High, which previously acted as an impenetrable resistance barrier. For six months, price chopped through this level before finally breaking upward. Now, it is acting as a classic mirror support level.
2️⃣ Reversal Pattern Forming 📈
A textbook reversal formation is currently printing right inside this structural demand zone. If this support holds firm, the technical path clears for a massive continuation leg upward.
3️⃣ The Target: Reclaiming & Breaking $124K 🚀
Hold this zone, and the macroeconomic trajectory points straight toward an aggressive rally aimed at shattering previous highs and pushing targets toward $124,000.
➡️ The Bottom Line: This is precisely what market bottoms look like—maximum despair, widespread disbelief, and peak skepticism. Smart money accumulates while the crowd looks away.
❓Are you scaling into spot positions here expecting the mirror level to hold, or are you waiting for confirmation? Drop your strategy below! 💬🔥
$BTC
#bitcoin #BTC #cryptotrading #MarketAnalysis #BinanceSquare
{spot}(BTCUSDT)
The Ultimate Mirror Level: Is This the Setup for $124K Bitcoin? 📊🔥
😵💫 Market psychology is playing out exactly as expected. Right when retail sentiment plummets into deep disappointment and disbelief, the charts are setting up a high-confluence macro structure.
Here is why this current price zone deserves your full attention:
1️⃣ The Power of the Mirror Level 🛑🟢
We are sitting right at a major macro support zone - the previous cycle’s All-Time High, which previously acted as an impenetrable resistance barrier. For six months, price chopped through this level before finally breaking upward. Now, it is acting as a classic mirror support level.
2️⃣ Reversal Pattern Forming 📈
A textbook reversal formation is currently printing right inside this structural demand zone. If this support holds firm, the technical path clears for a massive continuation leg upward.
3️⃣ The Target: Reclaiming & Breaking $124K 🚀
Hold this zone, and the macroeconomic trajectory points straight toward an aggressive rally aimed at shattering previous highs and pushing targets toward $124,000.
➡️ The Bottom Line: This is precisely what market bottoms look like—maximum despair, widespread disbelief, and peak skepticism. Smart money accumulates while the crowd looks away.
❓Are you scaling into spot positions here expecting the mirror level to hold, or are you waiting for confirmation? Drop your strategy below! 💬🔥
$BTC
#bitcoin #BTC #cryptotrading #MarketAnalysis #BinanceSquare
😵💫 Market psychology is playing out exactly as expected. Right when retail sentiment plummets into deep disappointment and disbelief, the charts are setting up a high-confluence macro structure.
Here is why this current price zone deserves your full attention:
1️⃣ The Power of the Mirror Level 🛑🟢
We are sitting right at a major macro support zone - the previous cycle’s All-Time High, which previously acted as an impenetrable resistance barrier. For six months, price chopped through this level before finally breaking upward. Now, it is acting as a classic mirror support level.
2️⃣ Reversal Pattern Forming 📈
A textbook reversal formation is currently printing right inside this structural demand zone. If this support holds firm, the technical path clears for a massive continuation leg upward.
3️⃣ The Target: Reclaiming & Breaking $124K 🚀
Hold this zone, and the macroeconomic trajectory points straight toward an aggressive rally aimed at shattering previous highs and pushing targets toward $124,000.
➡️ The Bottom Line: This is precisely what market bottoms look like—maximum despair, widespread disbelief, and peak skepticism. Smart money accumulates while the crowd looks away.
❓Are you scaling into spot positions here expecting the mirror level to hold, or are you waiting for confirmation? Drop your strategy below! 💬🔥
$BTC
#bitcoin #BTC #cryptotrading #MarketAnalysis #BinanceSquare
1
172
·
--
ຢືນຢັນແລ້ວ

ບົດຄວາມ
📉 APTOS (APT) AT AN ALL-TIME LOW: MACRO CRISIS OR GENERATIONAL ACCUMULATION? 🧠While the broader market fixates on short-term price discovery and emotional panic hitting new lows near $0.51–$0.55, smart money looks past the noise and evaluates network fundamentals, protocol engineering, and structural supply dynamics.
Market bottoms are rarely comfortable. They are built precisely when sentiment hits peak despair (Crypto Fear & Greed Index lingering deep in fear). But beneath the price action, the architecture of Aptos tells a completely different story.
Here is why sophisticated capital views this flush as a potential long-term opportunity:
1️⃣ The Supply Overhang is Finally Easing
* For years, token unlock schedules weighed heavily on investor sentiment.
* However, the critical milestone of the initial 4-year tokenomics schedule concluded, resulting in a dramatic structural reduction of annualized token unlocks.
* Continuous token burns are steadily working at the margins, easing the historic supply pressure that plagued early price discovery.
2️⃣ World-Class Technical Infrastructure (The Global Trading Engine)
* Built on the Move programming language and powered by the Block-STM parallel execution engine, Aptos remains one of the highest-performing Layer-1 architectures in Web3.
* With sub-50-millisecond block times, lightning-fast settlement, and advanced features like native confidential transactions and cross-chain account abstraction, the tech stack is built for institutional-grade scale.
* Ecosystem milestones—including robust stablecoin growth, institutional custody backing (such as BitGo's strategic balance-sheet allocation), and active spot ETF filings—signal that utility is expanding even while price lags.
3️⃣ The Psychology of All-Time Lows
* Retail traders sell when charts look bleak and prices test historical floors.
* Institutional accumulation and venture-backed conviction happen when valuations detach from underlying technological progress.
* Buying strength feels good, but generational asymmetric upside is historically captured during periods of profound apathy and structural capitulation.
💡 The Big Question:
Are you letting a local price floor shake you out of a high-performance Layer-1, or are you scaling into the weakness for the next macro cycle? Let’s discuss below! 👇
Track live market data and price trends for $APT here:
$APT
#Aptos #APT #Layer1 #CryptoInvesting #smartmoney
📉 APTOS (APT) AT AN ALL-TIME LOW: MACRO CRISIS OR GENERATIONAL ACCUMULATION? 🧠
While the broader market fixates on short-term price discovery and emotional panic hitting new lows near $0.51–$0.55, smart money looks past the noise and evaluates network fundamentals, protocol engineering, and structural supply dynamics.
Market bottoms are rarely comfortable. They are built precisely when sentiment hits peak despair (Crypto Fear & Greed Index lingering deep in fear). But beneath the price action, the architecture of Aptos tells a completely different story.
Here is why sophisticated capital views this flush as a potential long-term opportunity:
1️⃣ The Supply Overhang is Finally Easing
* For years, token unlock schedules weighed heavily on investor sentiment.
* However, the critical milestone of the initial 4-year tokenomics schedule concluded, resulting in a dramatic structural reduction of annualized token unlocks.
* Continuous token burns are steadily working at the margins, easing the historic supply pressure that plagued early price discovery.
2️⃣ World-Class Technical Infrastructure (The Global Trading Engine)
* Built on the Move programming language and powered by the Block-STM parallel execution engine, Aptos remains one of the highest-performing Layer-1 architectures in Web3.
* With sub-50-millisecond block times, lightning-fast settlement, and advanced features like native confidential transactions and cross-chain account abstraction, the tech stack is built for institutional-grade scale.
* Ecosystem milestones—including robust stablecoin growth, institutional custody backing (such as BitGo's strategic balance-sheet allocation), and active spot ETF filings—signal that utility is expanding even while price lags.
3️⃣ The Psychology of All-Time Lows
* Retail traders sell when charts look bleak and prices test historical floors.
* Institutional accumulation and venture-backed conviction happen when valuations detach from underlying technological progress.
* Buying strength feels good, but generational asymmetric upside is historically captured during periods of profound apathy and structural capitulation.
💡 The Big Question:
Are you letting a local price floor shake you out of a high-performance Layer-1, or are you scaling into the weakness for the next macro cycle? Let’s discuss below! 👇
Track live market data and price trends for $APT here:
$APT
#Aptos #APT #Layer1 #CryptoInvesting #smartmoney
Market bottoms are rarely comfortable. They are built precisely when sentiment hits peak despair (Crypto Fear & Greed Index lingering deep in fear). But beneath the price action, the architecture of Aptos tells a completely different story.
Here is why sophisticated capital views this flush as a potential long-term opportunity:
1️⃣ The Supply Overhang is Finally Easing
* For years, token unlock schedules weighed heavily on investor sentiment.
* However, the critical milestone of the initial 4-year tokenomics schedule concluded, resulting in a dramatic structural reduction of annualized token unlocks.
* Continuous token burns are steadily working at the margins, easing the historic supply pressure that plagued early price discovery.
2️⃣ World-Class Technical Infrastructure (The Global Trading Engine)
* Built on the Move programming language and powered by the Block-STM parallel execution engine, Aptos remains one of the highest-performing Layer-1 architectures in Web3.
* With sub-50-millisecond block times, lightning-fast settlement, and advanced features like native confidential transactions and cross-chain account abstraction, the tech stack is built for institutional-grade scale.
* Ecosystem milestones—including robust stablecoin growth, institutional custody backing (such as BitGo's strategic balance-sheet allocation), and active spot ETF filings—signal that utility is expanding even while price lags.
3️⃣ The Psychology of All-Time Lows
* Retail traders sell when charts look bleak and prices test historical floors.
* Institutional accumulation and venture-backed conviction happen when valuations detach from underlying technological progress.
* Buying strength feels good, but generational asymmetric upside is historically captured during periods of profound apathy and structural capitulation.
💡 The Big Question:
Are you letting a local price floor shake you out of a high-performance Layer-1, or are you scaling into the weakness for the next macro cycle? Let’s discuss below! 👇
Track live market data and price trends for $APT here:
$APT
#Aptos #APT #Layer1 #CryptoInvesting #smartmoney
4
1.7k
·
--
🚨 BITCOIN: THE LEVERAGE FLUSH IS UNDERWAY 📉
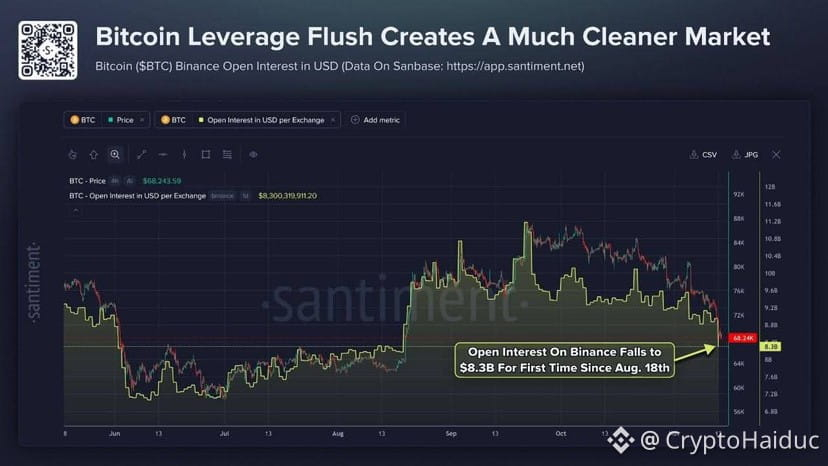
Bitcoin's recent correction is actively reshaping market structure. According to data from Santiment, Bitcoin Open Interest (OI) on Binance has dropped to $8.3 billion - marking its lowest level since August 18.
As BTC dipped toward the $68,200 zone, the market systematically purged excess derivative positioning. Some traders closed positions voluntarily, while others were forced out via liquidations. 💥
📊 What Does This Mean?
➡️ The Bearish View: Short-term buyer weakness is evident as momentum cools.
➡️ The Bullish View: The market is shedding over-leveraged speculative bloat. This drastically reduces the probability of immediate, massive liquidation cascades.
My Take: While I still lean toward a continuation of the corrective phase in the short term, declining Open Interest is fundamentally a healthy development. Once this cleansing process finishes, the market will have a much more stable foundation for its next sustainable move. 📈
🔍 Two Scenarios to Watch:
🟢 Bullish Path: A reclaim of $70,000–$72,000, price stabilization, and a gradual influx of fresh Open Interest would signal the early stages of recovery.
🔴 Bearish Path: Weak relief bounces, a lack of organic spot demand, and a continued drift lower will confirm that the correction still has room to run.
‼️ Bottom Line:
The market is losing its speculative leverage. This isn't an instant trend reversal yet, but it’s a critical cleansing phase before the next major wave takes shape.
👇 COMMUNITY DISCUSSION:
What’s your read on this? Have we finished the main liquidation phase, or is another wave coming? Drop your thoughts below! 💬🔥
$BTC
#bitcoin #BTC #cryptotrading #Openinterest #BinanceSquare
🚨 BITCOIN: THE LEVERAGE FLUSH IS UNDERWAY 📉
Bitcoin's recent correction is actively reshaping market structure. According to data from Santiment, Bitcoin Open Interest (OI) on Binance has dropped to $8.3 billion - marking its lowest level since August 18.
As BTC dipped toward the $68,200 zone, the market systematically purged excess derivative positioning. Some traders closed positions voluntarily, while others were forced out via liquidations. 💥
📊 What Does This Mean?
➡️ The Bearish View: Short-term buyer weakness is evident as momentum cools.
➡️ The Bullish View: The market is shedding over-leveraged speculative bloat. This drastically reduces the probability of immediate, massive liquidation cascades.
My Take: While I still lean toward a continuation of the corrective phase in the short term, declining Open Interest is fundamentally a healthy development. Once this cleansing process finishes, the market will have a much more stable foundation for its next sustainable move. 📈
🔍 Two Scenarios to Watch:
🟢 Bullish Path: A reclaim of $70,000–$72,000, price stabilization, and a gradual influx of fresh Open Interest would signal the early stages of recovery.
🔴 Bearish Path: Weak relief bounces, a lack of organic spot demand, and a continued drift lower will confirm that the correction still has room to run.
‼️ Bottom Line:
The market is losing its speculative leverage. This isn't an instant trend reversal yet, but it’s a critical cleansing phase before the next major wave takes shape.
👇 COMMUNITY DISCUSSION:
What’s your read on this? Have we finished the main liquidation phase, or is another wave coming? Drop your thoughts below! 💬🔥
$BTC
#bitcoin #BTC #cryptotrading #Openinterest #BinanceSquare
Bitcoin's recent correction is actively reshaping market structure. According to data from Santiment, Bitcoin Open Interest (OI) on Binance has dropped to $8.3 billion - marking its lowest level since August 18.
As BTC dipped toward the $68,200 zone, the market systematically purged excess derivative positioning. Some traders closed positions voluntarily, while others were forced out via liquidations. 💥
📊 What Does This Mean?
➡️ The Bearish View: Short-term buyer weakness is evident as momentum cools.
➡️ The Bullish View: The market is shedding over-leveraged speculative bloat. This drastically reduces the probability of immediate, massive liquidation cascades.
My Take: While I still lean toward a continuation of the corrective phase in the short term, declining Open Interest is fundamentally a healthy development. Once this cleansing process finishes, the market will have a much more stable foundation for its next sustainable move. 📈
🔍 Two Scenarios to Watch:
🟢 Bullish Path: A reclaim of $70,000–$72,000, price stabilization, and a gradual influx of fresh Open Interest would signal the early stages of recovery.
🔴 Bearish Path: Weak relief bounces, a lack of organic spot demand, and a continued drift lower will confirm that the correction still has room to run.
‼️ Bottom Line:
The market is losing its speculative leverage. This isn't an instant trend reversal yet, but it’s a critical cleansing phase before the next major wave takes shape.
👇 COMMUNITY DISCUSSION:
What’s your read on this? Have we finished the main liquidation phase, or is another wave coming? Drop your thoughts below! 💬🔥
$BTC
#bitcoin #BTC #cryptotrading #Openinterest #BinanceSquare
1
184


·
--
Whales vs. ETF Outflows: The Real Story Behind Bitcoin's Current Phase 📊
The crypto market is currently witnessing a fascinating divergence in behavior. While retail and ETF-driven capital are pulling back, large-wallet cohorts are quietly stepping in to absorb the pressure.
1️⃣ The Institutional/ETF Exodus
U.S. spot Bitcoin ETFs have faced sustained net outflows, reflecting a risk-off sentiment among traditional financial participants.
Successive sessions of redemptions have put short-term pressure on prices, as broader macroeconomic concerns and shifting rate expectations prompt institutional portfolio rebalancing.
2️⃣ On-Chain Accumulation by Whales
Despite the negative ETF flows, on-chain data highlights renewed accumulation from specific large-wallet cohorts (specifically addresses holding between 100 and 10,000 $BTC).
Historically, these large entities tend to accumulate during periods of widespread market hesitation, treating localized dips as strategic entry points rather than structural exits.
3️⃣ What the Order Flow Tells Us
Market depth and bid walls around key structural levels indicate that smart money is defending specific ranges.
However, until ETF outflows stabilize and broader liquidity returns, price action is likely to remain range-bound.
💡 The Big Question:
Are you aligning with the whales and accumulating during this institutional cooldown, or are you waiting for ETF inflows to turn green before making your next move? Let’s discuss below! 👇
Whales vs. ETF Outflows: The Real Story Behind Bitcoin's Current Phase 📊
The crypto market is currently witnessing a fascinating divergence in behavior. While retail and ETF-driven capital are pulling back, large-wallet cohorts are quietly stepping in to absorb the pressure.
1️⃣ The Institutional/ETF Exodus
U.S. spot Bitcoin ETFs have faced sustained net outflows, reflecting a risk-off sentiment among traditional financial participants.
Successive sessions of redemptions have put short-term pressure on prices, as broader macroeconomic concerns and shifting rate expectations prompt institutional portfolio rebalancing.
2️⃣ On-Chain Accumulation by Whales
Despite the negative ETF flows, on-chain data highlights renewed accumulation from specific large-wallet cohorts (specifically addresses holding between 100 and 10,000 $BTC).
Historically, these large entities tend to accumulate during periods of widespread market hesitation, treating localized dips as strategic entry points rather than structural exits.
3️⃣ What the Order Flow Tells Us
Market depth and bid walls around key structural levels indicate that smart money is defending specific ranges.
However, until ETF outflows stabilize and broader liquidity returns, price action is likely to remain range-bound.
💡 The Big Question:
Are you aligning with the whales and accumulating during this institutional cooldown, or are you waiting for ETF inflows to turn green before making your next move? Let’s discuss below! 👇
The crypto market is currently witnessing a fascinating divergence in behavior. While retail and ETF-driven capital are pulling back, large-wallet cohorts are quietly stepping in to absorb the pressure.
1️⃣ The Institutional/ETF Exodus
U.S. spot Bitcoin ETFs have faced sustained net outflows, reflecting a risk-off sentiment among traditional financial participants.
Successive sessions of redemptions have put short-term pressure on prices, as broader macroeconomic concerns and shifting rate expectations prompt institutional portfolio rebalancing.
2️⃣ On-Chain Accumulation by Whales
Despite the negative ETF flows, on-chain data highlights renewed accumulation from specific large-wallet cohorts (specifically addresses holding between 100 and 10,000 $BTC).
Historically, these large entities tend to accumulate during periods of widespread market hesitation, treating localized dips as strategic entry points rather than structural exits.
3️⃣ What the Order Flow Tells Us
Market depth and bid walls around key structural levels indicate that smart money is defending specific ranges.
However, until ETF outflows stabilize and broader liquidity returns, price action is likely to remain range-bound.
💡 The Big Question:
Are you aligning with the whales and accumulating during this institutional cooldown, or are you waiting for ETF inflows to turn green before making your next move? Let’s discuss below! 👇

1
150
·
--
🚨 SOMETHING TERRIBLE IS BREWING FOR $BTC
Market is back at $72K, pullback phase confirmed again
The drop is almost done, but it won't be smooth...
One final shakeout is coming and it will spread fear everywhere
My plan is absolutely simple:
1st target: $70K + Bear Trap
2nd target: pump above $80K -> $100K sweep
The final trap will wipe out more than one trading deposit...
Save this post - we'll come back to it in 2-3 months
🚨 SOMETHING TERRIBLE IS BREWING FOR $BTC
Market is back at $72K, pullback phase confirmed again
The drop is almost done, but it won't be smooth...
One final shakeout is coming and it will spread fear everywhere
My plan is absolutely simple:
1st target: $70K + Bear Trap
2nd target: pump above $80K -> $100K sweep
The final trap will wipe out more than one trading deposit...
Save this post - we'll come back to it in 2-3 months
Market is back at $72K, pullback phase confirmed again
The drop is almost done, but it won't be smooth...
One final shakeout is coming and it will spread fear everywhere
My plan is absolutely simple:
1st target: $70K + Bear Trap
2nd target: pump above $80K -> $100K sweep
The final trap will wipe out more than one trading deposit...
Save this post - we'll come back to it in 2-3 months
4
761
ເຂົ້າສູ່ລະບົບເພື່ອສຳຫຼວດເນື້ອຫາເພີ່ມເຕີມ
ເຂົ້າຮ່ວມກຸ່ມຜູ້ໃຊ້ຄຣິບໂຕທົ່ວໂລກໃນ Binance Square.
⚡️ ໄດ້ຮັບຂໍ້ມູນຫຼ້າສຸດ ແລະ ທີ່ມີປະໂຫຍດກ່ຽວກັບຄຣິບໂຕ.
💬 ໄດ້ຮັບຄວາມໄວ້ວາງໃຈຈາກຕະຫຼາດແລກປ່ຽນຄຣິບໂຕທີ່ໃຫຍ່ທີ່ສຸດໃນໂລກ.
👍 ຄົ້ນຫາຂໍ້ມູນເຊີງເລິກທີ່ແທ້ຈາກນັກສ້າງທີ່ໄດ້ຮັບການຢືນຢັນ.
ອີເມວ / ເບີໂທລະສັບ
ຫົວຂໍ້ທີ່ກໍາລັງນິຍົມ
NvidiaLoses$2.7TrillionInMonthAndAHalf
30,576 ຄັ້ງທີ່ເບິ່ງ
166 ກຳລັງສົນທະນາ
Nvidia’s $2.7 Trillion Wipeout: When Narrative Overrides Numbers 📉
Crypto With Faisal
·7 ຖືກໃຈ
·6.2k ຄັ້ງທີ່ເບິ່ງ
CanBTCReboundAfterFallingBelow60K?
872,905 ຄັ້ງທີ່ເບິ່ງ
3,236 ກຳລັງສົນທະນາ
GlobalStocksFaceLongestLosingStreakSince2023
332,258 ຄັ້ງທີ່ເບິ່ງ
2,167 ກຳລັງສົນທະນາ