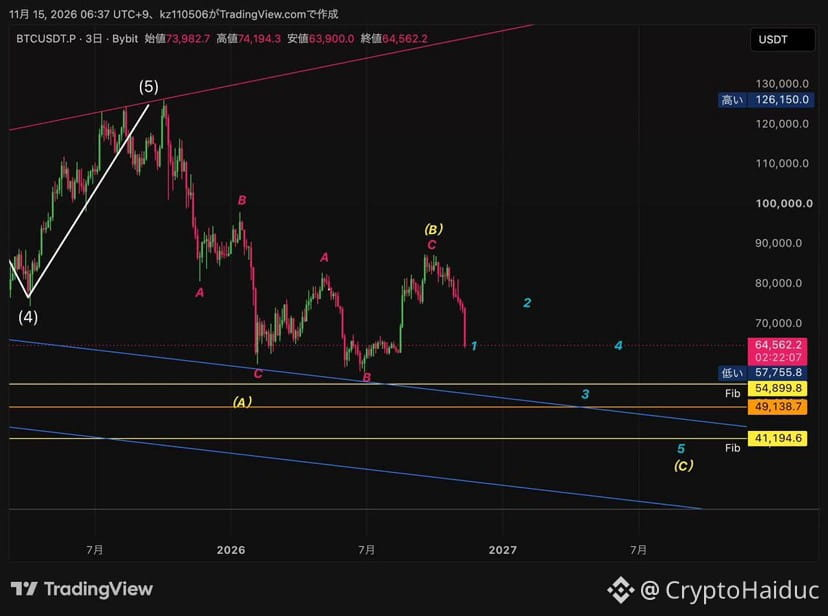
The Elliott Wave Bearish Case: Are We Heading to $41K? 📉📊
➡️ Crypto markets move in cycles, and every parabolic impulse eventually demands a structural reset. A closer look at the higher-timeframe Elliott Wave count reveals a compelling macro perspective that every risk-managed trader should consider.
1️⃣ The Completed Macro Impulse
Bullet The impulsive rally peaking near $126,000 marked the termination of Wave 5, signaling the completion of the previous multi-year bull cycle.
Bullet Following this peak, the initial sharp correction down to $58,000 acted as Wave A.
2️⃣ The Fakeout Bounce & Wave C Initiation
Bullet The subsequent recovery rally toward $87,000 served merely as a corrective Wave B relief bounce rather than a trend continuation.
Bullet We are now looking at the potential unfolding of Wave C, which historically matches or exceeds the magnitude of the initial Wave A decline.
3️⃣ Fibonacci Downside Targets & Timeline
Bullet Key structural Fibonacci extension levels to monitor: $54,900, $49,100, and $41,200.
Bullet According to this specific macro count, the ultimate completion of Wave C points toward a longer-term basing phase extending into 2028.
Remember: Elliott Wave analysis is a probabilistic scenario mapping, not a guarantee. Markets remain dynamic, and invalidation levels shift with incoming order flow.
💡 THE BIG QUESTION:
If this macro bearish scenario plays out and lower targets are tested, at what exact price point do you plan to aggressively accumulate $BTC for the next cycle? Let’s discuss below! 👇
#bitcoin #BTC #Elliottwave #cryptotrading #BinanceSquare
➡️ Crypto markets move in cycles, and every parabolic impulse eventually demands a structural reset. A closer look at the higher-timeframe Elliott Wave count reveals a compelling macro perspective that every risk-managed trader should consider.
1️⃣ The Completed Macro Impulse
Bullet The impulsive rally peaking near $126,000 marked the termination of Wave 5, signaling the completion of the previous multi-year bull cycle.
Bullet Following this peak, the initial sharp correction down to $58,000 acted as Wave A.
2️⃣ The Fakeout Bounce & Wave C Initiation
Bullet The subsequent recovery rally toward $87,000 served merely as a corrective Wave B relief bounce rather than a trend continuation.
Bullet We are now looking at the potential unfolding of Wave C, which historically matches or exceeds the magnitude of the initial Wave A decline.
3️⃣ Fibonacci Downside Targets & Timeline
Bullet Key structural Fibonacci extension levels to monitor: $54,900, $49,100, and $41,200.
Bullet According to this specific macro count, the ultimate completion of Wave C points toward a longer-term basing phase extending into 2028.
Remember: Elliott Wave analysis is a probabilistic scenario mapping, not a guarantee. Markets remain dynamic, and invalidation levels shift with incoming order flow.
💡 THE BIG QUESTION:
If this macro bearish scenario plays out and lower targets are tested, at what exact price point do you plan to aggressively accumulate $BTC for the next cycle? Let’s discuss below! 👇
#bitcoin #BTC #Elliottwave #cryptotrading #BinanceSquare