
#glassnode
glassnode
234,867 views
608 ກຳລັງສົນທະນາ
ມາແຮງ
ຫຼ້າສຸດ

📊 تحليل Glassnode: بيتكوين محصورة بين مناطق تراكم وعرض كثيف
كشف تحليل حديث لـ Glassnode أن سعر بيتكوين يتداول ضمن نطاق ضيق، محصورًا بين مستوى دعم قوي يمثل مناطق تراكم للمستثمرين وعرض كثيف من البائعين فوق السعر الحالي. هذا الوضع يشير إلى أن تجاوز المقاومة يتطلب استيعاب ضغوط البيع وجني الأرباح المحتمل.
━━━━━━━━━━━━━━
📊 التأثير: 📈 مرتفع
🏷️ BITCOIN
#Bitcoin #Glassnode #MarketAnalysis #CryptoInsights
📰 المصدر: cryptobriefing.com
كشف تحليل حديث لـ Glassnode أن سعر بيتكوين يتداول ضمن نطاق ضيق، محصورًا بين مستوى دعم قوي يمثل مناطق تراكم للمستثمرين وعرض كثيف من البائعين فوق السعر الحالي. هذا الوضع يشير إلى أن تجاوز المقاومة يتطلب استيعاب ضغوط البيع وجني الأرباح المحتمل.
━━━━━━━━━━━━━━
📊 التأثير: 📈 مرتفع
🏷️ BITCOIN
#Bitcoin #Glassnode #MarketAnalysis #CryptoInsights
📰 المصدر: cryptobriefing.com

🚨 $BTC FACES HEAVY SUPPLY WALL BETWEEN $81K AND $86K AS LONG-TERM HOLDERS TEST BREAKEVEN! 💥
📌 Glassnode data highlights a dense cluster of resistance for $BTC between $81,000 and $86,000, where trapped long-term holders are lining up to hit breakeven. 📊 Supply is thick here, reinforced by the 365-day VWAP at $82,600 and a key dealer gamma flip around $82,300.
🔍 Buyers are putting up a battle, holding ground above the 50-week and 100-week EMAs near $77,353 and $78,485. 🌊 For bulls to spark the next leg up, spot demand must aggressively absorb this massive overhead supply wall before liquidations trigger higher.
💬 Do you expect bulls to chew through this $86,000 liquidity wall on the first try, or are we due for a retest of lower EMA support? 👇
⚠️ Not financial advice. Always manage your risk. 🛡️
🏷️ #BTC #Bitcoin #Crypto #Glassnode
🎯 🦈
📌 Glassnode data highlights a dense cluster of resistance for $BTC between $81,000 and $86,000, where trapped long-term holders are lining up to hit breakeven. 📊 Supply is thick here, reinforced by the 365-day VWAP at $82,600 and a key dealer gamma flip around $82,300.
🔍 Buyers are putting up a battle, holding ground above the 50-week and 100-week EMAs near $77,353 and $78,485. 🌊 For bulls to spark the next leg up, spot demand must aggressively absorb this massive overhead supply wall before liquidations trigger higher.
💬 Do you expect bulls to chew through this $86,000 liquidity wall on the first try, or are we due for a retest of lower EMA support? 👇
⚠️ Not financial advice. Always manage your risk. 🛡️
🏷️ #BTC #Bitcoin #Crypto #Glassnode
🎯 🦈

💥 Bitcoin faces a major demand test above $83K as liquidity thickens
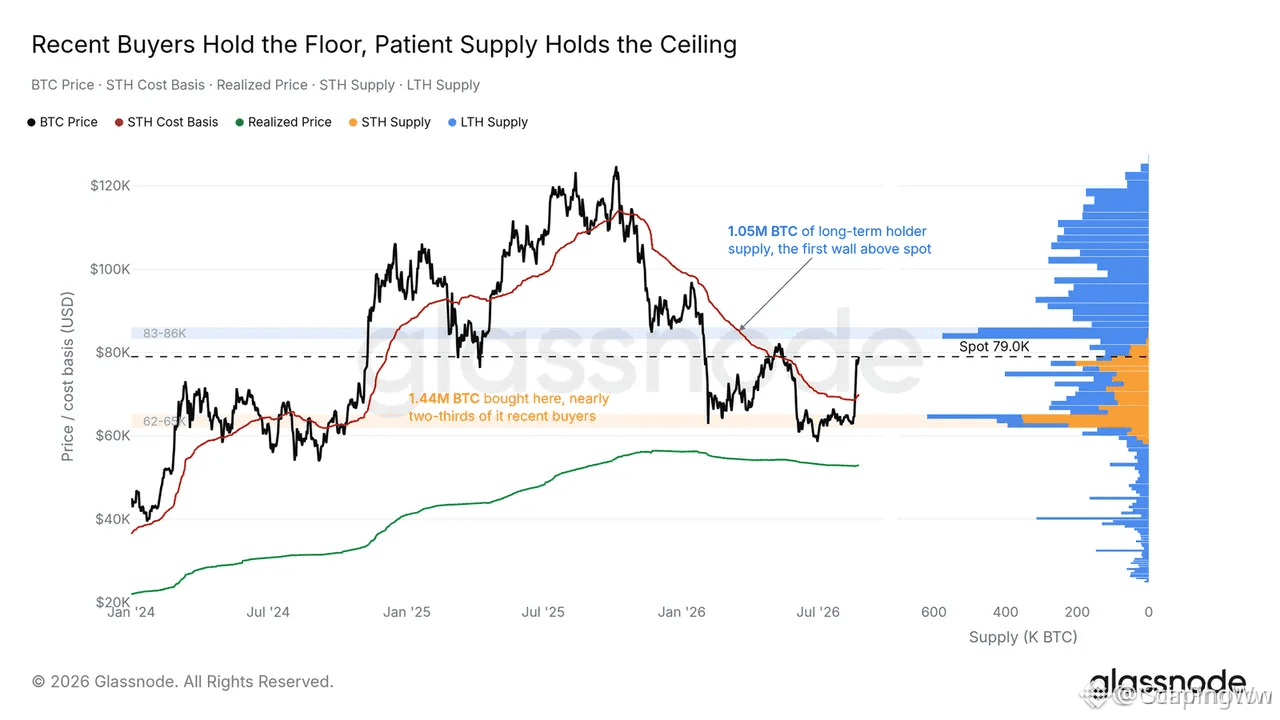
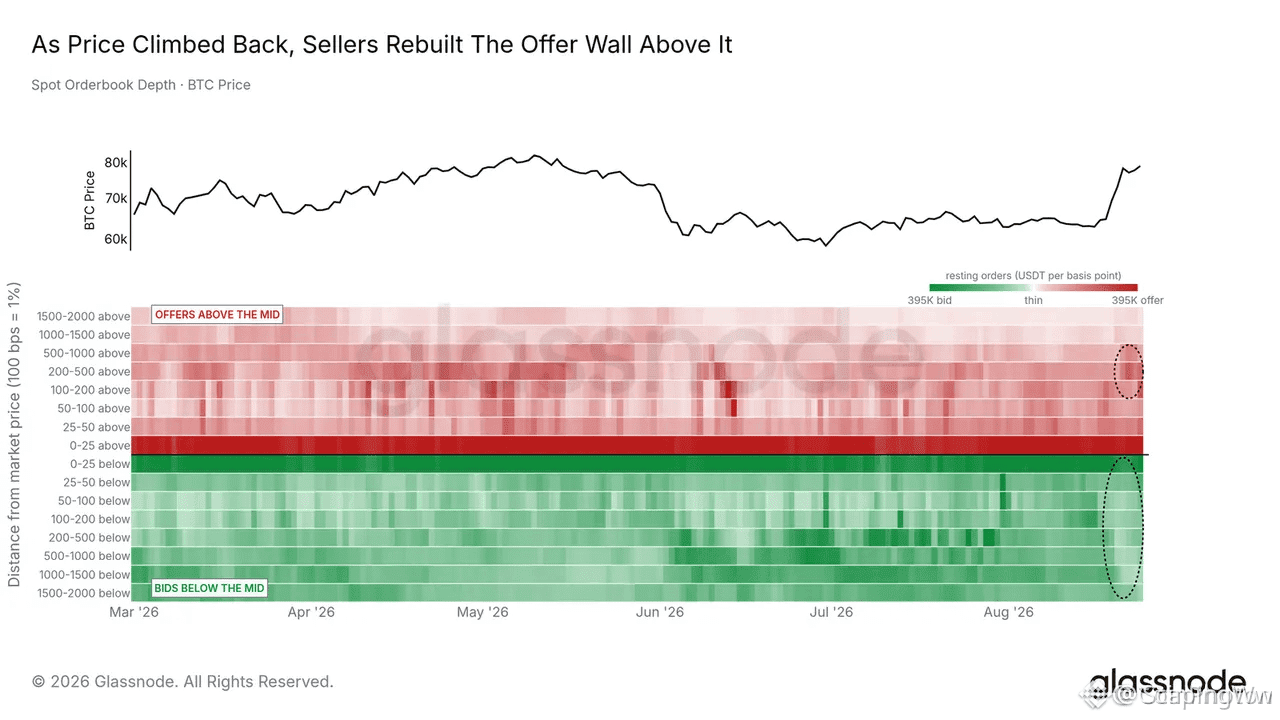
Bitcoin’s recovery is approaching a major supply wall between $81,000 and $86,000, according to Glassnode. The $83,000–$86,000 area is dominated by long-term holders who accumulated BTC before the recent drawdown and may be more willing to sell once prices return to their breakeven levels.
Additional resistance is coming from exchange sell orders, options positioning and a remaining liquidation shelf. Glassnode identified $80,800 as a key self-custody cost-basis level and around $82,300 as the point where options dealers shift their hedging dynamics. Bitcoin’s 365-day VWAP is also around $82,600.
#bitcoin #Glassnode #BitcoinHoldsNear$79400
#ThuyBNB
$BTC $BNB
Bitcoin’s recovery is approaching a major supply wall between $81,000 and $86,000, according to Glassnode. The $83,000–$86,000 area is dominated by long-term holders who accumulated BTC before the recent drawdown and may be more willing to sell once prices return to their breakeven levels.
Additional resistance is coming from exchange sell orders, options positioning and a remaining liquidation shelf. Glassnode identified $80,800 as a key self-custody cost-basis level and around $82,300 as the point where options dealers shift their hedging dynamics. Bitcoin’s 365-day VWAP is also around $82,600.
#bitcoin #Glassnode #BitcoinHoldsNear$79400
#ThuyBNB
$BTC $BNB

🚨 LATEST: Glassnode identifies $81K–$86K as a key supply zone between Bitcoin’s current rebound and its January high, following a 26% rally from August lows.
⚡️ The move is supported by spot demand, including $2.23B in U.S. spot ETF inflows, exchange outflows and accumulation across major wallet cohorts.
#Bitcoin #Glassnode #OnChainAnalytics #CryptoNews $BTC
⚡️ The move is supported by spot demand, including $2.23B in U.S. spot ETF inflows, exchange outflows and accumulation across major wallet cohorts.
#Bitcoin #Glassnode #OnChainAnalytics #CryptoNews $BTC

ATUALIZAÇÃO:
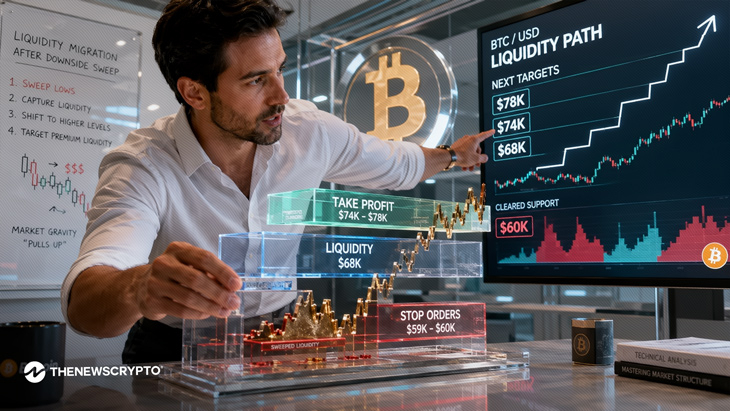
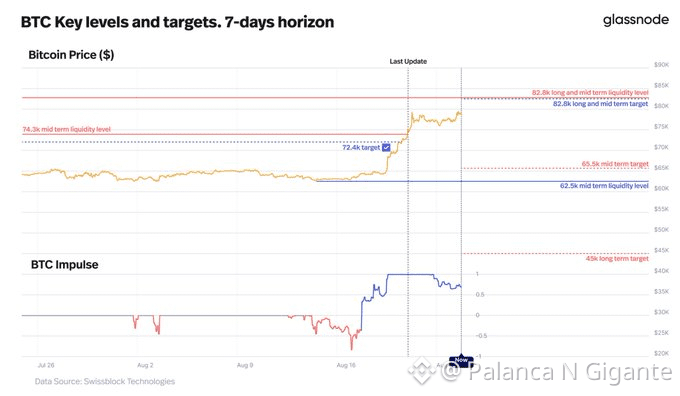
O modelo Bitcoin Vector da Glassnode tornou-se otimista a partir das mínimas, e o $BTC subiu cerca de 20% desde então, estando agora totalmente alocado e com lucro, com US$ 82,8 mil marcado como a próxima meta de alta.
$BTR $BMT 👀👀👀👀👀
#Glassnode #BTCKeyZone #bullish #OpenAIReportedlyCompletesBelModelPretraining #BitcoinRejectedAt$81K50WeekMA
O modelo Bitcoin Vector da Glassnode tornou-se otimista a partir das mínimas, e o $BTC subiu cerca de 20% desde então, estando agora totalmente alocado e com lucro, com US$ 82,8 mil marcado como a próxima meta de alta.
$BTR $BMT 👀👀👀👀👀
#Glassnode #BTCKeyZone #bullish #OpenAIReportedlyCompletesBelModelPretraining #BitcoinRejectedAt$81K50WeekMA

🚨 BITCOIN JUST MADE A HUGE MOVE
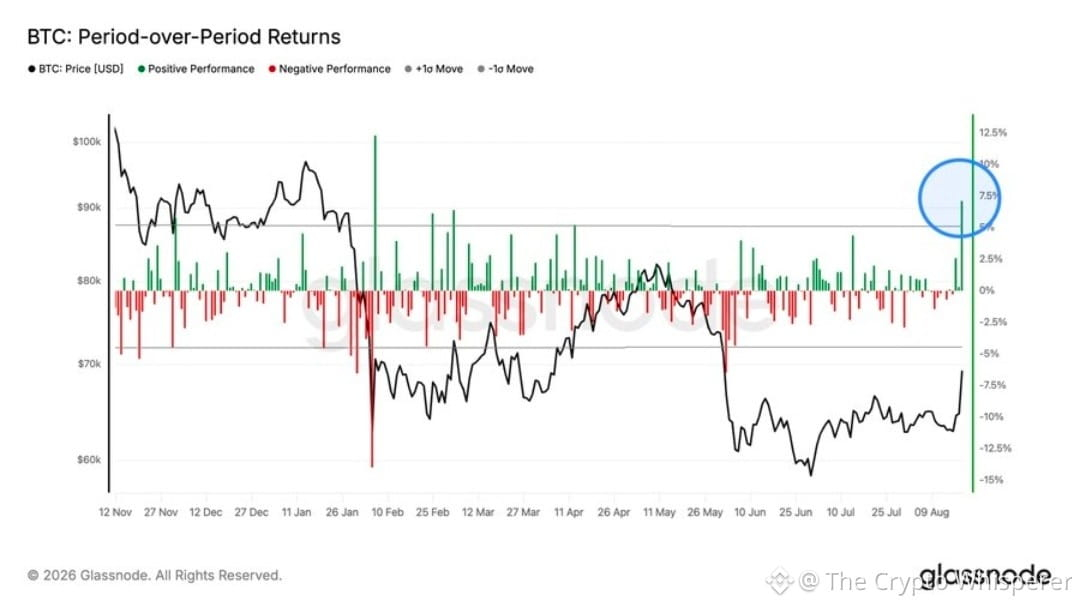
Bitcoin recorded a 5.8-sigma daily move relative to its 30-day volatility, according to Glassnode.
📈 This marks BTC’s largest upside move since October 2023.
A move this extreme highlights just how powerful the current momentum has become — and why volatility could remain elevated.
👀 The key now: Can Bitcoin hold these gains and turn this explosive move into a sustained trend?
$BTC
#Bitcoin #Crypto #Glassnode #CryptoMarket
Bitcoin recorded a 5.8-sigma daily move relative to its 30-day volatility, according to Glassnode.
📈 This marks BTC’s largest upside move since October 2023.
A move this extreme highlights just how powerful the current momentum has become — and why volatility could remain elevated.
👀 The key now: Can Bitcoin hold these gains and turn this explosive move into a sustained trend?
$BTC
#Bitcoin #Crypto #Glassnode #CryptoMarket

Glassnode 最新报告将比特币链上结构仍定义为“投降阶段”,当前价格反弹更应理解为筑底过程中的局部反弹,而非趋势反转。短期持有者成本基础约 6.85 万美元,低于约 7.58 万美元的真实市场均值;
本轮相对未实现亏损最高约 25%,明显低于此前周期超 60% 的水平,亏损较浅但更加分散,可能需要更长时间完成出清。已实现盈亏比 90 日均线为 0.75,仍未进入历史上卖方衰竭前低于 0.5 的区间;
在指标重新突破 2 之前,反弹从结构上仍偏向局部修复。衍生品面改善但现货未跟上,30 日永续合约方向性溢价重回正值,杠杆多头偏好回升;
Coinbase Premium Index 持续为负,显示美国现货需求尚未明显回归。
仅作市场观察,不构成投资建议。
#比特币 #Glassnode #链上数据
本轮相对未实现亏损最高约 25%,明显低于此前周期超 60% 的水平,亏损较浅但更加分散,可能需要更长时间完成出清。已实现盈亏比 90 日均线为 0.75,仍未进入历史上卖方衰竭前低于 0.5 的区间;
在指标重新突破 2 之前,反弹从结构上仍偏向局部修复。衍生品面改善但现货未跟上,30 日永续合约方向性溢价重回正值,杠杆多头偏好回升;
Coinbase Premium Index 持续为负,显示美国现货需求尚未明显回归。
仅作市场观察,不构成投资建议。
#比特币 #Glassnode #链上数据

ຖືຄອງ $BTC 0.9 USDT
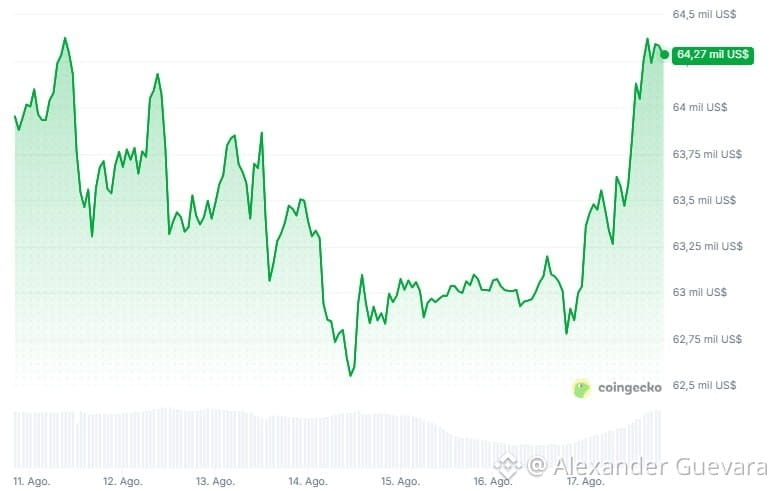
📈 Bitcoin superó los USD 64.000. Según un reciente informe de Glassnode, el precio de la moneda digital está atrapado entre 2 fuerzas opuestas: una constante presión vendedora de corto plazo y una postura de resistencia por parte de inversionistas a largo plazo.
#Glassnode #BTC #bitcoin #Volume #liquidez $BTC $WBTC
#Glassnode #BTC #bitcoin #Volume #liquidez $BTC $WBTC


💰 رسوم البيتكوين تشكل 0.69% فقط من مدخول المعدنين.. أدنى مستوى في 10 سنوات!
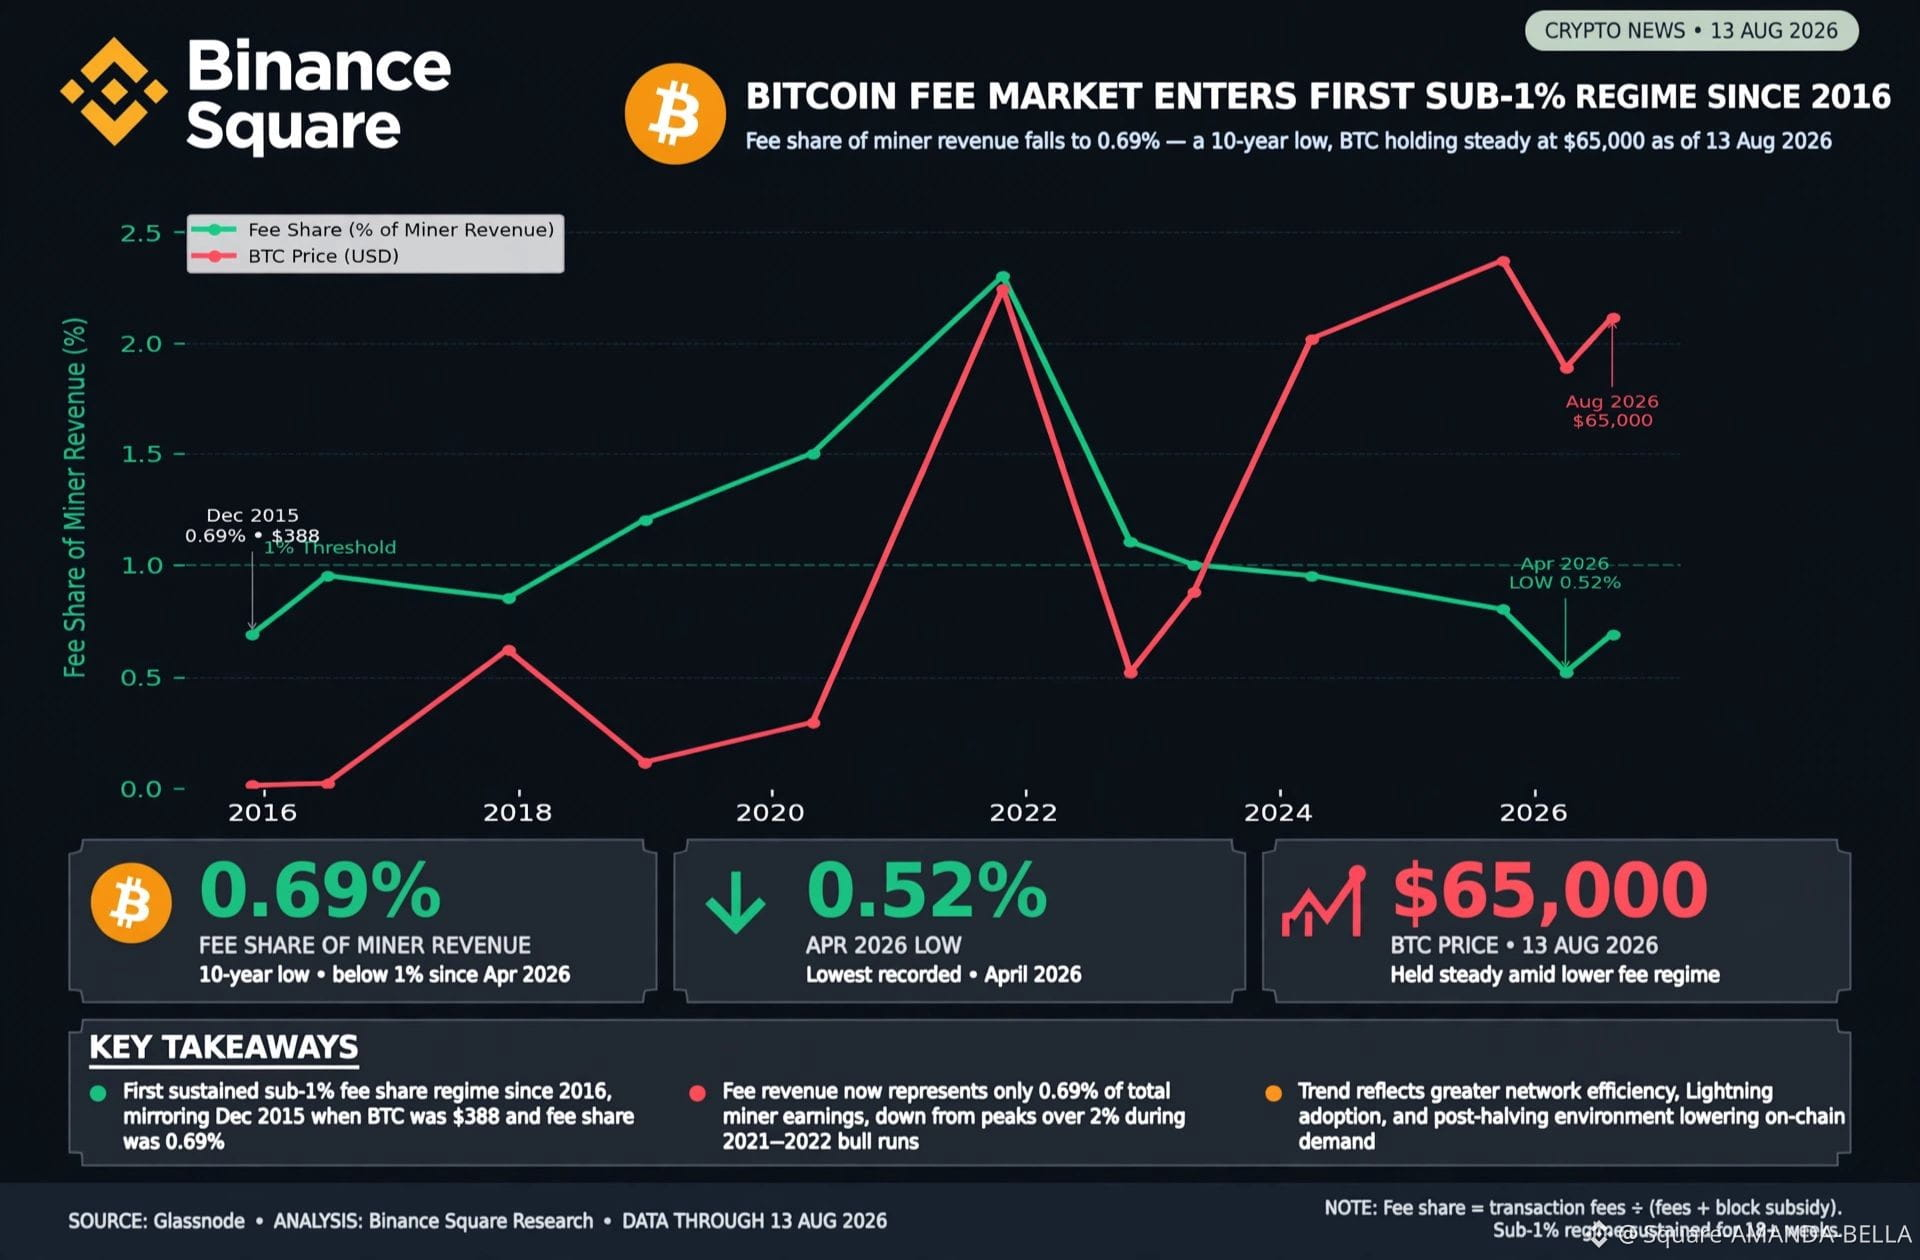
لأول مرة منذ عام 2016، يدخل سوق رسوم البيتكوين في نظام مستدام تحت 1%، بحسب بيانات Glassnode.
ماذا تعني الأرقام اليوم 13 أوت 2026؟
🔹 حصة الرسوم: 0.69% فقط من إجمالي مدخول المعدنين (مقارنة بأكثر من 2% في 2021-2022)
🔹 أدنى قاع: 0.52% في أفريل 2026
🔹 السعر الحالي: 65,000$ مستقر رغم انهيار الرسوم
🔹 المفارقة التاريخية: نفس النسبة 0.69% كانت في ديسمبر 2015 عندما كان سعر BTC هو 388$ فقط!
لماذا هذا يحدث؟ وما علاقته بـ Binance؟
هذا الاتجاه يعكس كفاءة الشبكة وانتشار شبكة Lightning، والأهم أن 90% من التداول أصبح يتم **داخل Binance وخارج البلوكتشين**، مما يقلل الازدحام على الشبكة الرئيسية. النتيجة؟ رسوم سحب رخيصة جداً للمستخدمين.
لكن هل هو جيد أم سيئ؟
• للمستخدم: ممتاز! تحويلات رخيصة وسريعة. • للمعدنين ولأمان الشبكة: مقلق! بعد كل تنصيف، يجب أن تعوض الرسوم مكافأة البلوك. إذا بقيت تحت 1%، قد يواجه أمان الشبكة تحدياً على المدى الطويل.
سؤال يفجر التعليقات:
هل ترى أن انخفاض الرسوم نعمة للمستخدمين أم تهديد مستقبلي لأمان البيتكوين؟ وهل تفضل التداول داخل Binance برسوم قليلة أم على الشبكة مباشرة؟
شاركنا رأيك 👇
#Bitcoin #BTC #Glassnode #BinanceSquare #اكتب_واربح
📅 المصدر: Glassnode • البيانات حتى 13 أوت 2026
$BTC
لأول مرة منذ عام 2016، يدخل سوق رسوم البيتكوين في نظام مستدام تحت 1%، بحسب بيانات Glassnode.
ماذا تعني الأرقام اليوم 13 أوت 2026؟
🔹 حصة الرسوم: 0.69% فقط من إجمالي مدخول المعدنين (مقارنة بأكثر من 2% في 2021-2022)
🔹 أدنى قاع: 0.52% في أفريل 2026
🔹 السعر الحالي: 65,000$ مستقر رغم انهيار الرسوم
🔹 المفارقة التاريخية: نفس النسبة 0.69% كانت في ديسمبر 2015 عندما كان سعر BTC هو 388$ فقط!
لماذا هذا يحدث؟ وما علاقته بـ Binance؟
هذا الاتجاه يعكس كفاءة الشبكة وانتشار شبكة Lightning، والأهم أن 90% من التداول أصبح يتم **داخل Binance وخارج البلوكتشين**، مما يقلل الازدحام على الشبكة الرئيسية. النتيجة؟ رسوم سحب رخيصة جداً للمستخدمين.
لكن هل هو جيد أم سيئ؟
• للمستخدم: ممتاز! تحويلات رخيصة وسريعة. • للمعدنين ولأمان الشبكة: مقلق! بعد كل تنصيف، يجب أن تعوض الرسوم مكافأة البلوك. إذا بقيت تحت 1%، قد يواجه أمان الشبكة تحدياً على المدى الطويل.
سؤال يفجر التعليقات:
هل ترى أن انخفاض الرسوم نعمة للمستخدمين أم تهديد مستقبلي لأمان البيتكوين؟ وهل تفضل التداول داخل Binance برسوم قليلة أم على الشبكة مباشرة؟
شاركنا رأيك 👇
#Bitcoin #BTC #Glassnode #BinanceSquare #اكتب_واربح
📅 المصدر: Glassnode • البيانات حتى 13 أوت 2026
$BTC

هل يقترب Bitcoin من القاع؟
Glassnode ترصد إشارة تستحق المتابعة: بائعو Bitcoin بدأوا يفقدون الزخم، في وقت يتحرك فيه السوق ضمن نطاق ضيق وتراجع ضغط البيع تدريجيًا.
لكن هناك نقطة مهمة: الإرهاق البيعي لا يعني أن القاع تأكد.
Glassnode تشير إلى أن المؤشرات الحالية لم تصل بعد إلى المستويات التاريخية التي ظهرت في قيعان الأسواق الهابطة السابقة.
المعادلة الآن بسيطة:
🔹 البائعون يبدؤون بالإنهاك
🔹 التقلبات تنخفض
🔹 لكن الطلب القوي من المشترين لم يظهر بالشكل الكافي بعد
🔹 لذلك يحتاج السوق إلى تأكيد إضافي قبل اعتبار القاع نهائيًا
السوق قد يكون في مرحلة استنزاف للبائعين وبناء قاعدة سعرية، لكن التأكيد الحقيقي سيأتي عندما يعود الطلب بقوة ويبدأ Bitcoin في استعادة مستويات المقاومة المهمة.
الخلاصة:
الإشارة إيجابية من ناحية ضغط البيع، لكنها ليست إشارة شراء مؤكدة بعد. في هذه المرحلة، الصبر ومراقبة سلوك الطلب أهم من مطاردة أي ارتداد.
#Bitcoin #Crypto #Glassnode #BitcoinAnalysis #CryptoMarket
Glassnode ترصد إشارة تستحق المتابعة: بائعو Bitcoin بدأوا يفقدون الزخم، في وقت يتحرك فيه السوق ضمن نطاق ضيق وتراجع ضغط البيع تدريجيًا.
لكن هناك نقطة مهمة: الإرهاق البيعي لا يعني أن القاع تأكد.
Glassnode تشير إلى أن المؤشرات الحالية لم تصل بعد إلى المستويات التاريخية التي ظهرت في قيعان الأسواق الهابطة السابقة.
المعادلة الآن بسيطة:
🔹 البائعون يبدؤون بالإنهاك
🔹 التقلبات تنخفض
🔹 لكن الطلب القوي من المشترين لم يظهر بالشكل الكافي بعد
🔹 لذلك يحتاج السوق إلى تأكيد إضافي قبل اعتبار القاع نهائيًا
السوق قد يكون في مرحلة استنزاف للبائعين وبناء قاعدة سعرية، لكن التأكيد الحقيقي سيأتي عندما يعود الطلب بقوة ويبدأ Bitcoin في استعادة مستويات المقاومة المهمة.
الخلاصة:
الإشارة إيجابية من ناحية ضغط البيع، لكنها ليست إشارة شراء مؤكدة بعد. في هذه المرحلة، الصبر ومراقبة سلوك الطلب أهم من مطاردة أي ارتداد.
#Bitcoin #Crypto #Glassnode #BitcoinAnalysis #CryptoMarket

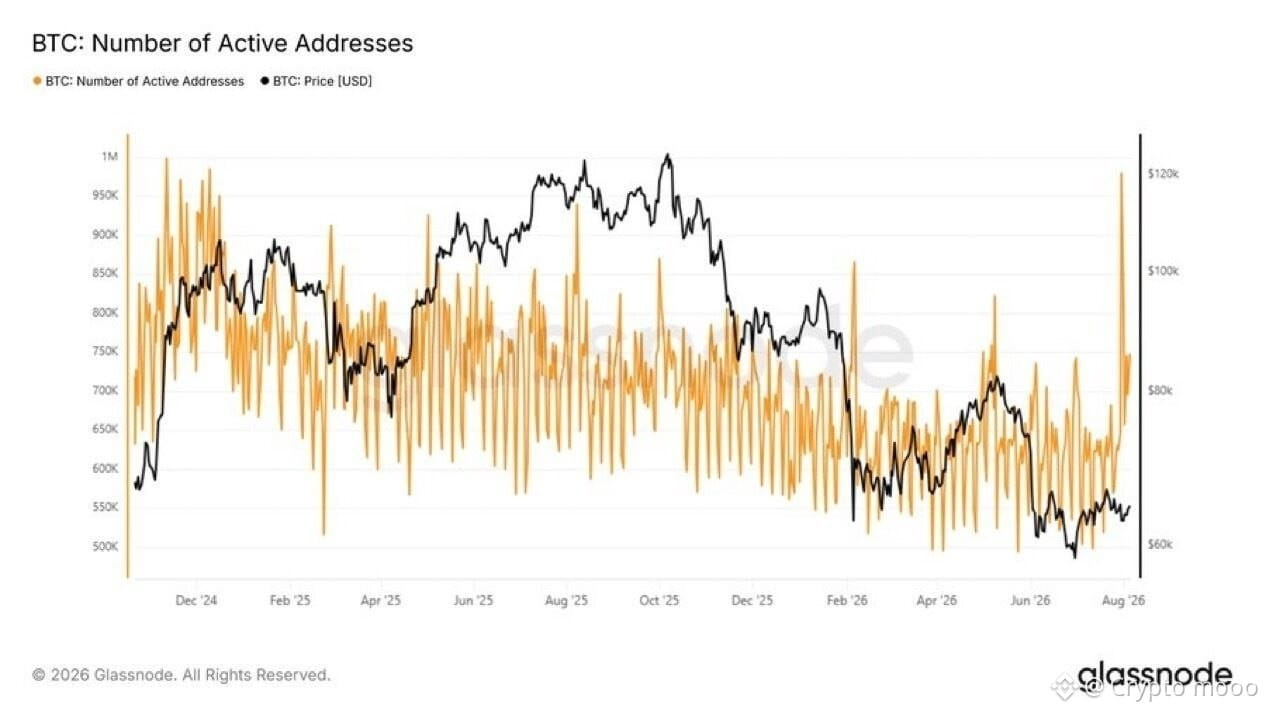
Theo Glassnode, số lượng địa chỉ ví Bitcoin ($BTC ) hoạt động hàng ngày đã tăng vọt lên mốc 980.000 — mức cao nhất ghi nhận được kể từ tháng 12/2024. Sự gia tăng tương tác mạnh mẽ trên mạng lưới này diễn ra ngay sau khi xuất hiện thông tin về sự cố khai thác lỗ hổng phần mềm (firmware) trên các thiết bị ví lạnh Coldcard, thúc đẩy người dùng khẩn trương di chuyển tài sản để tăng cường bảo mật.
#Bitcoin #Glassnode #Crypto
$LINK $XRP
#Bitcoin #Glassnode #Crypto
$LINK $XRP
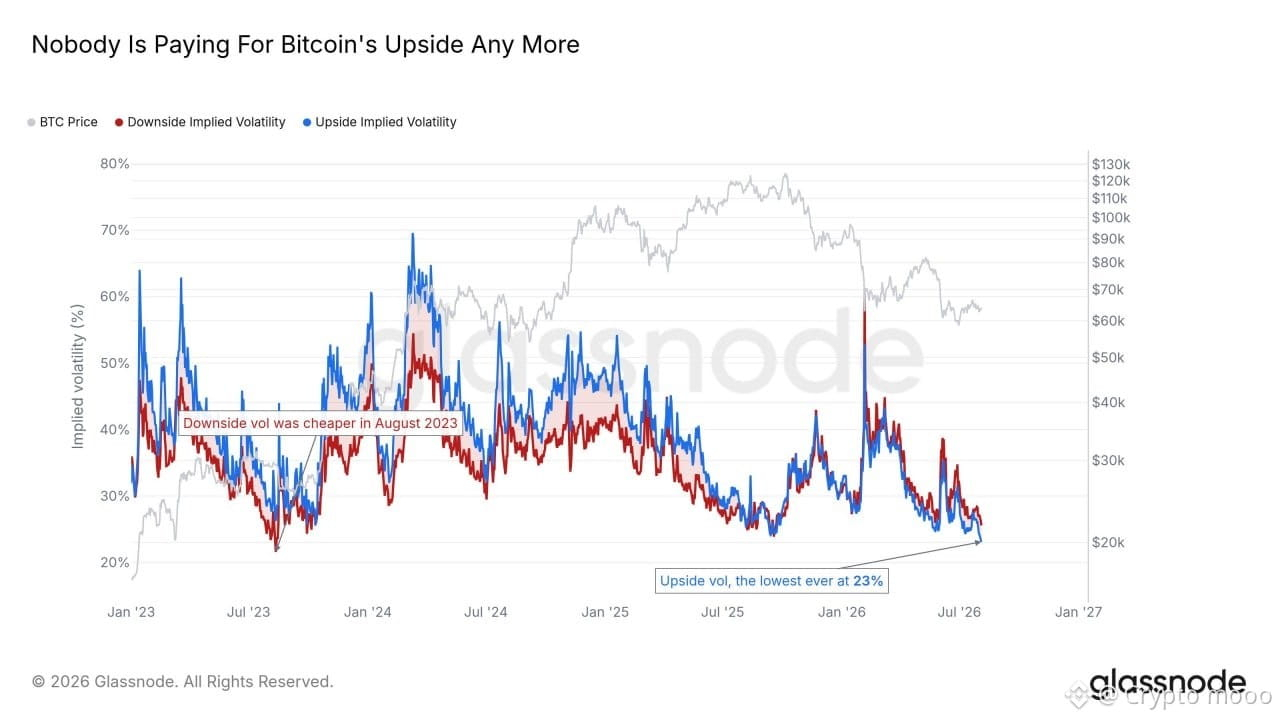
Theo dữ liệu từ Glassnode, độ biến động dự kiến chiều tăng (upside implied volatility) của $BTC vừa rơi xuống mức thấp kỷ lục là 23%. Tín hiệu này cho thấy giới đầu tư gần như không còn "mặn mà" chi trả thêm phí để đặt cược vào kịch bản bứt phá giá của Bitcoin ở thời điểm hiện tại.
#Bitcoin #Glassnode #Crypto
$XRP $DOGE
#Bitcoin #Glassnode #Crypto
$XRP $DOGE

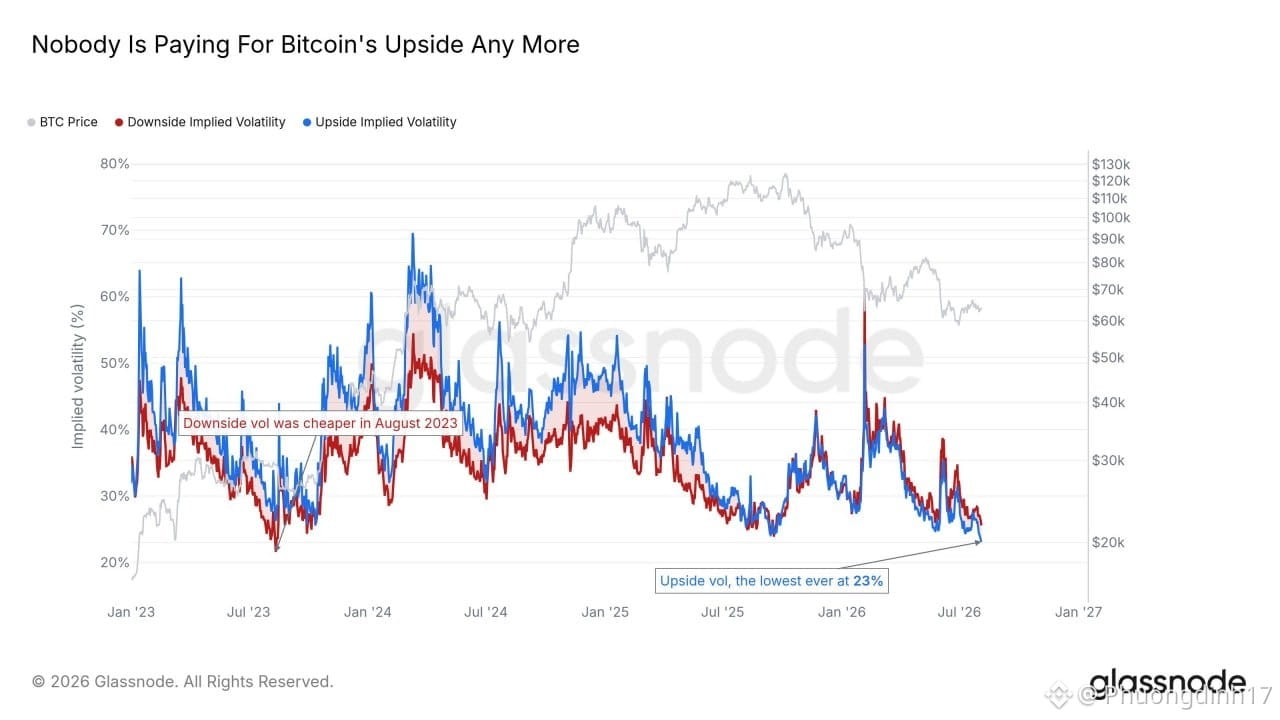
Theo dữ liệu từ Glassnode, độ biến động dự kiến chiều tăng (upside implied volatility) của $BTC vừa rơi xuống mức thấp kỷ lục là 23%. Tín hiệu này cho thấy giới đầu tư gần như không còn "mặn mà" chi trả thêm phí để đặt cược vào kịch bản bứt phá giá của Bitcoin ở thời điểm hiện tại.
#Bitcoin #Glassnode #Crypto
$XRP $DOGE
#Bitcoin #Glassnode #Crypto
$XRP $DOGE



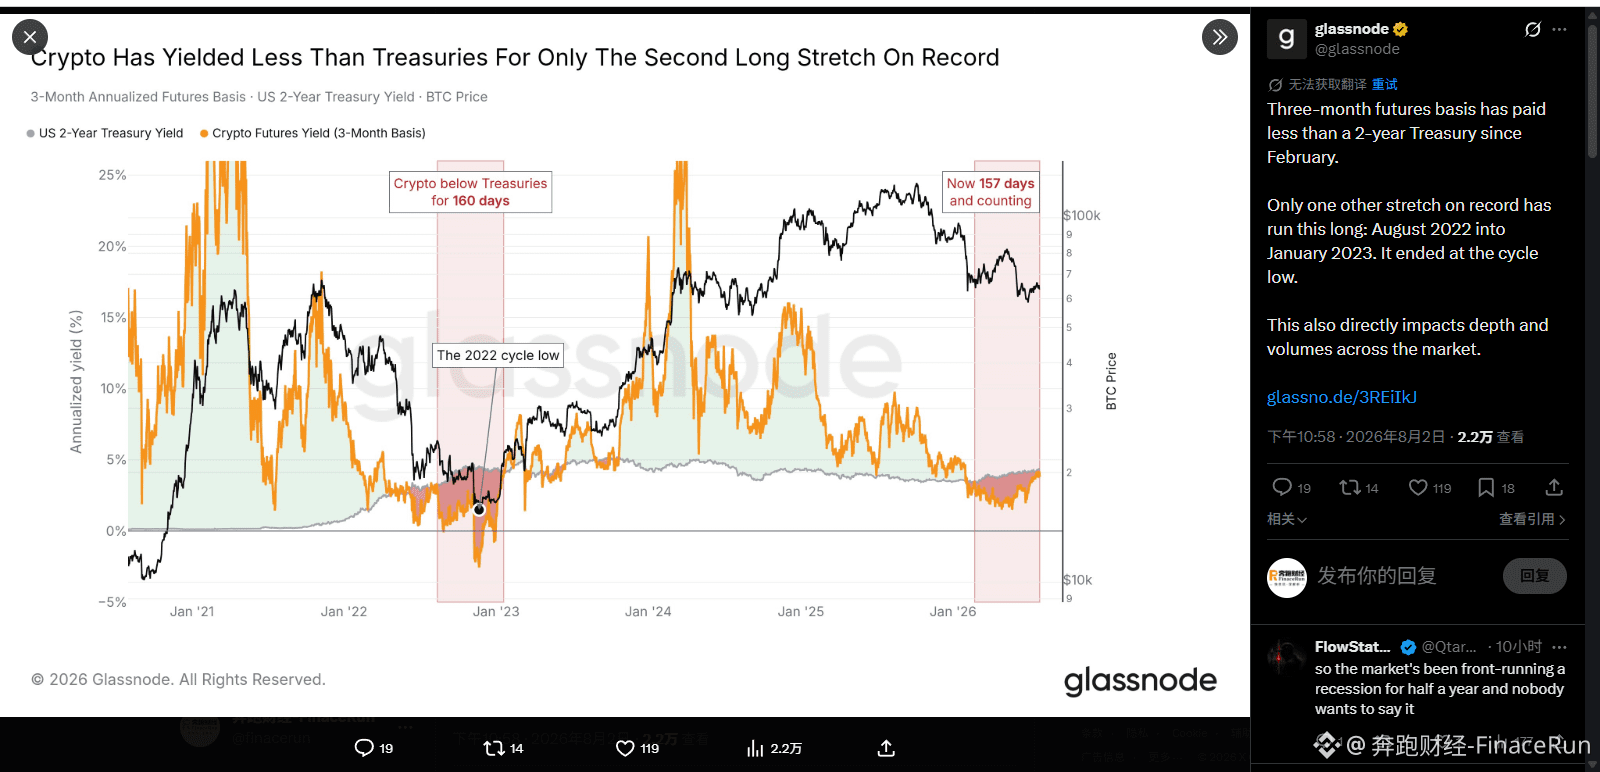
Glassnode 数据:加密收益率连续157 天跑输美债,而上一次相似行情终结于熊市底部
8 月 2 日,区块链分析机构 Glassnode 发布 X 帖文图表显示,加密资产三月期期货基差年化收益率自今年 2 月以来持续低于美国 2 年期国债收益率。
截至统计时间点,该阶段已持续157天,且目前仍在延续。受此影响,加密货币市场的深度和交易量均遭受到了直接冲击。
回顾历史走势,加密资产收益率和无风险利率的美债,仅在2022年8月至2023年1月期间出现过类似长时间的倒挂行情。
即在此期间,加密资产收益率连续 160 天跑输美债,而该段时间恰逢上一轮熊市最低点。
分析指出,加密期货收益长期不及无风险利率的美债,将直接削弱市场深度与成交活跃度,进一步压制了场内资金参与意愿。
整体来说,当前157天的持续倒挂已接近2022-2023年160天的记录。若按历史规律,当前市场可能正处于或接近本轮周期的底部区域。
作为投资者,我们需密切关注这一对比指标的关键变化。一旦市场情绪开始回暖,资金参与意愿逐步恢复,或将成为判断市场趋势转向的重要信号。
#Glassnode #宏观流动性
8 月 2 日,区块链分析机构 Glassnode 发布 X 帖文图表显示,加密资产三月期期货基差年化收益率自今年 2 月以来持续低于美国 2 年期国债收益率。
截至统计时间点,该阶段已持续157天,且目前仍在延续。受此影响,加密货币市场的深度和交易量均遭受到了直接冲击。
回顾历史走势,加密资产收益率和无风险利率的美债,仅在2022年8月至2023年1月期间出现过类似长时间的倒挂行情。
即在此期间,加密资产收益率连续 160 天跑输美债,而该段时间恰逢上一轮熊市最低点。
分析指出,加密期货收益长期不及无风险利率的美债,将直接削弱市场深度与成交活跃度,进一步压制了场内资金参与意愿。
整体来说,当前157天的持续倒挂已接近2022-2023年160天的记录。若按历史规律,当前市场可能正处于或接近本轮周期的底部区域。
作为投资者,我们需密切关注这一对比指标的关键变化。一旦市场情绪开始回暖,资金参与意愿逐步恢复,或将成为判断市场趋势转向的重要信号。
#Glassnode #宏观流动性

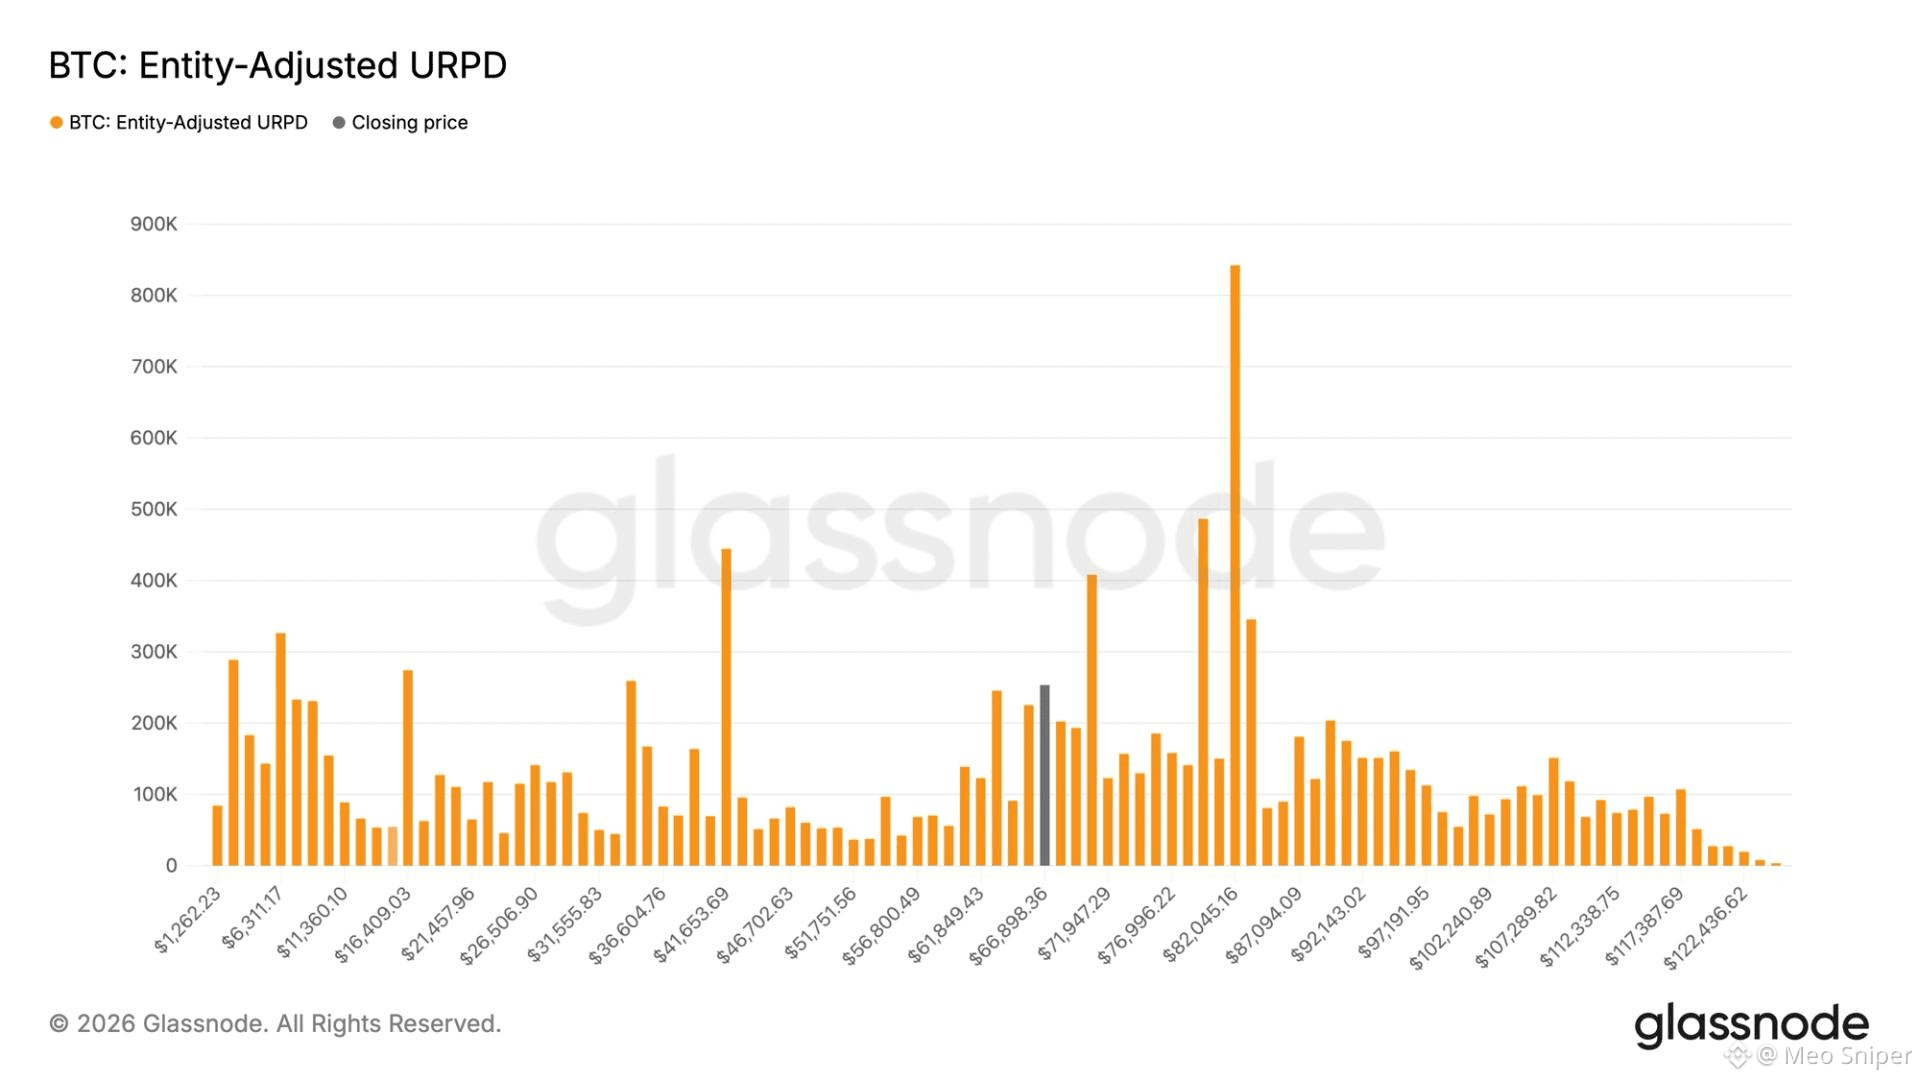
Hơn 250.000 BTC vừa được tích lũy trong vùng 59-67k. Không phải cá voi làm một mình, mà cả nhà đầu tư nhỏ lẻ lẫn tổ chức đều tham gia. Glassnode cho thấy Chỉ số Xu hướng Tích lũy ở mức mạnh nhất kể từ khi giá điều chỉnh — điều này nói lên nhiều điều về niềm tin hiện tại.
Khi dòng tiền thông minh gom hàng ở vùng này, nó tạo thành một lớp hỗ trợ dày mà giá khó xuyên thủng. Tất nhiên thị trường vẫn có thể sideway thêm, nhưng lực cầu đang âm thầm gia tăng. Với một trader, đây là tín hiệu đáng để theo dõi hơn là hành động vội vàng. Không có gì là chắc chắn, nhưng tích lũy trước tăng giá là câu chuyện cũ mà thị trường vẫn thường kể.
#BTC #TíchLũy #Glassnode #PhânTích
Khi dòng tiền thông minh gom hàng ở vùng này, nó tạo thành một lớp hỗ trợ dày mà giá khó xuyên thủng. Tất nhiên thị trường vẫn có thể sideway thêm, nhưng lực cầu đang âm thầm gia tăng. Với một trader, đây là tín hiệu đáng để theo dõi hơn là hành động vội vàng. Không có gì là chắc chắn, nhưng tích lũy trước tăng giá là câu chuyện cũ mà thị trường vẫn thường kể.
#BTC #TíchLũy #Glassnode #PhânTích

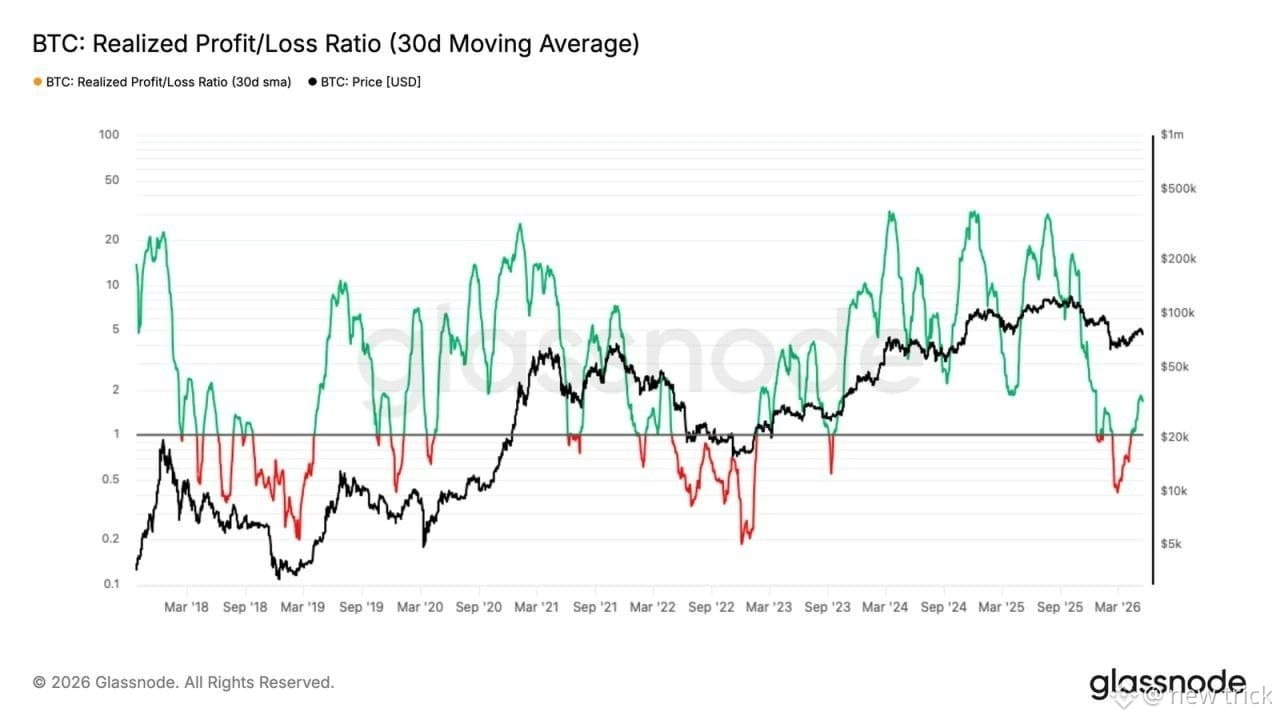
👀 Market Cycle
Glassnode is dropping wild signals... $BTC buyers at $107k might be signaling a 2026 bear market bottom!! 📉 The realized loss structure is looking like previous cycles... $69k is the next big battleground!! 👀
#Glassnode #Bitcoin
Glassnode is dropping wild signals... $BTC buyers at $107k might be signaling a 2026 bear market bottom!! 📉 The realized loss structure is looking like previous cycles... $69k is the next big battleground!! 👀
#Glassnode #Bitcoin

JUST IN: Glassnode: Bitcoin futures basis showing cycle bottom characteristics.
Continues to trade below the 2-year US Treasury yield.
#BTC #Bitcoin #Glassnode $BTC
Continues to trade below the 2-year US Treasury yield.
#BTC #Bitcoin #Glassnode $BTC
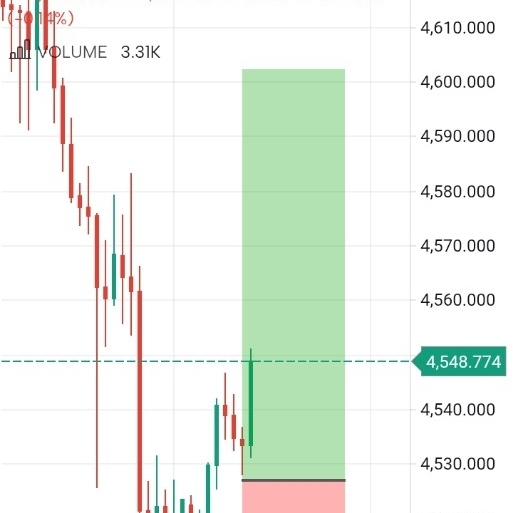
📉Bitcoin$BTC
broke the key level of $78 300
«True middle price» from Glassnode — marker of change of bullish trend to bearish. BTC$BTC closed lower for the first time since August 2025.
Fall confirms structural weakness. The return opens the way to recovery.
Level is not important for speculations, but for the phase of the cycle.
#bitcoin #BTC #Glassnode #Onchain #trend
broke the key level of $78 300
«True middle price» from Glassnode — marker of change of bullish trend to bearish. BTC$BTC closed lower for the first time since August 2025.
Fall confirms structural weakness. The return opens the way to recovery.
Level is not important for speculations, but for the phase of the cycle.
#bitcoin #BTC #Glassnode #Onchain #trend
ເຂົ້າສູ່ລະບົບເພື່ອສຳຫຼວດເນື້ອຫາເພີ່ມເຕີມ