
Arslan Khan
654 Жариялаулар

Arslan Khan
Хабарлау
Пайдаланушыны блоктау
Crypto Analyst and Trader. Daily BTC, ETH, SOL and Altcoin Updates. Technical Analysis. Trade Smart. Manage Risk
Ашық сауда
Жоғары жиілікті трейдер
3.3 жыл
68 Жазылым
205 Жазылушылар
668 лайк басылған
Жазбалар
Портфолио
Барлығы
Баға ұсыныстары
·
--
Жоғары (өспелі)
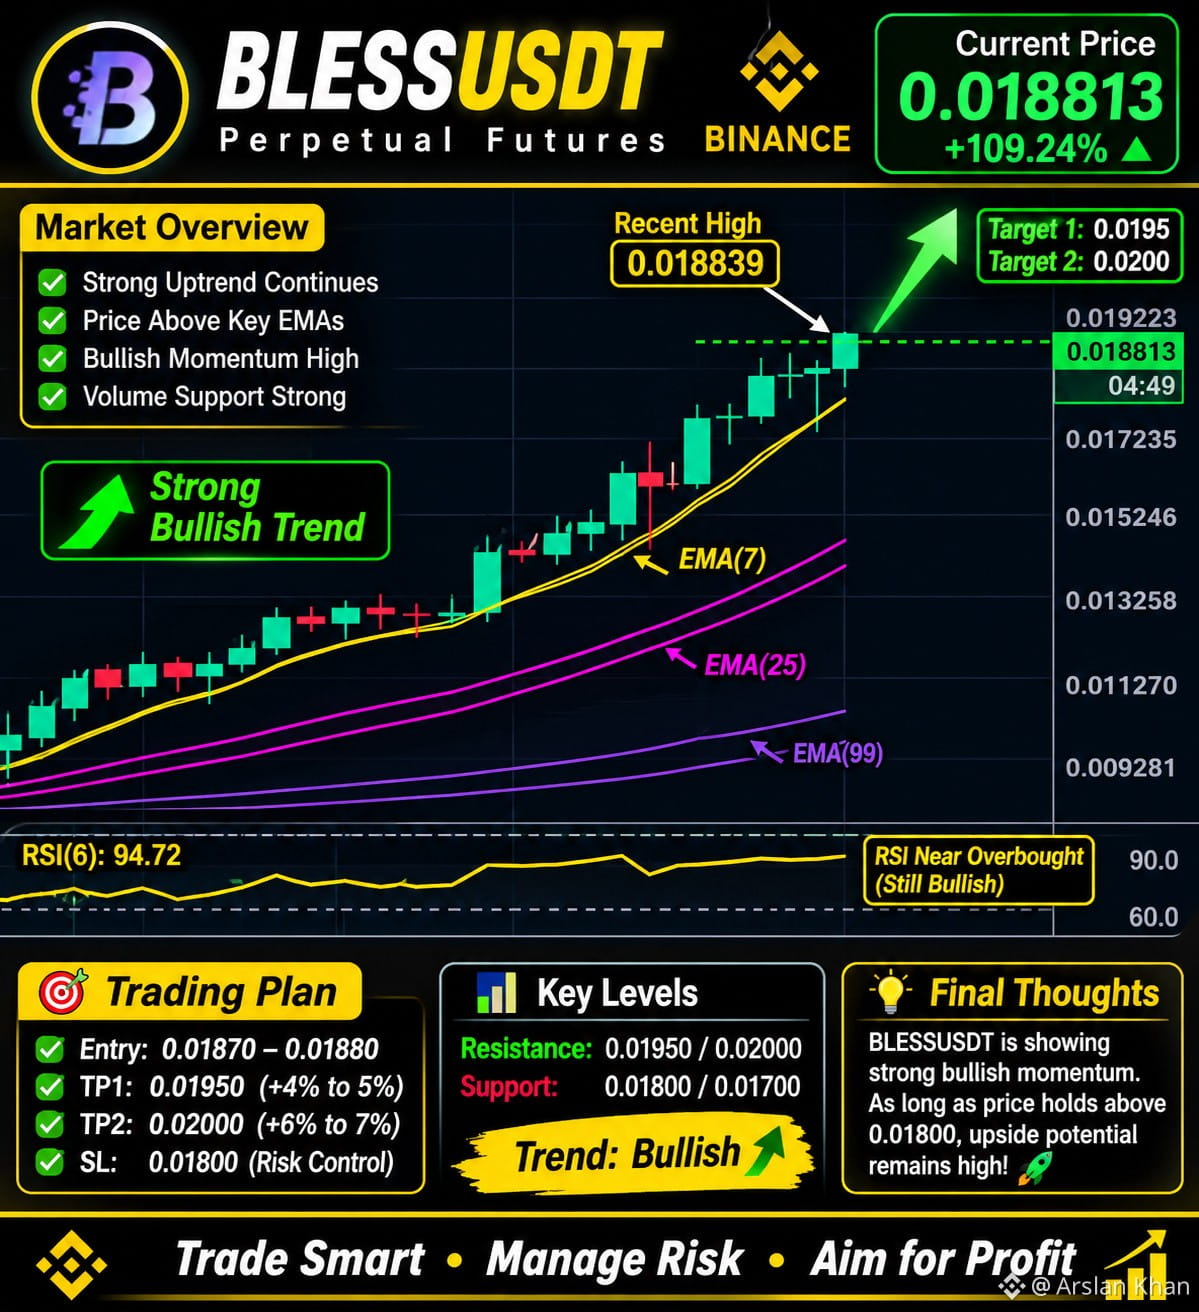
🚀 BLESSUSDT – Strong Bullish Momentum!
BLESS is showing an impressive bullish move, gaining over 109% in the last 24 hours.
📊 Technical Analysis (15M):
- Current Price: 0.018813
- Trend: Strong Bullish
- RSI(6): 94.72 – Extremely Overbought
- EMA(7): 0.017539
- EMA(25): 0.014791
- EMA(99): 0.011394
🎯 Key Resistance Levels:
- R1: 0.01950
- R2: 0.02000
🟢 Key Support Levels:
- S1: 0.01800
- S2: 0.01700
📈 Market Outlook:
The bullish structure remains strong, but the extremely high RSI suggests a possible short-term pullback. Watch for confirmation before entering a trade.
⚠️ Avoid FOMO entries. Always use proper risk management and stop-loss protection.
What do you think? Can BLESS break above 0.02000? 🔥
$BLESS
{future}(BLESSUSDT)
#BLESS #BLESSUSDT #Binance #CryptoAnalysis #Altcoins!
🚀 BLESSUSDT – Strong Bullish Momentum!
BLESS is showing an impressive bullish move, gaining over 109% in the last 24 hours.
📊 Technical Analysis (15M):
- Current Price: 0.018813
- Trend: Strong Bullish
- RSI(6): 94.72 – Extremely Overbought
- EMA(7): 0.017539
- EMA(25): 0.014791
- EMA(99): 0.011394
🎯 Key Resistance Levels:
- R1: 0.01950
- R2: 0.02000
🟢 Key Support Levels:
- S1: 0.01800
- S2: 0.01700
📈 Market Outlook:
The bullish structure remains strong, but the extremely high RSI suggests a possible short-term pullback. Watch for confirmation before entering a trade.
⚠️ Avoid FOMO entries. Always use proper risk management and stop-loss protection.
What do you think? Can BLESS break above 0.02000? 🔥
$BLESS
#BLESS #BLESSUSDT #Binance #CryptoAnalysis #Altcoins!
BLESS is showing an impressive bullish move, gaining over 109% in the last 24 hours.
📊 Technical Analysis (15M):
- Current Price: 0.018813
- Trend: Strong Bullish
- RSI(6): 94.72 – Extremely Overbought
- EMA(7): 0.017539
- EMA(25): 0.014791
- EMA(99): 0.011394
🎯 Key Resistance Levels:
- R1: 0.01950
- R2: 0.02000
🟢 Key Support Levels:
- S1: 0.01800
- S2: 0.01700
📈 Market Outlook:
The bullish structure remains strong, but the extremely high RSI suggests a possible short-term pullback. Watch for confirmation before entering a trade.
⚠️ Avoid FOMO entries. Always use proper risk management and stop-loss protection.
What do you think? Can BLESS break above 0.02000? 🔥
$BLESS
#BLESS #BLESSUSDT #Binance #CryptoAnalysis #Altcoins!
2
485
·
--
Жоғары (өспелі)
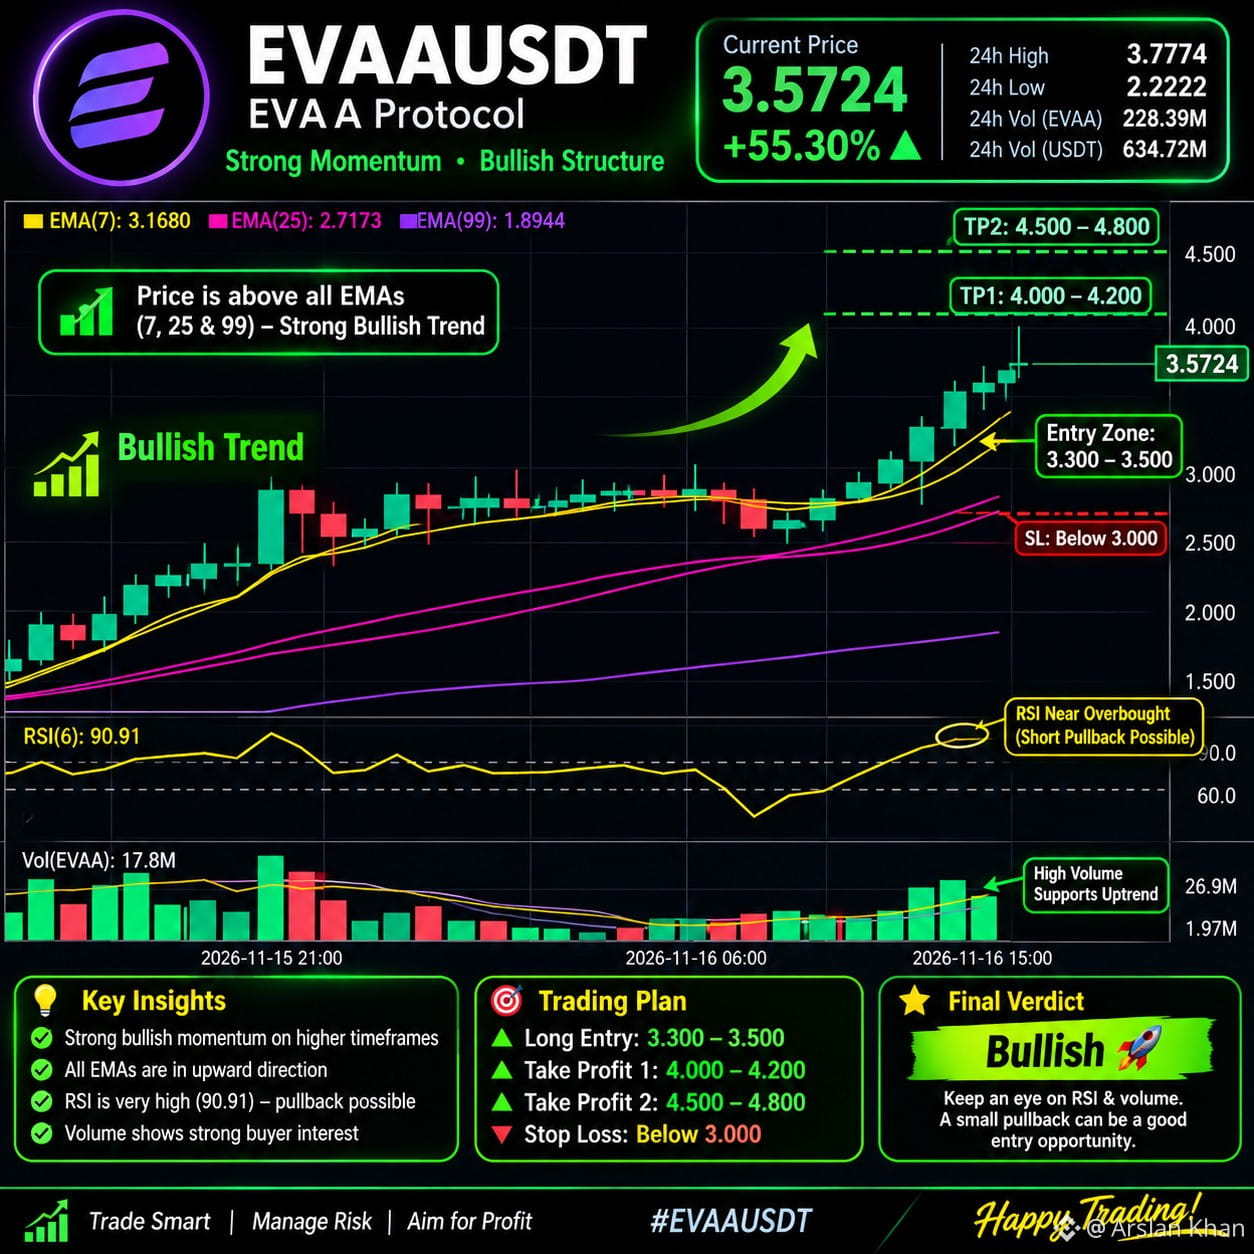
🚀 EVAAUSDT: Bulls Are Taking Control!
EVAA Protocol is showing impressive bullish momentum, with price trading at 3.5724, up +55.30% in 24 hours.
📊 Technical Highlights:
• Strong bullish EMA alignment.
• Increasing trading volume.
• RSI near 91 – extremely overbought.
• Resistance at 3.7774.
• Next psychological target: 4.00.
⚠️ A short-term pullback is possible due to overbought conditions. Avoid chasing the pump and wait for confirmation.
Trend Bias: BULLISH 📈
Trade smart. Manage risk. Never ignore your stop loss.
$EVAA
{future}(EVAAUSDT)
#MUFGSMFGMizuhoPlanYenBackedStablecoin #About64000BitcoinMiningMachinesReportedlyHijacked
#EVAA #AnthropicIPOTestsInvestorAppetiteForAI #HuangReportedlyConsidersReturnToNvidia
🚀 EVAAUSDT: Bulls Are Taking Control!
EVAA Protocol is showing impressive bullish momentum, with price trading at 3.5724, up +55.30% in 24 hours.
📊 Technical Highlights:
• Strong bullish EMA alignment.
• Increasing trading volume.
• RSI near 91 – extremely overbought.
• Resistance at 3.7774.
• Next psychological target: 4.00.
⚠️ A short-term pullback is possible due to overbought conditions. Avoid chasing the pump and wait for confirmation.
Trend Bias: BULLISH 📈
Trade smart. Manage risk. Never ignore your stop loss.
$EVAA
#MUFGSMFGMizuhoPlanYenBackedStablecoin #About64000BitcoinMiningMachinesReportedlyHijacked
#EVAA #AnthropicIPOTestsInvestorAppetiteForAI #HuangReportedlyConsidersReturnToNvidia
EVAA Protocol is showing impressive bullish momentum, with price trading at 3.5724, up +55.30% in 24 hours.
📊 Technical Highlights:
• Strong bullish EMA alignment.
• Increasing trading volume.
• RSI near 91 – extremely overbought.
• Resistance at 3.7774.
• Next psychological target: 4.00.
⚠️ A short-term pullback is possible due to overbought conditions. Avoid chasing the pump and wait for confirmation.
Trend Bias: BULLISH 📈
Trade smart. Manage risk. Never ignore your stop loss.
$EVAA
#MUFGSMFGMizuhoPlanYenBackedStablecoin #About64000BitcoinMiningMachinesReportedlyHijacked
#EVAA #AnthropicIPOTestsInvestorAppetiteForAI #HuangReportedlyConsidersReturnToNvidia
366
·
--
Жоғары (өспелі)
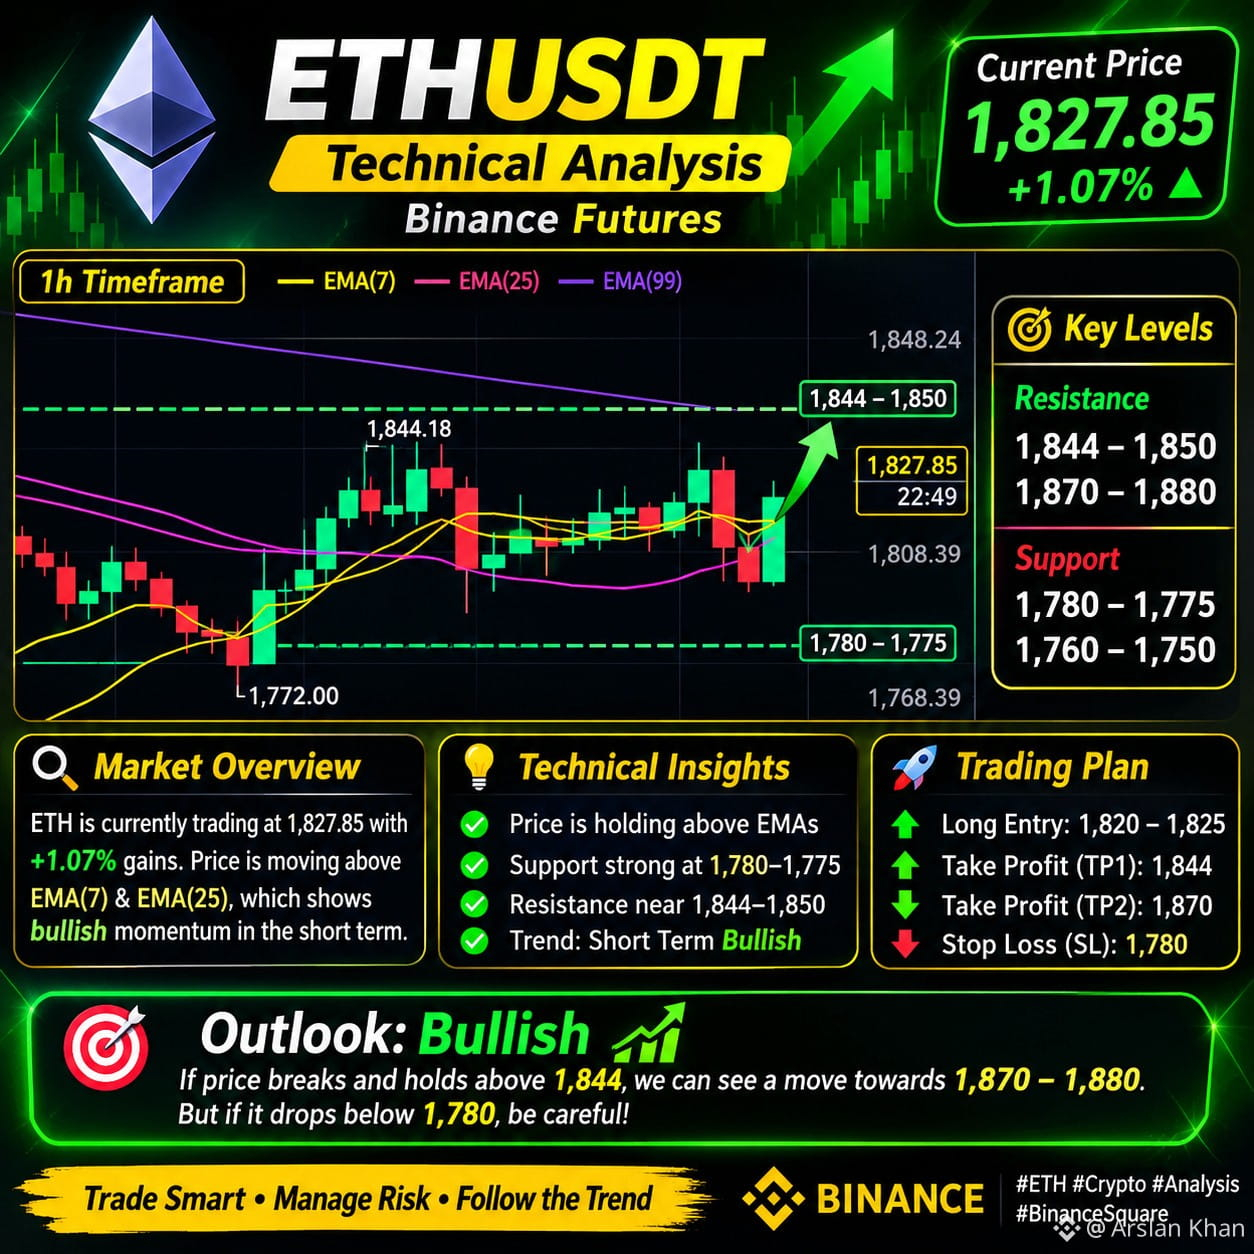
🚀 ETHEREUM (ETHUSDT) – BULLISH MOMENTUM BUILDING?
Ethereum is showing signs of short-term recovery on the 1H timeframe.
📊 Market Overview:
ETH is currently trading around $1,827.85, up +1.07%.
Technical Highlights:
🟢 Price is trading above EMA 7 and EMA 25.
🟢 RSI at 57.30 indicates positive short-term momentum.
🟡 Immediate resistance is around $1,844–$1,850.
🔴 EMA 99 near $1,900 remains a major overhead resistance.
Key Levels to Watch:
🎯 Resistance: $1,844 – $1,850
🎯 Next Target: $1,870 – $1,880
🛡️ Support: $1,780 – $1,775
🛡️ Lower Support: $1,760 – $1,750
My Market Outlook:
ETH looks cautiously bullish in the short term. A confirmed 1H candle close above $1,844 could open the door for further upside.
However, rejection from resistance may bring another pullback.
⚠️ Always manage risk and wait for confirmation before entering a trade.
🔥 Trade Smart. Stay Patient. Protect Your Capital.
$ETH
{future}(ETHUSDT)
#ETH #About64000BitcoinMiningMachinesReportedlyHijacked #WhoWillSucceedJensenHuangatNvidia? #BitcoinActiveSupplyInProfitDropsBelow45% #CryptoSelloffTriggersMultipleWhaleLiquidations
🚀 ETHEREUM (ETHUSDT) – BULLISH MOMENTUM BUILDING?
Ethereum is showing signs of short-term recovery on the 1H timeframe.
📊 Market Overview:
ETH is currently trading around $1,827.85, up +1.07%.
Technical Highlights:
🟢 Price is trading above EMA 7 and EMA 25.
🟢 RSI at 57.30 indicates positive short-term momentum.
🟡 Immediate resistance is around $1,844–$1,850.
🔴 EMA 99 near $1,900 remains a major overhead resistance.
Key Levels to Watch:
🎯 Resistance: $1,844 – $1,850
🎯 Next Target: $1,870 – $1,880
🛡️ Support: $1,780 – $1,775
🛡️ Lower Support: $1,760 – $1,750
My Market Outlook:
ETH looks cautiously bullish in the short term. A confirmed 1H candle close above $1,844 could open the door for further upside.
However, rejection from resistance may bring another pullback.
⚠️ Always manage risk and wait for confirmation before entering a trade.
🔥 Trade Smart. Stay Patient. Protect Your Capital.
$ETH
#ETH #About64000BitcoinMiningMachinesReportedlyHijacked #WhoWillSucceedJensenHuangatNvidia? #BitcoinActiveSupplyInProfitDropsBelow45% #CryptoSelloffTriggersMultipleWhaleLiquidations
Ethereum is showing signs of short-term recovery on the 1H timeframe.
📊 Market Overview:
ETH is currently trading around $1,827.85, up +1.07%.
Technical Highlights:
🟢 Price is trading above EMA 7 and EMA 25.
🟢 RSI at 57.30 indicates positive short-term momentum.
🟡 Immediate resistance is around $1,844–$1,850.
🔴 EMA 99 near $1,900 remains a major overhead resistance.
Key Levels to Watch:
🎯 Resistance: $1,844 – $1,850
🎯 Next Target: $1,870 – $1,880
🛡️ Support: $1,780 – $1,775
🛡️ Lower Support: $1,760 – $1,750
My Market Outlook:
ETH looks cautiously bullish in the short term. A confirmed 1H candle close above $1,844 could open the door for further upside.
However, rejection from resistance may bring another pullback.
⚠️ Always manage risk and wait for confirmation before entering a trade.
🔥 Trade Smart. Stay Patient. Protect Your Capital.
$ETH
#ETH #About64000BitcoinMiningMachinesReportedlyHijacked #WhoWillSucceedJensenHuangatNvidia? #BitcoinActiveSupplyInProfitDropsBelow45% #CryptoSelloffTriggersMultipleWhaleLiquidations
157

·
--
Төмен (кемімелі)
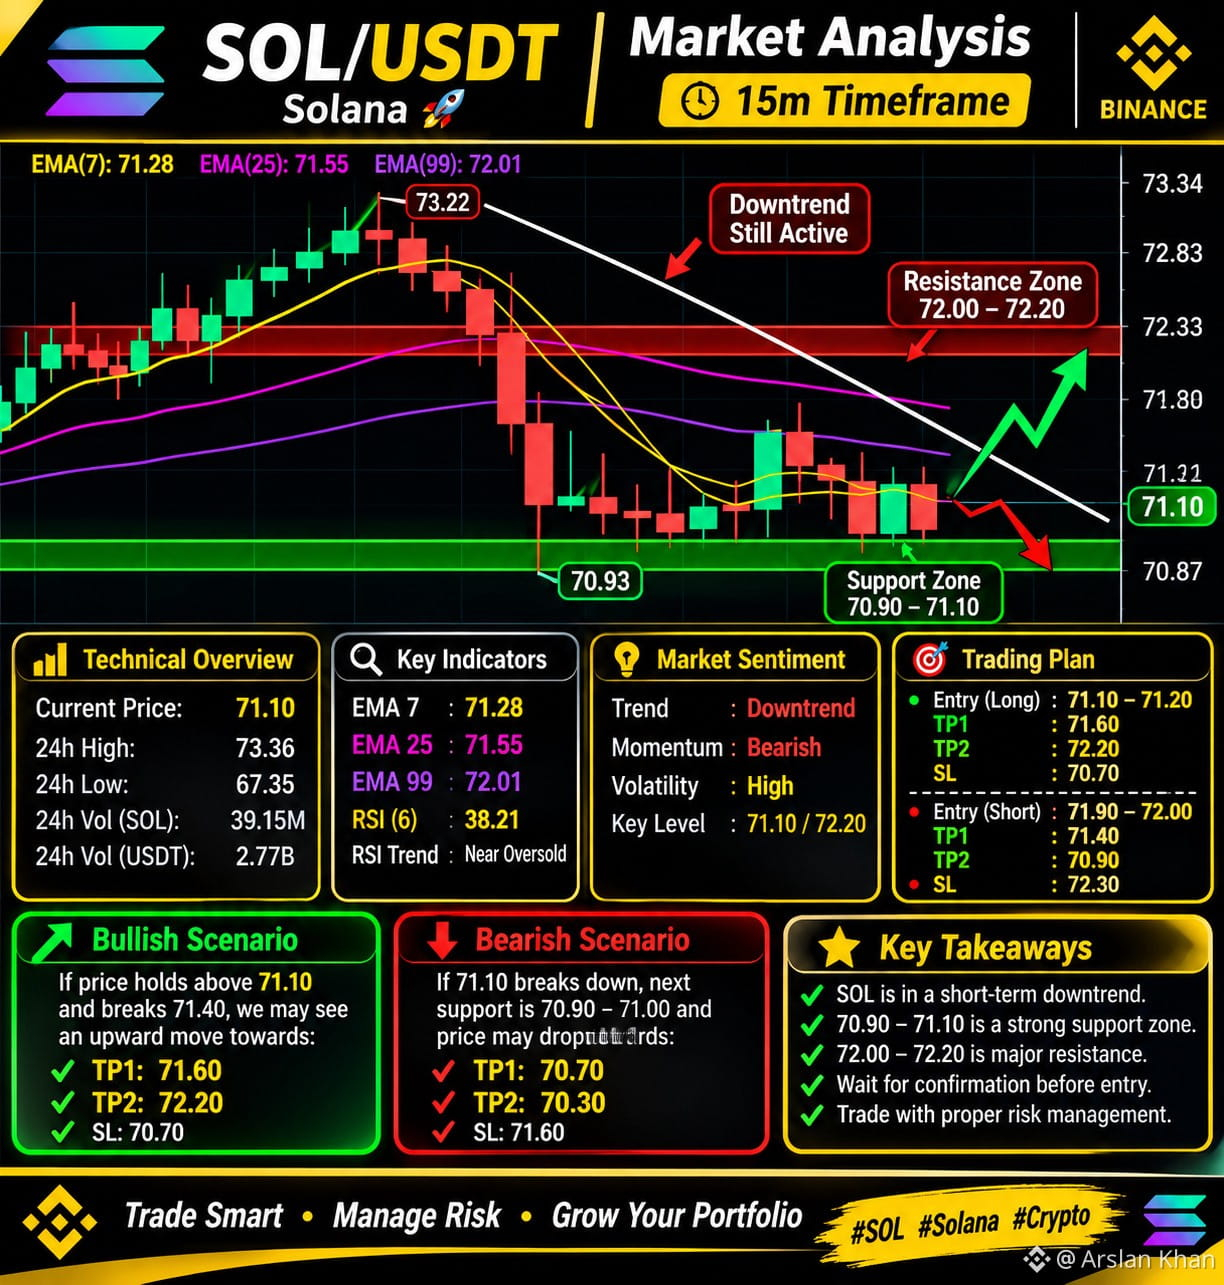
🚨 SOL/USDT – Detailed Technical Analysis | 15M Timeframe
📊 Current Market Overview
- Current Price: $71.10
- 24H High: $73.36
- 24H Low: $67.35
- 24H Change: -3.07%
🔍 Technical Analysis
SOL is currently showing short-term bearish momentum. The price is trading below all three major EMAs:
- EMA 7: $71.28
- EMA 25: $71.55
- EMA 99: $72.01
- RSI (6): 38.21
This indicates that sellers currently have the advantage. RSI is showing weak momentum, but a reversal confirmation is still needed.
🟢 Important Support Levels
- $71.10 – Immediate support
- $70.93 – Recent local low
- $70.70 – Next downside level
- $70.30 – Further bearish target
🔴 Important Resistance Levels
- $71.40 – First recovery level
- $71.55 – EMA 25 resistance
- $72.00 – $72.20 – Major resistance zone
- $72.83 – Higher resistance
📈 Bullish Scenario
If SOL holds above $71.10 and successfully breaks $71.40 with strong buying volume, a recovery towards these levels may become possible:
🎯 TP1: $71.60
🎯 TP2: $71.80
🎯 TP3: $72.20
📉 Bearish Scenario
If SOL loses the $71.10 support with a strong 15M candle close below it, further downside could follow.
🎯 TP1: $70.70
🎯 TP2: $70.30
⚠️ My Final Market View
The short-term trend remains bearish. Buyers need to reclaim $71.40 and overcome the EMA resistance before a stronger bullish recovery can be considered.
Don't rush into LONG or SHORT positions. Wait for candle confirmation, volume confirmation and proper risk management.
💡 Trade Smart. Stay Patient. Protect Your Capital.
What is your view on SOL?
Are we going to see a recovery or another downside move?
$SOL
{future}(SOLUSDT)
$BTC
{spot}(BTCUSDT)
#Solana #CryptoAnalysis #BinanceSquare #TradFiForBeginners #CryptoSelloffTriggersMultipleWhaleLiquidations
🚨 SOL/USDT – Detailed Technical Analysis | 15M Timeframe
📊 Current Market Overview
- Current Price: $71.10
- 24H High: $73.36
- 24H Low: $67.35
- 24H Change: -3.07%
🔍 Technical Analysis
SOL is currently showing short-term bearish momentum. The price is trading below all three major EMAs:
- EMA 7: $71.28
- EMA 25: $71.55
- EMA 99: $72.01
- RSI (6): 38.21
This indicates that sellers currently have the advantage. RSI is showing weak momentum, but a reversal confirmation is still needed.
🟢 Important Support Levels
- $71.10 – Immediate support
- $70.93 – Recent local low
- $70.70 – Next downside level
- $70.30 – Further bearish target
🔴 Important Resistance Levels
- $71.40 – First recovery level
- $71.55 – EMA 25 resistance
- $72.00 – $72.20 – Major resistance zone
- $72.83 – Higher resistance
📈 Bullish Scenario
If SOL holds above $71.10 and successfully breaks $71.40 with strong buying volume, a recovery towards these levels may become possible:
🎯 TP1: $71.60
🎯 TP2: $71.80
🎯 TP3: $72.20
📉 Bearish Scenario
If SOL loses the $71.10 support with a strong 15M candle close below it, further downside could follow.
🎯 TP1: $70.70
🎯 TP2: $70.30
⚠️ My Final Market View
The short-term trend remains bearish. Buyers need to reclaim $71.40 and overcome the EMA resistance before a stronger bullish recovery can be considered.
Don't rush into LONG or SHORT positions. Wait for candle confirmation, volume confirmation and proper risk management.
💡 Trade Smart. Stay Patient. Protect Your Capital.
What is your view on SOL?
Are we going to see a recovery or another downside move?
$SOL
$BTC
#Solana #CryptoAnalysis #BinanceSquare #TradFiForBeginners #CryptoSelloffTriggersMultipleWhaleLiquidations
📊 Current Market Overview
- Current Price: $71.10
- 24H High: $73.36
- 24H Low: $67.35
- 24H Change: -3.07%
🔍 Technical Analysis
SOL is currently showing short-term bearish momentum. The price is trading below all three major EMAs:
- EMA 7: $71.28
- EMA 25: $71.55
- EMA 99: $72.01
- RSI (6): 38.21
This indicates that sellers currently have the advantage. RSI is showing weak momentum, but a reversal confirmation is still needed.
🟢 Important Support Levels
- $71.10 – Immediate support
- $70.93 – Recent local low
- $70.70 – Next downside level
- $70.30 – Further bearish target
🔴 Important Resistance Levels
- $71.40 – First recovery level
- $71.55 – EMA 25 resistance
- $72.00 – $72.20 – Major resistance zone
- $72.83 – Higher resistance
📈 Bullish Scenario
If SOL holds above $71.10 and successfully breaks $71.40 with strong buying volume, a recovery towards these levels may become possible:
🎯 TP1: $71.60
🎯 TP2: $71.80
🎯 TP3: $72.20
📉 Bearish Scenario
If SOL loses the $71.10 support with a strong 15M candle close below it, further downside could follow.
🎯 TP1: $70.70
🎯 TP2: $70.30
⚠️ My Final Market View
The short-term trend remains bearish. Buyers need to reclaim $71.40 and overcome the EMA resistance before a stronger bullish recovery can be considered.
Don't rush into LONG or SHORT positions. Wait for candle confirmation, volume confirmation and proper risk management.
💡 Trade Smart. Stay Patient. Protect Your Capital.
What is your view on SOL?
Are we going to see a recovery or another downside move?
$SOL
$BTC
#Solana #CryptoAnalysis #BinanceSquare #TradFiForBeginners #CryptoSelloffTriggersMultipleWhaleLiquidations
1
1
359
·
--
Жоғары (өспелі)
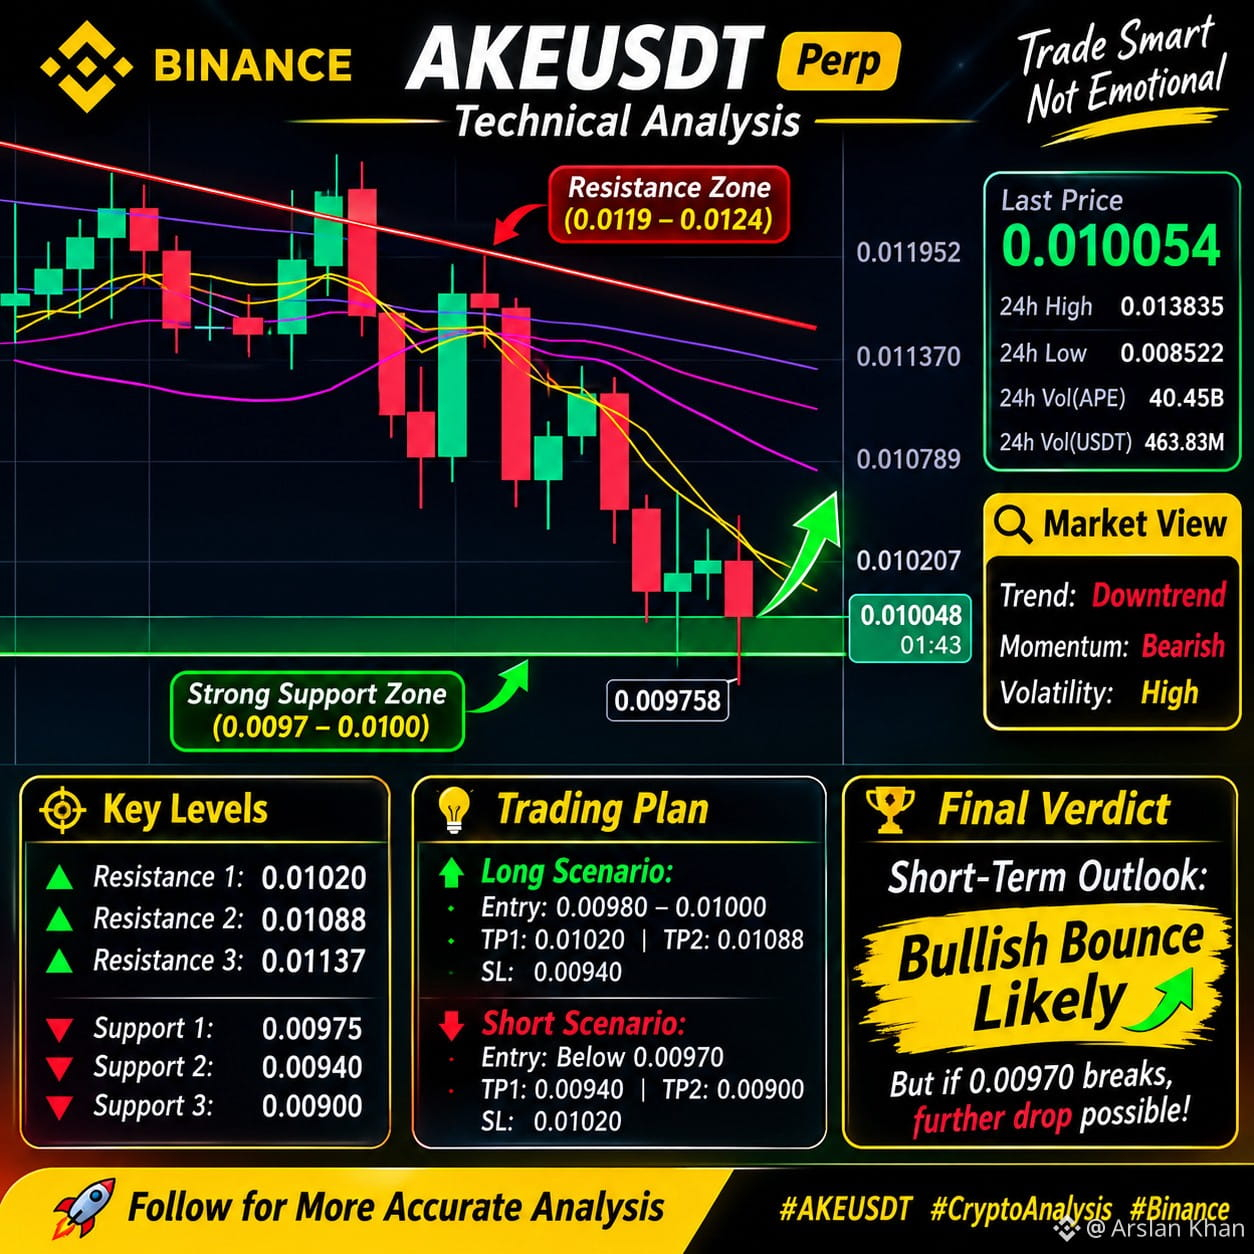
🚨 AKEUSDT – BEARS ARE STILL IN CONTROL!
AKE is showing strong bearish momentum on the 15-minute timeframe.
📊 Market Overview:
- Current Price: 0.010054
- 24H Change: -13.16%
- RSI(6): 29.39
- Trend: Bearish
🔴 Resistance Levels:
- 0.010445
- 0.011023
- 0.011456
🟢 Important Support:
- 0.009758
⚠️ My Analysis:
Price is trading below all major EMAs, indicating strong selling pressure. RSI is approaching oversold territory, so a temporary relief bounce is possible.
If support at 0.009758 breaks, further downside may follow. However, a strong recovery above 0.010445 could signal improving momentum.
🎯 Remember: Wait for confirmation. Don't chase the market. Always manage your risk.
What do you think? More downside or a potential bounce?
$AKE
{future}(AKEUSDT)
$BNB
{future}(BNBUSDT)
#AKEUSDT #Binance #CryptoAnalysis #WillFOMCMinutesReinforceRateHikeExpectations? #BitcoinActiveSupplyInProfitDropsBelow45%
🚨 AKEUSDT – BEARS ARE STILL IN CONTROL!
AKE is showing strong bearish momentum on the 15-minute timeframe.
📊 Market Overview:
- Current Price: 0.010054
- 24H Change: -13.16%
- RSI(6): 29.39
- Trend: Bearish
🔴 Resistance Levels:
- 0.010445
- 0.011023
- 0.011456
🟢 Important Support:
- 0.009758
⚠️ My Analysis:
Price is trading below all major EMAs, indicating strong selling pressure. RSI is approaching oversold territory, so a temporary relief bounce is possible.
If support at 0.009758 breaks, further downside may follow. However, a strong recovery above 0.010445 could signal improving momentum.
🎯 Remember: Wait for confirmation. Don't chase the market. Always manage your risk.
What do you think? More downside or a potential bounce?
$AKE
$BNB
#AKEUSDT #Binance #CryptoAnalysis #WillFOMCMinutesReinforceRateHikeExpectations? #BitcoinActiveSupplyInProfitDropsBelow45%
AKE is showing strong bearish momentum on the 15-minute timeframe.
📊 Market Overview:
- Current Price: 0.010054
- 24H Change: -13.16%
- RSI(6): 29.39
- Trend: Bearish
🔴 Resistance Levels:
- 0.010445
- 0.011023
- 0.011456
🟢 Important Support:
- 0.009758
⚠️ My Analysis:
Price is trading below all major EMAs, indicating strong selling pressure. RSI is approaching oversold territory, so a temporary relief bounce is possible.
If support at 0.009758 breaks, further downside may follow. However, a strong recovery above 0.010445 could signal improving momentum.
🎯 Remember: Wait for confirmation. Don't chase the market. Always manage your risk.
What do you think? More downside or a potential bounce?
$AKE
$BNB
#AKEUSDT #Binance #CryptoAnalysis #WillFOMCMinutesReinforceRateHikeExpectations? #BitcoinActiveSupplyInProfitDropsBelow45%
502
·
--
Жоғары (өспелі)
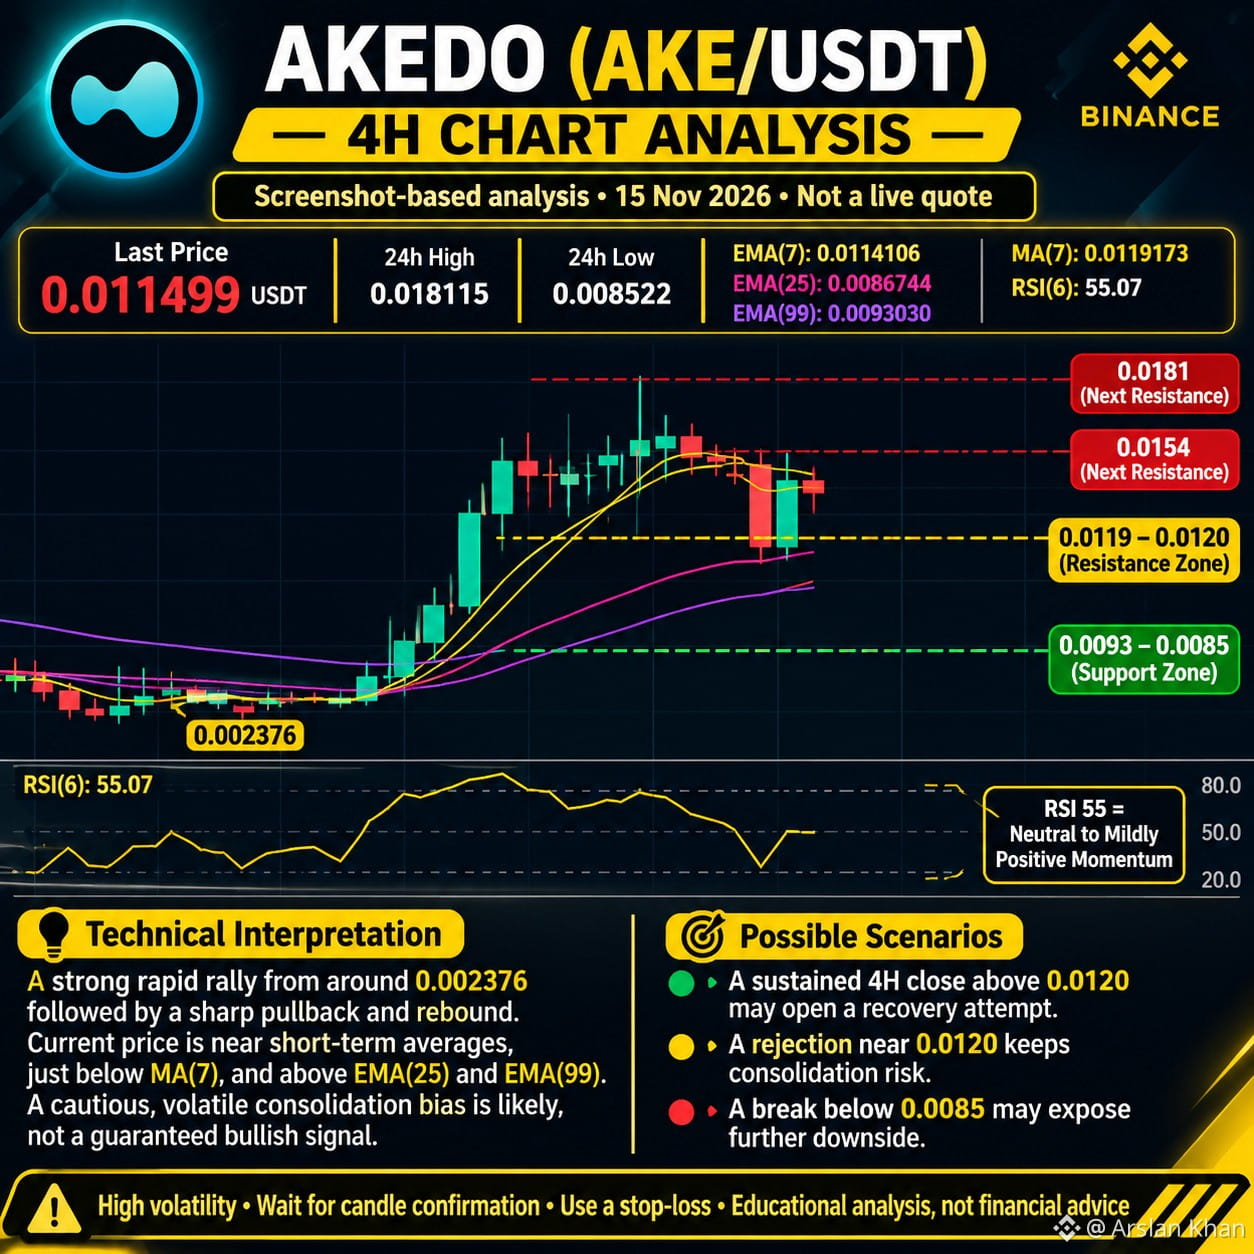
🚀 AKE (AKEDO) – IS ANOTHER BIG MOVE COMING?
AKE is attracting significant attention in the crypto market after an impressive rally.
📊 4H Technical Analysis
Current Price: $0.011499
🔴 Resistance 1: $0.0119–$0.0120 🔴 Resistance 2: $0.0154 🔴 Major Resistance: $0.0181
🟢 Support 1: $0.0093 🟢 Support 2: $0.0085
Market Structure:
AKE experienced a strong upward rally, followed by a sharp correction and a recovery bounce.
RSI (6) is around 55, showing neutral-to-positive short-term momentum.
Possible Scenarios:
🟢 Bullish: A confirmed 4H breakout above $0.0120 could open the door toward higher resistance levels.
🔴 Bearish: Rejection around $0.0120 could lead to another support retest.
⚠️ AKE is highly volatile. Avoid chasing pumps and always manage your risk.
What's your prediction for AKE?
🚀 BULLISH or 🐻 BEARISH?
$AKE
{future}(AKEUSDT)
#AKE #AKEDO #CryptoSelloffTriggersMultipleWhaleLiquidations #WhoWillSucceedJensenHuangatNvidia?
🚀 AKE (AKEDO) – IS ANOTHER BIG MOVE COMING?
AKE is attracting significant attention in the crypto market after an impressive rally.
📊 4H Technical Analysis
Current Price: $0.011499
🔴 Resistance 1: $0.0119–$0.0120 🔴 Resistance 2: $0.0154 🔴 Major Resistance: $0.0181
🟢 Support 1: $0.0093 🟢 Support 2: $0.0085
Market Structure:
AKE experienced a strong upward rally, followed by a sharp correction and a recovery bounce.
RSI (6) is around 55, showing neutral-to-positive short-term momentum.
Possible Scenarios:
🟢 Bullish: A confirmed 4H breakout above $0.0120 could open the door toward higher resistance levels.
🔴 Bearish: Rejection around $0.0120 could lead to another support retest.
⚠️ AKE is highly volatile. Avoid chasing pumps and always manage your risk.
What's your prediction for AKE?
🚀 BULLISH or 🐻 BEARISH?
$AKE
#AKE #AKEDO #CryptoSelloffTriggersMultipleWhaleLiquidations #WhoWillSucceedJensenHuangatNvidia?
AKE is attracting significant attention in the crypto market after an impressive rally.
📊 4H Technical Analysis
Current Price: $0.011499
🔴 Resistance 1: $0.0119–$0.0120 🔴 Resistance 2: $0.0154 🔴 Major Resistance: $0.0181
🟢 Support 1: $0.0093 🟢 Support 2: $0.0085
Market Structure:
AKE experienced a strong upward rally, followed by a sharp correction and a recovery bounce.
RSI (6) is around 55, showing neutral-to-positive short-term momentum.
Possible Scenarios:
🟢 Bullish: A confirmed 4H breakout above $0.0120 could open the door toward higher resistance levels.
🔴 Bearish: Rejection around $0.0120 could lead to another support retest.
⚠️ AKE is highly volatile. Avoid chasing pumps and always manage your risk.
What's your prediction for AKE?
🚀 BULLISH or 🐻 BEARISH?
$AKE
#AKE #AKEDO #CryptoSelloffTriggersMultipleWhaleLiquidations #WhoWillSucceedJensenHuangatNvidia?
1
1.4k
·
--
Жоғары (өспелі)
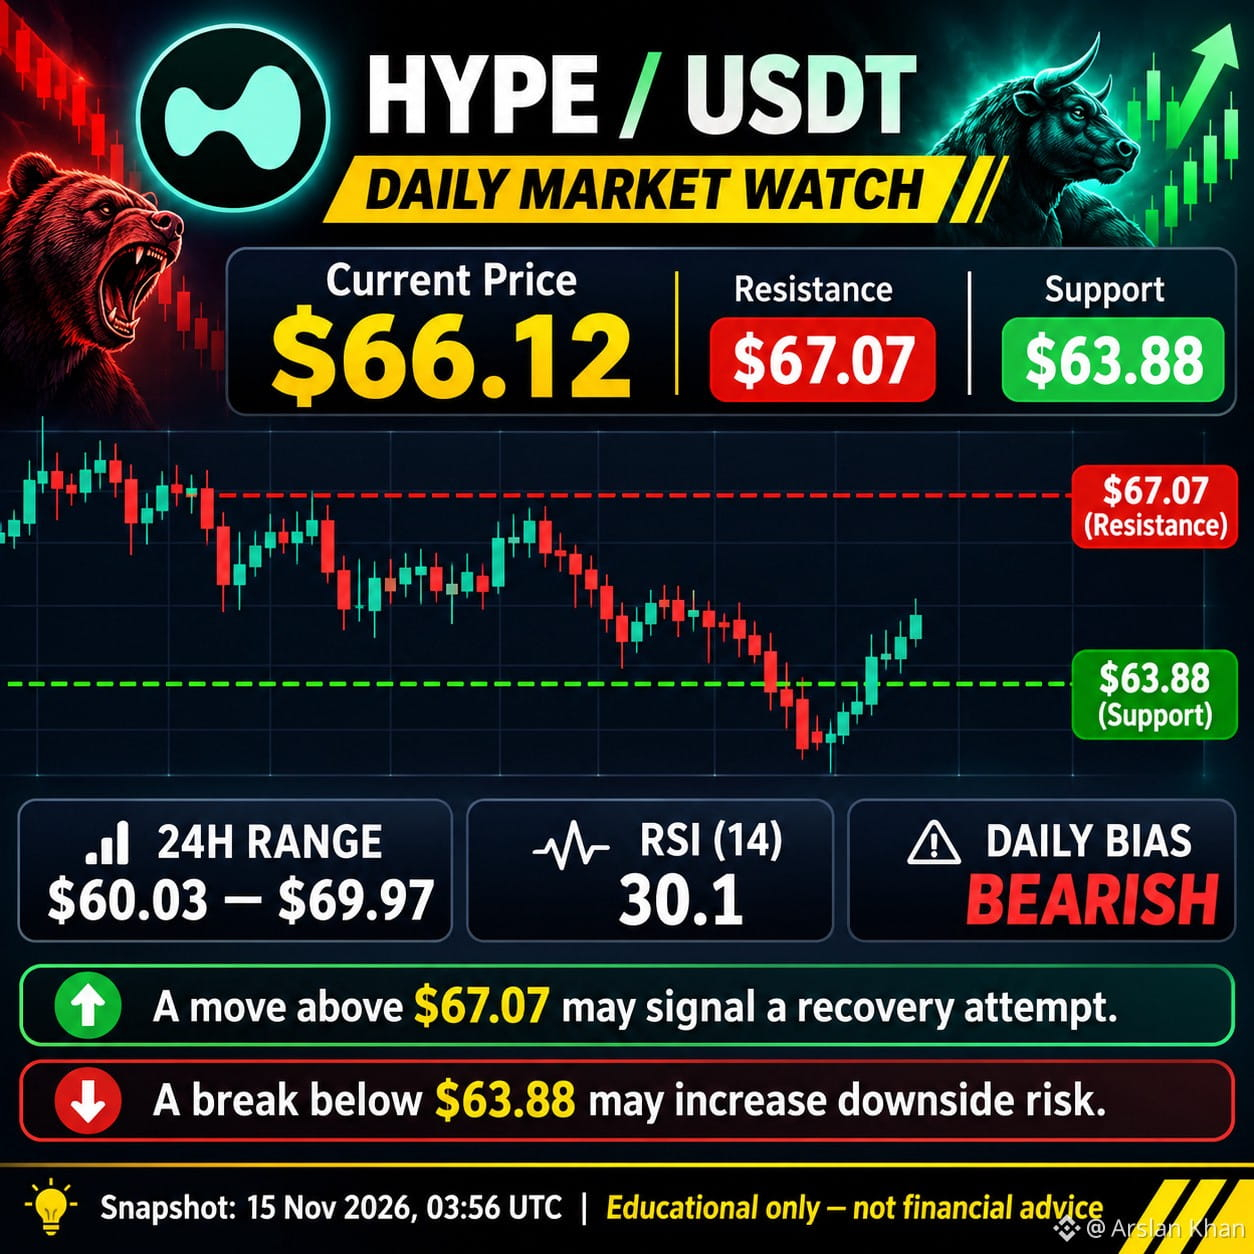
🔥 HYPE/USDT – DAILY MARKET ANALYSIS
📊 Key Market Levels:
- Current Price: $66.12
- Resistance: $67.07
- Support: $63.88
- RSI (14): 30.1
- Market Bias: Bearish
🔍 What to Watch Next?
🟢 Bullish Scenario: A confirmed breakout above $67.07 could signal a potential recovery.
🔴 Bearish Scenario: A breakdown below $63.88 could increase further downside pressure.
⚠️ RSI is near oversold territory, so a short-term relief bounce is also possible.
Trade Smart. Manage Risk. Never Chase the Market.
What's your view on HYPE? Bullish or Bearish? 👇
$HYPE
{spot}(HYPEUSDT)
$BTC
{spot}(BTCUSDT)
#Hyperliquid #BinanceSquare #CryptoSelloffTriggersMultipleWhaleLiquidations
🔥 HYPE/USDT – DAILY MARKET ANALYSIS
📊 Key Market Levels:
- Current Price: $66.12
- Resistance: $67.07
- Support: $63.88
- RSI (14): 30.1
- Market Bias: Bearish
🔍 What to Watch Next?
🟢 Bullish Scenario: A confirmed breakout above $67.07 could signal a potential recovery.
🔴 Bearish Scenario: A breakdown below $63.88 could increase further downside pressure.
⚠️ RSI is near oversold territory, so a short-term relief bounce is also possible.
Trade Smart. Manage Risk. Never Chase the Market.
What's your view on HYPE? Bullish or Bearish? 👇
$HYPE
$BTC
#Hyperliquid #BinanceSquare #CryptoSelloffTriggersMultipleWhaleLiquidations
📊 Key Market Levels:
- Current Price: $66.12
- Resistance: $67.07
- Support: $63.88
- RSI (14): 30.1
- Market Bias: Bearish
🔍 What to Watch Next?
🟢 Bullish Scenario: A confirmed breakout above $67.07 could signal a potential recovery.
🔴 Bearish Scenario: A breakdown below $63.88 could increase further downside pressure.
⚠️ RSI is near oversold territory, so a short-term relief bounce is also possible.
Trade Smart. Manage Risk. Never Chase the Market.
What's your view on HYPE? Bullish or Bearish? 👇
$HYPE
$BTC
#Hyperliquid #BinanceSquare #CryptoSelloffTriggersMultipleWhaleLiquidations
215
·
--
Жоғары (өспелі)
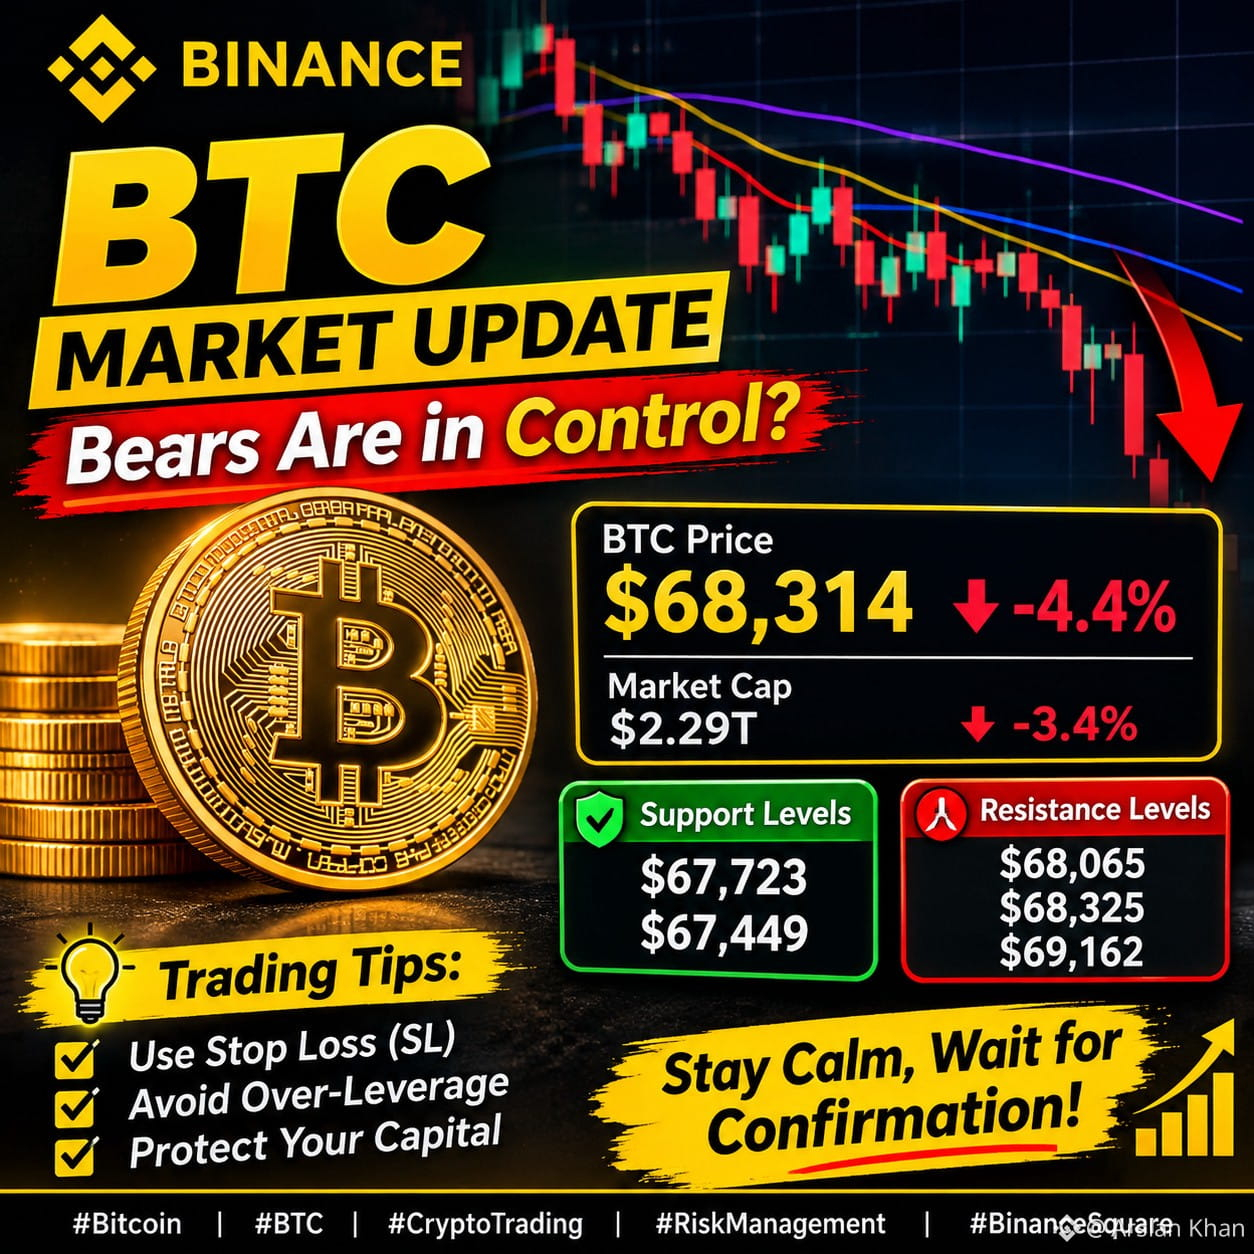
CRYPTO MARKET UPDATE: SELLING PRESSURE CONTINUES!
The crypto market closed under heavy selling pressure.
📊 Latest Binance market close:
BTC: $68,314 (-4.4%)
ETH: $1,930 (-4.4%)
Total crypto market cap: $2.29 trillion (-3.4%)
BTC weekly performance: -9.9%
What should traders watch next?
🔴 Can Bitcoin recover the $70,000 level?
🟢 Will buyers defend the recent lows?
⚠️ Volatility remains high. Avoid emotional
trades and wait for confirmation before entering the market.
What is your opinion? Is this a temporary correction or the beginning of a deeper market decline?
$BTC
{future}(BTCUSDT)
$ETH
{future}(ETHUSDT)
#BitcoinDunyamiz in #BTC C #Ethereum #ETH #CryptoMarket
CRYPTO MARKET UPDATE: SELLING PRESSURE CONTINUES!
The crypto market closed under heavy selling pressure.
📊 Latest Binance market close:
BTC: $68,314 (-4.4%)
ETH: $1,930 (-4.4%)
Total crypto market cap: $2.29 trillion (-3.4%)
BTC weekly performance: -9.9%
What should traders watch next?
🔴 Can Bitcoin recover the $70,000 level?
🟢 Will buyers defend the recent lows?
⚠️ Volatility remains high. Avoid emotional
trades and wait for confirmation before entering the market.
What is your opinion? Is this a temporary correction or the beginning of a deeper market decline?
$BTC
$ETH
#BitcoinDunyamiz in #BTC C #Ethereum #ETH #CryptoMarket
The crypto market closed under heavy selling pressure.
📊 Latest Binance market close:
BTC: $68,314 (-4.4%)
ETH: $1,930 (-4.4%)
Total crypto market cap: $2.29 trillion (-3.4%)
BTC weekly performance: -9.9%
What should traders watch next?
🔴 Can Bitcoin recover the $70,000 level?
🟢 Will buyers defend the recent lows?
⚠️ Volatility remains high. Avoid emotional
trades and wait for confirmation before entering the market.
What is your opinion? Is this a temporary correction or the beginning of a deeper market decline?
$BTC
$ETH
#BitcoinDunyamiz in #BTC C #Ethereum #ETH #CryptoMarket
75
·
--
Төмен (кемімелі)
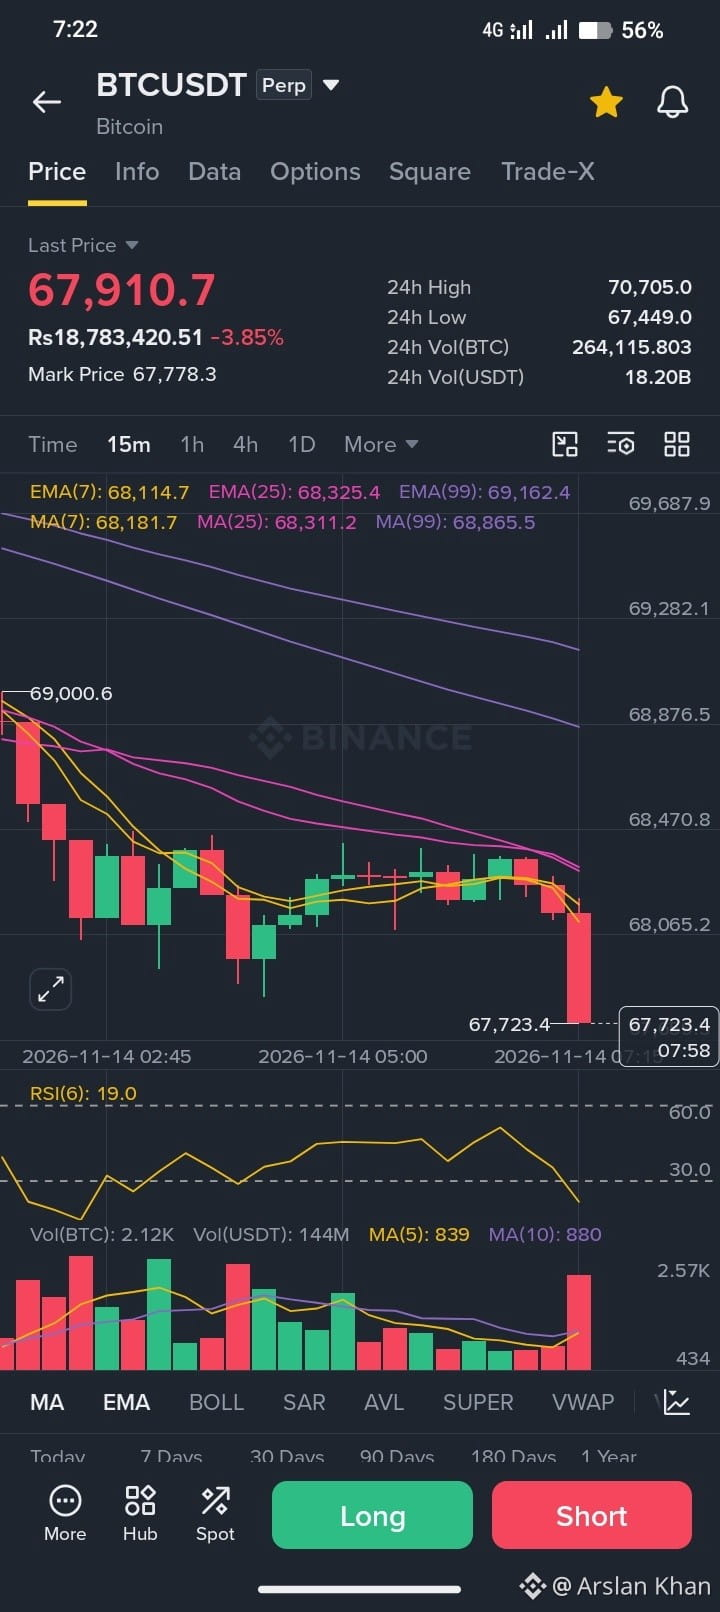
🚨 BITCOIN (BTC) UPDATE – BEARS ARE IN CONTROL? 📉
Bitcoin is showing strong selling pressure on the 15-minute timeframe.
🔴 Technical Overview:
Price: $67,910
24H Change: -3.85%
RSI (6): 19 – Oversold territory
EMA 7: $68,114
EMA 25: $68,325
EMA 99: $69,162
📊 Important Levels to Watch:
🟢 Support:
$67,723
$67,449
🔴 Resistance:
$68,065
$68,325
$69,162
My Market View:
BTC is currently under bearish pressure, with price trading below all major EMAs.
However, RSI is deeply oversold, so a short-term relief bounce or pullback is possible.
A breakdown below support could bring further downside, while reclaiming $68,325 may give buyers some strength.
⚠️ Don't chase the move. Wait for confirmation and manage your risk.
What do you think? Will BTC bounce back or continue falling?
$ETH
{future}(ETHUSDT)
$BTC
{future}(BTCUSDT)
#BTC☀️ #CryptoMarket #BinanceSquare #BTCUSDT #CryptoTrading
🚨 BITCOIN (BTC) UPDATE – BEARS ARE IN CONTROL? 📉
Bitcoin is showing strong selling pressure on the 15-minute timeframe.
🔴 Technical Overview:
Price: $67,910
24H Change: -3.85%
RSI (6): 19 – Oversold territory
EMA 7: $68,114
EMA 25: $68,325
EMA 99: $69,162
📊 Important Levels to Watch:
🟢 Support:
$67,723
$67,449
🔴 Resistance:
$68,065
$68,325
$69,162
My Market View:
BTC is currently under bearish pressure, with price trading below all major EMAs.
However, RSI is deeply oversold, so a short-term relief bounce or pullback is possible.
A breakdown below support could bring further downside, while reclaiming $68,325 may give buyers some strength.
⚠️ Don't chase the move. Wait for confirmation and manage your risk.
What do you think? Will BTC bounce back or continue falling?
$ETH
$BTC
#BTC☀️ #CryptoMarket #BinanceSquare #BTCUSDT #CryptoTrading
Bitcoin is showing strong selling pressure on the 15-minute timeframe.
🔴 Technical Overview:
Price: $67,910
24H Change: -3.85%
RSI (6): 19 – Oversold territory
EMA 7: $68,114
EMA 25: $68,325
EMA 99: $69,162
📊 Important Levels to Watch:
🟢 Support:
$67,723
$67,449
🔴 Resistance:
$68,065
$68,325
$69,162
My Market View:
BTC is currently under bearish pressure, with price trading below all major EMAs.
However, RSI is deeply oversold, so a short-term relief bounce or pullback is possible.
A breakdown below support could bring further downside, while reclaiming $68,325 may give buyers some strength.
⚠️ Don't chase the move. Wait for confirmation and manage your risk.
What do you think? Will BTC bounce back or continue falling?
$ETH
$BTC
#BTC☀️ #CryptoMarket #BinanceSquare #BTCUSDT #CryptoTrading
84
·
--
Төмен (кемімелі)
1
462
·
--
Төмен (кемімелі)
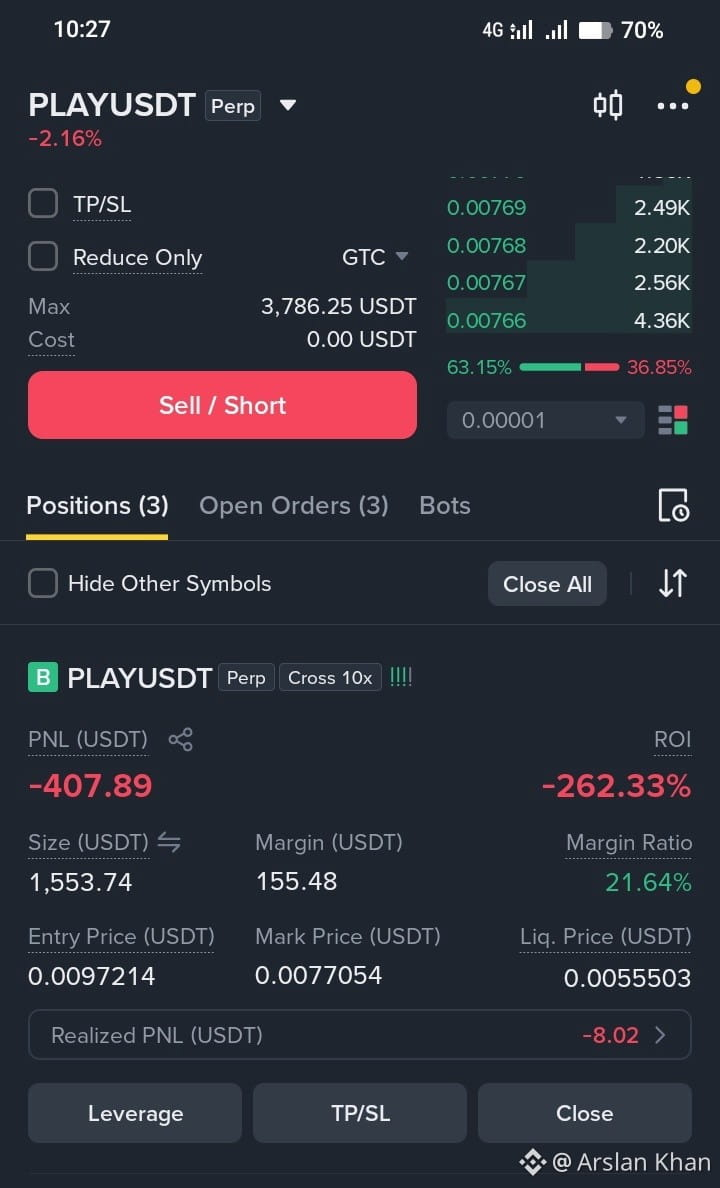
I'm in big trouble please tell me Hold or close🥹😓
$PLAY
#HotCPIDecemberHikePriced #BitcoinFiveWeeklyLosses
I'm in big trouble please tell me Hold or close🥹😓
$PLAY
#HotCPIDecemberHikePriced #BitcoinFiveWeeklyLosses
$PLAY
#HotCPIDecemberHikePriced #BitcoinFiveWeeklyLosses
24
1
15
17.3k
·
--
Жоғары (өспелі)
3
2
548
·
--
Төмен (кемімелі)
12
13
11.2k
·
--
Жоғары (өспелі)
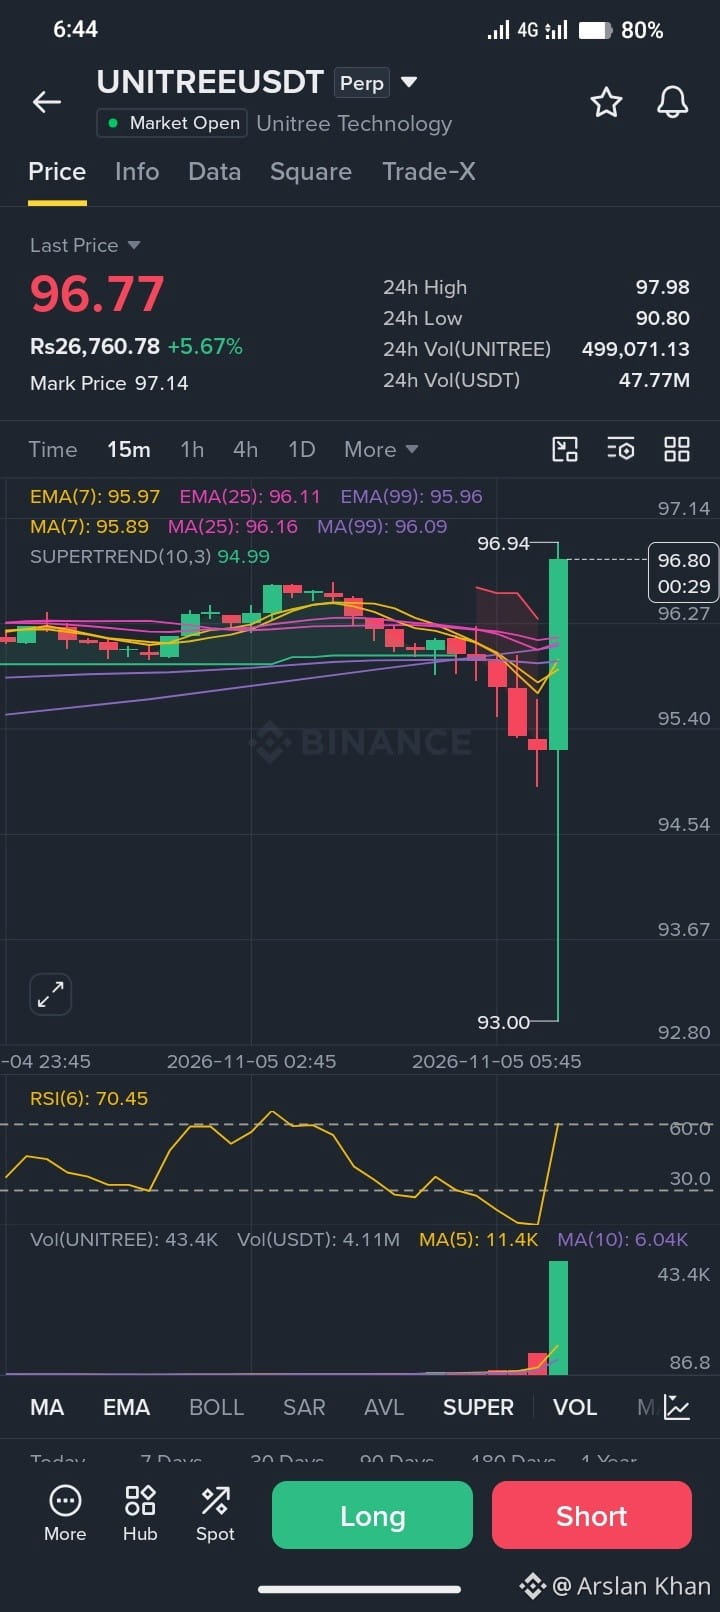
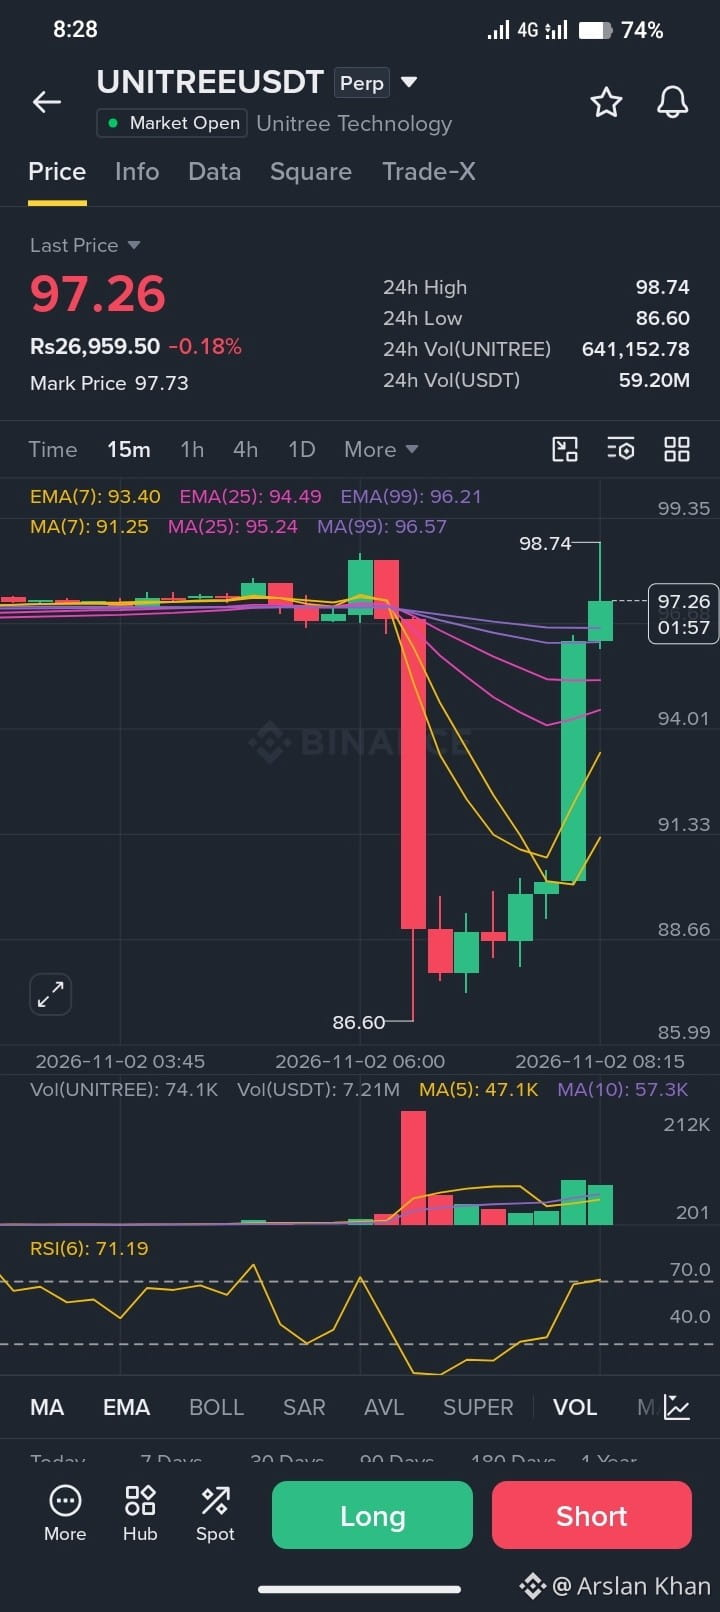
what the fuck can't understand this fucking Move $UNITREE #Binance98PercentReplenished
what the fuck can't understand this fucking Move $UNITREE #Binance98PercentReplenished
2
482
·
--
Төмен (кемімелі)
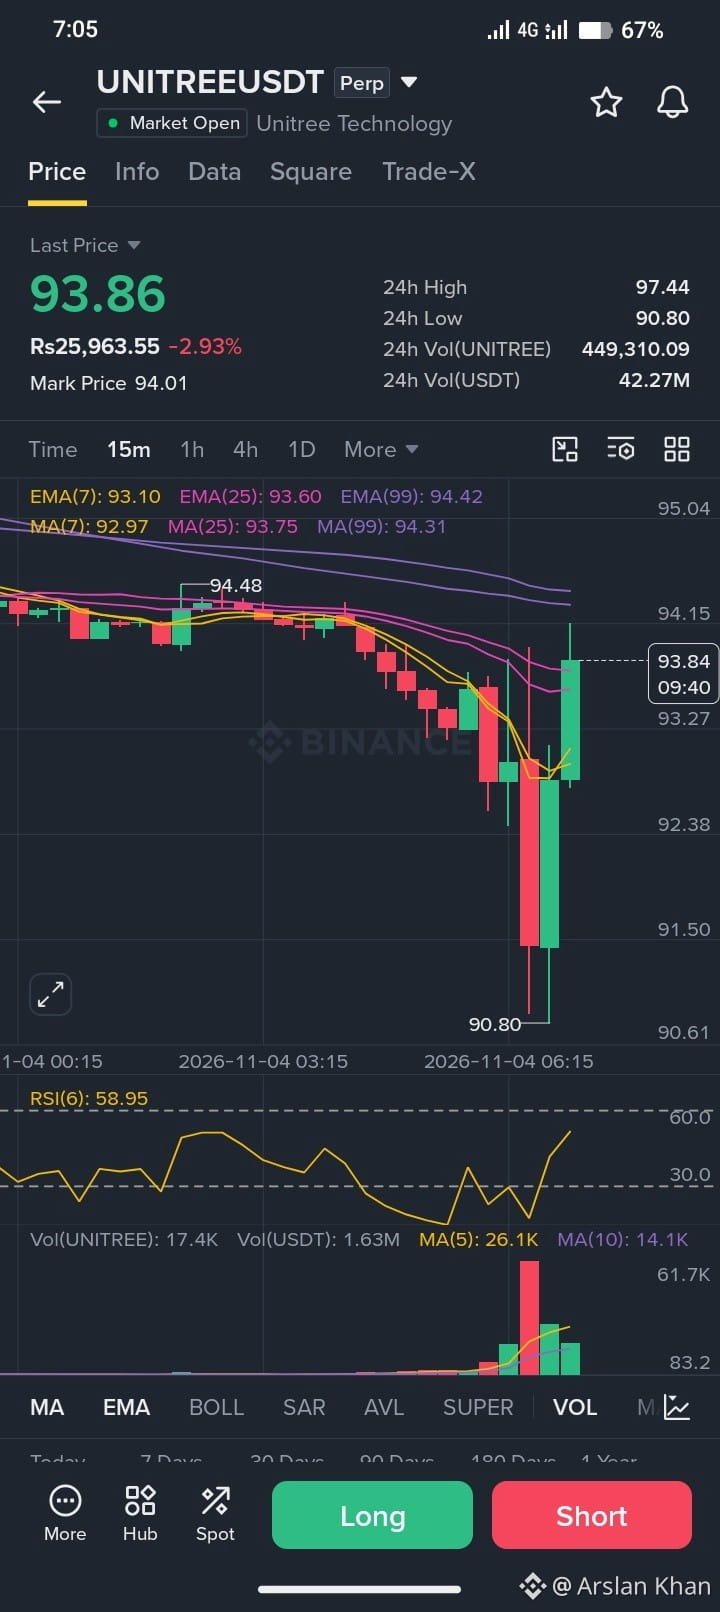
it's again fucking Move 🥹
#BinanceIncidentReport
it's again fucking Move 🥹
#BinanceIncidentReport
#BinanceIncidentReport
1
3
711
·
--
Жоғары (өспелі)
15
5
1.6k
·
--
Жоғары (өспелі)
349
·
--
Жоғары (өспелі)
243
Көбірек контент көру үшін кіріңіз
Binance Square платформасында әлемдік криптоқоғамдастыққа қосылыңыз
⚡️ Криптовалюта туралы ең соңғы және пайдалы ақпаратты алыңыз.
💬 Әлемдегі ең ірі криптобиржаның сеніміне ие.
👍 Расталған авторлардың нақты пікірлерін табыңыз.
Электрондық пошта/телефон нөмірі
Трендтегі тақырыптар
A Packed Week of Earnings and Data Tests Markets
52,773 рет көрілді
359 адам талқылап жатыр
Nvidia, Anthropic і ФРС. Три тести за один тиждень
Nick_Invest
·3 лайк
·996 рет көрілді
AnthropicIPOTestsInvestorAppetiteForAI
91,046 рет көрілді
1,227 адам талқылап жатыр
BitcoinExtendsLosingStreakToSixWeeks
54,324 рет көрілді
582 адам талқылап жатыр