
Tragic263
34 投稿

Tragic263
報告
ユーザーをブロック
取引を発注
高頻度トレーダー
3.6年
16 フォロー
19 フォロワー
14 いいね
投稿
ポートフォリオ
すべて
引用
·
--
翻訳参照
#2025withBinance Start your crypto story with the @Binance Year in Review and share your highlights! #2025withBinance.
👉 Sign up with my link and get 100 USD rewards! https://www.binance.com/year-in-review/2025-with-binance?ref=564173710
#2025withBinance Start your crypto story with the @Binance Year in Review and share your highlights! #2025withBinance.
👉 Sign up with my link and get 100 USD rewards! https://www.binance.com/year-in-review/2025-with-binance?ref=564173710
👉 Sign up with my link and get 100 USD rewards! https://www.binance.com/year-in-review/2025-with-binance?ref=564173710


·
--
弱気相場
翻訳参照
---
🧠 Trade Setup: Bounce from Oversold Zone
📌 Assumptions Based on Chart
- RSI is near or below 30 → Oversold
- Price is hugging the lower Bollinger Band → Volatility + potential bounce
- MACD is flattening → Momentum may be shifting
- Order book shows 67% sell pressure → Still bearish, but could reverse
---
🟢 Entry Point
- Buy Zone: Around 1,150 USDT
This is close to the 24h low and near support. You wait for a small bullish candle or RSI to tick upward before entering.
---
🛑 Stop-Loss
- Set at: 1,135 USDT
Just below the recent low (1,143.01). This protects you if the price keeps falling.
---
🎯 Take-Profit Targets
| Target Level | Reason | Profit Potential |
|--------------|--------|------------------|
| 1,175 USDT | Minor resistance | Quick scalp |
| 1,200 USDT | Round number + previous support | Safer exit |
| 1,220 USDT | Mid-range between low and high | Stronger bounce |
You can use a trailing stop if price moves up, locking in gains while letting profits run.
---
📊 Risk-Reward Ratio
- Risk: ~15 USDT (from 1,150 to 1,135)
- Reward: ~50–70 USDT (if targeting 1,200–1,220)
- Risk-Reward: ~1:3 to 1:4 — solid setup!
---
🧭 Bonus Tip: Confirmation Checklist
Before entering:
- ✅ RSI starts rising from oversold
- ✅ MACD histogram shrinks or flips green
- ✅ Small bullish candle forms near support
- ✅ Volume increases on green candles
---#MarketPullback #BinanceHODLerENSO #BinanceHODLerYB #bnb #BNB_Market_Update
---
🧠 Trade Setup: Bounce from Oversold Zone
📌 Assumptions Based on Chart
- RSI is near or below 30 → Oversold
- Price is hugging the lower Bollinger Band → Volatility + potential bounce
- MACD is flattening → Momentum may be shifting
- Order book shows 67% sell pressure → Still bearish, but could reverse
---
🟢 Entry Point
- Buy Zone: Around 1,150 USDT
This is close to the 24h low and near support. You wait for a small bullish candle or RSI to tick upward before entering.
---
🛑 Stop-Loss
- Set at: 1,135 USDT
Just below the recent low (1,143.01). This protects you if the price keeps falling.
---
🎯 Take-Profit Targets
| Target Level | Reason | Profit Potential |
|--------------|--------|------------------|
| 1,175 USDT | Minor resistance | Quick scalp |
| 1,200 USDT | Round number + previous support | Safer exit |
| 1,220 USDT | Mid-range between low and high | Stronger bounce |
You can use a trailing stop if price moves up, locking in gains while letting profits run.
---
📊 Risk-Reward Ratio
- Risk: ~15 USDT (from 1,150 to 1,135)
- Reward: ~50–70 USDT (if targeting 1,200–1,220)
- Risk-Reward: ~1:3 to 1:4 — solid setup!
---
🧭 Bonus Tip: Confirmation Checklist
Before entering:
- ✅ RSI starts rising from oversold
- ✅ MACD histogram shrinks or flips green
- ✅ Small bullish candle forms near support
- ✅ Volume increases on green candles
---#MarketPullback #BinanceHODLerENSO #BinanceHODLerYB #bnb #BNB_Market_Update
---
🧠 Trade Setup: Bounce from Oversold Zone
📌 Assumptions Based on Chart
- RSI is near or below 30 → Oversold
- Price is hugging the lower Bollinger Band → Volatility + potential bounce
- MACD is flattening → Momentum may be shifting
- Order book shows 67% sell pressure → Still bearish, but could reverse
---
🟢 Entry Point
- Buy Zone: Around 1,150 USDT
This is close to the 24h low and near support. You wait for a small bullish candle or RSI to tick upward before entering.
---
🛑 Stop-Loss
- Set at: 1,135 USDT
Just below the recent low (1,143.01). This protects you if the price keeps falling.
---
🎯 Take-Profit Targets
| Target Level | Reason | Profit Potential |
|--------------|--------|------------------|
| 1,175 USDT | Minor resistance | Quick scalp |
| 1,200 USDT | Round number + previous support | Safer exit |
| 1,220 USDT | Mid-range between low and high | Stronger bounce |
You can use a trailing stop if price moves up, locking in gains while letting profits run.
---
📊 Risk-Reward Ratio
- Risk: ~15 USDT (from 1,150 to 1,135)
- Reward: ~50–70 USDT (if targeting 1,200–1,220)
- Risk-Reward: ~1:3 to 1:4 — solid setup!
---
🧭 Bonus Tip: Confirmation Checklist
Before entering:
- ✅ RSI starts rising from oversold
- ✅ MACD histogram shrinks or flips green
- ✅ Small bullish candle forms near support
- ✅ Volume increases on green candles
---#MarketPullback #BinanceHODLerENSO #BinanceHODLerYB #bnb #BNB_Market_Update
8
·
--
ブリッシュ
翻訳参照
7
·
--
翻訳参照
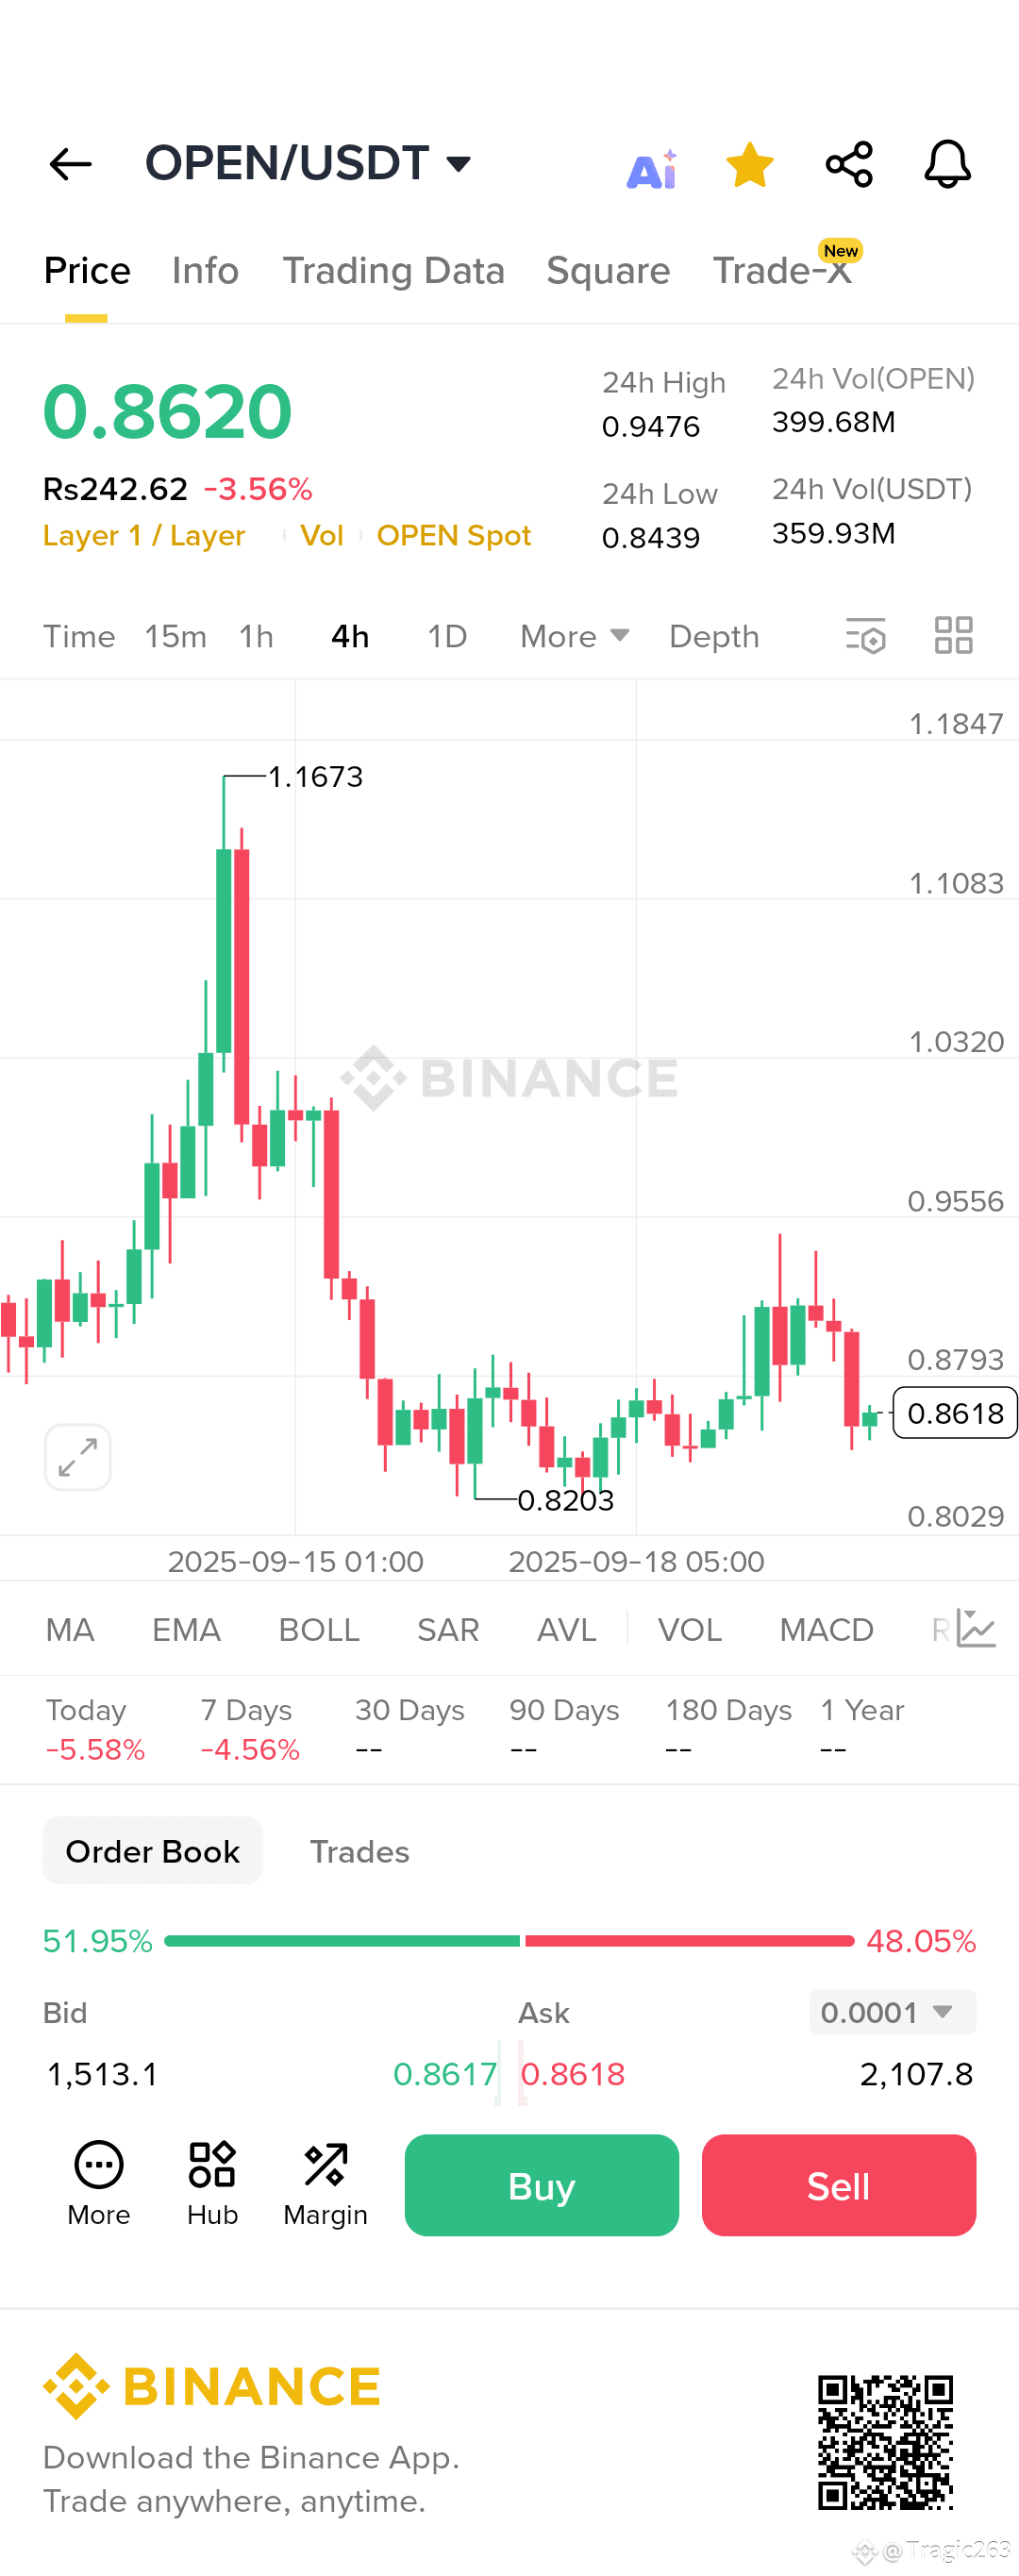
🔹 Current Situation
#open #BNBBreaks1000 #BNBChainEcosystemRally
Price: 0.8620 USDT (down -3.56% in 24h)
24h High: 0.9476
24h Low: 0.8439
Volume (OPEN): 399.68M (quite high, shows active trading)
Recent Trend: Price has been in a downtrend after peaking at 1.1673. It found a bottom near 0.8203 and made a small recovery, but resistance around 0.8793 rejected it again.
🔹 Technical Observations
Support & Resistance
Strong support: 0.8200 – 0.8430 zone.
Immediate resistance: 0.8790 – 0.9470 zone.
Major resistance: 1.03 – 1.16.
Candlestick Structure
After the sharp fall from 1.16, the market is consolidating in a sideways range (0.82 – 0.95).
Recent candles show selling pressure near 0.8793.
Volume
Volume is still healthy, meaning traders are active, but sellers currently dominate slightly (48.05% ask vs 51.95% bid).
Momentum
Short-term momentum looks bearish (lower highs forming).
If price breaks 0.8430, it could re-test 0.8200 or even 0.8020.
If bulls defend 0.8430 and push above 0.8790, the next target could be 0.95 – 1.03.
🔹 Prediction (Short-Term, 4h Chart)
📉 Bearish scenario: If 0.8430 breaks, price may test 0.8200 – 0.8020.
📈 Bullish scenario: If price reclaims and holds above 0.8790, next resistance is 0.95 – 1.03.
🔹 Trading Strategy (Not Financial Advice)
Buy Zone: 0.8200 – 0.8430 (strong support area, but wait for confirmation).
Take Profit: 0.8790 → 0.95 → 1.03.
Stop Loss: Below 0.8020 (to avoid deeper downside risk).
👉 In summary: The market is consolidating after a big drop. Currently, bias is slightly bearish, but if it holds support at 0.8430, we may see a bounce toward 0.95+.
Would you like me to also check the daily timeframe (1D) for a bigger picture trend?
https://www.binance.com/download?utm_medium=screenshot
🔹 Current Situation
#open #BNBBreaks1000 #BNBChainEcosystemRally
Price: 0.8620 USDT (down -3.56% in 24h)
24h High: 0.9476
24h Low: 0.8439
Volume (OPEN): 399.68M (quite high, shows active trading)
Recent Trend: Price has been in a downtrend after peaking at 1.1673. It found a bottom near 0.8203 and made a small recovery, but resistance around 0.8793 rejected it again.
🔹 Technical Observations
Support & Resistance
Strong support: 0.8200 – 0.8430 zone.
Immediate resistance: 0.8790 – 0.9470 zone.
Major resistance: 1.03 – 1.16.
Candlestick Structure
After the sharp fall from 1.16, the market is consolidating in a sideways range (0.82 – 0.95).
Recent candles show selling pressure near 0.8793.
Volume
Volume is still healthy, meaning traders are active, but sellers currently dominate slightly (48.05% ask vs 51.95% bid).
Momentum
Short-term momentum looks bearish (lower highs forming).
If price breaks 0.8430, it could re-test 0.8200 or even 0.8020.
If bulls defend 0.8430 and push above 0.8790, the next target could be 0.95 – 1.03.
🔹 Prediction (Short-Term, 4h Chart)
📉 Bearish scenario: If 0.8430 breaks, price may test 0.8200 – 0.8020.
📈 Bullish scenario: If price reclaims and holds above 0.8790, next resistance is 0.95 – 1.03.
🔹 Trading Strategy (Not Financial Advice)
Buy Zone: 0.8200 – 0.8430 (strong support area, but wait for confirmation).
Take Profit: 0.8790 → 0.95 → 1.03.
Stop Loss: Below 0.8020 (to avoid deeper downside risk).
👉 In summary: The market is consolidating after a big drop. Currently, bias is slightly bearish, but if it holds support at 0.8430, we may see a bounce toward 0.95+.
Would you like me to also check the daily timeframe (1D) for a bigger picture trend?
https://www.binance.com/download?utm_medium=screenshot
#open #BNBBreaks1000 #BNBChainEcosystemRally
Price: 0.8620 USDT (down -3.56% in 24h)
24h High: 0.9476
24h Low: 0.8439
Volume (OPEN): 399.68M (quite high, shows active trading)
Recent Trend: Price has been in a downtrend after peaking at 1.1673. It found a bottom near 0.8203 and made a small recovery, but resistance around 0.8793 rejected it again.
🔹 Technical Observations
Support & Resistance
Strong support: 0.8200 – 0.8430 zone.
Immediate resistance: 0.8790 – 0.9470 zone.
Major resistance: 1.03 – 1.16.
Candlestick Structure
After the sharp fall from 1.16, the market is consolidating in a sideways range (0.82 – 0.95).
Recent candles show selling pressure near 0.8793.
Volume
Volume is still healthy, meaning traders are active, but sellers currently dominate slightly (48.05% ask vs 51.95% bid).
Momentum
Short-term momentum looks bearish (lower highs forming).
If price breaks 0.8430, it could re-test 0.8200 or even 0.8020.
If bulls defend 0.8430 and push above 0.8790, the next target could be 0.95 – 1.03.
🔹 Prediction (Short-Term, 4h Chart)
📉 Bearish scenario: If 0.8430 breaks, price may test 0.8200 – 0.8020.
📈 Bullish scenario: If price reclaims and holds above 0.8790, next resistance is 0.95 – 1.03.
🔹 Trading Strategy (Not Financial Advice)
Buy Zone: 0.8200 – 0.8430 (strong support area, but wait for confirmation).
Take Profit: 0.8790 → 0.95 → 1.03.
Stop Loss: Below 0.8020 (to avoid deeper downside risk).
👉 In summary: The market is consolidating after a big drop. Currently, bias is slightly bearish, but if it holds support at 0.8430, we may see a bounce toward 0.95+.
Would you like me to also check the daily timeframe (1D) for a bigger picture trend?
https://www.binance.com/download?utm_medium=screenshot
·
--
ブリッシュ
翻訳参照
Binance BNB is great Source of profit
{future}(BNBUSDT)
Binance BNB is great Source of profit
3
·
--
ブリッシュ
ここにイーサリアム(ETH)のライブ価格があります:
---
イーサリアムは「強気になった」のか? その要因は何か?
はい、イーサリアムは確かに強気の兆候を示しています—この力の背後にあるものを分解してみましょう:
1. 機関投資家の需要 & ETFの勢い
スタンダードチャータードは、2025年末までに$7,500の年末予測を上方修正し、主にイーサリアムで動くステーブルコインのブーム、業界の関与の増加、長期的な価格ドライバーを挙げています。銀行は2028年までに$25,000への道も見ています。
ブラックロックやフィデリティからの資金を含むスポットイーサリアムETFへの記録的な流入が強い買い圧力を生んでいます。
イーサリアムの最大の法人保有者の一つであるビットマイン・イマーシオン・テクノロジーズは、さらなるETHを蓄積するために資本提供を拡大しています—流通供給の最大5%まで。
2. サプライスクイーズ & オンチェーンメトリクス
特にバイナンスからのイーサリアムの引き出しは、取引所供給比率(ESR)をここ数週間で最低に押し下げており、価格の急騰を予期させる供給の圧迫を示しています。
3. テクニカルパターンが上昇の可能性を示唆
アナ
コインチェックアップは、ETHが11月までに$6,862、12月までに$7,475に達する可能性があると予測しています。
コインテレグラフは、過去の8月の急騰が年末に向けて60%の利益を示すことが多いと指摘しており、ETHが$7,000近くに押し上げられる可能性があります。
---
クイックサマリー表
要因 説明
機関フロー 大規模なETF流入と法人の蓄積(例:ビットマイン)が供給を引き締めています。
サプライ引き出し 取引所でのETHの減少は、長期保有と強気の設定を示しています。
テクニカルパターン ペナントとメガホンのブレイクアウトは$5K–$10K近くをターゲットにしており、$6Kは短期的な抵抗です。
予測 アナリストとモデルは年末までに$6Kから$7.5Kまでの範囲で、2028年までに$25Kを予測するものもあります。
---
次は何か?
$4,500を超える持続的なブレイクは、$5,000、$6,000、あるいはそれ以上の動きへの扉を開く可能性があります。
機関活動—ETF流入や国債購入のような—は、上向きの勢いを引き続き刺激する見込みです。
オンチェーンメトリクスと取引所の供給レベルを注意深く監視してください—それらは新たな強気サイクルの早期信号を提供するかもしれません。
ここにイーサリアム(ETH)のライブ価格があります:
---
イーサリアムは「強気になった」のか? その要因は何か?
はい、イーサリアムは確かに強気の兆候を示しています—この力の背後にあるものを分解してみましょう:
1. 機関投資家の需要 & ETFの勢い
スタンダードチャータードは、2025年末までに$7,500の年末予測を上方修正し、主にイーサリアムで動くステーブルコインのブーム、業界の関与の増加、長期的な価格ドライバーを挙げています。銀行は2028年までに$25,000への道も見ています。
ブラックロックやフィデリティからの資金を含むスポットイーサリアムETFへの記録的な流入が強い買い圧力を生んでいます。
イーサリアムの最大の法人保有者の一つであるビットマイン・イマーシオン・テクノロジーズは、さらなるETHを蓄積するために資本提供を拡大しています—流通供給の最大5%まで。
2. サプライスクイーズ & オンチェーンメトリクス
特にバイナンスからのイーサリアムの引き出しは、取引所供給比率(ESR)をここ数週間で最低に押し下げており、価格の急騰を予期させる供給の圧迫を示しています。
3. テクニカルパターンが上昇の可能性を示唆
アナ
コインチェックアップは、ETHが11月までに$6,862、12月までに$7,475に達する可能性があると予測しています。
コインテレグラフは、過去の8月の急騰が年末に向けて60%の利益を示すことが多いと指摘しており、ETHが$7,000近くに押し上げられる可能性があります。
---
クイックサマリー表
要因 説明
機関フロー 大規模なETF流入と法人の蓄積(例:ビットマイン)が供給を引き締めています。
サプライ引き出し 取引所でのETHの減少は、長期保有と強気の設定を示しています。
テクニカルパターン ペナントとメガホンのブレイクアウトは$5K–$10K近くをターゲットにしており、$6Kは短期的な抵抗です。
予測 アナリストとモデルは年末までに$6Kから$7.5Kまでの範囲で、2028年までに$25Kを予測するものもあります。
---
次は何か?
$4,500を超える持続的なブレイクは、$5,000、$6,000、あるいはそれ以上の動きへの扉を開く可能性があります。
機関活動—ETF流入や国債購入のような—は、上向きの勢いを引き続き刺激する見込みです。
オンチェーンメトリクスと取引所の供給レベルを注意深く監視してください—それらは新たな強気サイクルの早期信号を提供するかもしれません。
---
イーサリアムは「強気になった」のか? その要因は何か?
はい、イーサリアムは確かに強気の兆候を示しています—この力の背後にあるものを分解してみましょう:
1. 機関投資家の需要 & ETFの勢い
スタンダードチャータードは、2025年末までに$7,500の年末予測を上方修正し、主にイーサリアムで動くステーブルコインのブーム、業界の関与の増加、長期的な価格ドライバーを挙げています。銀行は2028年までに$25,000への道も見ています。
ブラックロックやフィデリティからの資金を含むスポットイーサリアムETFへの記録的な流入が強い買い圧力を生んでいます。
イーサリアムの最大の法人保有者の一つであるビットマイン・イマーシオン・テクノロジーズは、さらなるETHを蓄積するために資本提供を拡大しています—流通供給の最大5%まで。
2. サプライスクイーズ & オンチェーンメトリクス
特にバイナンスからのイーサリアムの引き出しは、取引所供給比率(ESR)をここ数週間で最低に押し下げており、価格の急騰を予期させる供給の圧迫を示しています。
3. テクニカルパターンが上昇の可能性を示唆
アナ
コインチェックアップは、ETHが11月までに$6,862、12月までに$7,475に達する可能性があると予測しています。
コインテレグラフは、過去の8月の急騰が年末に向けて60%の利益を示すことが多いと指摘しており、ETHが$7,000近くに押し上げられる可能性があります。
---
クイックサマリー表
要因 説明
機関フロー 大規模なETF流入と法人の蓄積(例:ビットマイン)が供給を引き締めています。
サプライ引き出し 取引所でのETHの減少は、長期保有と強気の設定を示しています。
テクニカルパターン ペナントとメガホンのブレイクアウトは$5K–$10K近くをターゲットにしており、$6Kは短期的な抵抗です。
予測 アナリストとモデルは年末までに$6Kから$7.5Kまでの範囲で、2028年までに$25Kを予測するものもあります。
---
次は何か?
$4,500を超える持続的なブレイクは、$5,000、$6,000、あるいはそれ以上の動きへの扉を開く可能性があります。
機関活動—ETF流入や国債購入のような—は、上向きの勢いを引き続き刺激する見込みです。
オンチェーンメトリクスと取引所の供給レベルを注意深く監視してください—それらは新たな強気サイクルの早期信号を提供するかもしれません。
208
·
--
翻訳参照
NVIDIA plays an indirect but very important role in the Bitcoin (BTC) and overall crypto ecosystem, mainly through its AI and GPU technologies. Let me break it down:
🔹 1. NVIDIA GPUs in Crypto Mining
In Bitcoin’s early days, NVIDIA GPUs were widely used for mining BTC because they are powerful in parallel processing.
Later, Bitcoin mining shifted mostly to ASICs (Application-Specific Integrated Circuits), which are more efficient.
However, NVIDIA GPUs are still heavily used in mining other cryptocurrencies (like Ethereum before its merge to Proof-of-Stake, and altcoins today).
🔹 2. AI + Crypto Market Analysis
NVIDIA’s AI chips (A100, H100, etc.) are used to train large AI models that analyze blockchain data.
Hedge funds and traders use NVIDIA-powered AI systems for:
Price prediction models
Market sentiment analysis (scanning social media/news)
High-frequency trading strategies
🔹 3. Blockchain Security & Fraud Detection
NVIDIA AI is applied in analyzing huge transaction datasets from Bitcoin and other blockchains.
AI helps detect fraudulent transactions, hacks, and money laundering patterns in crypto exchanges.
GPUs speed up this real-time detection.
🔹 4. AI-Powered Mining Optimization
AI algorithms running on NVIDIA GPUs optimize energy usage in mining farms.
This reduces electricity costs and improves mining efficiency, especially in Proof-of-Work coins.
🔹 5. Future: AI + Crypto Synergy
NVIDIA’s role in generative AI (like ChatGPT models) shows how AI and crypto may converge.
Possible future roles:
AI-driven decentralized finance (DeFi) bots
Crypto + AI supercomputing platforms
Tokenized access to GPU computing power
#BinanceHODLerDOLO #BTCWhalesMoveToETH
✅ In short:
NVIDIA doesn’t directly control or mine Bitcoin today, but its GPU & AI technologies power the infrastructure around crypto — from mining (in the past), AI trading bots, blockchain analytics, fraud detection, to future AI+crypto applications.
NVIDIA plays an indirect but very important role in the Bitcoin (BTC) and overall crypto ecosystem, mainly through its AI and GPU technologies. Let me break it down:
🔹 1. NVIDIA GPUs in Crypto Mining
In Bitcoin’s early days, NVIDIA GPUs were widely used for mining BTC because they are powerful in parallel processing.
Later, Bitcoin mining shifted mostly to ASICs (Application-Specific Integrated Circuits), which are more efficient.
However, NVIDIA GPUs are still heavily used in mining other cryptocurrencies (like Ethereum before its merge to Proof-of-Stake, and altcoins today).
🔹 2. AI + Crypto Market Analysis
NVIDIA’s AI chips (A100, H100, etc.) are used to train large AI models that analyze blockchain data.
Hedge funds and traders use NVIDIA-powered AI systems for:
Price prediction models
Market sentiment analysis (scanning social media/news)
High-frequency trading strategies
🔹 3. Blockchain Security & Fraud Detection
NVIDIA AI is applied in analyzing huge transaction datasets from Bitcoin and other blockchains.
AI helps detect fraudulent transactions, hacks, and money laundering patterns in crypto exchanges.
GPUs speed up this real-time detection.
🔹 4. AI-Powered Mining Optimization
AI algorithms running on NVIDIA GPUs optimize energy usage in mining farms.
This reduces electricity costs and improves mining efficiency, especially in Proof-of-Work coins.
🔹 5. Future: AI + Crypto Synergy
NVIDIA’s role in generative AI (like ChatGPT models) shows how AI and crypto may converge.
Possible future roles:
AI-driven decentralized finance (DeFi) bots
Crypto + AI supercomputing platforms
Tokenized access to GPU computing power
#BinanceHODLerDOLO #BTCWhalesMoveToETH
✅ In short:
NVIDIA doesn’t directly control or mine Bitcoin today, but its GPU & AI technologies power the infrastructure around crypto — from mining (in the past), AI trading bots, blockchain analytics, fraud detection, to future AI+crypto applications.
🔹 1. NVIDIA GPUs in Crypto Mining
In Bitcoin’s early days, NVIDIA GPUs were widely used for mining BTC because they are powerful in parallel processing.
Later, Bitcoin mining shifted mostly to ASICs (Application-Specific Integrated Circuits), which are more efficient.
However, NVIDIA GPUs are still heavily used in mining other cryptocurrencies (like Ethereum before its merge to Proof-of-Stake, and altcoins today).
🔹 2. AI + Crypto Market Analysis
NVIDIA’s AI chips (A100, H100, etc.) are used to train large AI models that analyze blockchain data.
Hedge funds and traders use NVIDIA-powered AI systems for:
Price prediction models
Market sentiment analysis (scanning social media/news)
High-frequency trading strategies
🔹 3. Blockchain Security & Fraud Detection
NVIDIA AI is applied in analyzing huge transaction datasets from Bitcoin and other blockchains.
AI helps detect fraudulent transactions, hacks, and money laundering patterns in crypto exchanges.
GPUs speed up this real-time detection.
🔹 4. AI-Powered Mining Optimization
AI algorithms running on NVIDIA GPUs optimize energy usage in mining farms.
This reduces electricity costs and improves mining efficiency, especially in Proof-of-Work coins.
🔹 5. Future: AI + Crypto Synergy
NVIDIA’s role in generative AI (like ChatGPT models) shows how AI and crypto may converge.
Possible future roles:
AI-driven decentralized finance (DeFi) bots
Crypto + AI supercomputing platforms
Tokenized access to GPU computing power
#BinanceHODLerDOLO #BTCWhalesMoveToETH
✅ In short:
NVIDIA doesn’t directly control or mine Bitcoin today, but its GPU & AI technologies power the infrastructure around crypto — from mining (in the past), AI trading bots, blockchain analytics, fraud detection, to future AI+crypto applications.
72
·
--
#OrderTypes101
わかりました!あなたは取引タイプ101について尋ねています - 主要な取引のタイプに関する初心者向けガイドです。
ここにシンプルな内訳があります:
📘 取引タイプ101:初心者のためのガイド
🏦 1. 株式取引
それは何か:企業の株(AppleやTeslaのような)を売買すること。
目標:安く買って、高く売る(またはその逆)。
タイプ:
デイトレード:同じ日に出入りする。
スイングトレード:数日/数週間保持する。
ポジショントレード:長期(数ヶ月または数年)。
スキャルピング:非常に迅速な取引、数秒から数分。
💱 2. 外国為替取引(Forex)
それは何か:一つの通貨を別の通貨と交換すること(例:USD/EUR)。
世界最大の市場。
高いレバレッジ、高いリスク。
経験豊富なトレーダーに人気。
🪙 3. 暗号通貨取引
それは何か:ビットコインやイーサリアムのようなデジタル通貨を買ったり売ったりすること。
変動性の高い市場 = 高いリスク/リターン。
24時間365日行うことができる。
📦 4. 商品取引
それは何か:金、石油、コーヒーのような原材料を取引すること。
通常は先物契約を通じて行われる。
世界的な出来事やサプライチェーンに影響される。
📊 5. オプション取引
それは何か:将来の特定の価格で株を買ったり売ったりする権利(義務ではない)を与える契約を取引すること。
ヘッジや投機に使用できる。
通常の株式取引よりも複雑でリスクが高い。
📈 6. 先物取引
それは何か:将来の特定の日に特定の価格で何かを買ったり売ったりすることに同意すること。
商品、指数、さらにはビットコインにも使用される。
高いレバレッジを持ち、プロフェッショナルによって使用される。
🏘 7. 不動産取引(フリッピング)
不動産を購入し、短期間保持し、利益のために売却する。
金融市場の一部ではないが、依然として取引タイプである。
🔍 初心者として学ぶべきこと:
リスク管理
テクニカル分析対ファンダメンタル分析
ブローカーのプラットフォームとツール
取引の心理
あなたにカスタムの初心者プランを作成して取引を始める手助けをしてほしいですか?あなたの興味(株、暗号、外国為替など)に基づいて、ステップ、ツール、リソースを案内できます。
#OrderTypes101
わかりました!あなたは取引タイプ101について尋ねています - 主要な取引のタイプに関する初心者向けガイドです。
ここにシンプルな内訳があります:
📘 取引タイプ101:初心者のためのガイド
🏦 1. 株式取引
それは何か:企業の株(AppleやTeslaのような)を売買すること。
目標:安く買って、高く売る(またはその逆)。
タイプ:
デイトレード:同じ日に出入りする。
スイングトレード:数日/数週間保持する。
ポジショントレード:長期(数ヶ月または数年)。
スキャルピング:非常に迅速な取引、数秒から数分。
💱 2. 外国為替取引(Forex)
それは何か:一つの通貨を別の通貨と交換すること(例:USD/EUR)。
世界最大の市場。
高いレバレッジ、高いリスク。
経験豊富なトレーダーに人気。
🪙 3. 暗号通貨取引
それは何か:ビットコインやイーサリアムのようなデジタル通貨を買ったり売ったりすること。
変動性の高い市場 = 高いリスク/リターン。
24時間365日行うことができる。
📦 4. 商品取引
それは何か:金、石油、コーヒーのような原材料を取引すること。
通常は先物契約を通じて行われる。
世界的な出来事やサプライチェーンに影響される。
📊 5. オプション取引
それは何か:将来の特定の価格で株を買ったり売ったりする権利(義務ではない)を与える契約を取引すること。
ヘッジや投機に使用できる。
通常の株式取引よりも複雑でリスクが高い。
📈 6. 先物取引
それは何か:将来の特定の日に特定の価格で何かを買ったり売ったりすることに同意すること。
商品、指数、さらにはビットコインにも使用される。
高いレバレッジを持ち、プロフェッショナルによって使用される。
🏘 7. 不動産取引(フリッピング)
不動産を購入し、短期間保持し、利益のために売却する。
金融市場の一部ではないが、依然として取引タイプである。
🔍 初心者として学ぶべきこと:
リスク管理
テクニカル分析対ファンダメンタル分析
ブローカーのプラットフォームとツール
取引の心理
あなたにカスタムの初心者プランを作成して取引を始める手助けをしてほしいですか?あなたの興味(株、暗号、外国為替など)に基づいて、ステップ、ツール、リソースを案内できます。
わかりました!あなたは取引タイプ101について尋ねています - 主要な取引のタイプに関する初心者向けガイドです。
ここにシンプルな内訳があります:
📘 取引タイプ101:初心者のためのガイド
🏦 1. 株式取引
それは何か:企業の株(AppleやTeslaのような)を売買すること。
目標:安く買って、高く売る(またはその逆)。
タイプ:
デイトレード:同じ日に出入りする。
スイングトレード:数日/数週間保持する。
ポジショントレード:長期(数ヶ月または数年)。
スキャルピング:非常に迅速な取引、数秒から数分。
💱 2. 外国為替取引(Forex)
それは何か:一つの通貨を別の通貨と交換すること(例:USD/EUR)。
世界最大の市場。
高いレバレッジ、高いリスク。
経験豊富なトレーダーに人気。
🪙 3. 暗号通貨取引
それは何か:ビットコインやイーサリアムのようなデジタル通貨を買ったり売ったりすること。
変動性の高い市場 = 高いリスク/リターン。
24時間365日行うことができる。
📦 4. 商品取引
それは何か:金、石油、コーヒーのような原材料を取引すること。
通常は先物契約を通じて行われる。
世界的な出来事やサプライチェーンに影響される。
📊 5. オプション取引
それは何か:将来の特定の価格で株を買ったり売ったりする権利(義務ではない)を与える契約を取引すること。
ヘッジや投機に使用できる。
通常の株式取引よりも複雑でリスクが高い。
📈 6. 先物取引
それは何か:将来の特定の日に特定の価格で何かを買ったり売ったりすることに同意すること。
商品、指数、さらにはビットコインにも使用される。
高いレバレッジを持ち、プロフェッショナルによって使用される。
🏘 7. 不動産取引(フリッピング)
不動産を購入し、短期間保持し、利益のために売却する。
金融市場の一部ではないが、依然として取引タイプである。
🔍 初心者として学ぶべきこと:
リスク管理
テクニカル分析対ファンダメンタル分析
ブローカーのプラットフォームとツール
取引の心理
あなたにカスタムの初心者プランを作成して取引を始める手助けをしてほしいですか?あなたの興味(株、暗号、外国為替など)に基づいて、ステップ、ツール、リソースを案内できます。
·
--
#PDA分析.
### Binance Coin (BNB)
Binance Coinは、現在正式に**Build'N'Build (BNB)**と呼ばれ、Binanceエコシステムのネイティブ暗号通貨です。以下は概要です:
- **起源**: 取引量で世界最大の暗号通貨取引所であるBinanceによって、2017年7月に初期コインオファリング(ICO)を通じて開始されました。
- **目的**: 当初はBinanceプラットフォームでの取引手数料の割引を提供するユーティリティトークンとして作成されましたが、その用途はBNBチェーンでの取引手数料の支払い、旅行予約、エンターテインメント、オンラインサービス、および金融アプリケーションを含むように拡大しました。
#PDA分析
.
### Binance Coin (BNB)
Binance Coinは、現在正式に**Build'N'Build (BNB)**と呼ばれ、Binanceエコシステムのネイティブ暗号通貨です。以下は概要です:
- **起源**: 取引量で世界最大の暗号通貨取引所であるBinanceによって、2017年7月に初期コインオファリング(ICO)を通じて開始されました。
- **目的**: 当初はBinanceプラットフォームでの取引手数料の割引を提供するユーティリティトークンとして作成されましたが、その用途はBNBチェーンでの取引手数料の支払い、旅行予約、エンターテインメント、オンラインサービス、および金融アプリケーションを含むように拡大しました。
### Binance Coin (BNB)
Binance Coinは、現在正式に**Build'N'Build (BNB)**と呼ばれ、Binanceエコシステムのネイティブ暗号通貨です。以下は概要です:
- **起源**: 取引量で世界最大の暗号通貨取引所であるBinanceによって、2017年7月に初期コインオファリング(ICO)を通じて開始されました。
- **目的**: 当初はBinanceプラットフォームでの取引手数料の割引を提供するユーティリティトークンとして作成されましたが、その用途はBNBチェーンでの取引手数料の支払い、旅行予約、エンターテインメント、オンラインサービス、および金融アプリケーションを含むように拡大しました。
190
·
--
$BTC
### ビットコインに注目: 2025年3月の話題の背景
2025年3月16日現在、ビットコイン(BTC)は金融界、ソーシャルメディアプラットフォーム、ニュースメディアでホットな話題です。世界の主要な暗号通貨は、その変動する価格動向、進化する規制環境、そして変わりゆく市場のセンチメントで波を起こしています。今、ビットコインに関するトレンドを深く掘り下げてみましょう。そして、なぜそれが世界的な注目を集め続けているのかを探ります。
#### ビットコインの価格のジェットコースター: 変動する市場
最近の数週間で、ビットコインの価格は安定したものとは言えません。今年の初めに史上最高値に達した後、BTCは大きな乱高下に直面し、約78,000ドルの数ヶ月間の安値に落ち込んだ後、わずかに反発しました。アナリストたちは、マクロ経済要因と暗号特有の発展の組み合わせが原因だと指摘しています。トランプ政権がカナダ、メキシコ、中国に課した新しい関税によって引き起こされた米国株式市場の売り逃げは、暗号市場にも波及し、数十億ドルの価値が消失しました。この高まった「リスクオフ」のセンチメントは、ビットコインの価格を狭い範囲内に制約し、$BTC の間で変動させています。
#### X上のセンチメント: 分裂したコミュニティ
X上の暗号コミュニティは、ビットコインの軌道に関する意見で盛り上がっています。一部のユーザーは、BTCに対するGoogleトレンドの関心が低下していることを、11月以降の公衆の関心が薄れている兆候として強調しています。
#### ビットコインの今後は?
3月が進むにつれ、いくつかの要因がビットコインの物語を形作る可能性があります。今後の米国のインフレ報告は、市場の不安を和らげるか、悪化させる可能性があり、ホワイトハウスの暗号サミットは戦略的準備金の範囲を明らかにすることを約束しています。技術的指標は、BTCが84,000ドルを超えられない場合、下落リスクに直面することを示唆しています。
現時点では、ビットコインはその価格だけでなく、急速に変化する金融環境における役割のためにトレンドの話題であり続けています。25万ドルの未来の約束であれ、7万ドルの暴落の脅威であれ、一つのことは明らかです: BTCの物語は終わりを迎えておらず、世界は注視しています。
{spot}(BTCUSDT)
$BTC
### ビットコインに注目: 2025年3月の話題の背景
2025年3月16日現在、ビットコイン(BTC)は金融界、ソーシャルメディアプラットフォーム、ニュースメディアでホットな話題です。世界の主要な暗号通貨は、その変動する価格動向、進化する規制環境、そして変わりゆく市場のセンチメントで波を起こしています。今、ビットコインに関するトレンドを深く掘り下げてみましょう。そして、なぜそれが世界的な注目を集め続けているのかを探ります。
#### ビットコインの価格のジェットコースター: 変動する市場
最近の数週間で、ビットコインの価格は安定したものとは言えません。今年の初めに史上最高値に達した後、BTCは大きな乱高下に直面し、約78,000ドルの数ヶ月間の安値に落ち込んだ後、わずかに反発しました。アナリストたちは、マクロ経済要因と暗号特有の発展の組み合わせが原因だと指摘しています。トランプ政権がカナダ、メキシコ、中国に課した新しい関税によって引き起こされた米国株式市場の売り逃げは、暗号市場にも波及し、数十億ドルの価値が消失しました。この高まった「リスクオフ」のセンチメントは、ビットコインの価格を狭い範囲内に制約し、$BTC の間で変動させています。
#### X上のセンチメント: 分裂したコミュニティ
X上の暗号コミュニティは、ビットコインの軌道に関する意見で盛り上がっています。一部のユーザーは、BTCに対するGoogleトレンドの関心が低下していることを、11月以降の公衆の関心が薄れている兆候として強調しています。
#### ビットコインの今後は?
3月が進むにつれ、いくつかの要因がビットコインの物語を形作る可能性があります。今後の米国のインフレ報告は、市場の不安を和らげるか、悪化させる可能性があり、ホワイトハウスの暗号サミットは戦略的準備金の範囲を明らかにすることを約束しています。技術的指標は、BTCが84,000ドルを超えられない場合、下落リスクに直面することを示唆しています。
現時点では、ビットコインはその価格だけでなく、急速に変化する金融環境における役割のためにトレンドの話題であり続けています。25万ドルの未来の約束であれ、7万ドルの暴落の脅威であれ、一つのことは明らかです: BTCの物語は終わりを迎えておらず、世界は注視しています。
### ビットコインに注目: 2025年3月の話題の背景
2025年3月16日現在、ビットコイン(BTC)は金融界、ソーシャルメディアプラットフォーム、ニュースメディアでホットな話題です。世界の主要な暗号通貨は、その変動する価格動向、進化する規制環境、そして変わりゆく市場のセンチメントで波を起こしています。今、ビットコインに関するトレンドを深く掘り下げてみましょう。そして、なぜそれが世界的な注目を集め続けているのかを探ります。
#### ビットコインの価格のジェットコースター: 変動する市場
最近の数週間で、ビットコインの価格は安定したものとは言えません。今年の初めに史上最高値に達した後、BTCは大きな乱高下に直面し、約78,000ドルの数ヶ月間の安値に落ち込んだ後、わずかに反発しました。アナリストたちは、マクロ経済要因と暗号特有の発展の組み合わせが原因だと指摘しています。トランプ政権がカナダ、メキシコ、中国に課した新しい関税によって引き起こされた米国株式市場の売り逃げは、暗号市場にも波及し、数十億ドルの価値が消失しました。この高まった「リスクオフ」のセンチメントは、ビットコインの価格を狭い範囲内に制約し、$BTC の間で変動させています。
#### X上のセンチメント: 分裂したコミュニティ
X上の暗号コミュニティは、ビットコインの軌道に関する意見で盛り上がっています。一部のユーザーは、BTCに対するGoogleトレンドの関心が低下していることを、11月以降の公衆の関心が薄れている兆候として強調しています。
#### ビットコインの今後は?
3月が進むにつれ、いくつかの要因がビットコインの物語を形作る可能性があります。今後の米国のインフレ報告は、市場の不安を和らげるか、悪化させる可能性があり、ホワイトハウスの暗号サミットは戦略的準備金の範囲を明らかにすることを約束しています。技術的指標は、BTCが84,000ドルを超えられない場合、下落リスクに直面することを示唆しています。
現時点では、ビットコインはその価格だけでなく、急速に変化する金融環境における役割のためにトレンドの話題であり続けています。25万ドルの未来の約束であれ、7万ドルの暴落の脅威であれ、一つのことは明らかです: BTCの物語は終わりを迎えておらず、世界は注視しています。
522
ログインして、さらにコンテンツを読む
厳選トピックで世界の暗号資産トレーダーの仲間入り
⚡️ 暗号資産に関する最新かつ有益な情報が見つかります。
💬 世界最大の暗号資産取引所から信頼されています。
👍 認証を受けたクリエイターから、有益なインサイトを得られます。
メール / 電話番号
トレンドトピック
FedRateWatch
閲覧回数 681,368
3,193人が討論中
トレンドハッシュタグキャンペーンで「シェア&ウィン」交通(トラフィック)報酬を獲得しよう
✨トピック:FOMC 9月、「次のFRBの一手」は?
👉参加方法:
ハッシュタグ #FedRateWatch を付けて短い投稿または記事を投稿してください
以下の観点に基づいてコンテンツを作成してください:
- 8月のコアCPIは前月比0.3%上昇し、今週の25bp利上げの確率は現在約90%です。今週、利上げはあると思いますか?それは一時的なものですか、それともより長い利上げサイクルの始まりでしょうか?
- 利上げが実施された場合、BTC、テック株、ゴールドはどのように動きますか?強気(ブル)か弱気(ベア)か?
- 次の取引はどう計画していますか?取引共有ウィジェットを使って、BTC、株、またはゴールドの取引/保有を共有してください。
⏰キャンペーン期間:
- 2026-09-15 11:00 - 2026-09-17 3:00 UTC
🎁報酬:
- 上記のガイドラインを満たし、かつ100語を超える適格な投稿は審査され、抽選で500〜3,000ビューのランダムなトラフィック増加が付与される場合があります。投稿が選ばれた場合、フィードの事務局から通知が届きます。
- 記事がBinance Square Officialで特集されるチャンス
投稿のアイデアが必要ですか?トピックページ #FedRateWatch へアクセスするか、 Square Guide on How to Post for Better Reach をご覧ください。
Binance Square Official
·いいね:419件
·閲覧回数 947.2k
EthereumFallsBelow$2400
閲覧回数 850
33人が討論中
USSenateBlocksClarityAct
閲覧回数 3,282
145人が討論中