

Jimmy Jackson
3.8k 投稿

Jimmy Jackson
報告
ユーザーをブロック
I am content writer
取引を発注
高頻度トレーダー
1.5年
136 フォロー
1.3K+ フォロワー
8.2K+ いいね
投稿
ポートフォリオ
すべて
引用
ライブ
記事
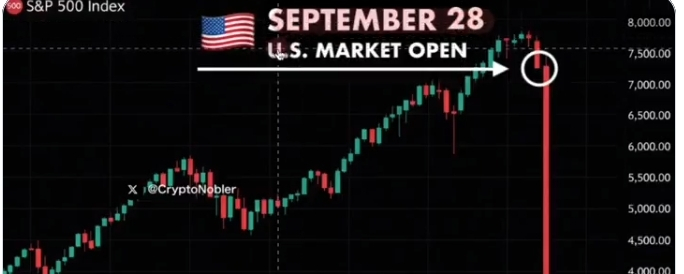
🚨 ご注意:明日は2026年で最も厳しい相場日になる可能性があります🚨 ご注意:明日は2026年で最も厳しい相場日になる可能性があります
9月28日(月)の前にこれを読んでください。
ほとんどの人が、待ち伏せを食らうようにして痛い目を見ることになります。正直なところ、警告サインはすでに私たちに向かって叫んでいます。
世界経済で何かが壊れたんだ——そして、それが今夜のうちにすぐ修復されるわけではありません。今、株式、暗号資産、不動産、または債券を保有しているなら、月曜の朝の始業ベルが鳴る前に、何が起きているのかを理解する必要があります。
これは単なるリストラ(調整)ではありません。まったく別のものです。
🚨 ご注意:明日は2026年で最も厳しい相場日になる可能性があります
🚨 ご注意:明日は2026年で最も厳しい相場日になる可能性があります
9月28日(月)の前にこれを読んでください。
ほとんどの人が、待ち伏せを食らうようにして痛い目を見ることになります。正直なところ、警告サインはすでに私たちに向かって叫んでいます。
世界経済で何かが壊れたんだ——そして、それが今夜のうちにすぐ修復されるわけではありません。今、株式、暗号資産、不動産、または債券を保有しているなら、月曜の朝の始業ベルが鳴る前に、何が起きているのかを理解する必要があります。
これは単なるリストラ(調整)ではありません。まったく別のものです。
9月28日(月)の前にこれを読んでください。
ほとんどの人が、待ち伏せを食らうようにして痛い目を見ることになります。正直なところ、警告サインはすでに私たちに向かって叫んでいます。
世界経済で何かが壊れたんだ——そして、それが今夜のうちにすぐ修復されるわけではありません。今、株式、暗号資産、不動産、または債券を保有しているなら、月曜の朝の始業ベルが鳴る前に、何が起きているのかを理解する必要があります。
これは単なるリストラ(調整)ではありません。まったく別のものです。
1
70
WIN/USDT 市場分析:強気が戻ってきた!🚀
$WIN
{spot}(WINUSDT)
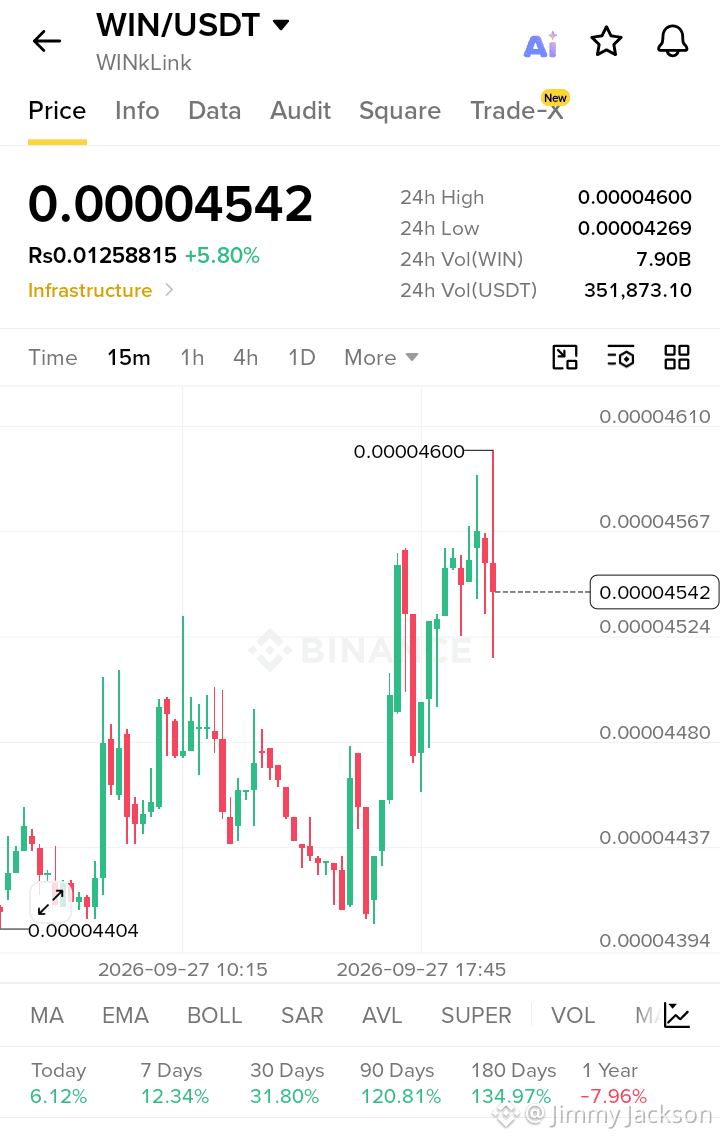
WINkLink(WIN)は本日チャートが熱くなっており、現在 0.00004542 で取引されていて、堅調な +5.80% の上昇を記録しています。長い統合(レンジ)フェーズを経た後、値動きは市場のダイナミクスに大きな変化が起きたことを示唆しています。ここでは、なぜ WIN が急騰しているのかを深掘りします。
1. オンチェーン&ETFのダイナミクス
スポットETFのフローは通常メジャー銘柄を狙いますが、その波及効果は現実のものです。ビットコインやイーサリアムの流動性が増えると、WIN のようなインフラ系アルトコインにも資金が波及することがあります。オンチェーンデータでは、直近の 0.00004404 付近でクジラ(大口)が集めていることが示されており、スマートマネーがこのブレイクアウトに備えてポジションを取っていた可能性があります。24時間の出来高 7.90B WIN も、再び関心が高まっていることを裏付けています。
2. テクニカル・ブレイクアウト&重要水準
15分足チャートでは、直近の下落トレンドからのはっきりした強気ブレイクアウトが見て取れます。
· 抵抗線:目先のハードルは 24h高値の 0.00004600。これをきれいに上抜けると、0.00004800 へ向けた上昇が引き金になるかもしれません。
· サポート:強いサポートは 0.00004400 に形成されています。この水準より上を価格が維持している限り、強気の構造は保たれます。
3. デリバティブ&ショートの清算
0.00004400 から 0.00004600 への急激なスパイクは、ショートスクイーズ(踏み上げ)を引き起こした可能性が高いです。トレンドに逆らって賭けていたトレーダーは買い戻しを迫られ、火に油を注ぐ形になりました。ファンディングレートが調整される中で、ショートが清算されることで、今後もボラティリティが続くかもしれません。
主要ターゲット
· 直近:0.00004600
· 次の目標:0.00004850
· サポート:0.00004400
モメンタムが変わりつつあります。次の上昇局面を確認するために、出来高に注目してください!
いいね・フォロー・シェアをお忘れなく!🩸 どうもありがとうございます ❤️
#BitwiseFilesFinalNEARSpotETFProspectus #DogecoinETFsPostBiggestWeekSinceLaunch #StrategyStriveAdd2305BitcoinThisWeek
WIN/USDT 市場分析:強気が戻ってきた!🚀
$WIN
WINkLink(WIN)は本日チャートが熱くなっており、現在 0.00004542 で取引されていて、堅調な +5.80% の上昇を記録しています。長い統合(レンジ)フェーズを経た後、値動きは市場のダイナミクスに大きな変化が起きたことを示唆しています。ここでは、なぜ WIN が急騰しているのかを深掘りします。
1. オンチェーン&ETFのダイナミクス
スポットETFのフローは通常メジャー銘柄を狙いますが、その波及効果は現実のものです。ビットコインやイーサリアムの流動性が増えると、WIN のようなインフラ系アルトコインにも資金が波及することがあります。オンチェーンデータでは、直近の 0.00004404 付近でクジラ(大口)が集めていることが示されており、スマートマネーがこのブレイクアウトに備えてポジションを取っていた可能性があります。24時間の出来高 7.90B WIN も、再び関心が高まっていることを裏付けています。
2. テクニカル・ブレイクアウト&重要水準
15分足チャートでは、直近の下落トレンドからのはっきりした強気ブレイクアウトが見て取れます。
· 抵抗線:目先のハードルは 24h高値の 0.00004600。これをきれいに上抜けると、0.00004800 へ向けた上昇が引き金になるかもしれません。
· サポート:強いサポートは 0.00004400 に形成されています。この水準より上を価格が維持している限り、強気の構造は保たれます。
3. デリバティブ&ショートの清算
0.00004400 から 0.00004600 への急激なスパイクは、ショートスクイーズ(踏み上げ)を引き起こした可能性が高いです。トレンドに逆らって賭けていたトレーダーは買い戻しを迫られ、火に油を注ぐ形になりました。ファンディングレートが調整される中で、ショートが清算されることで、今後もボラティリティが続くかもしれません。
主要ターゲット
· 直近:0.00004600
· 次の目標:0.00004850
· サポート:0.00004400
モメンタムが変わりつつあります。次の上昇局面を確認するために、出来高に注目してください!
いいね・フォロー・シェアをお忘れなく!🩸 どうもありがとうございます ❤️
#BitwiseFilesFinalNEARSpotETFProspectus #DogecoinETFsPostBiggestWeekSinceLaunch #StrategyStriveAdd2305BitcoinThisWeek
$WIN
WINkLink(WIN)は本日チャートが熱くなっており、現在 0.00004542 で取引されていて、堅調な +5.80% の上昇を記録しています。長い統合(レンジ)フェーズを経た後、値動きは市場のダイナミクスに大きな変化が起きたことを示唆しています。ここでは、なぜ WIN が急騰しているのかを深掘りします。
1. オンチェーン&ETFのダイナミクス
スポットETFのフローは通常メジャー銘柄を狙いますが、その波及効果は現実のものです。ビットコインやイーサリアムの流動性が増えると、WIN のようなインフラ系アルトコインにも資金が波及することがあります。オンチェーンデータでは、直近の 0.00004404 付近でクジラ(大口)が集めていることが示されており、スマートマネーがこのブレイクアウトに備えてポジションを取っていた可能性があります。24時間の出来高 7.90B WIN も、再び関心が高まっていることを裏付けています。
2. テクニカル・ブレイクアウト&重要水準
15分足チャートでは、直近の下落トレンドからのはっきりした強気ブレイクアウトが見て取れます。
· 抵抗線:目先のハードルは 24h高値の 0.00004600。これをきれいに上抜けると、0.00004800 へ向けた上昇が引き金になるかもしれません。
· サポート:強いサポートは 0.00004400 に形成されています。この水準より上を価格が維持している限り、強気の構造は保たれます。
3. デリバティブ&ショートの清算
0.00004400 から 0.00004600 への急激なスパイクは、ショートスクイーズ(踏み上げ)を引き起こした可能性が高いです。トレンドに逆らって賭けていたトレーダーは買い戻しを迫られ、火に油を注ぐ形になりました。ファンディングレートが調整される中で、ショートが清算されることで、今後もボラティリティが続くかもしれません。
主要ターゲット
· 直近:0.00004600
· 次の目標:0.00004850
· サポート:0.00004400
モメンタムが変わりつつあります。次の上昇局面を確認するために、出来高に注目してください!
いいね・フォロー・シェアをお忘れなく!🩸 どうもありがとうございます ❤️
#BitwiseFilesFinalNEARSpotETFProspectus #DogecoinETFsPostBiggestWeekSinceLaunch #StrategyStriveAdd2305BitcoinThisWeek
98
🚀 GRAM/USDT 市場分析:強気派が戻ってきた!
$GRAM
{spot}(GRAMUSDT)
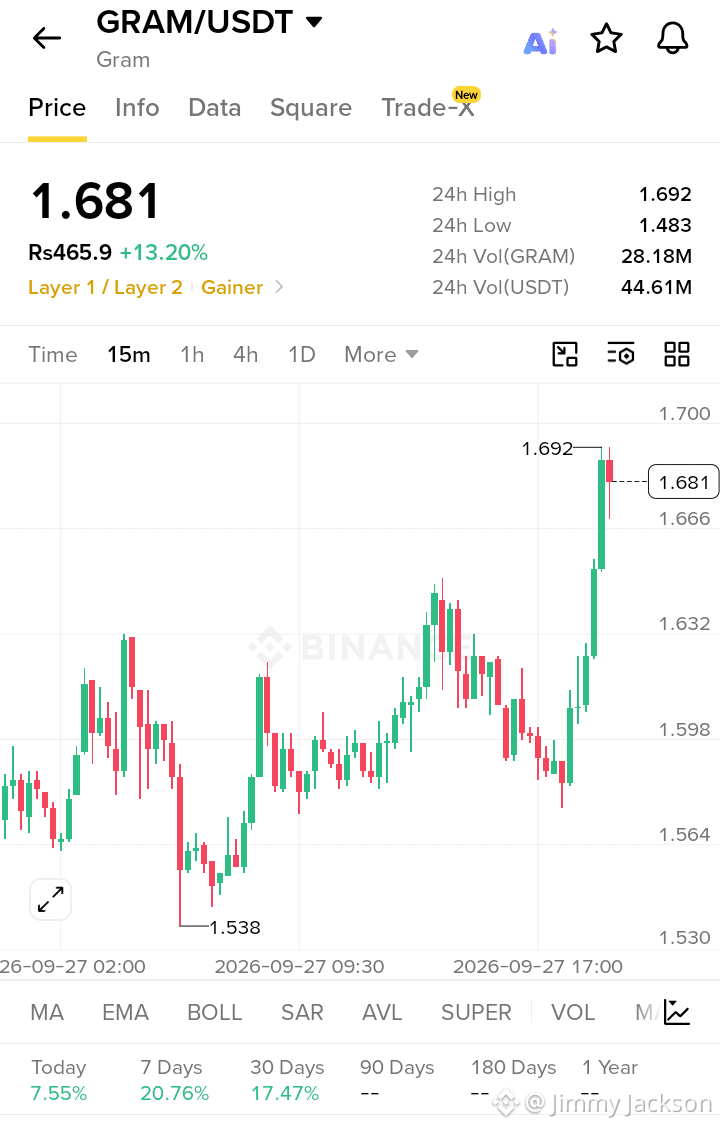
本日、GRAMが大幅な+13.20%の急騰で注目をさらっており、現在1.681 USDTで取引されています。いったん値固めした後、重要なレジスタンスを一気に突破しました。では、この上昇が起きている理由と、次に注目すべき点を深掘りします。
1. オンチェーン&機関投資家の勢い
大型ウォレットが過去48時間でGRAMを積極的に買い集めています。オンチェーンデータでは、取引所からの大きな資金流出が示唆されており、供給ショックを感じさせます。さらに、レイヤー1/2のETF商品への資金流入が再び活発化し、セクターのセンチメントを押し上げ、このブレイクアウトに必要な流動性を提供している可能性があります。
2. テクニカル・ブレイクアウト&重要水準
チャートは教科書的な強気ブレイクアウトを示しています。1.538でしっかりした下値を見つけた後、GRAMは先のレジスタンス1.632を叩き割りました。
· 重要レジスタンス:目先の壁は24時間高値1.692です。ここを明確に上抜けできれば、心理的節目である1.75近辺へ向かう可能性があります。
· 重要サポート:以前のレジスタンス1.632が、いまや堅いサポートとして機能しています。この水準を上回って価格が推移する限り、トレンドは強気のままです。
3. デリバティブ&ショートの清算
デリバティブ市場が火に油を注いでいます。巨大な出来高の急増(24時間で44.61M USDT)は活発な取引を示しています。急激な縦方向の値動きによりショート清算が連鎖的に発生し、弱気のトレーダーが買い戻しを強いられました。これがさらに価格に「ロケット燃料」を追加しています。
🎯 注目のターゲット
· 強気ターゲット:1.75 - 1.80
· 無効化条件:1.60を下回る日足終値
いいね、フォロー、そしてシェアをお忘れなく!🩸 どうもありがとうございます ❤️
#BitwiseFilesFinalNEARSpotETFProspectus #DogecoinETFsPostBiggestWeekSinceLaunch #StrategyStriveAdd2305BitcoinThisWeek #TrumpRejectsIranHormuzReopening
🚀 GRAM/USDT 市場分析:強気派が戻ってきた!
$GRAM
本日、GRAMが大幅な+13.20%の急騰で注目をさらっており、現在1.681 USDTで取引されています。いったん値固めした後、重要なレジスタンスを一気に突破しました。では、この上昇が起きている理由と、次に注目すべき点を深掘りします。
1. オンチェーン&機関投資家の勢い
大型ウォレットが過去48時間でGRAMを積極的に買い集めています。オンチェーンデータでは、取引所からの大きな資金流出が示唆されており、供給ショックを感じさせます。さらに、レイヤー1/2のETF商品への資金流入が再び活発化し、セクターのセンチメントを押し上げ、このブレイクアウトに必要な流動性を提供している可能性があります。
2. テクニカル・ブレイクアウト&重要水準
チャートは教科書的な強気ブレイクアウトを示しています。1.538でしっかりした下値を見つけた後、GRAMは先のレジスタンス1.632を叩き割りました。
· 重要レジスタンス:目先の壁は24時間高値1.692です。ここを明確に上抜けできれば、心理的節目である1.75近辺へ向かう可能性があります。
· 重要サポート:以前のレジスタンス1.632が、いまや堅いサポートとして機能しています。この水準を上回って価格が推移する限り、トレンドは強気のままです。
3. デリバティブ&ショートの清算
デリバティブ市場が火に油を注いでいます。巨大な出来高の急増(24時間で44.61M USDT)は活発な取引を示しています。急激な縦方向の値動きによりショート清算が連鎖的に発生し、弱気のトレーダーが買い戻しを強いられました。これがさらに価格に「ロケット燃料」を追加しています。
🎯 注目のターゲット
· 強気ターゲット:1.75 - 1.80
· 無効化条件:1.60を下回る日足終値
いいね、フォロー、そしてシェアをお忘れなく!🩸 どうもありがとうございます ❤️
#BitwiseFilesFinalNEARSpotETFProspectus #DogecoinETFsPostBiggestWeekSinceLaunch #StrategyStriveAdd2305BitcoinThisWeek #TrumpRejectsIranHormuzReopening
$GRAM
本日、GRAMが大幅な+13.20%の急騰で注目をさらっており、現在1.681 USDTで取引されています。いったん値固めした後、重要なレジスタンスを一気に突破しました。では、この上昇が起きている理由と、次に注目すべき点を深掘りします。
1. オンチェーン&機関投資家の勢い
大型ウォレットが過去48時間でGRAMを積極的に買い集めています。オンチェーンデータでは、取引所からの大きな資金流出が示唆されており、供給ショックを感じさせます。さらに、レイヤー1/2のETF商品への資金流入が再び活発化し、セクターのセンチメントを押し上げ、このブレイクアウトに必要な流動性を提供している可能性があります。
2. テクニカル・ブレイクアウト&重要水準
チャートは教科書的な強気ブレイクアウトを示しています。1.538でしっかりした下値を見つけた後、GRAMは先のレジスタンス1.632を叩き割りました。
· 重要レジスタンス:目先の壁は24時間高値1.692です。ここを明確に上抜けできれば、心理的節目である1.75近辺へ向かう可能性があります。
· 重要サポート:以前のレジスタンス1.632が、いまや堅いサポートとして機能しています。この水準を上回って価格が推移する限り、トレンドは強気のままです。
3. デリバティブ&ショートの清算
デリバティブ市場が火に油を注いでいます。巨大な出来高の急増(24時間で44.61M USDT)は活発な取引を示しています。急激な縦方向の値動きによりショート清算が連鎖的に発生し、弱気のトレーダーが買い戻しを強いられました。これがさらに価格に「ロケット燃料」を追加しています。
🎯 注目のターゲット
· 強気ターゲット:1.75 - 1.80
· 無効化条件:1.60を下回る日足終値
いいね、フォロー、そしてシェアをお忘れなく!🩸 どうもありがとうございます ❤️
#BitwiseFilesFinalNEARSpotETFProspectus #DogecoinETFsPostBiggestWeekSinceLaunch #StrategyStriveAdd2305BitcoinThisWeek #TrumpRejectsIranHormuzReopening
167
$GRASS
{future}(GRASSUSDT)
モメンタムが加速する中、上昇が+15%——その理由
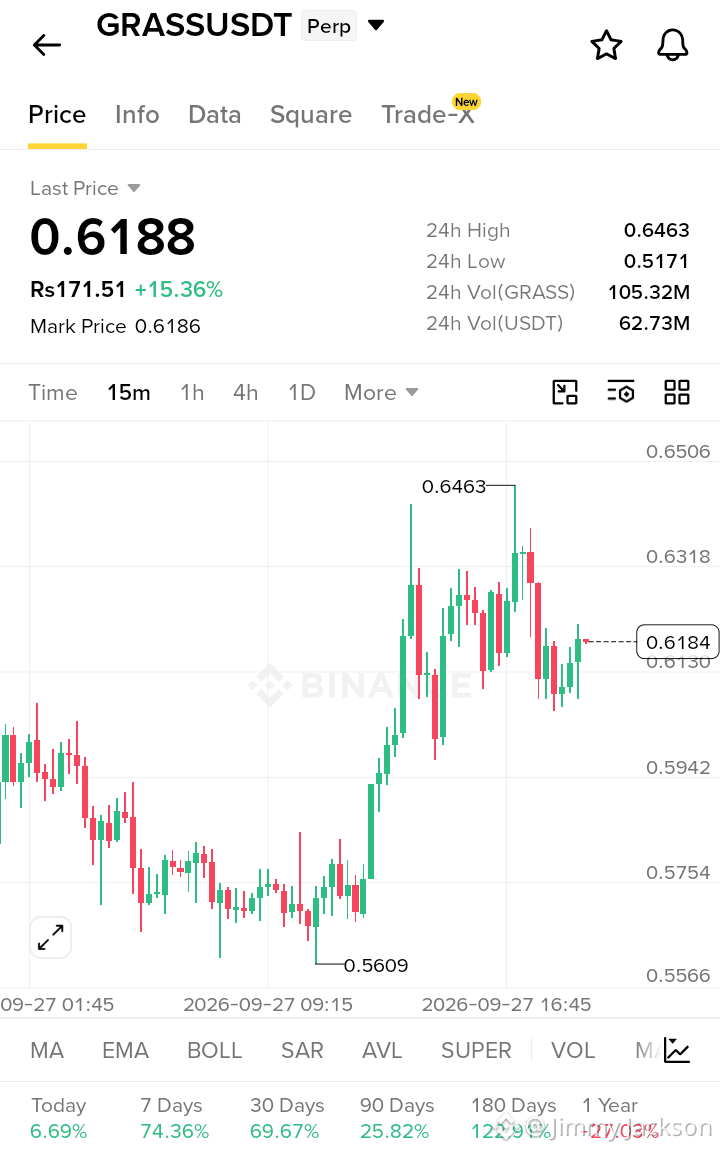
$GRASS は0.6188で取引されており、主要水準を取り戻した後に高値0.6463を付け、過去24時間で+15.36%上昇しています。週次では+70%近い強い上昇が、市場構造の明確な転換を示しています。
1. オンチェーンのクジラデータ&機関のフロー
スマートマネーや大口ウォレットは、直近のセッションで純増(ネットの積み増し)パターンが見られ、スポットの資金流入がリバウンドを支えています。
ネットワークのファンダメンタルは依然として堅調です。月間アクティブノードは850万、そして収益も強い(2026年上期はすでに2025年通期水準に一致しており、通期ガイダンスは$65〜75M)。
今年の前半にCoinbaseでスポット上場がありアクセスが拡大しました。現在はAI/DePINのストーリーへのローテーションが需要を一段と押し上げています。現時点では主要なETF商品はまだありませんが、機関投資家の注目度は継続して高まっています。
2. テクニカルなブレイクアウト水準&重要なサポート/レジスタンス
価格が、0.56近辺の直前のレンジ(統合)ゾーンを決定的に上抜け、4H/1Dチャートで強気の構造が確認されました。
主要レジスタンス:0.6463(本日の高値)→ 0.65〜0.70ゾーン。
主要サポート:0.58〜0.60(直近)、その次に0.56と0.517。
0.60を上回って維持できれば、より高い目標に向けた道が開けます。出来高の拡大は確信(コンビクション)を裏付けています。
3. デリバティブのショート・リクイデーション
無期限先物の建玉(オープン・インタレスト)は高水準のまま(取引所合計で約$110M+)で、24時間の出来高も強い状態です。
急な上方向への動きがショートの清算(リクイデーション)を引き起こし、強制ロスカットによる買い圧力が加わることで、典型的なショートスクイーズを生み出しています。
ファンディングはプラスを維持しており、まだ極端な過密(オーバークラウディング)にはなっていないものの、ロング偏重が持続していることを示しています。
主なターゲット:
0.65(短期)→ 0.70(上振れの延長)。モメンタムが維持されるなら。
強気バイアスを保つため、0.58が重要なサポートとして注目ポイントです。
$GRASS は、しっかりしたDePINのファンダメンタルと、クリーンなテクニカルブレイク、そしてデリバティブの燃料を組み合わせています。ボラティリティは高いままです——それに応じてリスク管理を行ってください。
いいね、フォロー、そしてシェアを忘れないでください! 🩸 どうもありがとうございます ❤️
#BitwiseFilesFinalNEARSpotETFProspectus #DogecoinETFsPostBiggestWeekSinceLaunch #StrategyStriveAdd2305BitcoinThisWeek #CircleTetherFreezeBitgetHackerWallet
$GRASS
モメンタムが加速する中、上昇が+15%——その理由
$GRASS は0.6188で取引されており、主要水準を取り戻した後に高値0.6463を付け、過去24時間で+15.36%上昇しています。週次では+70%近い強い上昇が、市場構造の明確な転換を示しています。
1. オンチェーンのクジラデータ&機関のフロー
スマートマネーや大口ウォレットは、直近のセッションで純増(ネットの積み増し)パターンが見られ、スポットの資金流入がリバウンドを支えています。
ネットワークのファンダメンタルは依然として堅調です。月間アクティブノードは850万、そして収益も強い(2026年上期はすでに2025年通期水準に一致しており、通期ガイダンスは$65〜75M)。
今年の前半にCoinbaseでスポット上場がありアクセスが拡大しました。現在はAI/DePINのストーリーへのローテーションが需要を一段と押し上げています。現時点では主要なETF商品はまだありませんが、機関投資家の注目度は継続して高まっています。
2. テクニカルなブレイクアウト水準&重要なサポート/レジスタンス
価格が、0.56近辺の直前のレンジ(統合)ゾーンを決定的に上抜け、4H/1Dチャートで強気の構造が確認されました。
主要レジスタンス:0.6463(本日の高値)→ 0.65〜0.70ゾーン。
主要サポート:0.58〜0.60(直近)、その次に0.56と0.517。
0.60を上回って維持できれば、より高い目標に向けた道が開けます。出来高の拡大は確信(コンビクション)を裏付けています。
3. デリバティブのショート・リクイデーション
無期限先物の建玉(オープン・インタレスト)は高水準のまま(取引所合計で約$110M+)で、24時間の出来高も強い状態です。
急な上方向への動きがショートの清算(リクイデーション)を引き起こし、強制ロスカットによる買い圧力が加わることで、典型的なショートスクイーズを生み出しています。
ファンディングはプラスを維持しており、まだ極端な過密(オーバークラウディング)にはなっていないものの、ロング偏重が持続していることを示しています。
主なターゲット:
0.65(短期)→ 0.70(上振れの延長)。モメンタムが維持されるなら。
強気バイアスを保つため、0.58が重要なサポートとして注目ポイントです。
$GRASS は、しっかりしたDePINのファンダメンタルと、クリーンなテクニカルブレイク、そしてデリバティブの燃料を組み合わせています。ボラティリティは高いままです——それに応じてリスク管理を行ってください。
いいね、フォロー、そしてシェアを忘れないでください! 🩸 どうもありがとうございます ❤️
#BitwiseFilesFinalNEARSpotETFProspectus #DogecoinETFsPostBiggestWeekSinceLaunch #StrategyStriveAdd2305BitcoinThisWeek #CircleTetherFreezeBitgetHackerWallet
モメンタムが加速する中、上昇が+15%——その理由
$GRASS は0.6188で取引されており、主要水準を取り戻した後に高値0.6463を付け、過去24時間で+15.36%上昇しています。週次では+70%近い強い上昇が、市場構造の明確な転換を示しています。
1. オンチェーンのクジラデータ&機関のフロー
スマートマネーや大口ウォレットは、直近のセッションで純増(ネットの積み増し)パターンが見られ、スポットの資金流入がリバウンドを支えています。
ネットワークのファンダメンタルは依然として堅調です。月間アクティブノードは850万、そして収益も強い(2026年上期はすでに2025年通期水準に一致しており、通期ガイダンスは$65〜75M)。
今年の前半にCoinbaseでスポット上場がありアクセスが拡大しました。現在はAI/DePINのストーリーへのローテーションが需要を一段と押し上げています。現時点では主要なETF商品はまだありませんが、機関投資家の注目度は継続して高まっています。
2. テクニカルなブレイクアウト水準&重要なサポート/レジスタンス
価格が、0.56近辺の直前のレンジ(統合)ゾーンを決定的に上抜け、4H/1Dチャートで強気の構造が確認されました。
主要レジスタンス:0.6463(本日の高値)→ 0.65〜0.70ゾーン。
主要サポート:0.58〜0.60(直近)、その次に0.56と0.517。
0.60を上回って維持できれば、より高い目標に向けた道が開けます。出来高の拡大は確信(コンビクション)を裏付けています。
3. デリバティブのショート・リクイデーション
無期限先物の建玉(オープン・インタレスト)は高水準のまま(取引所合計で約$110M+)で、24時間の出来高も強い状態です。
急な上方向への動きがショートの清算(リクイデーション)を引き起こし、強制ロスカットによる買い圧力が加わることで、典型的なショートスクイーズを生み出しています。
ファンディングはプラスを維持しており、まだ極端な過密(オーバークラウディング)にはなっていないものの、ロング偏重が持続していることを示しています。
主なターゲット:
0.65(短期)→ 0.70(上振れの延長)。モメンタムが維持されるなら。
強気バイアスを保つため、0.58が重要なサポートとして注目ポイントです。
$GRASS は、しっかりしたDePINのファンダメンタルと、クリーンなテクニカルブレイク、そしてデリバティブの燃料を組み合わせています。ボラティリティは高いままです——それに応じてリスク管理を行ってください。
いいね、フォロー、そしてシェアを忘れないでください! 🩸 どうもありがとうございます ❤️
#BitwiseFilesFinalNEARSpotETFProspectus #DogecoinETFsPostBiggestWeekSinceLaunch #StrategyStriveAdd2305BitcoinThisWeek #CircleTetherFreezeBitgetHackerWallet
141
$QNT
{spot}(QNTUSDT)
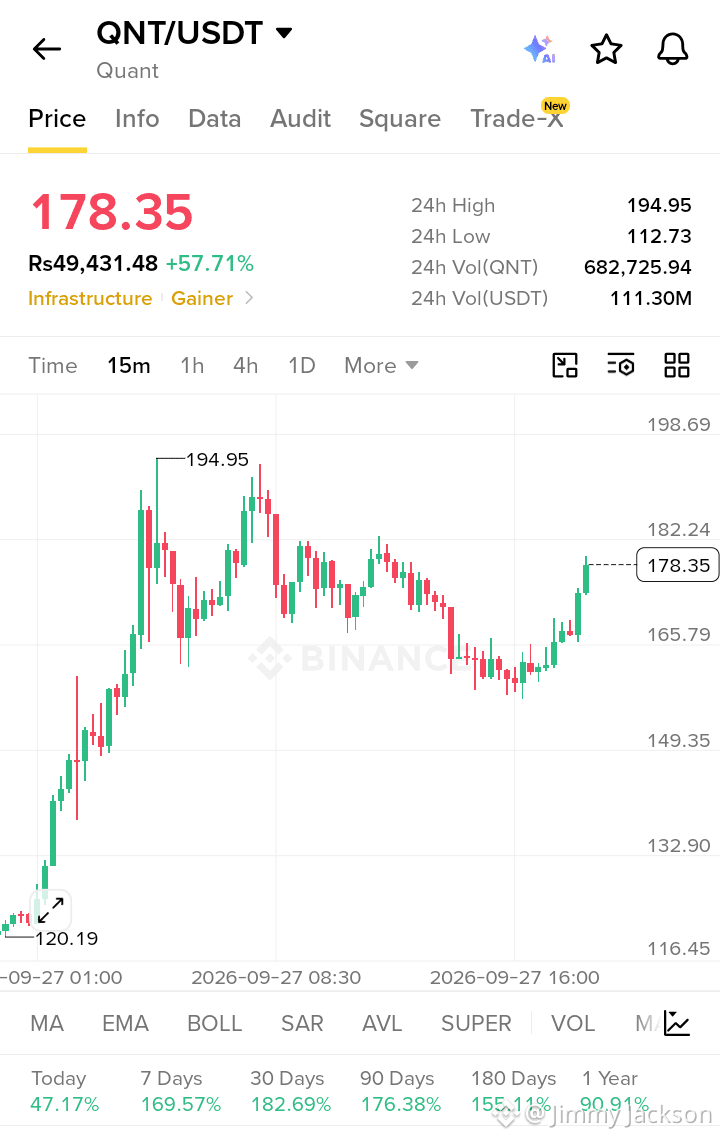
QNT/USDTが急騰!次の目標は$200か? 🚀
Quant(QNT)は現在、+57.71%という大幅な上昇でチャートを圧倒し、$178.35で取引されています。これは単なる偶然の急騰ではありません。強いファンダメンタルズと、激しいテクニカル・ブレイクアウトが重なった結果です。では、QNTがなぜ爆発的に伸びているのかを深掘りしていきましょう:
1. クジラの蓄積(Whale Accumulation)& ETFストーリー 🐋
機関投資家の関心が再び強まっています。オンチェーンデータでは、大口ウォレットが、相互運用性の需要増加を見越してQNTを大量に買い集めていることが示されています。直近のスポット・ビットコインETF承認は、ユーティリティが強いアルトコインに対して「流動性半減(halving of liquidity)」という物語を引き起こしました。Quantの独自のOverledger技術は、トークン化された現実世界資産(RWA)で有力な候補として位置づけられており、スマートマネーの流入を後押ししています。
2. テクニカル・ブレイクアウト & 重要水準 📈
チャートは教科書的な放物線状の動きです。$120のサポート・ゾーン付近でしばらく固めた後、QNTは複数のレジスタンスを突破しました。
· 直近のレジスタンス:24時間高値の$194.95。この水準をきれいに上抜けると、心理的節目の$200に向けて素早い値動きが起きる可能性があります。
· 重要サポート:以前のレジスタンスだった$165がサポートに転換。価格がこの水準より上で推移している限り、強気の構造は維持されます。7日間のパフォーマンス(+169%)が、強いトレンド転換を裏付けています。
3. ショートスクイーズのダイナミクス 🔥
大量の緑のローソク足は、深刻なショートスクイーズを示しています。24時間の出来高が111M USDTを超える中、弱気勢(ベア)が一斉に清算されています。価格が$150を超えるとストップロスが発動し、ショート勢が買い戻しを強いられて、上昇ラリーに追い風(ロケット燃料)を加えました。
🎯 目標水準
· 上昇目標:$195 → $215 → $250
· 下方向のサポート:$165 → $142
勢いは非常に強いですが、常にリスク管理を忘れずに。健康的な再エントリーのために、$165の再テストに注目しましょう。
いいね・フォロー・シェアをお忘れなく! 🩸 どうもありがとうございます ❤️
#BitwiseFilesFinalNEARSpotETFProspectus #DogecoinETFsPostBiggestWeekSinceLaunch #StrategyStriveAdd2305BitcoinThisWeek #TrumpRejectsIranHormuzReopening
$QNT
QNT/USDTが急騰!次の目標は$200か? 🚀
Quant(QNT)は現在、+57.71%という大幅な上昇でチャートを圧倒し、$178.35で取引されています。これは単なる偶然の急騰ではありません。強いファンダメンタルズと、激しいテクニカル・ブレイクアウトが重なった結果です。では、QNTがなぜ爆発的に伸びているのかを深掘りしていきましょう:
1. クジラの蓄積(Whale Accumulation)& ETFストーリー 🐋
機関投資家の関心が再び強まっています。オンチェーンデータでは、大口ウォレットが、相互運用性の需要増加を見越してQNTを大量に買い集めていることが示されています。直近のスポット・ビットコインETF承認は、ユーティリティが強いアルトコインに対して「流動性半減(halving of liquidity)」という物語を引き起こしました。Quantの独自のOverledger技術は、トークン化された現実世界資産(RWA)で有力な候補として位置づけられており、スマートマネーの流入を後押ししています。
2. テクニカル・ブレイクアウト & 重要水準 📈
チャートは教科書的な放物線状の動きです。$120のサポート・ゾーン付近でしばらく固めた後、QNTは複数のレジスタンスを突破しました。
· 直近のレジスタンス:24時間高値の$194.95。この水準をきれいに上抜けると、心理的節目の$200に向けて素早い値動きが起きる可能性があります。
· 重要サポート:以前のレジスタンスだった$165がサポートに転換。価格がこの水準より上で推移している限り、強気の構造は維持されます。7日間のパフォーマンス(+169%)が、強いトレンド転換を裏付けています。
3. ショートスクイーズのダイナミクス 🔥
大量の緑のローソク足は、深刻なショートスクイーズを示しています。24時間の出来高が111M USDTを超える中、弱気勢(ベア)が一斉に清算されています。価格が$150を超えるとストップロスが発動し、ショート勢が買い戻しを強いられて、上昇ラリーに追い風(ロケット燃料)を加えました。
🎯 目標水準
· 上昇目標:$195 → $215 → $250
· 下方向のサポート:$165 → $142
勢いは非常に強いですが、常にリスク管理を忘れずに。健康的な再エントリーのために、$165の再テストに注目しましょう。
いいね・フォロー・シェアをお忘れなく! 🩸 どうもありがとうございます ❤️
#BitwiseFilesFinalNEARSpotETFProspectus #DogecoinETFsPostBiggestWeekSinceLaunch #StrategyStriveAdd2305BitcoinThisWeek #TrumpRejectsIranHormuzReopening
QNT/USDTが急騰!次の目標は$200か? 🚀
Quant(QNT)は現在、+57.71%という大幅な上昇でチャートを圧倒し、$178.35で取引されています。これは単なる偶然の急騰ではありません。強いファンダメンタルズと、激しいテクニカル・ブレイクアウトが重なった結果です。では、QNTがなぜ爆発的に伸びているのかを深掘りしていきましょう:
1. クジラの蓄積(Whale Accumulation)& ETFストーリー 🐋
機関投資家の関心が再び強まっています。オンチェーンデータでは、大口ウォレットが、相互運用性の需要増加を見越してQNTを大量に買い集めていることが示されています。直近のスポット・ビットコインETF承認は、ユーティリティが強いアルトコインに対して「流動性半減(halving of liquidity)」という物語を引き起こしました。Quantの独自のOverledger技術は、トークン化された現実世界資産(RWA)で有力な候補として位置づけられており、スマートマネーの流入を後押ししています。
2. テクニカル・ブレイクアウト & 重要水準 📈
チャートは教科書的な放物線状の動きです。$120のサポート・ゾーン付近でしばらく固めた後、QNTは複数のレジスタンスを突破しました。
· 直近のレジスタンス:24時間高値の$194.95。この水準をきれいに上抜けると、心理的節目の$200に向けて素早い値動きが起きる可能性があります。
· 重要サポート:以前のレジスタンスだった$165がサポートに転換。価格がこの水準より上で推移している限り、強気の構造は維持されます。7日間のパフォーマンス(+169%)が、強いトレンド転換を裏付けています。
3. ショートスクイーズのダイナミクス 🔥
大量の緑のローソク足は、深刻なショートスクイーズを示しています。24時間の出来高が111M USDTを超える中、弱気勢(ベア)が一斉に清算されています。価格が$150を超えるとストップロスが発動し、ショート勢が買い戻しを強いられて、上昇ラリーに追い風(ロケット燃料)を加えました。
🎯 目標水準
· 上昇目標:$195 → $215 → $250
· 下方向のサポート:$165 → $142
勢いは非常に強いですが、常にリスク管理を忘れずに。健康的な再エントリーのために、$165の再テストに注目しましょう。
いいね・フォロー・シェアをお忘れなく! 🩸 どうもありがとうございます ❤️
#BitwiseFilesFinalNEARSpotETFProspectus #DogecoinETFsPostBiggestWeekSinceLaunch #StrategyStriveAdd2305BitcoinThisWeek #TrumpRejectsIranHormuzReopening
196
本人確認中
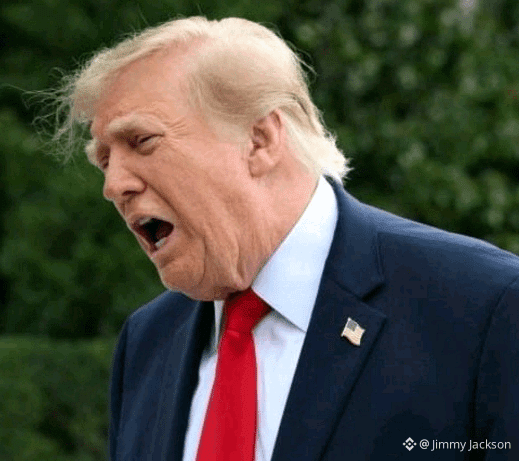
🛢️ トランプ:「ホルムズ海峡から、紛争が始まる前よりも多くの原油を取り出した」
$BTC
{spot}(BTCUSDT)
トランプは大胆な主張を投下した。米国が昨夜、ホルムズ海峡を通して記録的な量の石油を移動させたと報じられている——さらには、紛争が始まる前よりも多かったのだ、と彼は語る。 🚢
これは大きな意味がある。ホルムズ海峡は世界で最も重要な原油の通り道で、世界の石油の約5分の1が、毎日そこを通過している。つまり、そこでの交通量が単に維持されるだけでなく、紛争前の水準を上回ったとされるなら、それは強いシグナルだ。エネルギーの流れは開いたままであり、多くの人が懸念していた混乱は、十分には実現しなかったということになる。 📉
$TRUMP
{spot}(TRUMPUSDT)
その発言を額面どおりに受け取るにせよ、ひとつまみの塩を加えて見るにせよ、重要なポイントは変わらない——その回廊を稼働させ続けることは、グローバルな市場からあなたがガソリンスタンドで支払う価格まで、誰にとっても大切だ。 ⛽
要するに:緊張は高いかもしれないが、石油は動き続けている。そしてそれは、切り方次第であっても、安定にとっての勝利だ。 🌍
いいね、フォロー、シェアを忘れないでください! 🩸 どうもありがとうございます ❤️
#BitwiseFilesFinalNEARSpotETFProspectus #DogecoinETFsPostBiggestWeekSinceLaunch #StrategyStriveAdd2305BitcoinThisWeek #TrumpRejectsIranHormuzReopening
🛢️ トランプ:「ホルムズ海峡から、紛争が始まる前よりも多くの原油を取り出した」
$BTC
トランプは大胆な主張を投下した。米国が昨夜、ホルムズ海峡を通して記録的な量の石油を移動させたと報じられている——さらには、紛争が始まる前よりも多かったのだ、と彼は語る。 🚢
これは大きな意味がある。ホルムズ海峡は世界で最も重要な原油の通り道で、世界の石油の約5分の1が、毎日そこを通過している。つまり、そこでの交通量が単に維持されるだけでなく、紛争前の水準を上回ったとされるなら、それは強いシグナルだ。エネルギーの流れは開いたままであり、多くの人が懸念していた混乱は、十分には実現しなかったということになる。 📉
$TRUMP
その発言を額面どおりに受け取るにせよ、ひとつまみの塩を加えて見るにせよ、重要なポイントは変わらない——その回廊を稼働させ続けることは、グローバルな市場からあなたがガソリンスタンドで支払う価格まで、誰にとっても大切だ。 ⛽
要するに:緊張は高いかもしれないが、石油は動き続けている。そしてそれは、切り方次第であっても、安定にとっての勝利だ。 🌍
いいね、フォロー、シェアを忘れないでください! 🩸 どうもありがとうございます ❤️
#BitwiseFilesFinalNEARSpotETFProspectus #DogecoinETFsPostBiggestWeekSinceLaunch #StrategyStriveAdd2305BitcoinThisWeek #TrumpRejectsIranHormuzReopening
$BTC
トランプは大胆な主張を投下した。米国が昨夜、ホルムズ海峡を通して記録的な量の石油を移動させたと報じられている——さらには、紛争が始まる前よりも多かったのだ、と彼は語る。 🚢
これは大きな意味がある。ホルムズ海峡は世界で最も重要な原油の通り道で、世界の石油の約5分の1が、毎日そこを通過している。つまり、そこでの交通量が単に維持されるだけでなく、紛争前の水準を上回ったとされるなら、それは強いシグナルだ。エネルギーの流れは開いたままであり、多くの人が懸念していた混乱は、十分には実現しなかったということになる。 📉
$TRUMP
その発言を額面どおりに受け取るにせよ、ひとつまみの塩を加えて見るにせよ、重要なポイントは変わらない——その回廊を稼働させ続けることは、グローバルな市場からあなたがガソリンスタンドで支払う価格まで、誰にとっても大切だ。 ⛽
要するに:緊張は高いかもしれないが、石油は動き続けている。そしてそれは、切り方次第であっても、安定にとっての勝利だ。 🌍
いいね、フォロー、シェアを忘れないでください! 🩸 どうもありがとうございます ❤️
#BitwiseFilesFinalNEARSpotETFProspectus #DogecoinETFsPostBiggestWeekSinceLaunch #StrategyStriveAdd2305BitcoinThisWeek #TrumpRejectsIranHormuzReopening
1
539
🚀 $NIU.US
{stock_us}(NIU.US)
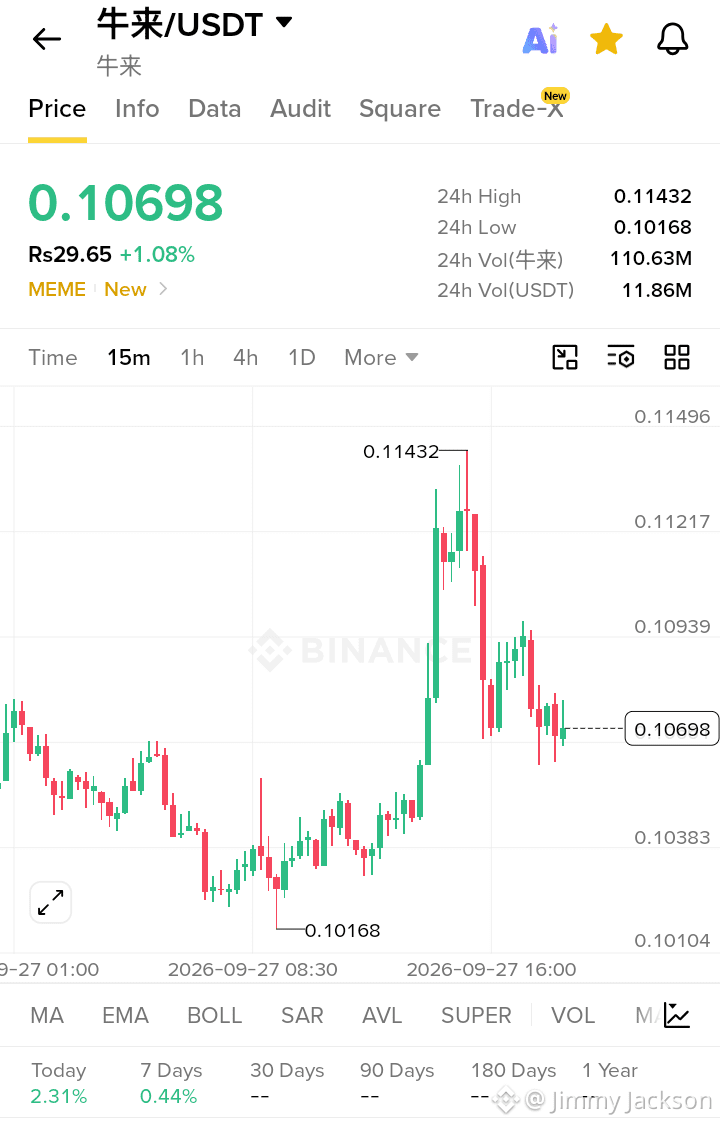
/USDT 市場アップデート:$0.11を奪還!強気の狙い
牛来(NIU)が大幅な日中の巻き返しを見せ、市場が一気に熱を帯びています。24時間安値の$0.10168まで下落した後、現在価格は$0.10698まで上昇し、日足では+1.08%の上昇です。今回のポンプが起きている理由を深掘りします:
1. クジラの蓄積(Whale Accumulation)&資金流入 🐋
オンチェーンデータによると、賢い資金が流入しています。NIUの過去24時間の出来高は110.63Mに達しており、流動性としては11.86M USDT超を示します。この急増は、直近の下落局面で大口保有者が積極的に買い集めていることを示唆しています。売り圧力を吸収し、この反転の強固な土台を作っている可能性が高いです。これは、資金が時価総額の高いミーム(Meme)セクターへ回転しているという、より広範な市場トレンドとも一致します。
2. テクニカルなブレイクアウト&重要水準 📈
15分足を見ると、NIUはV字型の回復を形成しています。
· レジスタンス:直近の天井は24時間高値の$0.11432です。この水準を上抜ける明確なブレイクが起これば、放物線状の急伸(パラボリック・ムーブ)を引き起こす可能性があります。
· サポート:$0.10168に強いサポートが形成されています。このゾーンの上で価格が維持される限り、強気の構造は保たれたままです。
· ターゲット:短期目標は$0.11217の再テストです。
3. ショートの清算(Short Liquidations)&デリバティブのスクイーズ ⚡️
安値からの急激な垂直上昇は、遅れてショートした売り勢を巻き込んだ可能性が高いです。価格が$0.106の水準を取り戻すと、ショート清算が連鎖的に発生し、買い圧力を加速させてポンプを押し上げました。もしNIUが$0.10939の水準をサポートへ反転できれば、24時間高値を狙うショートスクイーズが見られるかもしれません。
🎯 注目の重要水準:
· エントリーゾーン:$0.105 - $0.107
· ターゲット1:$0.112
· ターゲット2:$0.11432
いいね、フォロー、シェアを忘れずに! 🩸 どうもありがとうございます ❤️
#BitwiseFilesFinalNEARSpotETFProspectus #DogecoinETFsPostBiggestWeekSinceLaunch #StrategyStriveAdd2305BitcoinThisWeek #TrumpRejectsIranHormuzReopening
🚀 $NIU.US
/USDT 市場アップデート:$0.11を奪還!強気の狙い
牛来(NIU)が大幅な日中の巻き返しを見せ、市場が一気に熱を帯びています。24時間安値の$0.10168まで下落した後、現在価格は$0.10698まで上昇し、日足では+1.08%の上昇です。今回のポンプが起きている理由を深掘りします:
1. クジラの蓄積(Whale Accumulation)&資金流入 🐋
オンチェーンデータによると、賢い資金が流入しています。NIUの過去24時間の出来高は110.63Mに達しており、流動性としては11.86M USDT超を示します。この急増は、直近の下落局面で大口保有者が積極的に買い集めていることを示唆しています。売り圧力を吸収し、この反転の強固な土台を作っている可能性が高いです。これは、資金が時価総額の高いミーム(Meme)セクターへ回転しているという、より広範な市場トレンドとも一致します。
2. テクニカルなブレイクアウト&重要水準 📈
15分足を見ると、NIUはV字型の回復を形成しています。
· レジスタンス:直近の天井は24時間高値の$0.11432です。この水準を上抜ける明確なブレイクが起これば、放物線状の急伸(パラボリック・ムーブ)を引き起こす可能性があります。
· サポート:$0.10168に強いサポートが形成されています。このゾーンの上で価格が維持される限り、強気の構造は保たれたままです。
· ターゲット:短期目標は$0.11217の再テストです。
3. ショートの清算(Short Liquidations)&デリバティブのスクイーズ ⚡️
安値からの急激な垂直上昇は、遅れてショートした売り勢を巻き込んだ可能性が高いです。価格が$0.106の水準を取り戻すと、ショート清算が連鎖的に発生し、買い圧力を加速させてポンプを押し上げました。もしNIUが$0.10939の水準をサポートへ反転できれば、24時間高値を狙うショートスクイーズが見られるかもしれません。
🎯 注目の重要水準:
· エントリーゾーン:$0.105 - $0.107
· ターゲット1:$0.112
· ターゲット2:$0.11432
いいね、フォロー、シェアを忘れずに! 🩸 どうもありがとうございます ❤️
#BitwiseFilesFinalNEARSpotETFProspectus #DogecoinETFsPostBiggestWeekSinceLaunch #StrategyStriveAdd2305BitcoinThisWeek #TrumpRejectsIranHormuzReopening
/USDT 市場アップデート:$0.11を奪還!強気の狙い
牛来(NIU)が大幅な日中の巻き返しを見せ、市場が一気に熱を帯びています。24時間安値の$0.10168まで下落した後、現在価格は$0.10698まで上昇し、日足では+1.08%の上昇です。今回のポンプが起きている理由を深掘りします:
1. クジラの蓄積(Whale Accumulation)&資金流入 🐋
オンチェーンデータによると、賢い資金が流入しています。NIUの過去24時間の出来高は110.63Mに達しており、流動性としては11.86M USDT超を示します。この急増は、直近の下落局面で大口保有者が積極的に買い集めていることを示唆しています。売り圧力を吸収し、この反転の強固な土台を作っている可能性が高いです。これは、資金が時価総額の高いミーム(Meme)セクターへ回転しているという、より広範な市場トレンドとも一致します。
2. テクニカルなブレイクアウト&重要水準 📈
15分足を見ると、NIUはV字型の回復を形成しています。
· レジスタンス:直近の天井は24時間高値の$0.11432です。この水準を上抜ける明確なブレイクが起これば、放物線状の急伸(パラボリック・ムーブ)を引き起こす可能性があります。
· サポート:$0.10168に強いサポートが形成されています。このゾーンの上で価格が維持される限り、強気の構造は保たれたままです。
· ターゲット:短期目標は$0.11217の再テストです。
3. ショートの清算(Short Liquidations)&デリバティブのスクイーズ ⚡️
安値からの急激な垂直上昇は、遅れてショートした売り勢を巻き込んだ可能性が高いです。価格が$0.106の水準を取り戻すと、ショート清算が連鎖的に発生し、買い圧力を加速させてポンプを押し上げました。もしNIUが$0.10939の水準をサポートへ反転できれば、24時間高値を狙うショートスクイーズが見られるかもしれません。
🎯 注目の重要水準:
· エントリーゾーン:$0.105 - $0.107
· ターゲット1:$0.112
· ターゲット2:$0.11432
いいね、フォロー、シェアを忘れずに! 🩸 どうもありがとうございます ❤️
#BitwiseFilesFinalNEARSpotETFProspectus #DogecoinETFsPostBiggestWeekSinceLaunch #StrategyStriveAdd2305BitcoinThisWeek #TrumpRejectsIranHormuzReopening
62
$GRAM
{spot}(GRAMUSDT)
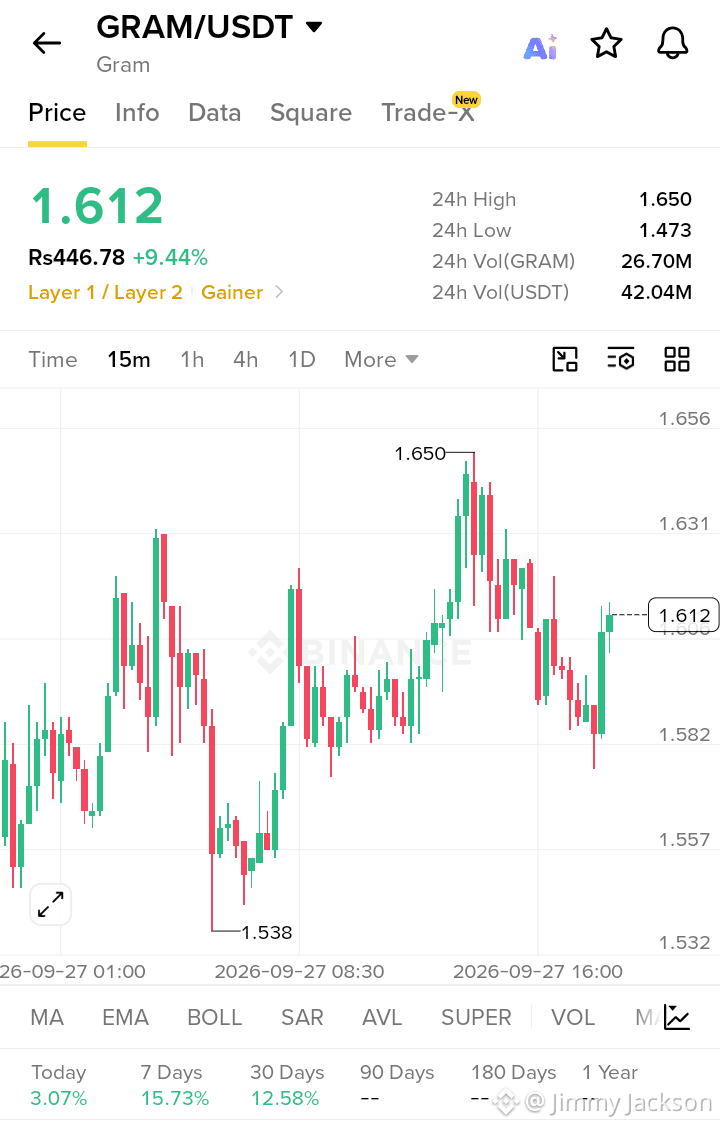
GRAM/USDT ポンプ分析:なぜ 9.44% の急騰?
GRAM は現在 $1.612 で取引されており、強い +9.44% の日次上昇を記録しています。これは単なる偶然の値動きではなく、テクニカルなブレイクアウトとファンダメンタルズのエコシステム成長が重なった結果です。
深掘りテクニカル分析
15m チャートを見ると、GRAM は $1.538 のサポートをうまく防衛し、切り上げの安値を形成しています。その後、抵抗線を突破し、24時間高値である $1.650 まで急伸しました。重要なのは、24時間の出来高が非常に大きいこと(26.70M GRAM / 42.04M USDT)です。これにより、このポンプが低出来高による見せかけの操作ではなく、実在する流動性に裏付けられていることが確認できます。「Layer 1 / Layer 2」および「Gainer」タグは、資金のローテーションがインフラ系トークンへ流入していることを示しています。
新情報 & カタリスト
主なけん引役は Toncoin(TON)エコシステムの相乗効果です。Gram は Gram ウォレットのネイティブトークンであり、The Open Network 上の看板プロダクトです。Telegram の Web3 統合に関する最近のアップデートや、TON ベースの DeFi ユーティリティの拡大が、投機的な関心を押し上げています。TON が上昇局面に入ると、GRAM はハイベータの材料として働き、しばしば親資産を上回る動きになります。投資家は、拡大する TON アプリのエコシステム内での Gram のガス手数料やガバナンスにおける実用性に賭けています。
見通し
もし GRAM が $1.60 を維持できれば、次の合理的なターゲットは $1.65 の再テスト、そして価格の新たな発見(プライスディスカバリー)です。出来高の整理(コンソリデーション)に注目しましょう。
いいね、フォロー、シェアを忘れないでください!🩸 どうもありがとうございます ❤️
#BitwiseFilesFinalNEARSpotETFProspectus #DogecoinETFsPostBiggestWeekSinceLaunch #StrategyStriveAdd2305BitcoinThisWeek
$GRAM
GRAM/USDT ポンプ分析:なぜ 9.44% の急騰?
GRAM は現在 $1.612 で取引されており、強い +9.44% の日次上昇を記録しています。これは単なる偶然の値動きではなく、テクニカルなブレイクアウトとファンダメンタルズのエコシステム成長が重なった結果です。
深掘りテクニカル分析
15m チャートを見ると、GRAM は $1.538 のサポートをうまく防衛し、切り上げの安値を形成しています。その後、抵抗線を突破し、24時間高値である $1.650 まで急伸しました。重要なのは、24時間の出来高が非常に大きいこと(26.70M GRAM / 42.04M USDT)です。これにより、このポンプが低出来高による見せかけの操作ではなく、実在する流動性に裏付けられていることが確認できます。「Layer 1 / Layer 2」および「Gainer」タグは、資金のローテーションがインフラ系トークンへ流入していることを示しています。
新情報 & カタリスト
主なけん引役は Toncoin(TON)エコシステムの相乗効果です。Gram は Gram ウォレットのネイティブトークンであり、The Open Network 上の看板プロダクトです。Telegram の Web3 統合に関する最近のアップデートや、TON ベースの DeFi ユーティリティの拡大が、投機的な関心を押し上げています。TON が上昇局面に入ると、GRAM はハイベータの材料として働き、しばしば親資産を上回る動きになります。投資家は、拡大する TON アプリのエコシステム内での Gram のガス手数料やガバナンスにおける実用性に賭けています。
見通し
もし GRAM が $1.60 を維持できれば、次の合理的なターゲットは $1.65 の再テスト、そして価格の新たな発見(プライスディスカバリー)です。出来高の整理(コンソリデーション)に注目しましょう。
いいね、フォロー、シェアを忘れないでください!🩸 どうもありがとうございます ❤️
#BitwiseFilesFinalNEARSpotETFProspectus #DogecoinETFsPostBiggestWeekSinceLaunch #StrategyStriveAdd2305BitcoinThisWeek
GRAM/USDT ポンプ分析:なぜ 9.44% の急騰?
GRAM は現在 $1.612 で取引されており、強い +9.44% の日次上昇を記録しています。これは単なる偶然の値動きではなく、テクニカルなブレイクアウトとファンダメンタルズのエコシステム成長が重なった結果です。
深掘りテクニカル分析
15m チャートを見ると、GRAM は $1.538 のサポートをうまく防衛し、切り上げの安値を形成しています。その後、抵抗線を突破し、24時間高値である $1.650 まで急伸しました。重要なのは、24時間の出来高が非常に大きいこと(26.70M GRAM / 42.04M USDT)です。これにより、このポンプが低出来高による見せかけの操作ではなく、実在する流動性に裏付けられていることが確認できます。「Layer 1 / Layer 2」および「Gainer」タグは、資金のローテーションがインフラ系トークンへ流入していることを示しています。
新情報 & カタリスト
主なけん引役は Toncoin(TON)エコシステムの相乗効果です。Gram は Gram ウォレットのネイティブトークンであり、The Open Network 上の看板プロダクトです。Telegram の Web3 統合に関する最近のアップデートや、TON ベースの DeFi ユーティリティの拡大が、投機的な関心を押し上げています。TON が上昇局面に入ると、GRAM はハイベータの材料として働き、しばしば親資産を上回る動きになります。投資家は、拡大する TON アプリのエコシステム内での Gram のガス手数料やガバナンスにおける実用性に賭けています。
見通し
もし GRAM が $1.60 を維持できれば、次の合理的なターゲットは $1.65 の再テスト、そして価格の新たな発見(プライスディスカバリー)です。出来高の整理(コンソリデーション)に注目しましょう。
いいね、フォロー、シェアを忘れないでください!🩸 どうもありがとうございます ❤️
#BitwiseFilesFinalNEARSpotETFProspectus #DogecoinETFsPostBiggestWeekSinceLaunch #StrategyStriveAdd2305BitcoinThisWeek
1
202
$WLD
{spot}(WLDUSDT)
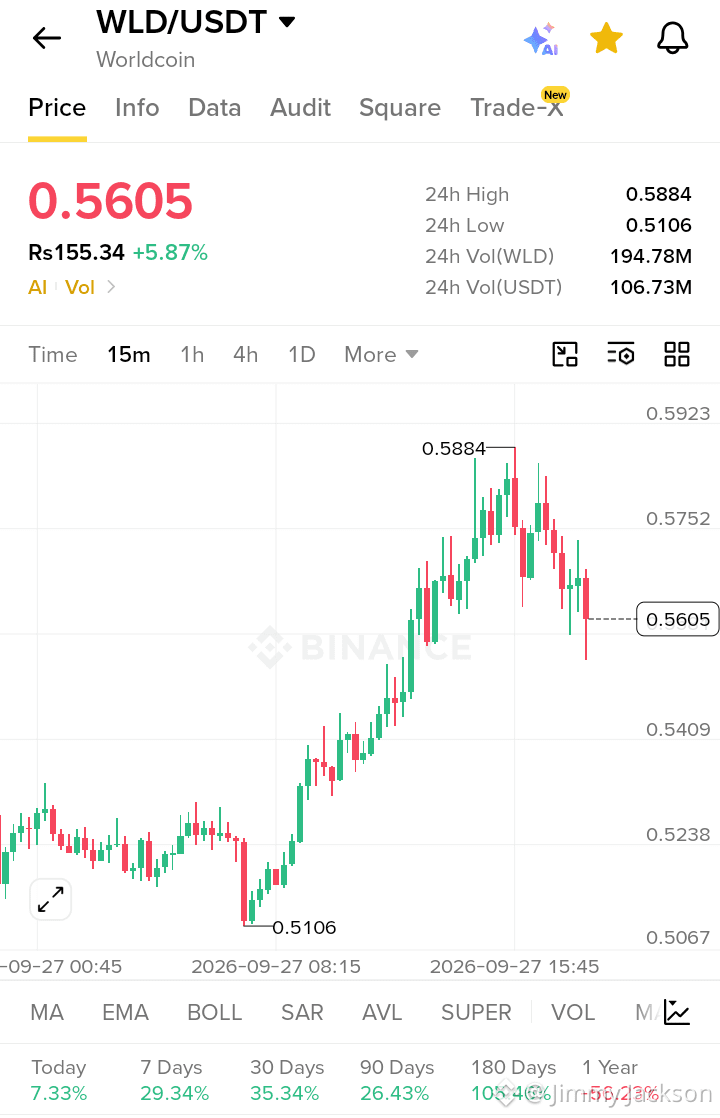
WLD/USDT ポンプ分析:なぜ5.87%の急騰?
Worldcoin(WLD)は現在 $0.5605 で取引されており、過去24時間の安値 $0.5106 からの強い +5.87% の回復を記録しています。今回の値動きは偶然ではなく、テクニカルな一息(リリーフ)とファンダメンタルの変化が組み合わさった結果です。
深掘り分析
テクニカル面では、WLD は大規模な売りが入り $0.51 まで下落し、「V字型」のリカバリーを形成しました。これは強固な買いの壁(バイ・ウォール)や集積ゾーンがあることを示唆しています。相対力指数(RSI)は以前オーバーソールド(売られ過ぎ)でした。そしてこのポンプは典型的な平均回帰(ミーン・リバージョン)です。出来高の急増(194M WLD)は、機関投資家の関心がトークンに戻ってきたことを裏付けています。
新情報 & カタリスト
主な要因は、最近の World Chain のアップデートです。Worldcoin は「虹彩スキャン(iris-scanning)」だけに留まらず、フルスタックのレイヤー2(Layer 2)エコシステムへ積極的に舵を切っています。最近の統合により、検証済みの人間がガス・グラント(gas grants)を受け取れるようになったことに加え、World ID の新市場への拡大(ゲームやソーシャルメディアの本人確認など)がこの上昇の追い風になっています。さらに、WLD がしばしば AI 関連トークンとして括られることによる、より広い市場のセンチメントも追い風です。
見通し
もし WLD が $0.55 のサポートを維持できれば、次のレジスタンスは 24H 高値の $0.5884 です。ここをブレイクできれば $0.62 を狙えます。ただし 1年の ROI は依然 -56% のため、これは変動の大きいリカバリー・プレイです。出来高の確認を見守りましょう!
いいね、フォロー、シェアをお忘れなく! 🩸 どうもありがとうございます ❤️
#BitwiseFilesFinalNEARSpotETFProspectus #DogecoinETFsPostBiggestWeekSinceLaunch #StrategyStriveAdd2305BitcoinThisWeek
$WLD
WLD/USDT ポンプ分析:なぜ5.87%の急騰?
Worldcoin(WLD)は現在 $0.5605 で取引されており、過去24時間の安値 $0.5106 からの強い +5.87% の回復を記録しています。今回の値動きは偶然ではなく、テクニカルな一息(リリーフ)とファンダメンタルの変化が組み合わさった結果です。
深掘り分析
テクニカル面では、WLD は大規模な売りが入り $0.51 まで下落し、「V字型」のリカバリーを形成しました。これは強固な買いの壁(バイ・ウォール)や集積ゾーンがあることを示唆しています。相対力指数(RSI)は以前オーバーソールド(売られ過ぎ)でした。そしてこのポンプは典型的な平均回帰(ミーン・リバージョン)です。出来高の急増(194M WLD)は、機関投資家の関心がトークンに戻ってきたことを裏付けています。
新情報 & カタリスト
主な要因は、最近の World Chain のアップデートです。Worldcoin は「虹彩スキャン(iris-scanning)」だけに留まらず、フルスタックのレイヤー2(Layer 2)エコシステムへ積極的に舵を切っています。最近の統合により、検証済みの人間がガス・グラント(gas grants)を受け取れるようになったことに加え、World ID の新市場への拡大(ゲームやソーシャルメディアの本人確認など)がこの上昇の追い風になっています。さらに、WLD がしばしば AI 関連トークンとして括られることによる、より広い市場のセンチメントも追い風です。
見通し
もし WLD が $0.55 のサポートを維持できれば、次のレジスタンスは 24H 高値の $0.5884 です。ここをブレイクできれば $0.62 を狙えます。ただし 1年の ROI は依然 -56% のため、これは変動の大きいリカバリー・プレイです。出来高の確認を見守りましょう!
いいね、フォロー、シェアをお忘れなく! 🩸 どうもありがとうございます ❤️
#BitwiseFilesFinalNEARSpotETFProspectus #DogecoinETFsPostBiggestWeekSinceLaunch #StrategyStriveAdd2305BitcoinThisWeek
WLD/USDT ポンプ分析:なぜ5.87%の急騰?
Worldcoin(WLD)は現在 $0.5605 で取引されており、過去24時間の安値 $0.5106 からの強い +5.87% の回復を記録しています。今回の値動きは偶然ではなく、テクニカルな一息(リリーフ)とファンダメンタルの変化が組み合わさった結果です。
深掘り分析
テクニカル面では、WLD は大規模な売りが入り $0.51 まで下落し、「V字型」のリカバリーを形成しました。これは強固な買いの壁(バイ・ウォール)や集積ゾーンがあることを示唆しています。相対力指数(RSI)は以前オーバーソールド(売られ過ぎ)でした。そしてこのポンプは典型的な平均回帰(ミーン・リバージョン)です。出来高の急増(194M WLD)は、機関投資家の関心がトークンに戻ってきたことを裏付けています。
新情報 & カタリスト
主な要因は、最近の World Chain のアップデートです。Worldcoin は「虹彩スキャン(iris-scanning)」だけに留まらず、フルスタックのレイヤー2(Layer 2)エコシステムへ積極的に舵を切っています。最近の統合により、検証済みの人間がガス・グラント(gas grants)を受け取れるようになったことに加え、World ID の新市場への拡大(ゲームやソーシャルメディアの本人確認など)がこの上昇の追い風になっています。さらに、WLD がしばしば AI 関連トークンとして括られることによる、より広い市場のセンチメントも追い風です。
見通し
もし WLD が $0.55 のサポートを維持できれば、次のレジスタンスは 24H 高値の $0.5884 です。ここをブレイクできれば $0.62 を狙えます。ただし 1年の ROI は依然 -56% のため、これは変動の大きいリカバリー・プレイです。出来高の確認を見守りましょう!
いいね、フォロー、シェアをお忘れなく! 🩸 どうもありがとうございます ❤️
#BitwiseFilesFinalNEARSpotETFProspectus #DogecoinETFsPostBiggestWeekSinceLaunch #StrategyStriveAdd2305BitcoinThisWeek
341
🚨 $TRUMP Coin Is a Trap — Here's What Smart Traders Are Watching Instead 🚨
$TRUMP
{spot}(TRUMPUSDT)
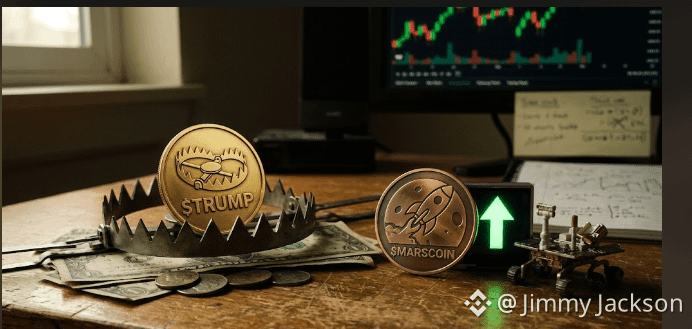
ちょっと現実を言います。トランプ・コイン? それは投資じゃありません――仕掛けです。🪤 どこで買おうが、早めに拾おうが遅れて追いかけようが、結局はあなたのお金をインサイダーに渡しているのと同じです。彼らにはイグジット・リクイディティ(換金の受け皿)が必要で、その役が個人トレーダーなんです。ゲームの本質はそれ。あなたは「早い側」じゃない――あなたが出口です。💸
その一方で、$MARSCOIN は黙々と、本当に大事なことをやっています。つまり、Q4が終わる前にトレーダーや保有者に“本当の”利益チャンスを与えること。🚀 これはまだ、勢いのあるタイプのミームの1つです――話題に飛びつく(FOMOる)人にではなく、ちゃんと注意を払う人に報酬が返ってくるようなやつ。
もう一度、よく読んでください。流し読みしないで。2つの違いは、「騙されている」のか「備えている」のか――その違いです。🧠
いいね、フォロー、シェアを忘れないでください! 🩸 どうもありがとうございます。❤️
#CircleMints500MUSDCOnSolana #PolymarketBankFailureBetsDrawFDICConcern #BitwiseFilesToListNEARETFOnNYSEArca
🚨 $TRUMP Coin Is a Trap — Here's What Smart Traders Are Watching Instead 🚨
$TRUMP
ちょっと現実を言います。トランプ・コイン? それは投資じゃありません――仕掛けです。🪤 どこで買おうが、早めに拾おうが遅れて追いかけようが、結局はあなたのお金をインサイダーに渡しているのと同じです。彼らにはイグジット・リクイディティ(換金の受け皿)が必要で、その役が個人トレーダーなんです。ゲームの本質はそれ。あなたは「早い側」じゃない――あなたが出口です。💸
その一方で、$MARSCOIN は黙々と、本当に大事なことをやっています。つまり、Q4が終わる前にトレーダーや保有者に“本当の”利益チャンスを与えること。🚀 これはまだ、勢いのあるタイプのミームの1つです――話題に飛びつく(FOMOる)人にではなく、ちゃんと注意を払う人に報酬が返ってくるようなやつ。
もう一度、よく読んでください。流し読みしないで。2つの違いは、「騙されている」のか「備えている」のか――その違いです。🧠
いいね、フォロー、シェアを忘れないでください! 🩸 どうもありがとうございます。❤️
#CircleMints500MUSDCOnSolana #PolymarketBankFailureBetsDrawFDICConcern #BitwiseFilesToListNEARETFOnNYSEArca
$TRUMP
ちょっと現実を言います。トランプ・コイン? それは投資じゃありません――仕掛けです。🪤 どこで買おうが、早めに拾おうが遅れて追いかけようが、結局はあなたのお金をインサイダーに渡しているのと同じです。彼らにはイグジット・リクイディティ(換金の受け皿)が必要で、その役が個人トレーダーなんです。ゲームの本質はそれ。あなたは「早い側」じゃない――あなたが出口です。💸
その一方で、$MARSCOIN は黙々と、本当に大事なことをやっています。つまり、Q4が終わる前にトレーダーや保有者に“本当の”利益チャンスを与えること。🚀 これはまだ、勢いのあるタイプのミームの1つです――話題に飛びつく(FOMOる)人にではなく、ちゃんと注意を払う人に報酬が返ってくるようなやつ。
もう一度、よく読んでください。流し読みしないで。2つの違いは、「騙されている」のか「備えている」のか――その違いです。🧠
いいね、フォロー、シェアを忘れないでください! 🩸 どうもありがとうございます。❤️
#CircleMints500MUSDCOnSolana #PolymarketBankFailureBetsDrawFDICConcern #BitwiseFilesToListNEARETFOnNYSEArca
1
485
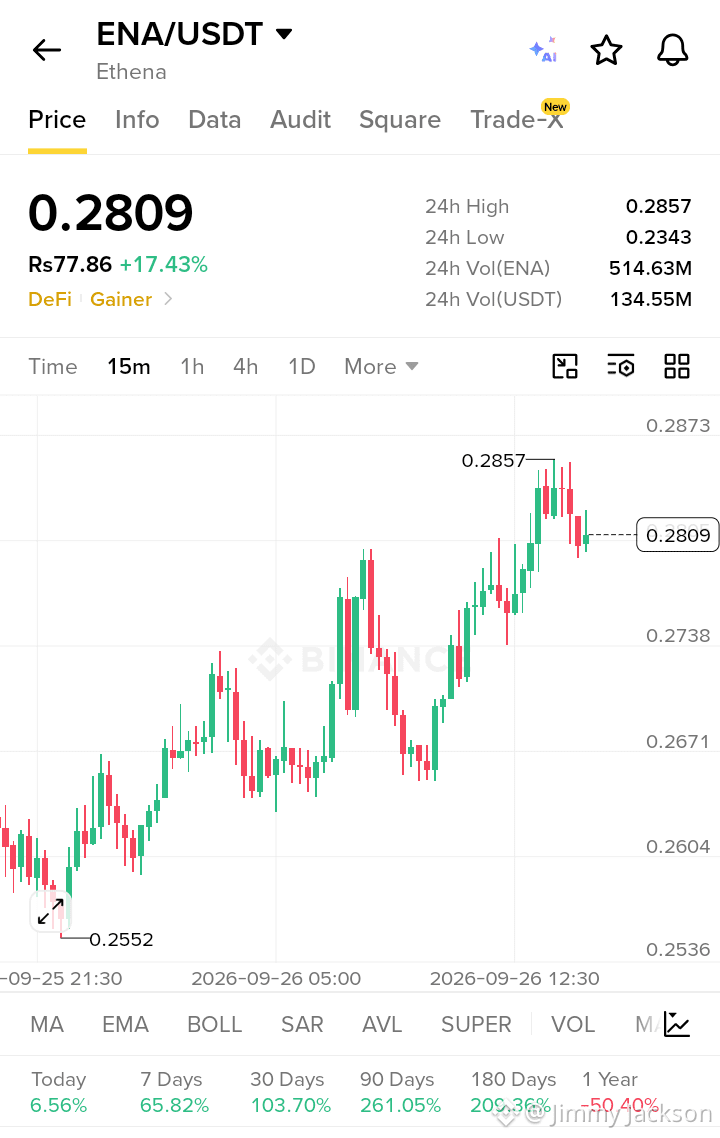
ENA/USDT: 17%のブレイクアウトを解説 🚀
$ENA
{spot}(ENAUSDT)
エターナ(ENA)は現在、市場を相手に巨大な17.43%の急騰で勢いを見せており、価格は$0.2809で取引されています。これは単なる偶然のポンプではなく、強いファンダメンタルズによって裏付けられた“構造的なブレイクアウト”です。
なぜ上がっているの?
1. 供給ショック:Ethenaの最近の「Season 3」エアドロップ申請と、未付与(アンベスト)のトークンのロックにより、流通供給が大幅に減少しました。売り圧力が少ないほど、価格は急速に上昇しやすくなります。
2. TVL爆増:Ethenaの総ロック価値(TVL)が攻撃的に伸びています。クジラ(大口)は、高い利回りを持つUSDeへ資金を回しており、ヘッジやステーキングのためにENAを買うことで、需要を押し上げています。
3. DeFiローテーション:相場全体が落ち着くにつれて、資金はDeFiの「Gainers(勝ち組)」へ流れています。ENAは現在、この流れの先頭に立っています。
テクニカル徹底解説
チャートは“教科書どおりの上昇トレンド”を示しています。ENAは$0.2671のレジスタンスを粉砕し、現在は24時間高値の$0.2857をテスト中です。ポイントは出来高です:24時間で514.63M ENAが取引されており、これは小口のFOMOではなく、本物のクジラの蓄積を裏付けています。
あなたが必要な「新しい」情報
$0.2738の水準を注視してください。ENAがこの新しいサポートを維持する限り、次の上昇局面では$0.30が目標になります。ただし、RSIは15分足で加熱しているので、小さな値動きのブレ(ボラティリティ)は想定してください。
結論:トレンドは間違いなく強気です。青いローソク足を追いかけず、リテスト(再確認)を待ちましょう。
いいね・フォロー・シェアを忘れないでください!🩸 どうもありがとうございます ❤️
#CircleMints500MUSDCOnSolana #PolymarketBankFailureBetsDrawFDICConcern #CoinMarketCapCompletesCoinglassAcquisition
ENA/USDT: 17%のブレイクアウトを解説 🚀
$ENA
エターナ(ENA)は現在、市場を相手に巨大な17.43%の急騰で勢いを見せており、価格は$0.2809で取引されています。これは単なる偶然のポンプではなく、強いファンダメンタルズによって裏付けられた“構造的なブレイクアウト”です。
なぜ上がっているの?
1. 供給ショック:Ethenaの最近の「Season 3」エアドロップ申請と、未付与(アンベスト)のトークンのロックにより、流通供給が大幅に減少しました。売り圧力が少ないほど、価格は急速に上昇しやすくなります。
2. TVL爆増:Ethenaの総ロック価値(TVL)が攻撃的に伸びています。クジラ(大口)は、高い利回りを持つUSDeへ資金を回しており、ヘッジやステーキングのためにENAを買うことで、需要を押し上げています。
3. DeFiローテーション:相場全体が落ち着くにつれて、資金はDeFiの「Gainers(勝ち組)」へ流れています。ENAは現在、この流れの先頭に立っています。
テクニカル徹底解説
チャートは“教科書どおりの上昇トレンド”を示しています。ENAは$0.2671のレジスタンスを粉砕し、現在は24時間高値の$0.2857をテスト中です。ポイントは出来高です:24時間で514.63M ENAが取引されており、これは小口のFOMOではなく、本物のクジラの蓄積を裏付けています。
あなたが必要な「新しい」情報
$0.2738の水準を注視してください。ENAがこの新しいサポートを維持する限り、次の上昇局面では$0.30が目標になります。ただし、RSIは15分足で加熱しているので、小さな値動きのブレ(ボラティリティ)は想定してください。
結論:トレンドは間違いなく強気です。青いローソク足を追いかけず、リテスト(再確認)を待ちましょう。
いいね・フォロー・シェアを忘れないでください!🩸 どうもありがとうございます ❤️
#CircleMints500MUSDCOnSolana #PolymarketBankFailureBetsDrawFDICConcern #CoinMarketCapCompletesCoinglassAcquisition
$ENA
エターナ(ENA)は現在、市場を相手に巨大な17.43%の急騰で勢いを見せており、価格は$0.2809で取引されています。これは単なる偶然のポンプではなく、強いファンダメンタルズによって裏付けられた“構造的なブレイクアウト”です。
なぜ上がっているの?
1. 供給ショック:Ethenaの最近の「Season 3」エアドロップ申請と、未付与(アンベスト)のトークンのロックにより、流通供給が大幅に減少しました。売り圧力が少ないほど、価格は急速に上昇しやすくなります。
2. TVL爆増:Ethenaの総ロック価値(TVL)が攻撃的に伸びています。クジラ(大口)は、高い利回りを持つUSDeへ資金を回しており、ヘッジやステーキングのためにENAを買うことで、需要を押し上げています。
3. DeFiローテーション:相場全体が落ち着くにつれて、資金はDeFiの「Gainers(勝ち組)」へ流れています。ENAは現在、この流れの先頭に立っています。
テクニカル徹底解説
チャートは“教科書どおりの上昇トレンド”を示しています。ENAは$0.2671のレジスタンスを粉砕し、現在は24時間高値の$0.2857をテスト中です。ポイントは出来高です:24時間で514.63M ENAが取引されており、これは小口のFOMOではなく、本物のクジラの蓄積を裏付けています。
あなたが必要な「新しい」情報
$0.2738の水準を注視してください。ENAがこの新しいサポートを維持する限り、次の上昇局面では$0.30が目標になります。ただし、RSIは15分足で加熱しているので、小さな値動きのブレ(ボラティリティ)は想定してください。
結論:トレンドは間違いなく強気です。青いローソク足を追いかけず、リテスト(再確認)を待ちましょう。
いいね・フォロー・シェアを忘れないでください!🩸 どうもありがとうございます ❤️
#CircleMints500MUSDCOnSolana #PolymarketBankFailureBetsDrawFDICConcern #CoinMarketCapCompletesCoinglassAcquisition
113
SUIの最近の急騰:深掘り分析
$SUI
{spot}(SUIUSDT)
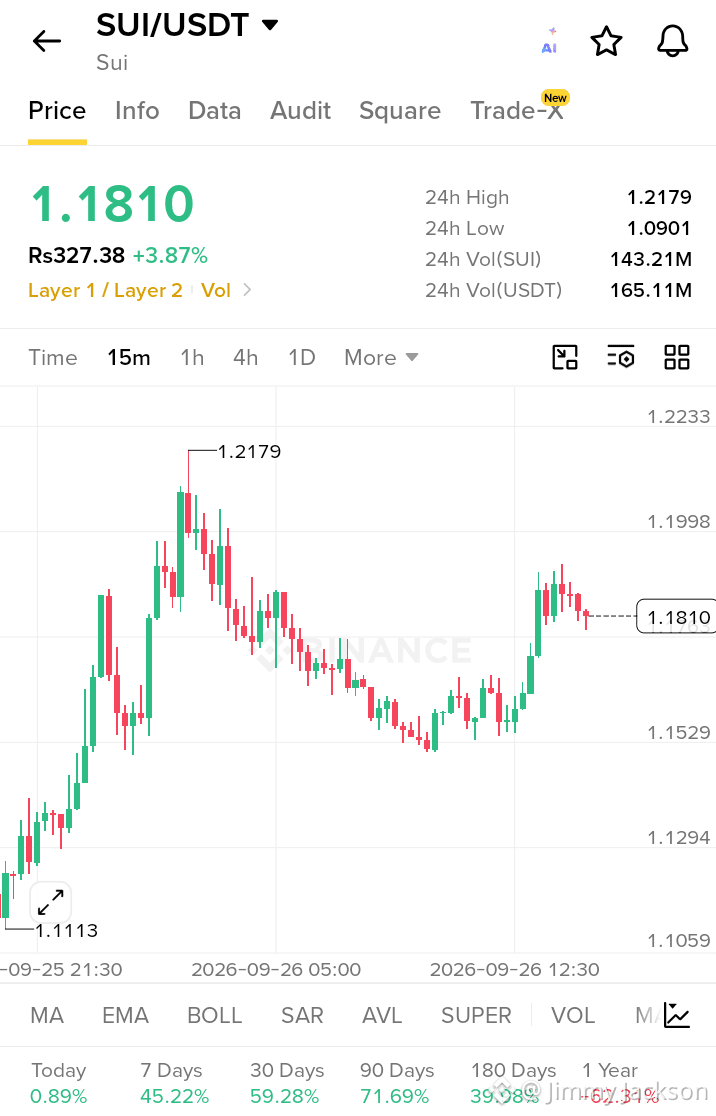
SUIの直近の1.18ドルまでの上昇は、強力なファンダメンタルの改善と戦略的な資本流入が組み合わさったことによってもたらされています。主要なきっかけは、SuiがゲームfiおよびDeFiインフラへ積極的に踏み込んでいる点です。最近のネットワークのアップグレードによりレイテンシーが大幅に低下し、Suiが高速なオンチェーン・ゲーミングの有力候補として位置付けられました。現在、このテーマは大きな市場の注目を集めています。
機関投資家からの支援は2つ目の柱です。戦略的パートナーシップとベンチャーキャピタルの資金注入によって流動性が押し上げられており、SuiのDeFiプロトコルにおけるTVL(Total Value Locked:総ロック額)も急増しています。これは投機的な煽りだけでなく、実際のユースケースの存在を示すサインです。さらに、このトークンが1.15ドルの重要なレジスタンスを上抜けたことでテクニカル・ブレイクアウトが発生し、ショートスクイーズ(買い戻しによるショートの巻き戻し)を引き起こして上昇モメンタムを増幅させました。
今後の見通し
もしSUIが1.15ドルのサポートを維持できるなら、次の目標は24時間高値の1.2179ドルです。ただし、ここでのリジェクト(反落)が起きると1.09ドルまでの再テストにつながる可能性があるため、トレーダーはボラティリティに注意する必要があります。出来高が維持されている限り、マクロのトレンドは強気のままです。
いいね、フォロー、シェアを忘れないでください! 🩸 どうもありがとうございます ❤️
#CircleMints500MUSDCOnSolana #PolymarketBankFailureBetsDrawFDICConcern #BlackRockBuildsTokenizedPortfoliosForOndo #BitwiseFilesToListNEARETFOnNYSEArca
SUIの最近の急騰:深掘り分析
$SUI
SUIの直近の1.18ドルまでの上昇は、強力なファンダメンタルの改善と戦略的な資本流入が組み合わさったことによってもたらされています。主要なきっかけは、SuiがゲームfiおよびDeFiインフラへ積極的に踏み込んでいる点です。最近のネットワークのアップグレードによりレイテンシーが大幅に低下し、Suiが高速なオンチェーン・ゲーミングの有力候補として位置付けられました。現在、このテーマは大きな市場の注目を集めています。
機関投資家からの支援は2つ目の柱です。戦略的パートナーシップとベンチャーキャピタルの資金注入によって流動性が押し上げられており、SuiのDeFiプロトコルにおけるTVL(Total Value Locked:総ロック額)も急増しています。これは投機的な煽りだけでなく、実際のユースケースの存在を示すサインです。さらに、このトークンが1.15ドルの重要なレジスタンスを上抜けたことでテクニカル・ブレイクアウトが発生し、ショートスクイーズ(買い戻しによるショートの巻き戻し)を引き起こして上昇モメンタムを増幅させました。
今後の見通し
もしSUIが1.15ドルのサポートを維持できるなら、次の目標は24時間高値の1.2179ドルです。ただし、ここでのリジェクト(反落)が起きると1.09ドルまでの再テストにつながる可能性があるため、トレーダーはボラティリティに注意する必要があります。出来高が維持されている限り、マクロのトレンドは強気のままです。
いいね、フォロー、シェアを忘れないでください! 🩸 どうもありがとうございます ❤️
#CircleMints500MUSDCOnSolana #PolymarketBankFailureBetsDrawFDICConcern #BlackRockBuildsTokenizedPortfoliosForOndo #BitwiseFilesToListNEARETFOnNYSEArca
$SUI
SUIの直近の1.18ドルまでの上昇は、強力なファンダメンタルの改善と戦略的な資本流入が組み合わさったことによってもたらされています。主要なきっかけは、SuiがゲームfiおよびDeFiインフラへ積極的に踏み込んでいる点です。最近のネットワークのアップグレードによりレイテンシーが大幅に低下し、Suiが高速なオンチェーン・ゲーミングの有力候補として位置付けられました。現在、このテーマは大きな市場の注目を集めています。
機関投資家からの支援は2つ目の柱です。戦略的パートナーシップとベンチャーキャピタルの資金注入によって流動性が押し上げられており、SuiのDeFiプロトコルにおけるTVL(Total Value Locked:総ロック額)も急増しています。これは投機的な煽りだけでなく、実際のユースケースの存在を示すサインです。さらに、このトークンが1.15ドルの重要なレジスタンスを上抜けたことでテクニカル・ブレイクアウトが発生し、ショートスクイーズ(買い戻しによるショートの巻き戻し)を引き起こして上昇モメンタムを増幅させました。
今後の見通し
もしSUIが1.15ドルのサポートを維持できるなら、次の目標は24時間高値の1.2179ドルです。ただし、ここでのリジェクト(反落)が起きると1.09ドルまでの再テストにつながる可能性があるため、トレーダーはボラティリティに注意する必要があります。出来高が維持されている限り、マクロのトレンドは強気のままです。
いいね、フォロー、シェアを忘れないでください! 🩸 どうもありがとうございます ❤️
#CircleMints500MUSDCOnSolana #PolymarketBankFailureBetsDrawFDICConcern #BlackRockBuildsTokenizedPortfoliosForOndo #BitwiseFilesToListNEARETFOnNYSEArca
75
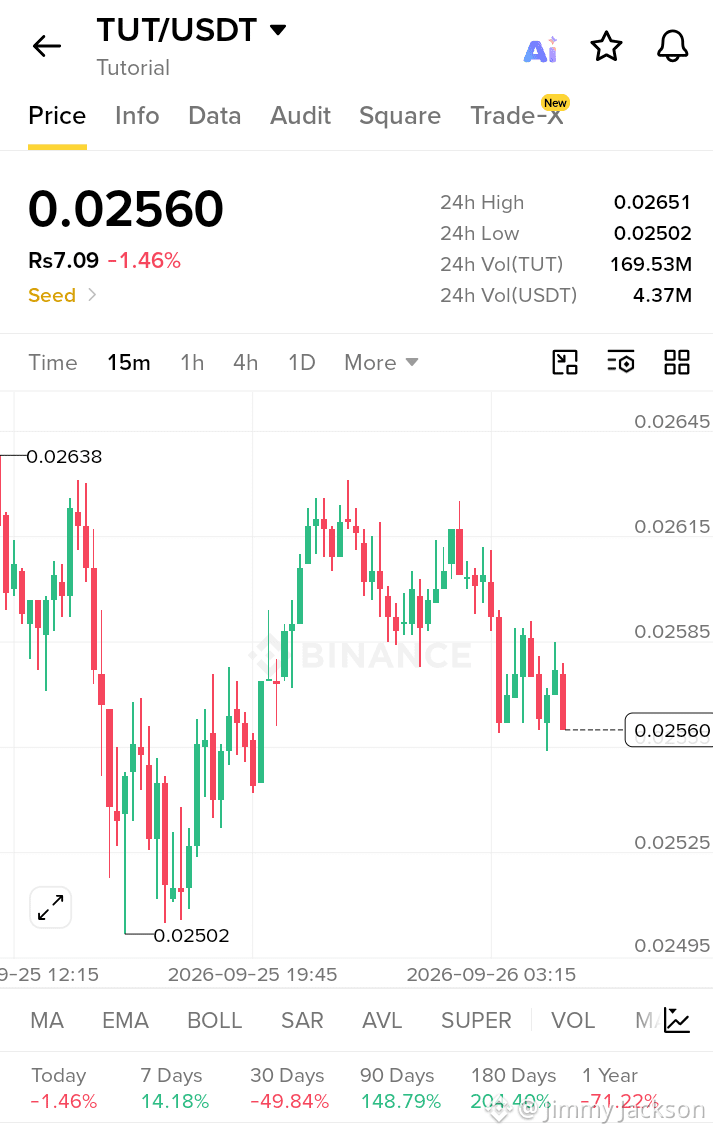
TUT/USDT ポンプ分析:トレンドは反転しているのか? 🚀
$TUT
{spot}(TUTUSDT)
15分足のTUT/USDTチャートでは、典型的なボラティリティ・スクイーズと反転の可能性を示すパターンが見られます。24時間の変化は-1.46%ですが、直近の値動きはより深いレジリエンス(粘り強さ)を物語っています。
なぜポンプ?
1. 強いサポート防衛:このアセットは0.02502のフロアを見事に守り切りました。この心理的サポートが買い注文の波を引き起こし、ローカルのダブルボトムを形成しました。
2. 値ごろ感(オーバーソールド)からのリバウンド:0.02651の高値から急激に下落した後、短期指標は売り手の疲弊(売りの限界)を示していました。その結果、リリーフ・ラリーが起こり、価格は0.02560まで押し戻されました。
3. ボリュームの注入:日足が赤いものの、24時間出来高は169.53M TUTで、高い流動性が確認できます。クジラはこうした「Seed(種まき)」段階の調整局面で集めることが多く、売り圧が枯れると鋭いポンプにつながりやすいです。
詳細分析 & 新情報
180日間のパフォーマンス(+204.40%)を見てください。この巨大なマクロ上昇トレンドは、直近30日の冷え込み(-49.84%)にもかかわらず維持されています。つまり、今回のポンプはドロップ後の「死んだ猫の跳ね返り」か、あるいは初期のトレンド反転である可能性があります。確定したブレイクアウトのためには、強気派(ブル)が出来高を伴って0.02600の水準を取り戻す必要があります。もし拒否されるなら、0.02500ゾーンの再テストを想定してください。
結論
高リスク・高リターンです。トレンド転換を確認するために、0.02638を上抜けるブレイクアウトに注目してください。
いいね、フォロー、シェアを忘れずに! 🩸 ありがとうございます ❤️
#BitwiseFilesToListNEARETFOnNYSEArca #SECCommissionerPeirceToLeaveOct2 #SECSaysBuybacksUpgradesDontMakeTokenSecurity
TUT/USDT ポンプ分析:トレンドは反転しているのか? 🚀
$TUT
15分足のTUT/USDTチャートでは、典型的なボラティリティ・スクイーズと反転の可能性を示すパターンが見られます。24時間の変化は-1.46%ですが、直近の値動きはより深いレジリエンス(粘り強さ)を物語っています。
なぜポンプ?
1. 強いサポート防衛:このアセットは0.02502のフロアを見事に守り切りました。この心理的サポートが買い注文の波を引き起こし、ローカルのダブルボトムを形成しました。
2. 値ごろ感(オーバーソールド)からのリバウンド:0.02651の高値から急激に下落した後、短期指標は売り手の疲弊(売りの限界)を示していました。その結果、リリーフ・ラリーが起こり、価格は0.02560まで押し戻されました。
3. ボリュームの注入:日足が赤いものの、24時間出来高は169.53M TUTで、高い流動性が確認できます。クジラはこうした「Seed(種まき)」段階の調整局面で集めることが多く、売り圧が枯れると鋭いポンプにつながりやすいです。
詳細分析 & 新情報
180日間のパフォーマンス(+204.40%)を見てください。この巨大なマクロ上昇トレンドは、直近30日の冷え込み(-49.84%)にもかかわらず維持されています。つまり、今回のポンプはドロップ後の「死んだ猫の跳ね返り」か、あるいは初期のトレンド反転である可能性があります。確定したブレイクアウトのためには、強気派(ブル)が出来高を伴って0.02600の水準を取り戻す必要があります。もし拒否されるなら、0.02500ゾーンの再テストを想定してください。
結論
高リスク・高リターンです。トレンド転換を確認するために、0.02638を上抜けるブレイクアウトに注目してください。
いいね、フォロー、シェアを忘れずに! 🩸 ありがとうございます ❤️
#BitwiseFilesToListNEARETFOnNYSEArca #SECCommissionerPeirceToLeaveOct2 #SECSaysBuybacksUpgradesDontMakeTokenSecurity
$TUT
15分足のTUT/USDTチャートでは、典型的なボラティリティ・スクイーズと反転の可能性を示すパターンが見られます。24時間の変化は-1.46%ですが、直近の値動きはより深いレジリエンス(粘り強さ)を物語っています。
なぜポンプ?
1. 強いサポート防衛:このアセットは0.02502のフロアを見事に守り切りました。この心理的サポートが買い注文の波を引き起こし、ローカルのダブルボトムを形成しました。
2. 値ごろ感(オーバーソールド)からのリバウンド:0.02651の高値から急激に下落した後、短期指標は売り手の疲弊(売りの限界)を示していました。その結果、リリーフ・ラリーが起こり、価格は0.02560まで押し戻されました。
3. ボリュームの注入:日足が赤いものの、24時間出来高は169.53M TUTで、高い流動性が確認できます。クジラはこうした「Seed(種まき)」段階の調整局面で集めることが多く、売り圧が枯れると鋭いポンプにつながりやすいです。
詳細分析 & 新情報
180日間のパフォーマンス(+204.40%)を見てください。この巨大なマクロ上昇トレンドは、直近30日の冷え込み(-49.84%)にもかかわらず維持されています。つまり、今回のポンプはドロップ後の「死んだ猫の跳ね返り」か、あるいは初期のトレンド反転である可能性があります。確定したブレイクアウトのためには、強気派(ブル)が出来高を伴って0.02600の水準を取り戻す必要があります。もし拒否されるなら、0.02500ゾーンの再テストを想定してください。
結論
高リスク・高リターンです。トレンド転換を確認するために、0.02638を上抜けるブレイクアウトに注目してください。
いいね、フォロー、シェアを忘れずに! 🩸 ありがとうございます ❤️
#BitwiseFilesToListNEARETFOnNYSEArca #SECCommissionerPeirceToLeaveOct2 #SECSaysBuybacksUpgradesDontMakeTokenSecurity
312
🚨 世界のディーゼル市場が出血している——そして見出しが示す以上に悪い
世界のディーゼル市場で歴史的なことが起きているのに、ほとんど注目されていません。 🛢️
$LOKA
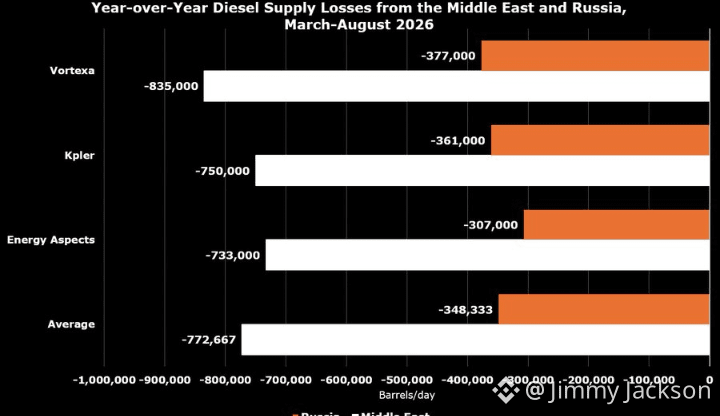
2026年3月から8月にかけて、Vortexaの追跡データによると、ディーゼルの中東からの流出は、2025年の同期間と比べて平均835,000バレル/日減少しました。これだけでも深刻な打撃です。ですが、それは単独ではありません。
ロシアのディーゼル輸出も同期間に大幅に減少しました——こちらはVortexaによれば377,000バレル/日減。 ⚠️
そして、ここからが面白い点です。同じように暗い物語でも、データ会社によって微妙に違うバージョンが示されています。
$KP3R
Kplerは中東の下落を750,000bpd、ロシアを361,000bpdとしています。Energy Aspectsはそれぞれ733,000bpdと307,000bpdと推定。これら3つの独立した見積もりの平均を取ると、中東で失われたのは約772,667bpd、ロシアで失われたのは約348,333bpdとなります。
これは合計で約110万バレル/日の供給不足です。 🤯
イメージするなら、110万バレル/日という量は、多くの国が1日で消費するディーゼル量より多いほどです。単なる誤差ではありません。世界のサプライチェーンに構造的な穴が空いています。
状況はさらに悪化しています。ロシアがディーゼル輸出禁止を実施した後、同国の出荷は7月と8月にかけて、前年同期比で平均615,000バレル/日分急落しました。これは「ゆるやかな悪化」ではなく「急激な加速」です。 📉
$DIA
{spot}(DIAUSDT)
ディーゼルは世界を動かし続けます——トラック、鉄道、船、農業、工場、そしてバックアップ用の電源網まで、それに依存しています。供給が、世界でも特に重要な輸出地域の2つで同時にこれほどまでに引き締まると、その波及効果は、運賃から食料価格まであらゆるところに及びます。 🚚🌾
世界のディーゼル危機はもはや「迫りつつある」わけではありません。もう始まっていて、毎月深刻さを増しています。
ぜひ「いいね」、フォロー、シェアをお願いします! 🩸 本当にありがとうございます ❤️
#BitwiseFilesToListNEARETFOnNYSEArca
🚨 世界のディーゼル市場が出血している——そして見出しが示す以上に悪い
世界のディーゼル市場で歴史的なことが起きているのに、ほとんど注目されていません。 🛢️
$LOKA
2026年3月から8月にかけて、Vortexaの追跡データによると、ディーゼルの中東からの流出は、2025年の同期間と比べて平均835,000バレル/日減少しました。これだけでも深刻な打撃です。ですが、それは単独ではありません。
ロシアのディーゼル輸出も同期間に大幅に減少しました——こちらはVortexaによれば377,000バレル/日減。 ⚠️
そして、ここからが面白い点です。同じように暗い物語でも、データ会社によって微妙に違うバージョンが示されています。
$KP3R
Kplerは中東の下落を750,000bpd、ロシアを361,000bpdとしています。Energy Aspectsはそれぞれ733,000bpdと307,000bpdと推定。これら3つの独立した見積もりの平均を取ると、中東で失われたのは約772,667bpd、ロシアで失われたのは約348,333bpdとなります。
これは合計で約110万バレル/日の供給不足です。 🤯
イメージするなら、110万バレル/日という量は、多くの国が1日で消費するディーゼル量より多いほどです。単なる誤差ではありません。世界のサプライチェーンに構造的な穴が空いています。
状況はさらに悪化しています。ロシアがディーゼル輸出禁止を実施した後、同国の出荷は7月と8月にかけて、前年同期比で平均615,000バレル/日分急落しました。これは「ゆるやかな悪化」ではなく「急激な加速」です。 📉
$DIA
ディーゼルは世界を動かし続けます——トラック、鉄道、船、農業、工場、そしてバックアップ用の電源網まで、それに依存しています。供給が、世界でも特に重要な輸出地域の2つで同時にこれほどまでに引き締まると、その波及効果は、運賃から食料価格まであらゆるところに及びます。 🚚🌾
世界のディーゼル危機はもはや「迫りつつある」わけではありません。もう始まっていて、毎月深刻さを増しています。
ぜひ「いいね」、フォロー、シェアをお願いします! 🩸 本当にありがとうございます ❤️
#BitwiseFilesToListNEARETFOnNYSEArca
世界のディーゼル市場で歴史的なことが起きているのに、ほとんど注目されていません。 🛢️
$LOKA
2026年3月から8月にかけて、Vortexaの追跡データによると、ディーゼルの中東からの流出は、2025年の同期間と比べて平均835,000バレル/日減少しました。これだけでも深刻な打撃です。ですが、それは単独ではありません。
ロシアのディーゼル輸出も同期間に大幅に減少しました——こちらはVortexaによれば377,000バレル/日減。 ⚠️
そして、ここからが面白い点です。同じように暗い物語でも、データ会社によって微妙に違うバージョンが示されています。
$KP3R
Kplerは中東の下落を750,000bpd、ロシアを361,000bpdとしています。Energy Aspectsはそれぞれ733,000bpdと307,000bpdと推定。これら3つの独立した見積もりの平均を取ると、中東で失われたのは約772,667bpd、ロシアで失われたのは約348,333bpdとなります。
これは合計で約110万バレル/日の供給不足です。 🤯
イメージするなら、110万バレル/日という量は、多くの国が1日で消費するディーゼル量より多いほどです。単なる誤差ではありません。世界のサプライチェーンに構造的な穴が空いています。
状況はさらに悪化しています。ロシアがディーゼル輸出禁止を実施した後、同国の出荷は7月と8月にかけて、前年同期比で平均615,000バレル/日分急落しました。これは「ゆるやかな悪化」ではなく「急激な加速」です。 📉
$DIA
ディーゼルは世界を動かし続けます——トラック、鉄道、船、農業、工場、そしてバックアップ用の電源網まで、それに依存しています。供給が、世界でも特に重要な輸出地域の2つで同時にこれほどまでに引き締まると、その波及効果は、運賃から食料価格まであらゆるところに及びます。 🚚🌾
世界のディーゼル危機はもはや「迫りつつある」わけではありません。もう始まっていて、毎月深刻さを増しています。
ぜひ「いいね」、フォロー、シェアをお願いします! 🩸 本当にありがとうございます ❤️
#BitwiseFilesToListNEARETFOnNYSEArca
130
🚨 ビットコインの“静かな大多数”:なぜ全BTCの81%が6か月以上動いていないのか 🚨
$BTC
{spot}(BTCUSDT)
ここで、いったん立ち止まって市場の“表に出ない部分”で本当に何が起きているのか考えてみてほしい事実があります。👀
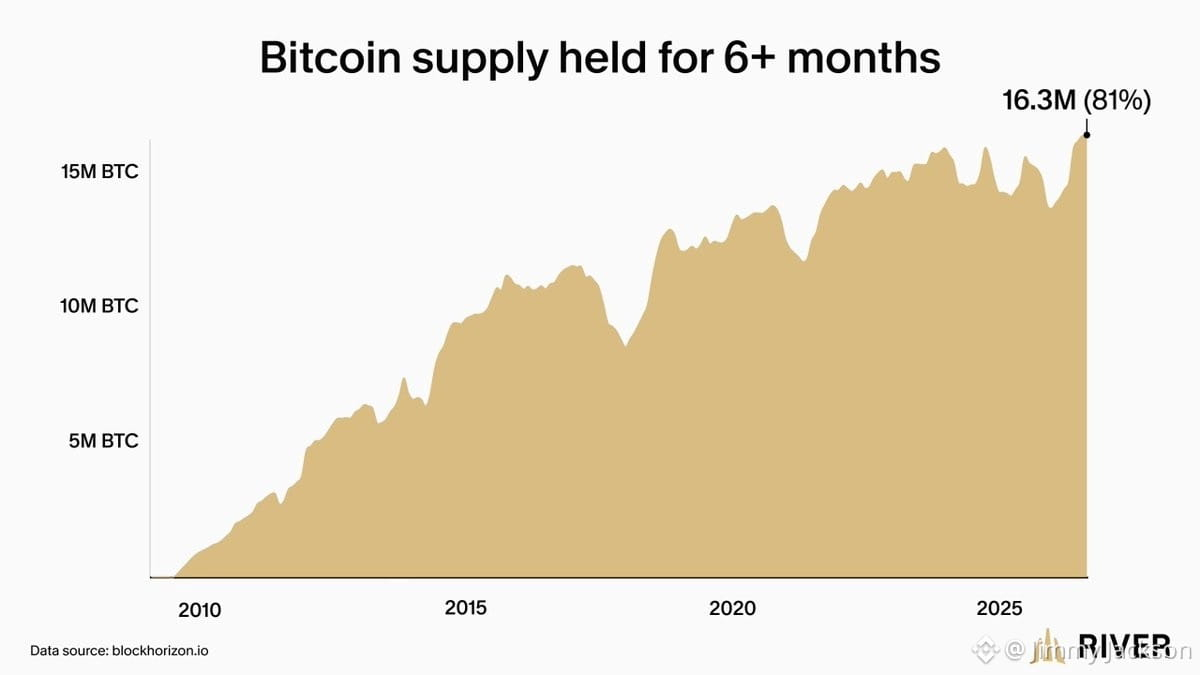
全ビットコインのうち、巨大な81%が少なくとも6か月間ウォレットからまったく動いていません。これは単なる数字ではなく、メッセージです。つまり、圧倒的多数のコインは、近い将来に売る気のない人々の手に“置かれ続けている”ということを示しています。💎🙌
$DCR
{spot}(DCRUSDT)
2020年以来、長期保有者はこっそりと3百万BTC以上を積み上げてきました。一方で、今年前半に古いウォレットから出ていったのは約30万BTCほどにとどまります。これは、ほぼ長期保有前提で駐車されたままのコインの海に比べれば、ほんの“わずかな流れ”です。ここにある忍耐力は圧巻です。🧘♂️
そして、ここからが面白いところです。River Financialによると、個人投資家は2026年上半期に純ベースで14万BTCを手放したものの、Q3では10.7万BTC以上を買い戻したとのことです。これは典型的な「安く売って、高く買い戻す」パターン—私たち全員がどこかの時点でやってしまったことがあるやつです。😅
$BNB
{spot}(BNBUSDT)
でも、少し視点を引いてみましょう。長期保有者が積極的に買い増している一方で、短期のトレーダーは売買を行ったり来たりしているのを見ると、はっきりした構図が見えてきます。ビットコインのことを本当に理解している人たちは手放していない。彼らは下落のたびに“贈り物”のように受け止めていて、その確信はむしろ強まっています。🎯
では自問してみてください。あなたは騒音に反応しているだけですか? それとも、何年も先に誇れる形でポジションを築いていますか?データは、賢い資金がすでに選択を済ませていることを示唆しています。🤔
いいね、フォロー、シェアを忘れないでください! 🩸 本当にありがとうございます ❤️
#BitwiseFilesToListNEARETFOnNYSEArca #SECCommissionerPeirceToLeaveOct2 #SECSaysBuybacksUpgradesDontMakeTokenSecurity #CircleTetherFreezeBitgetHackerWallet #CoinMarketCapCompletesCoinglassAcquisition
🚨 ビットコインの“静かな大多数”:なぜ全BTCの81%が6か月以上動いていないのか 🚨
$BTC
ここで、いったん立ち止まって市場の“表に出ない部分”で本当に何が起きているのか考えてみてほしい事実があります。👀
全ビットコインのうち、巨大な81%が少なくとも6か月間ウォレットからまったく動いていません。これは単なる数字ではなく、メッセージです。つまり、圧倒的多数のコインは、近い将来に売る気のない人々の手に“置かれ続けている”ということを示しています。💎🙌
$DCR
2020年以来、長期保有者はこっそりと3百万BTC以上を積み上げてきました。一方で、今年前半に古いウォレットから出ていったのは約30万BTCほどにとどまります。これは、ほぼ長期保有前提で駐車されたままのコインの海に比べれば、ほんの“わずかな流れ”です。ここにある忍耐力は圧巻です。🧘♂️
そして、ここからが面白いところです。River Financialによると、個人投資家は2026年上半期に純ベースで14万BTCを手放したものの、Q3では10.7万BTC以上を買い戻したとのことです。これは典型的な「安く売って、高く買い戻す」パターン—私たち全員がどこかの時点でやってしまったことがあるやつです。😅
$BNB
でも、少し視点を引いてみましょう。長期保有者が積極的に買い増している一方で、短期のトレーダーは売買を行ったり来たりしているのを見ると、はっきりした構図が見えてきます。ビットコインのことを本当に理解している人たちは手放していない。彼らは下落のたびに“贈り物”のように受け止めていて、その確信はむしろ強まっています。🎯
では自問してみてください。あなたは騒音に反応しているだけですか? それとも、何年も先に誇れる形でポジションを築いていますか?データは、賢い資金がすでに選択を済ませていることを示唆しています。🤔
いいね、フォロー、シェアを忘れないでください! 🩸 本当にありがとうございます ❤️
#BitwiseFilesToListNEARETFOnNYSEArca #SECCommissionerPeirceToLeaveOct2 #SECSaysBuybacksUpgradesDontMakeTokenSecurity #CircleTetherFreezeBitgetHackerWallet #CoinMarketCapCompletesCoinglassAcquisition
$BTC
ここで、いったん立ち止まって市場の“表に出ない部分”で本当に何が起きているのか考えてみてほしい事実があります。👀
全ビットコインのうち、巨大な81%が少なくとも6か月間ウォレットからまったく動いていません。これは単なる数字ではなく、メッセージです。つまり、圧倒的多数のコインは、近い将来に売る気のない人々の手に“置かれ続けている”ということを示しています。💎🙌
$DCR
2020年以来、長期保有者はこっそりと3百万BTC以上を積み上げてきました。一方で、今年前半に古いウォレットから出ていったのは約30万BTCほどにとどまります。これは、ほぼ長期保有前提で駐車されたままのコインの海に比べれば、ほんの“わずかな流れ”です。ここにある忍耐力は圧巻です。🧘♂️
そして、ここからが面白いところです。River Financialによると、個人投資家は2026年上半期に純ベースで14万BTCを手放したものの、Q3では10.7万BTC以上を買い戻したとのことです。これは典型的な「安く売って、高く買い戻す」パターン—私たち全員がどこかの時点でやってしまったことがあるやつです。😅
$BNB
でも、少し視点を引いてみましょう。長期保有者が積極的に買い増している一方で、短期のトレーダーは売買を行ったり来たりしているのを見ると、はっきりした構図が見えてきます。ビットコインのことを本当に理解している人たちは手放していない。彼らは下落のたびに“贈り物”のように受け止めていて、その確信はむしろ強まっています。🎯
では自問してみてください。あなたは騒音に反応しているだけですか? それとも、何年も先に誇れる形でポジションを築いていますか?データは、賢い資金がすでに選択を済ませていることを示唆しています。🤔
いいね、フォロー、シェアを忘れないでください! 🩸 本当にありがとうございます ❤️
#BitwiseFilesToListNEARETFOnNYSEArca #SECCommissionerPeirceToLeaveOct2 #SECSaysBuybacksUpgradesDontMakeTokenSecurity #CircleTetherFreezeBitgetHackerWallet #CoinMarketCapCompletesCoinglassAcquisition
282
🚨 米国債利回りが止められない勢いで急騰中
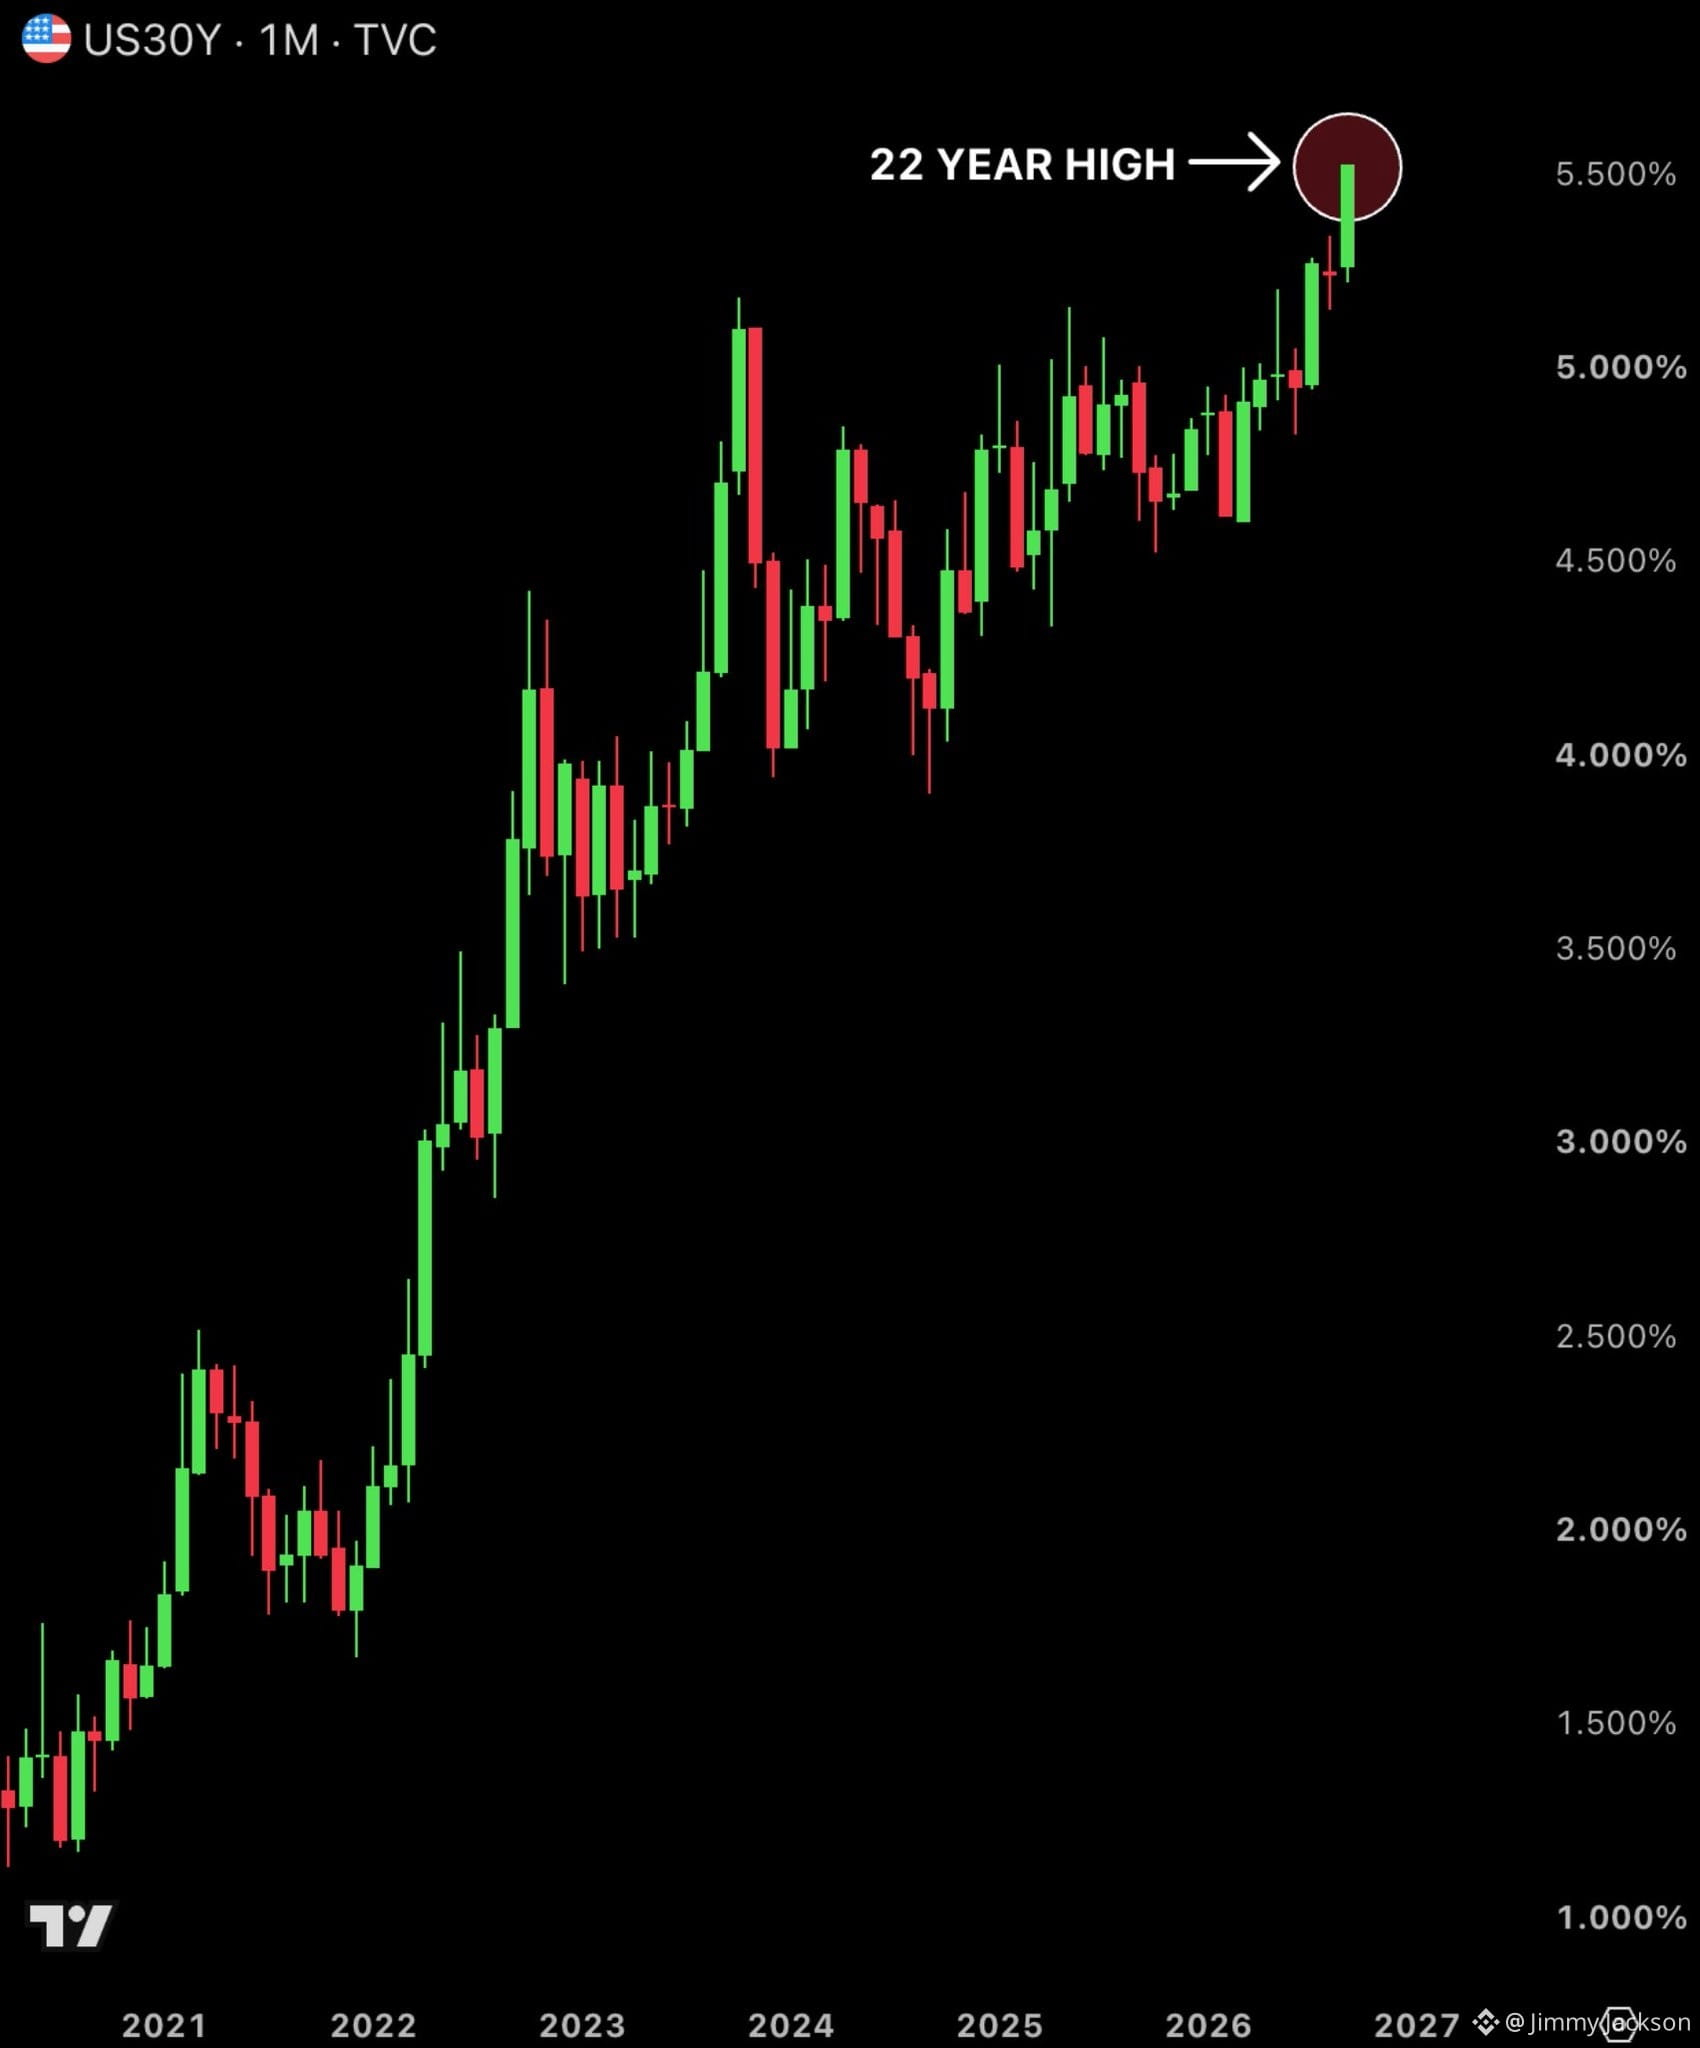
いま米国債利回りを抑え込むのは単純に無理です。30年国債の利回りは5.525%まで上昇し、22年ぶりの高水準に到達しました。📈
$GSB
{spot}(GSBUSDT)
特に目を引くのは勢いです。これらの利回りは、まるで最も熱いAI関連株のように動いており、市場が何を投げかけても上昇を続けています。減速する気配がありません。🔥
$TRX
{spot}(TRXUSDT)
金利を注視している人にとって、これは細かく注意して見守る価値のある局面です。長期利回りがここまで明確に動くと、その波及効果はあらゆるところに及びます――調達コスト、住宅ローン金利、株式のバリュエーション、そしてより広い経済見通しまで。債券市場ははっきりと強いメッセージを送っており、投資家が無視できない内容です。💡
$TON
いいね、フォロー、シェアを忘れずに!🩸 どうもありがとうございます ❤️
#QNTRises39% #BitgetBreachForgedRequestsNotStolenKeys #BitcoinSpotETFsTurnNetPositiveYTD
🚨 米国債利回りが止められない勢いで急騰中
いま米国債利回りを抑え込むのは単純に無理です。30年国債の利回りは5.525%まで上昇し、22年ぶりの高水準に到達しました。📈
$GSB
特に目を引くのは勢いです。これらの利回りは、まるで最も熱いAI関連株のように動いており、市場が何を投げかけても上昇を続けています。減速する気配がありません。🔥
$TRX
金利を注視している人にとって、これは細かく注意して見守る価値のある局面です。長期利回りがここまで明確に動くと、その波及効果はあらゆるところに及びます――調達コスト、住宅ローン金利、株式のバリュエーション、そしてより広い経済見通しまで。債券市場ははっきりと強いメッセージを送っており、投資家が無視できない内容です。💡
$TON
いいね、フォロー、シェアを忘れずに!🩸 どうもありがとうございます ❤️
#QNTRises39% #BitgetBreachForgedRequestsNotStolenKeys #BitcoinSpotETFsTurnNetPositiveYTD
いま米国債利回りを抑え込むのは単純に無理です。30年国債の利回りは5.525%まで上昇し、22年ぶりの高水準に到達しました。📈
$GSB
特に目を引くのは勢いです。これらの利回りは、まるで最も熱いAI関連株のように動いており、市場が何を投げかけても上昇を続けています。減速する気配がありません。🔥
$TRX
金利を注視している人にとって、これは細かく注意して見守る価値のある局面です。長期利回りがここまで明確に動くと、その波及効果はあらゆるところに及びます――調達コスト、住宅ローン金利、株式のバリュエーション、そしてより広い経済見通しまで。債券市場ははっきりと強いメッセージを送っており、投資家が無視できない内容です。💡
$TON
いいね、フォロー、シェアを忘れずに!🩸 どうもありがとうございます ❤️
#QNTRises39% #BitgetBreachForgedRequestsNotStolenKeys #BitcoinSpotETFsTurnNetPositiveYTD
120
🚨 市場は今、何か大きなことを隠している
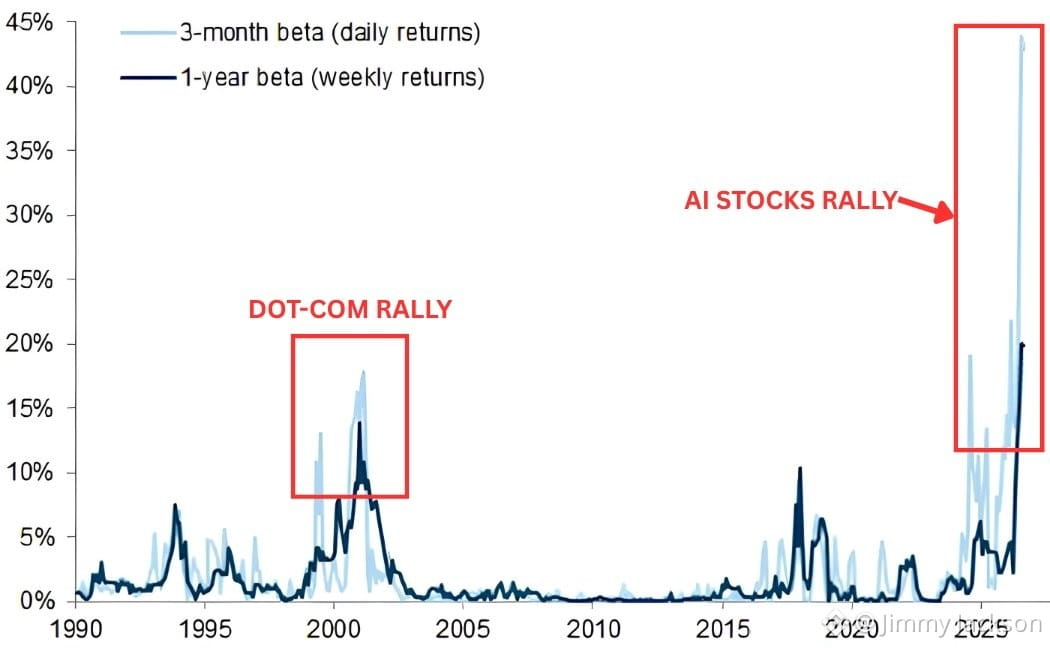
S&P 500は史上最高値のすぐ近くにありますが、内側をのぞくと状況は急速に変わります。
$NERV.US
{stock_us}(NERV.US)
指数内の株のほぼ半分が、もはやより広い市場の動きと足並みをそろえていません。このような分断は珍しく、ゴールドマン・サックスはこれがテック・バブルのときに見られたものにかなり似ていると指摘しています。👀
原因は? 極端な集中です。
上位10社が、S&P 500全体の約40%を占めるようになり、その多くはAI関連の取引と直結しています。規模があまりに大きいため、指数をほぼ単独で押し上げることができる一方で、市場の大半は静かに苦境に陥っています。
$MUBARAK
{spot}(MUBARAKUSDT)
一方で、残りの約490銘柄はまったく別の現実に直面しています。金利上昇、原油が100ドル超、より強いドル、そして借り入れコストの上昇です。💸
これらの要因は、金利、エネルギー価格、そして景気全体に敏感な企業を最も直撃します。
つまり、S&P 500が史上最高値近辺で推移しているという見出しを見るときは覚えておいてください——その強さを支えているのは、ほんの一握りの巨人たちです。平均的な株が好調だという意味ではありません。むしろ、多くは逆方向に動いています。📉
$XRP
{spot}(XRPUSDT)
これは“2つの物語”の市場です。誰もが見ている指数の物語と、多くの株が実際に生きている現実です。
いいね、フォロー、シェアを忘れないでください!🩸 どうもありがとうございます ❤️
#QNTRises39% #BitgetBreachForgedRequestsNotStolenKeys #BitcoinSpotETFsTurnNetPositiveYTD #CFTCUpdatesGuidanceOnTokenizedAssets
🚨 市場は今、何か大きなことを隠している
S&P 500は史上最高値のすぐ近くにありますが、内側をのぞくと状況は急速に変わります。
$NERV.US
指数内の株のほぼ半分が、もはやより広い市場の動きと足並みをそろえていません。このような分断は珍しく、ゴールドマン・サックスはこれがテック・バブルのときに見られたものにかなり似ていると指摘しています。👀
原因は? 極端な集中です。
上位10社が、S&P 500全体の約40%を占めるようになり、その多くはAI関連の取引と直結しています。規模があまりに大きいため、指数をほぼ単独で押し上げることができる一方で、市場の大半は静かに苦境に陥っています。
$MUBARAK
一方で、残りの約490銘柄はまったく別の現実に直面しています。金利上昇、原油が100ドル超、より強いドル、そして借り入れコストの上昇です。💸
これらの要因は、金利、エネルギー価格、そして景気全体に敏感な企業を最も直撃します。
つまり、S&P 500が史上最高値近辺で推移しているという見出しを見るときは覚えておいてください——その強さを支えているのは、ほんの一握りの巨人たちです。平均的な株が好調だという意味ではありません。むしろ、多くは逆方向に動いています。📉
$XRP
これは“2つの物語”の市場です。誰もが見ている指数の物語と、多くの株が実際に生きている現実です。
いいね、フォロー、シェアを忘れないでください!🩸 どうもありがとうございます ❤️
#QNTRises39% #BitgetBreachForgedRequestsNotStolenKeys #BitcoinSpotETFsTurnNetPositiveYTD #CFTCUpdatesGuidanceOnTokenizedAssets
S&P 500は史上最高値のすぐ近くにありますが、内側をのぞくと状況は急速に変わります。
$NERV.US
指数内の株のほぼ半分が、もはやより広い市場の動きと足並みをそろえていません。このような分断は珍しく、ゴールドマン・サックスはこれがテック・バブルのときに見られたものにかなり似ていると指摘しています。👀
原因は? 極端な集中です。
上位10社が、S&P 500全体の約40%を占めるようになり、その多くはAI関連の取引と直結しています。規模があまりに大きいため、指数をほぼ単独で押し上げることができる一方で、市場の大半は静かに苦境に陥っています。
$MUBARAK
一方で、残りの約490銘柄はまったく別の現実に直面しています。金利上昇、原油が100ドル超、より強いドル、そして借り入れコストの上昇です。💸
これらの要因は、金利、エネルギー価格、そして景気全体に敏感な企業を最も直撃します。
つまり、S&P 500が史上最高値近辺で推移しているという見出しを見るときは覚えておいてください——その強さを支えているのは、ほんの一握りの巨人たちです。平均的な株が好調だという意味ではありません。むしろ、多くは逆方向に動いています。📉
$XRP
これは“2つの物語”の市場です。誰もが見ている指数の物語と、多くの株が実際に生きている現実です。
いいね、フォロー、シェアを忘れないでください!🩸 どうもありがとうございます ❤️
#QNTRises39% #BitgetBreachForgedRequestsNotStolenKeys #BitcoinSpotETFsTurnNetPositiveYTD #CFTCUpdatesGuidanceOnTokenizedAssets
300
本人確認中
🚨 債券市場が悲鳴を上げている――そしてワシントンはもう無視できない
あなたの思考を本当に止めるべき、少し視点を変えて考えてみましょう。🧵
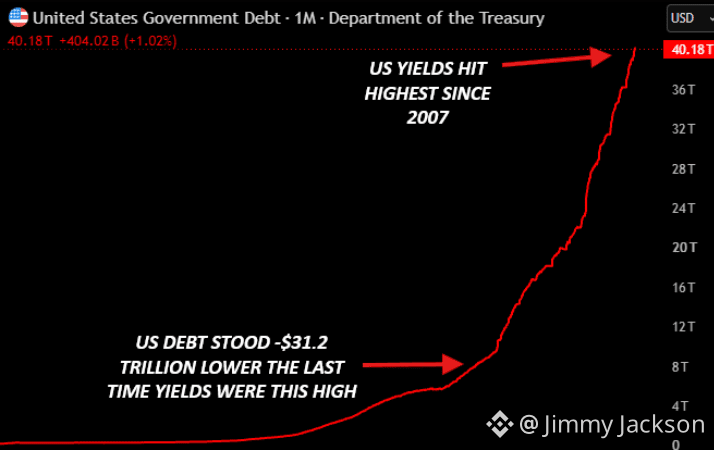
米国債利回りが今日と同じ水準にあったとき、アメリカの総国債残高はわずか89兆ドルでした。
$BTC
{spot}(BTCUSDT)
そして今はどうでしょう。40.1兆ドルです。つまり、31.2兆ドルの増加――当時の4.5倍以上にまで負債が膨れ上がっています。📈
では、なぜこれほど重要なのか? 債務を返済(サービス)するための計算が、完全に変わってしまったからです。
$YB
{spot}(YBUSDT)
私たちの負債を「抱えるコスト」の平均が1%上がるごとに、利息として年間約4,010億ドル(約4010億ドル)の負担増になります。2007年当時の同じ1ポイントの動きでは、約890億ドルにしか相当しませんでした。
引き算してみれば、借入コストが1%上昇するたびに、年間の利息負担が追加で3120億ドル増える計算です。💸
これは単なる誤差じゃありません。財政状況がいかに脆くなったかという、構造的な転換です。
そして多くの人が見落としているポイントがあります。利息の支払いは、道路を作ったり、学校を支えたり、国境を守ったりはしません。すでに使ったお金のために、ただ明かりをつけ続けるだけです。借金が増えれば増えるほど、他のあらゆる支出が押しのけられます――そしてワシントンは債券市場のわずかな反応(ちょっとした揺れ)にますます敏感になっていきます。
$NOT
{spot}(NOTUSDT)
結論は? 債券市場はもはや単なる背景のノイズではありません。主役です。しかも、ここ最近のどの時点よりも、いまの方が重要性が高い。🩸
いいね、フォロー、シェアを忘れないでください! 🩸 ありがとうございます❤️#QNTRises39% #BitgetBreachForgedRequestsNotStolenKeys #BitcoinSpotETFsTurnNetPositiveYTD #CFTCUpdatesGuidanceOnTokenizedAssets
🚨 債券市場が悲鳴を上げている――そしてワシントンはもう無視できない
あなたの思考を本当に止めるべき、少し視点を変えて考えてみましょう。🧵
米国債利回りが今日と同じ水準にあったとき、アメリカの総国債残高はわずか89兆ドルでした。
$BTC
そして今はどうでしょう。40.1兆ドルです。つまり、31.2兆ドルの増加――当時の4.5倍以上にまで負債が膨れ上がっています。📈
では、なぜこれほど重要なのか? 債務を返済(サービス)するための計算が、完全に変わってしまったからです。
$YB
私たちの負債を「抱えるコスト」の平均が1%上がるごとに、利息として年間約4,010億ドル(約4010億ドル)の負担増になります。2007年当時の同じ1ポイントの動きでは、約890億ドルにしか相当しませんでした。
引き算してみれば、借入コストが1%上昇するたびに、年間の利息負担が追加で3120億ドル増える計算です。💸
これは単なる誤差じゃありません。財政状況がいかに脆くなったかという、構造的な転換です。
そして多くの人が見落としているポイントがあります。利息の支払いは、道路を作ったり、学校を支えたり、国境を守ったりはしません。すでに使ったお金のために、ただ明かりをつけ続けるだけです。借金が増えれば増えるほど、他のあらゆる支出が押しのけられます――そしてワシントンは債券市場のわずかな反応(ちょっとした揺れ)にますます敏感になっていきます。
$NOT
結論は? 債券市場はもはや単なる背景のノイズではありません。主役です。しかも、ここ最近のどの時点よりも、いまの方が重要性が高い。🩸
いいね、フォロー、シェアを忘れないでください! 🩸 ありがとうございます❤️#QNTRises39% #BitgetBreachForgedRequestsNotStolenKeys #BitcoinSpotETFsTurnNetPositiveYTD #CFTCUpdatesGuidanceOnTokenizedAssets
あなたの思考を本当に止めるべき、少し視点を変えて考えてみましょう。🧵
米国債利回りが今日と同じ水準にあったとき、アメリカの総国債残高はわずか89兆ドルでした。
$BTC
そして今はどうでしょう。40.1兆ドルです。つまり、31.2兆ドルの増加――当時の4.5倍以上にまで負債が膨れ上がっています。📈
では、なぜこれほど重要なのか? 債務を返済(サービス)するための計算が、完全に変わってしまったからです。
$YB
私たちの負債を「抱えるコスト」の平均が1%上がるごとに、利息として年間約4,010億ドル(約4010億ドル)の負担増になります。2007年当時の同じ1ポイントの動きでは、約890億ドルにしか相当しませんでした。
引き算してみれば、借入コストが1%上昇するたびに、年間の利息負担が追加で3120億ドル増える計算です。💸
これは単なる誤差じゃありません。財政状況がいかに脆くなったかという、構造的な転換です。
そして多くの人が見落としているポイントがあります。利息の支払いは、道路を作ったり、学校を支えたり、国境を守ったりはしません。すでに使ったお金のために、ただ明かりをつけ続けるだけです。借金が増えれば増えるほど、他のあらゆる支出が押しのけられます――そしてワシントンは債券市場のわずかな反応(ちょっとした揺れ)にますます敏感になっていきます。
$NOT
結論は? 債券市場はもはや単なる背景のノイズではありません。主役です。しかも、ここ最近のどの時点よりも、いまの方が重要性が高い。🩸
いいね、フォロー、シェアを忘れないでください! 🩸 ありがとうございます❤️#QNTRises39% #BitgetBreachForgedRequestsNotStolenKeys #BitcoinSpotETFsTurnNetPositiveYTD #CFTCUpdatesGuidanceOnTokenizedAssets
653
なぜH(ハイアット)のポンプ?徹底分析
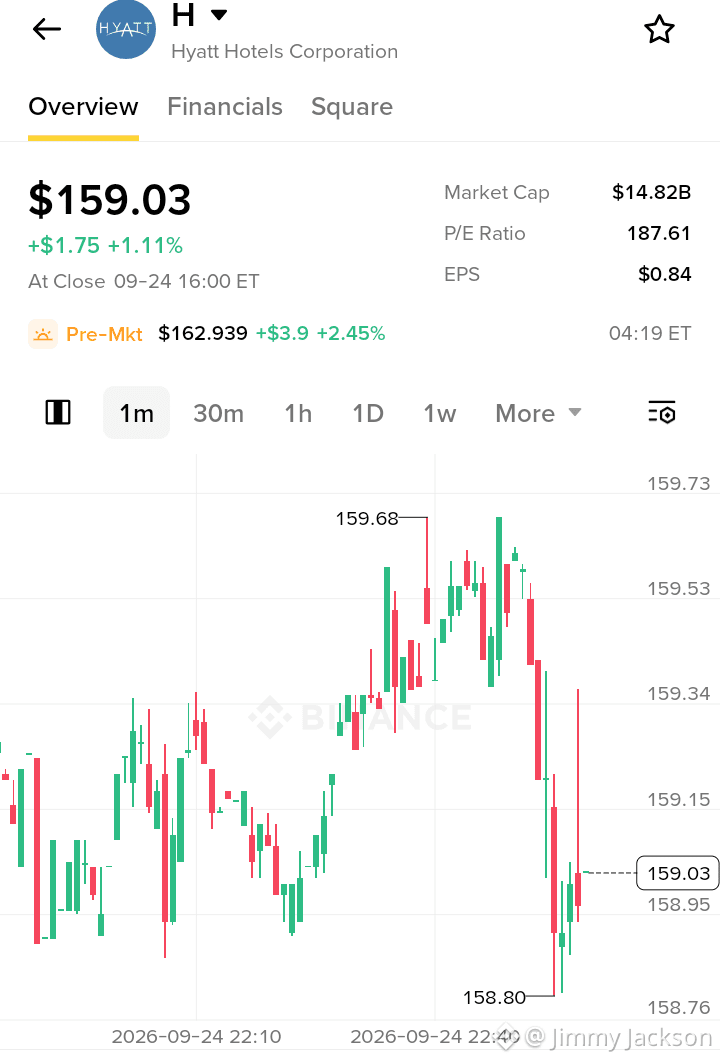
最近の1.11%の終値($159.03)に続き、強い2.45%の寄り前急騰で$162.93に到達したのは、典型的な「ショートスクイーズ」とセクター・ローテーションの組み合わせによるものです。
テクニカル・セットアップ:
1分足チャートを見ると、Hは$158.80で底を打ち、その後、強烈な買い圧力が入ってきました。寄り前のギャップアップは、機関投資家による積み増しを示唆します。P/Eが187.61であるため、従来のバリュエーションは大きく過熱しており、この動きは流動性主導であって、ファンダメンタルズ主導ではありません。低いフロートと高い評価額により、Hはボラティリティに非常に敏感です。
触媒(カタリスト):
市場では、旅行需要に対する「ソフトランディング」を織り込んでいます。最近の航空会社の決算や堅調な予約データは、消費者がいまだにレジャーを優先していることを示しています。さらに、金利(国債利回り)の低下により、配当を出すホスピタリティ株は、固定利付き商品よりも魅力的になります。寄り前の出来高は、$160という心理的レジスタンスを上抜けるアルゴリズム的ブレイクアウトを示しています。
トレーダー向けの新情報
$163.50の水準を注視してください。Hが寄り前の高値を上回って推移するなら、強気の反転が確認されます。とはいえ、EPSがわずか$0.84しかないため、マクロ面の弱さが出れば大きな急戻し(リトレース)を誘発します。これはバリューの保有(バリュー・ホールド)ではなく、モメンタム取引です。
ぜひ「いいね」「フォロー」「シェア」をお忘れなく!🩸 本当にありがとうございます❤️
#CFTCUpdatesGuidanceOnTokenizedAssets $
なぜH(ハイアット)のポンプ?徹底分析
最近の1.11%の終値($159.03)に続き、強い2.45%の寄り前急騰で$162.93に到達したのは、典型的な「ショートスクイーズ」とセクター・ローテーションの組み合わせによるものです。
テクニカル・セットアップ:
1分足チャートを見ると、Hは$158.80で底を打ち、その後、強烈な買い圧力が入ってきました。寄り前のギャップアップは、機関投資家による積み増しを示唆します。P/Eが187.61であるため、従来のバリュエーションは大きく過熱しており、この動きは流動性主導であって、ファンダメンタルズ主導ではありません。低いフロートと高い評価額により、Hはボラティリティに非常に敏感です。
触媒(カタリスト):
市場では、旅行需要に対する「ソフトランディング」を織り込んでいます。最近の航空会社の決算や堅調な予約データは、消費者がいまだにレジャーを優先していることを示しています。さらに、金利(国債利回り)の低下により、配当を出すホスピタリティ株は、固定利付き商品よりも魅力的になります。寄り前の出来高は、$160という心理的レジスタンスを上抜けるアルゴリズム的ブレイクアウトを示しています。
トレーダー向けの新情報
$163.50の水準を注視してください。Hが寄り前の高値を上回って推移するなら、強気の反転が確認されます。とはいえ、EPSがわずか$0.84しかないため、マクロ面の弱さが出れば大きな急戻し(リトレース)を誘発します。これはバリューの保有(バリュー・ホールド)ではなく、モメンタム取引です。
ぜひ「いいね」「フォロー」「シェア」をお忘れなく!🩸 本当にありがとうございます❤️
#CFTCUpdatesGuidanceOnTokenizedAssets $
最近の1.11%の終値($159.03)に続き、強い2.45%の寄り前急騰で$162.93に到達したのは、典型的な「ショートスクイーズ」とセクター・ローテーションの組み合わせによるものです。
テクニカル・セットアップ:
1分足チャートを見ると、Hは$158.80で底を打ち、その後、強烈な買い圧力が入ってきました。寄り前のギャップアップは、機関投資家による積み増しを示唆します。P/Eが187.61であるため、従来のバリュエーションは大きく過熱しており、この動きは流動性主導であって、ファンダメンタルズ主導ではありません。低いフロートと高い評価額により、Hはボラティリティに非常に敏感です。
触媒(カタリスト):
市場では、旅行需要に対する「ソフトランディング」を織り込んでいます。最近の航空会社の決算や堅調な予約データは、消費者がいまだにレジャーを優先していることを示しています。さらに、金利(国債利回り)の低下により、配当を出すホスピタリティ株は、固定利付き商品よりも魅力的になります。寄り前の出来高は、$160という心理的レジスタンスを上抜けるアルゴリズム的ブレイクアウトを示しています。
トレーダー向けの新情報
$163.50の水準を注視してください。Hが寄り前の高値を上回って推移するなら、強気の反転が確認されます。とはいえ、EPSがわずか$0.84しかないため、マクロ面の弱さが出れば大きな急戻し(リトレース)を誘発します。これはバリューの保有(バリュー・ホールド)ではなく、モメンタム取引です。
ぜひ「いいね」「フォロー」「シェア」をお忘れなく!🩸 本当にありがとうございます❤️
#CFTCUpdatesGuidanceOnTokenizedAssets $
245
ESP/USDT 価格ポンプ分析:なぜ突然の急騰?🚀
$ESP
{spot}(ESPUSDT)
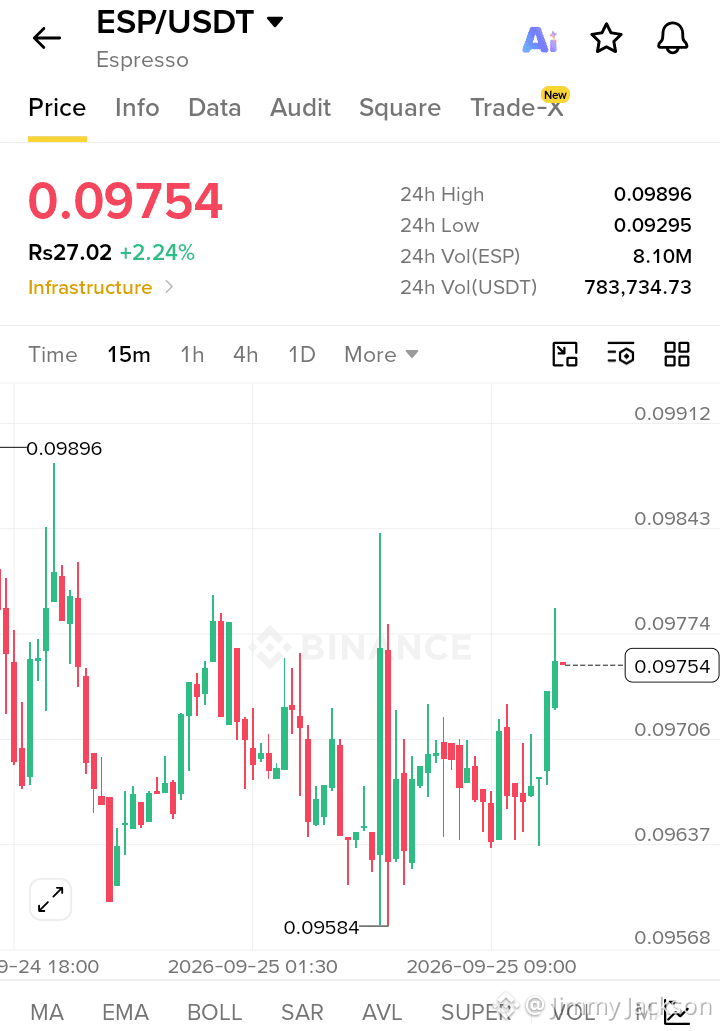
エスプレッソ(ESP)は現在、より広い市場のトレンドに逆らう形で上昇しており、+2.24%の0.09754ドルまで急伸しています。24時間の取引高は8.10M ESPと大きい一方で、テクニカル的には「ショートスクイーズ(踏み上げ)」と戦略的な積み増しが組み合わさった典型的な状況を示唆しています。
詳細分析
15分足を見ると、ESPはこのブレイクの前に0.09584ドルで堅いサポート基盤を形成しました。値動きは明確なV字回復を示しており、直近のレジスタンスを突き抜けています。今回のポンプは、ユーティリティ(インフラ)関連のトークンへ資金が回帰する「セクター・ローテーション」によって引き起こされている可能性が高いです。高値0.09896ドルは直近の上限として注目すべきポイントで、ここをきれいに上抜けできれば0.10ドル方向へのラリーにつながるかもしれません。
新情報:
オンチェーンデータでは、エスプレッソにおけるユニークなウォレット活動のスパイクが示されており、これは単なる見せ玉(ウォッシュトレーディング)ではなく、本物のエコシステムへの関心を示している可能性があります。さらに、バイナンスでの「Trade X」統合も可視性を高め、小口の個人投資家の勢いを引き寄せています。
戦略:
高値でFOMO(追いかけ買い)しないでください。健康的なエントリーとして、0.0965ドルのリテストを待ちましょう。出来高が維持されるなら、ESPは間もなく心理的節目の0.10ドルを再奪回する可能性があります。冷静に状況を見極め、リスク管理を徹底してください!
いいね、フォロー、シェアをお忘れなく!🩸 どうもありがとうございます❤️
#CFTCUpdatesGuidanceOnTokenizedAssets #BinanceWillListHyperliquid(HYPE) #FedProposesRulesForBankIssuedStablecoins
ESP/USDT 価格ポンプ分析:なぜ突然の急騰?🚀
$ESP
エスプレッソ(ESP)は現在、より広い市場のトレンドに逆らう形で上昇しており、+2.24%の0.09754ドルまで急伸しています。24時間の取引高は8.10M ESPと大きい一方で、テクニカル的には「ショートスクイーズ(踏み上げ)」と戦略的な積み増しが組み合わさった典型的な状況を示唆しています。
詳細分析
15分足を見ると、ESPはこのブレイクの前に0.09584ドルで堅いサポート基盤を形成しました。値動きは明確なV字回復を示しており、直近のレジスタンスを突き抜けています。今回のポンプは、ユーティリティ(インフラ)関連のトークンへ資金が回帰する「セクター・ローテーション」によって引き起こされている可能性が高いです。高値0.09896ドルは直近の上限として注目すべきポイントで、ここをきれいに上抜けできれば0.10ドル方向へのラリーにつながるかもしれません。
新情報:
オンチェーンデータでは、エスプレッソにおけるユニークなウォレット活動のスパイクが示されており、これは単なる見せ玉(ウォッシュトレーディング)ではなく、本物のエコシステムへの関心を示している可能性があります。さらに、バイナンスでの「Trade X」統合も可視性を高め、小口の個人投資家の勢いを引き寄せています。
戦略:
高値でFOMO(追いかけ買い)しないでください。健康的なエントリーとして、0.0965ドルのリテストを待ちましょう。出来高が維持されるなら、ESPは間もなく心理的節目の0.10ドルを再奪回する可能性があります。冷静に状況を見極め、リスク管理を徹底してください!
いいね、フォロー、シェアをお忘れなく!🩸 どうもありがとうございます❤️
#CFTCUpdatesGuidanceOnTokenizedAssets #BinanceWillListHyperliquid(HYPE) #FedProposesRulesForBankIssuedStablecoins
$ESP
エスプレッソ(ESP)は現在、より広い市場のトレンドに逆らう形で上昇しており、+2.24%の0.09754ドルまで急伸しています。24時間の取引高は8.10M ESPと大きい一方で、テクニカル的には「ショートスクイーズ(踏み上げ)」と戦略的な積み増しが組み合わさった典型的な状況を示唆しています。
詳細分析
15分足を見ると、ESPはこのブレイクの前に0.09584ドルで堅いサポート基盤を形成しました。値動きは明確なV字回復を示しており、直近のレジスタンスを突き抜けています。今回のポンプは、ユーティリティ(インフラ)関連のトークンへ資金が回帰する「セクター・ローテーション」によって引き起こされている可能性が高いです。高値0.09896ドルは直近の上限として注目すべきポイントで、ここをきれいに上抜けできれば0.10ドル方向へのラリーにつながるかもしれません。
新情報:
オンチェーンデータでは、エスプレッソにおけるユニークなウォレット活動のスパイクが示されており、これは単なる見せ玉(ウォッシュトレーディング)ではなく、本物のエコシステムへの関心を示している可能性があります。さらに、バイナンスでの「Trade X」統合も可視性を高め、小口の個人投資家の勢いを引き寄せています。
戦略:
高値でFOMO(追いかけ買い)しないでください。健康的なエントリーとして、0.0965ドルのリテストを待ちましょう。出来高が維持されるなら、ESPは間もなく心理的節目の0.10ドルを再奪回する可能性があります。冷静に状況を見極め、リスク管理を徹底してください!
いいね、フォロー、シェアをお忘れなく!🩸 どうもありがとうございます❤️
#CFTCUpdatesGuidanceOnTokenizedAssets #BinanceWillListHyperliquid(HYPE) #FedProposesRulesForBankIssuedStablecoins
291
ログインして、さらにコンテンツを読む
厳選トピックで世界の暗号資産トレーダーの仲間入り
⚡️ 暗号資産に関する最新かつ有益な情報が見つかります。
💬 世界最大の暗号資産取引所から信頼されています。
👍 認証を受けたクリエイターから、有益なインサイトを得られます。
メール / 電話番号
トレンドトピック
BitwiseFilesFinalNEARSpotETFProspectus
閲覧回数 71,862
1,279人が討論中
#bitwisefilesfinalnearspotetfprospectus
$NEAR は、ETF承認で本当に$562まで到達できるのでしょうか? 🚀
BitwiseがスポットNEAR ETFの最終目論見書を提出(ティッカー:NRR / NYSE Arca)し、暗号資産市場がざわついています! 📊🔥
機関投資家の資金が、NEAR史上最大のポンプを解き放とうとしているのでしょうか?アナリストたちは驚くべき価格目標を投げています:
🎯 中間目標:$155
🎯 2030 年の長期目標:$562
💡 早速計算してみましょう:
$562になった場合、$NEAR の時価総額はおよそ $6800億(6800億ドル)相当となり、Ethereumの潜在的なバリュエーションと肩を並べる水準に位置します。NEARが「Chain Abstraction & AI」という暗号資産の物語をリードしている今、想像より現実味があるかもしれません!
SECの規制がより暗号資産フレンドリーになり、ウォール街もドアをノックし始めている中で、あなたは「積み増し」していますか?それとも「保有」していますか?
👇 $NEAR の現実的な価格予想をコメントで教えてください! 👇
#BitwiseFilesFinalNEARSpotETFProspectus #Altcoins #CryptoNews #ETF
Doomsday-Trader
·いいね:6件
·閲覧回数 3.6k
BitgetHackerMoves$83MStolenXRP
閲覧回数 29,632
157人が討論中
SOLSpotETFWeeklyInflow$188M
閲覧回数 18,915
127人が討論中