

Market Pulse Daily
152 投稿

Market Pulse Daily
報告
ユーザーをブロック
Daily crypto levels, setups and market updates. Price action, key support/resistance and fast news for short-term traders. Not financial advice.
1 フォロー
26 フォロワー
36 いいね
投稿
翻訳参照
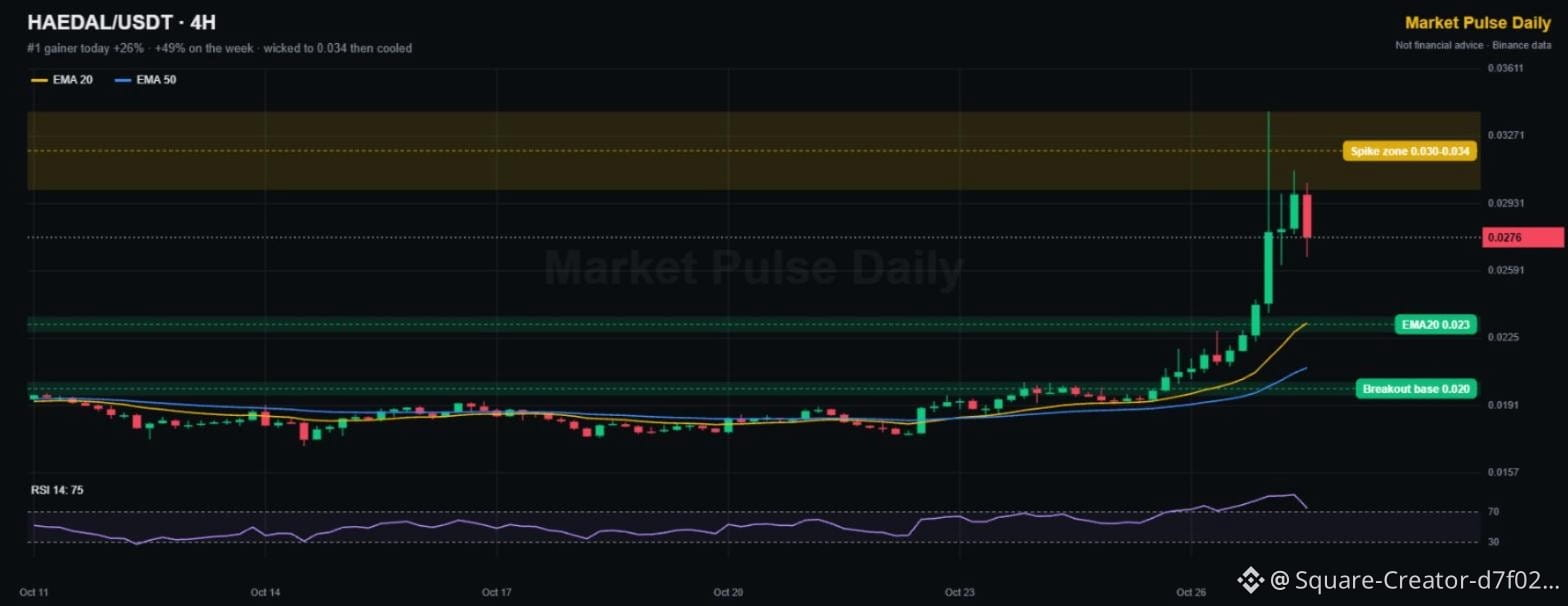
$HAEDAL is the #1 gainer on Binance today, +26% and almost +50% on the week 🚀
After two weeks flat near 0.019, it broke out and wicked all the way to 0.034. Now it's cooling at 0.0276 with RSI near 75. That long upper wick shows sellers are active up there.
🔴 Spike zone: 0.030-0.034
🟢 EMA20: around 0.023
🟢 Breakout base: 0.020
Chasing vertical candles is how people buy tops. A calm pullback that holds 0.023 is the healthier setup.
👉 Tap $HAEDAL
for the live chart. NFA
Would you buy here or wait for the dip? 👇
#TopGainers #Altcoins #FOMCWatch
No Binance account yet? Get 20% of your trading fees back 👉 [Sign up on Binance](https://www.binance.com/register?ref=TGCSTKKM)
{spot}(HAEDALUSDT)
$HAEDAL is the #1 gainer on Binance today, +26% and almost +50% on the week 🚀
After two weeks flat near 0.019, it broke out and wicked all the way to 0.034. Now it's cooling at 0.0276 with RSI near 75. That long upper wick shows sellers are active up there.
🔴 Spike zone: 0.030-0.034
🟢 EMA20: around 0.023
🟢 Breakout base: 0.020
Chasing vertical candles is how people buy tops. A calm pullback that holds 0.023 is the healthier setup.
👉 Tap $HAEDAL
for the live chart. NFA
Would you buy here or wait for the dip? 👇
#TopGainers #Altcoins #FOMCWatch
No Binance account yet? Get 20% of your trading fees back 👉 Sign up on Binance
5
·
--
ブリッシュ
翻訳参照
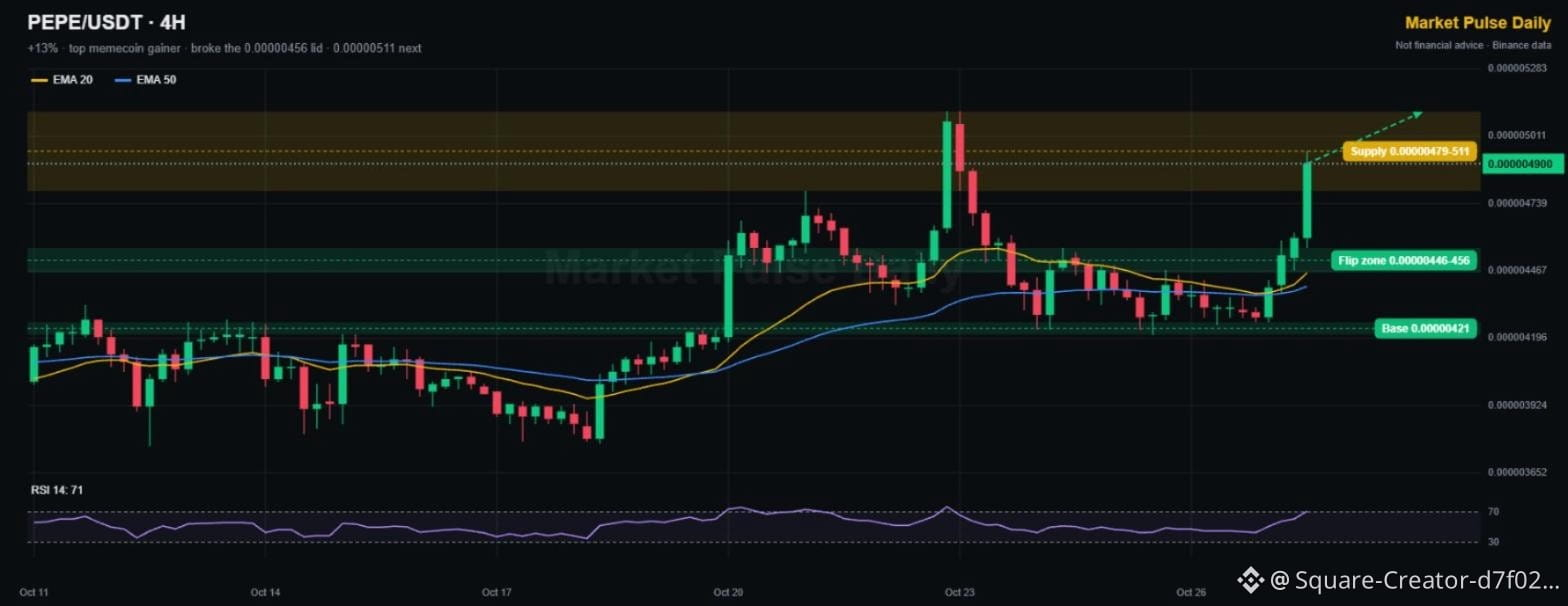
$PEPE is the top memecoin gainer today, +13% 🐸
One big 4H candle cleared the 0.00000456 lid that capped it for four days. Now it's running into the Oct 22 supply zone, where the last rally got sold hard.
🟢 Flip zone: 0.00000446-0.00000456
🟢 Base: 0.00000421
🔴 Supply: 0.00000479-0.00000511
RSI is 71, so expect some chop here. Holding the flip zone keeps 0.00000511 in play.
👉 Tap $PEPE
to watch the live chart. NFA
Frog season back, or one-candle wonder? 👇
#PEPE #Memecoins #FOMCWatch
No Binance account yet? Get 20% of your trading fees back 👉 [Sign up on Binance](https://www.binance.com/register?ref=TGCSTKKM)
{spot}(PEPEUSDT)
$PEPE is the top memecoin gainer today, +13% 🐸
One big 4H candle cleared the 0.00000456 lid that capped it for four days. Now it's running into the Oct 22 supply zone, where the last rally got sold hard.
🟢 Flip zone: 0.00000446-0.00000456
🟢 Base: 0.00000421
🔴 Supply: 0.00000479-0.00000511
RSI is 71, so expect some chop here. Holding the flip zone keeps 0.00000511 in play.
👉 Tap $PEPE
to watch the live chart. NFA
Frog season back, or one-candle wonder? 👇
#PEPE #Memecoins #FOMCWatch
No Binance account yet? Get 20% of your trading fees back 👉 Sign up on Binance
1
記事
翻訳参照
Support and Resistance for Beginners: 5 Rules With Real ChartsAlmost every chart post on Square mentions support and resistance. If you're newer to trading, those words can sound like jargon. They're actually the simplest and most useful tools in technical analysis. Here are five rules, explained with charts from this week.
What they mean
Support is a price area where buyers have repeatedly stepped in and stopped a fall. Resistance is an area where sellers have repeatedly stepped in and stopped a rise. They work because traders remember those prices: people who missed a bounce wait to buy there next time, and people stuck at a top wait to sell when price gets back to break-even.
Rule one: think in zones, not lines
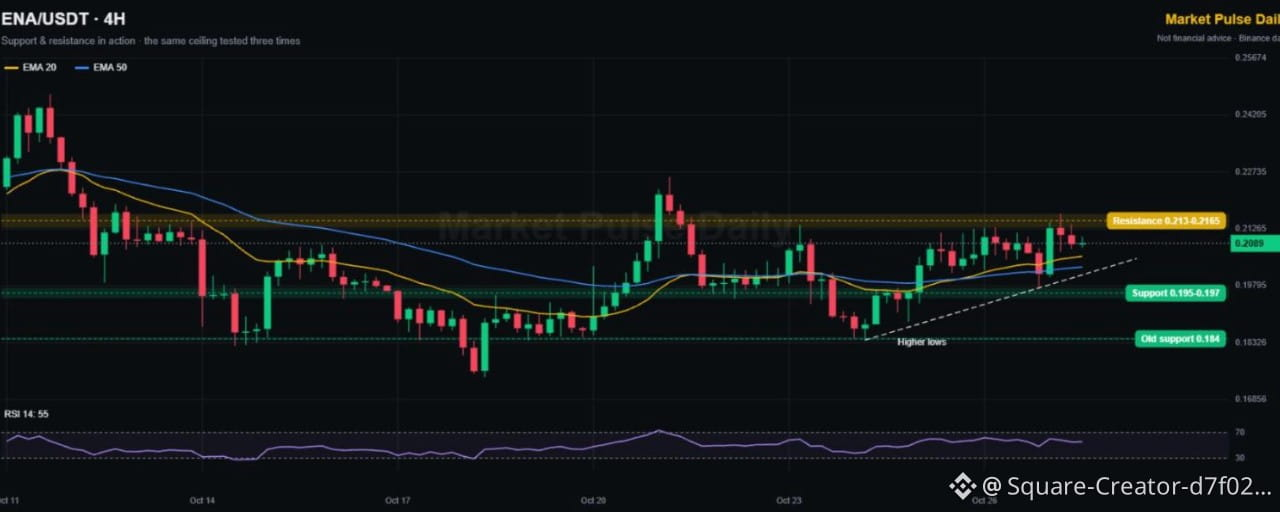
Price rarely turns at an exact number. Look at $ENA in the cover chart: its ceiling isn't one price, it's a band from 0.213 to 0.2165. Drawing zones instead of thin lines stops you from getting faked out by a small wick.
Rule two: more touches means a more important level
Ethena has hit that 0.213-0.2165 band three times since Oct 21 and been rejected each time. That makes it a level the whole market is watching. But there's a twist: every retest also uses up some of the sellers sitting there, so a level tested many times can eventually give way.
Rule three: broken resistance often becomes support
This is called a role reversal, or a flip. When price breaks above a ceiling, the buyers who missed it often wait for a pullback to that same area. Zcash showed this nicely this week: the 1,239-1,268 area capped it for days, then after the breakout it became the first support to watch.
Rule four: watch the lows, not just the levels
When price keeps knocking on the same resistance but each dip stops higher than the last, buyers are getting more aggressive. $DOGE is a good example: lows at 0.0748, then 0.0760, then 0.0767, all under the same 0.0801-0.0807 lid. Rising lows under flat resistance often build toward a breakout. Falling highs over flat support often build toward a breakdown.
Rule five: let the candle close
A wick through resistance is not a breakout. Many traders wait for a full candle to close beyond the zone on their chosen timeframe, for example the 4H, before treating it as real. It costs you a little of the move, but it filters out a lot of fake breakouts, especially around big news like today's Fed decision.
Putting it together
Before you look at any trade, mark three things: the nearest support zone, the nearest resistance zone, and whether the lows or highs are trending. On the cover chart, that reads: resistance 0.213-0.2165, support 0.195-0.197, and higher lows. That's a market leaning up but still capped, and a 4H close above 0.2165 is what would change the picture for $ENA .
Support and resistance won't predict the future, but they tell you where the important decisions happen, and where your idea is proven wrong.
Which coin should I break down next with these rules? Drop it in the comments, and follow Market Pulse Daily for daily charts. Not financial advice (NFA).
#TechnicalAnalysis #TradingTips #FOMCWatch
No Binance account yet? Get 20% of your trading fees back 👉 [Sign up on Binance](https://www.binance.com/register?ref=TGCSTKKM)
{spot}(ENAUSDT)
Support and Resistance for Beginners: 5 Rules With Real Charts
Almost every chart post on Square mentions support and resistance. If you're newer to trading, those words can sound like jargon. They're actually the simplest and most useful tools in technical analysis. Here are five rules, explained with charts from this week.
What they mean
Support is a price area where buyers have repeatedly stepped in and stopped a fall. Resistance is an area where sellers have repeatedly stepped in and stopped a rise. They work because traders remember those prices: people who missed a bounce wait to buy there next time, and people stuck at a top wait to sell when price gets back to break-even.
Rule one: think in zones, not lines
Price rarely turns at an exact number. Look at $ENA in the cover chart: its ceiling isn't one price, it's a band from 0.213 to 0.2165. Drawing zones instead of thin lines stops you from getting faked out by a small wick.
Rule two: more touches means a more important level
Ethena has hit that 0.213-0.2165 band three times since Oct 21 and been rejected each time. That makes it a level the whole market is watching. But there's a twist: every retest also uses up some of the sellers sitting there, so a level tested many times can eventually give way.
Rule three: broken resistance often becomes support
This is called a role reversal, or a flip. When price breaks above a ceiling, the buyers who missed it often wait for a pullback to that same area. Zcash showed this nicely this week: the 1,239-1,268 area capped it for days, then after the breakout it became the first support to watch.
Rule four: watch the lows, not just the levels
When price keeps knocking on the same resistance but each dip stops higher than the last, buyers are getting more aggressive. $DOGE is a good example: lows at 0.0748, then 0.0760, then 0.0767, all under the same 0.0801-0.0807 lid. Rising lows under flat resistance often build toward a breakout. Falling highs over flat support often build toward a breakdown.
Rule five: let the candle close
A wick through resistance is not a breakout. Many traders wait for a full candle to close beyond the zone on their chosen timeframe, for example the 4H, before treating it as real. It costs you a little of the move, but it filters out a lot of fake breakouts, especially around big news like today's Fed decision.
Putting it together
Before you look at any trade, mark three things: the nearest support zone, the nearest resistance zone, and whether the lows or highs are trending. On the cover chart, that reads: resistance 0.213-0.2165, support 0.195-0.197, and higher lows. That's a market leaning up but still capped, and a 4H close above 0.2165 is what would change the picture for $ENA .
Support and resistance won't predict the future, but they tell you where the important decisions happen, and where your idea is proven wrong.
Which coin should I break down next with these rules? Drop it in the comments, and follow Market Pulse Daily for daily charts. Not financial advice (NFA).
#TechnicalAnalysis #TradingTips #FOMCWatch
No Binance account yet? Get 20% of your trading fees back 👉 Sign up on Binance
14
記事
翻訳参照
Why Zcash Is the Most Searched Coin on Square Right Now (Privacy Coins Explained)Zcash keeps showing up at the top of Square's Most Searched list, and this week it's up about 7% in a day while much of the market waits on the Fed. If you've seen the ticker everywhere but never looked into it, here's a plain-English guide to what $ZEC is, why privacy coins attract attention, and what the chart is saying.
What is Zcash?
Zcash launched in 2016 as a fork of Bitcoin's codebase. Like Bitcoin, it has a fixed maximum supply of 21 million coins and a halving schedule that cuts new issuance over time. The big difference is privacy. Zcash was one of the first networks to use zero-knowledge proofs (zk-SNARKs) in production, which let the network verify a transaction is valid without revealing who sent it, who received it, or how much moved.
Shielded vs transparent
Zcash privacy is optional. Transparent addresses work like Bitcoin: everything is visible on-chain. Shielded addresses hide the details. Users can also share a viewing key, which lets an auditor or tax advisor see their shielded history without giving them spending power. That selective disclosure is a key reason Zcash is often described as compliance-friendly compared with privacy coins that hide everything by default.
Why is everyone searching it?
A few things tend to drive attention to privacy coins at the same time. First, relative strength: when a coin rises while Bitcoin moves sideways, traders notice and start searching. Second, the privacy narrative itself. As more of daily life moves on-chain, people are asking how much of their financial history should be public forever. Third, momentum feeds on itself on social platforms. A coin trending on Square gets more posts, which brings more searches, which keeps it trending.
None of that guarantees the move continues. Search spikes often show up near local tops as well as at the start of trends, so it's worth pairing the hype with the chart.
What the chart says
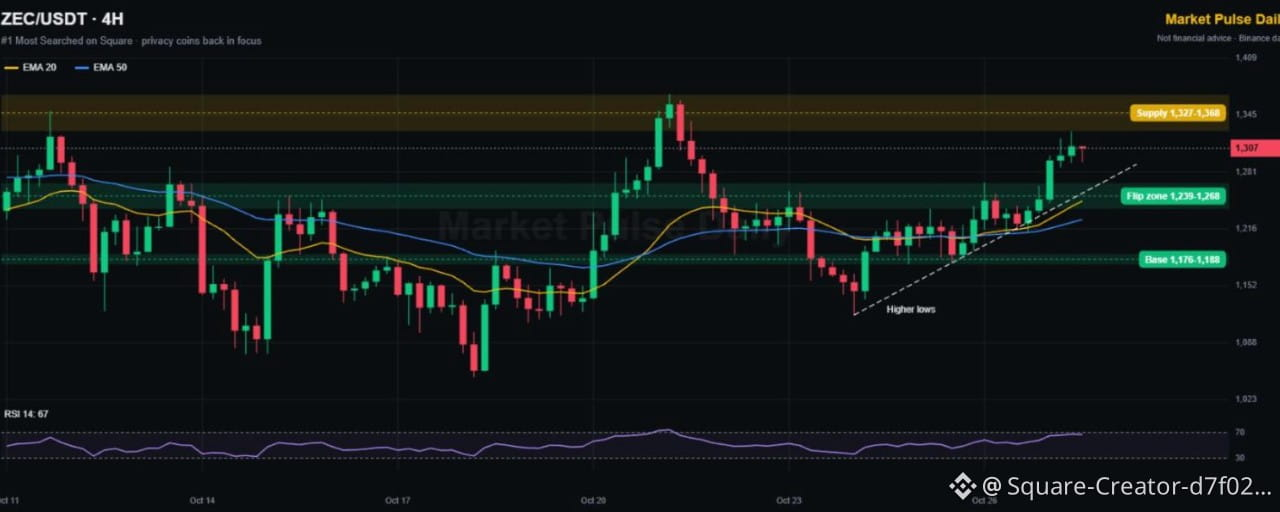
On the 4H chart, Zcash has printed higher lows since Oct 24 and just broke above the 1,268 lower high. Both the 20 and 50 EMAs have turned up under price, a sign the short-term trend has flipped bullish.
Key levels to watch:
Flip zone: 1,239-1,268. The old ceiling is now the first support.
Base: 1,176-1,188. Losing this would cancel the higher-low structure.
Supply: 1,327-1,368. This is where the Oct 21 rally reversed, so sellers may return here.
RSI is around 67, close to overbought. A pullback toward 1,268 that holds would be healthier than a straight vertical run.
Risks to keep in mind
Privacy coins face more regulatory scrutiny than most assets, and some platforms in some regions have restricted them in the past. They can also move much faster than large caps in both directions. And today's Fed decision at 18:00 UTC can override any single-coin chart for a few hours.
Bottom line
Zcash combines a Bitcoin-style fixed supply with optional, auditable privacy, and right now it has both attention and a bullish 4H structure. The level that decides the next move for $ZEC is 1,268: hold it and 1,368 is in play, lose it and the range returns.
Do you think privacy will be one of the big narratives of this cycle? Share your view in the comments and follow Market Pulse Daily for daily levels. Not financial advice (NFA).
#Zcash #PrivacyCoins #FOMCWatch
No Binance account yet? Get 20% of your trading fees back 👉 [Sign up on Binance](https://www.binance.com/register?ref=TGCSTKKM)
{spot}(ZECUSDT)
Why Zcash Is the Most Searched Coin on Square Right Now (Privacy Coins Explained)
Zcash keeps showing up at the top of Square's Most Searched list, and this week it's up about 7% in a day while much of the market waits on the Fed. If you've seen the ticker everywhere but never looked into it, here's a plain-English guide to what $ZEC is, why privacy coins attract attention, and what the chart is saying.
What is Zcash?
Zcash launched in 2016 as a fork of Bitcoin's codebase. Like Bitcoin, it has a fixed maximum supply of 21 million coins and a halving schedule that cuts new issuance over time. The big difference is privacy. Zcash was one of the first networks to use zero-knowledge proofs (zk-SNARKs) in production, which let the network verify a transaction is valid without revealing who sent it, who received it, or how much moved.
Shielded vs transparent
Zcash privacy is optional. Transparent addresses work like Bitcoin: everything is visible on-chain. Shielded addresses hide the details. Users can also share a viewing key, which lets an auditor or tax advisor see their shielded history without giving them spending power. That selective disclosure is a key reason Zcash is often described as compliance-friendly compared with privacy coins that hide everything by default.
Why is everyone searching it?
A few things tend to drive attention to privacy coins at the same time. First, relative strength: when a coin rises while Bitcoin moves sideways, traders notice and start searching. Second, the privacy narrative itself. As more of daily life moves on-chain, people are asking how much of their financial history should be public forever. Third, momentum feeds on itself on social platforms. A coin trending on Square gets more posts, which brings more searches, which keeps it trending.
None of that guarantees the move continues. Search spikes often show up near local tops as well as at the start of trends, so it's worth pairing the hype with the chart.
What the chart says
On the 4H chart, Zcash has printed higher lows since Oct 24 and just broke above the 1,268 lower high. Both the 20 and 50 EMAs have turned up under price, a sign the short-term trend has flipped bullish.
Key levels to watch:
Flip zone: 1,239-1,268. The old ceiling is now the first support.
Base: 1,176-1,188. Losing this would cancel the higher-low structure.
Supply: 1,327-1,368. This is where the Oct 21 rally reversed, so sellers may return here.
RSI is around 67, close to overbought. A pullback toward 1,268 that holds would be healthier than a straight vertical run.
Risks to keep in mind
Privacy coins face more regulatory scrutiny than most assets, and some platforms in some regions have restricted them in the past. They can also move much faster than large caps in both directions. And today's Fed decision at 18:00 UTC can override any single-coin chart for a few hours.
Bottom line
Zcash combines a Bitcoin-style fixed supply with optional, auditable privacy, and right now it has both attention and a bullish 4H structure. The level that decides the next move for $ZEC is 1,268: hold it and 1,368 is in play, lose it and the range returns.
Do you think privacy will be one of the big narratives of this cycle? Share your view in the comments and follow Market Pulse Daily for daily levels. Not financial advice (NFA).
#Zcash #PrivacyCoins #FOMCWatch
No Binance account yet? Get 20% of your trading fees back 👉 Sign up on Binance
106
翻訳参照
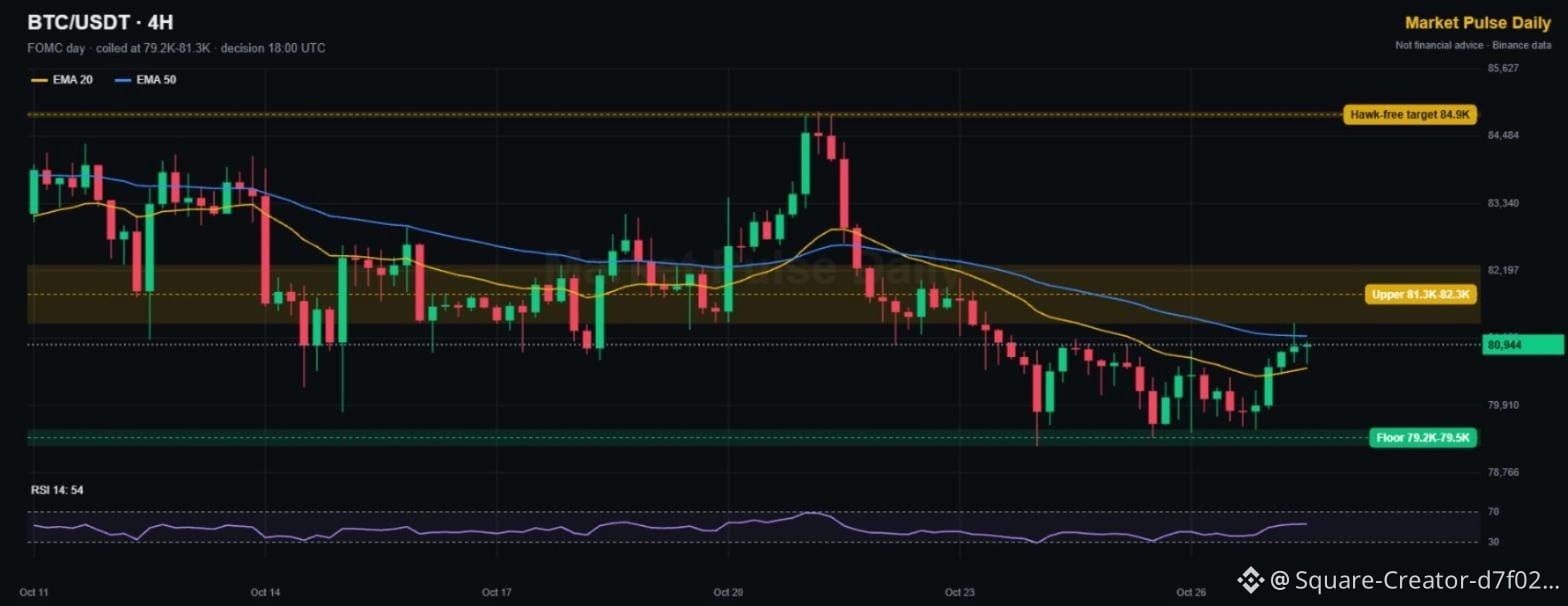
$BTC FOMC day game plan 🏛
Bitcoin is coiled in a 2K box going into the 18:00 UTC decision. Price sits right at the 4H EMA50, RSI is neutral at 54. The market hasn't picked a side yet.
🟢 Floor: 79.2K-79.5K (held three times since Oct 23)
🔴 Upper zone: 81.3K-82.3K
🎯 Calm Fed + break of 82.3K = 84.9K back in play
My 3 scenarios:
1️⃣ Hold + soft tone: breakout over 82.3K
2️⃣ Hold + hawkish tone: retest of 79.2K
3️⃣ Surprise hike (~12% odds): floor breaks, fast flush
First move after a Fed decision is often fake. I wait for the 4H close before touching $BTC
. NFA
Vote: 1, 2 or 3? Comment your number 👇 Follow for the live levels after the presser.
#FOMCWatch #Bitcoin #Fed
No Binance account yet? Get 20% of your trading fees back 👉 [Sign up on Binance](https://www.binance.com/register?ref=TGCSTKKM)
{spot}(BTCUSDT)
$BTC FOMC day game plan 🏛
Bitcoin is coiled in a 2K box going into the 18:00 UTC decision. Price sits right at the 4H EMA50, RSI is neutral at 54. The market hasn't picked a side yet.
🟢 Floor: 79.2K-79.5K (held three times since Oct 23)
🔴 Upper zone: 81.3K-82.3K
🎯 Calm Fed + break of 82.3K = 84.9K back in play
My 3 scenarios:
1️⃣ Hold + soft tone: breakout over 82.3K
2️⃣ Hold + hawkish tone: retest of 79.2K
3️⃣ Surprise hike (~12% odds): floor breaks, fast flush
First move after a Fed decision is often fake. I wait for the 4H close before touching $BTC
. NFA
Vote: 1, 2 or 3? Comment your number 👇 Follow for the live levels after the presser.
#FOMCWatch #Bitcoin #Fed
No Binance account yet? Get 20% of your trading fees back 👉 Sign up on Binance
17
·
--
ブリッシュ
翻訳参照
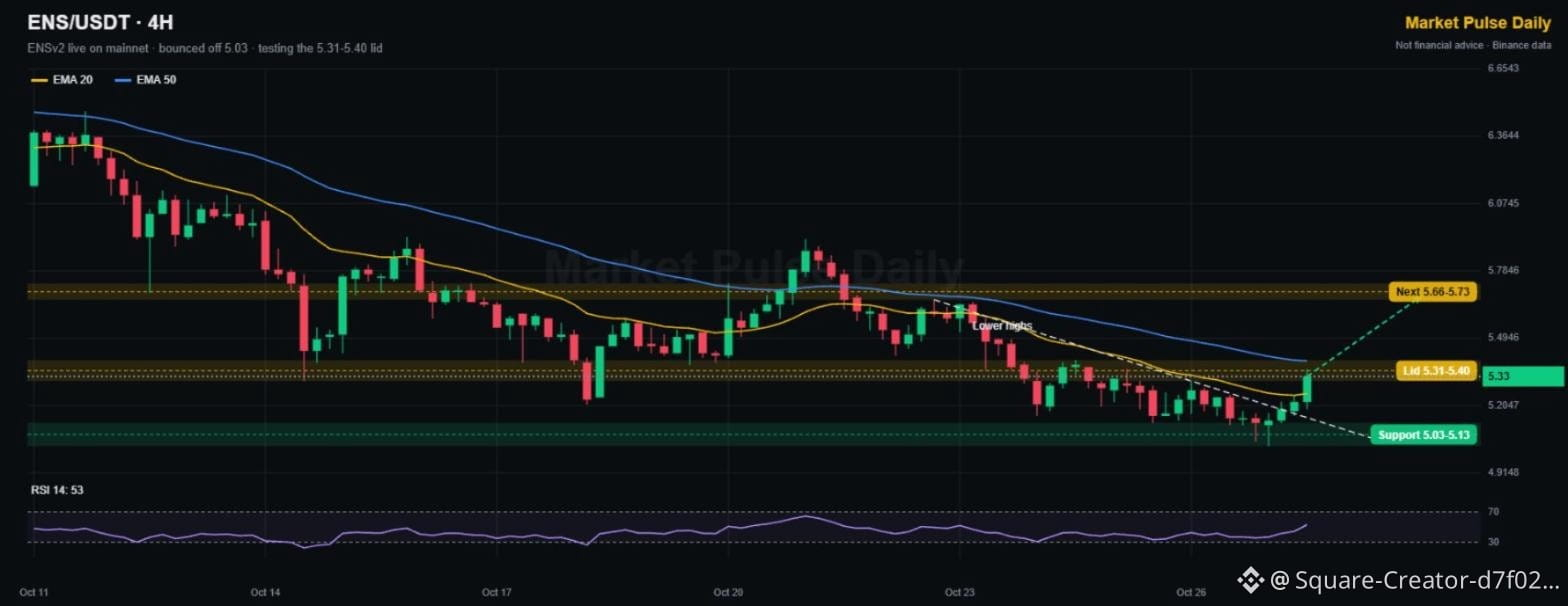
$ENS shipped ENSv2 to Ethereum mainnet, and the chart is starting to react 🌐
The biggest upgrade to .eth names in years, and price just printed its strongest 4H candle in a week, popping off the 5.03 low and through the downtrend line.
🔴 Lid: 5.31-5.40 (lower highs + 4H EMA50)
🟢 Support: 5.03-5.13
🎯 Next: 5.66-5.73
Real product launches tend to age better than hype. If $ENS
closes above 5.40, the trend flips for the first time since Oct 21. NFA
Do you own a .eth name? Drop it below 👇
#ENS #Ethereum #FOMCWatch
No Binance account yet? Get 20% of your trading fees back 👉 [Sign up on Binance](https://www.binance.com/register?ref=TGCSTKKM)
{spot}(ENSUSDT)
$ENS shipped ENSv2 to Ethereum mainnet, and the chart is starting to react 🌐
The biggest upgrade to .eth names in years, and price just printed its strongest 4H candle in a week, popping off the 5.03 low and through the downtrend line.
🔴 Lid: 5.31-5.40 (lower highs + 4H EMA50)
🟢 Support: 5.03-5.13
🎯 Next: 5.66-5.73
Real product launches tend to age better than hype. If $ENS
closes above 5.40, the trend flips for the first time since Oct 21. NFA
Do you own a .eth name? Drop it below 👇
#ENS #Ethereum #FOMCWatch
No Binance account yet? Get 20% of your trading fees back 👉 Sign up on Binance
3
翻訳参照
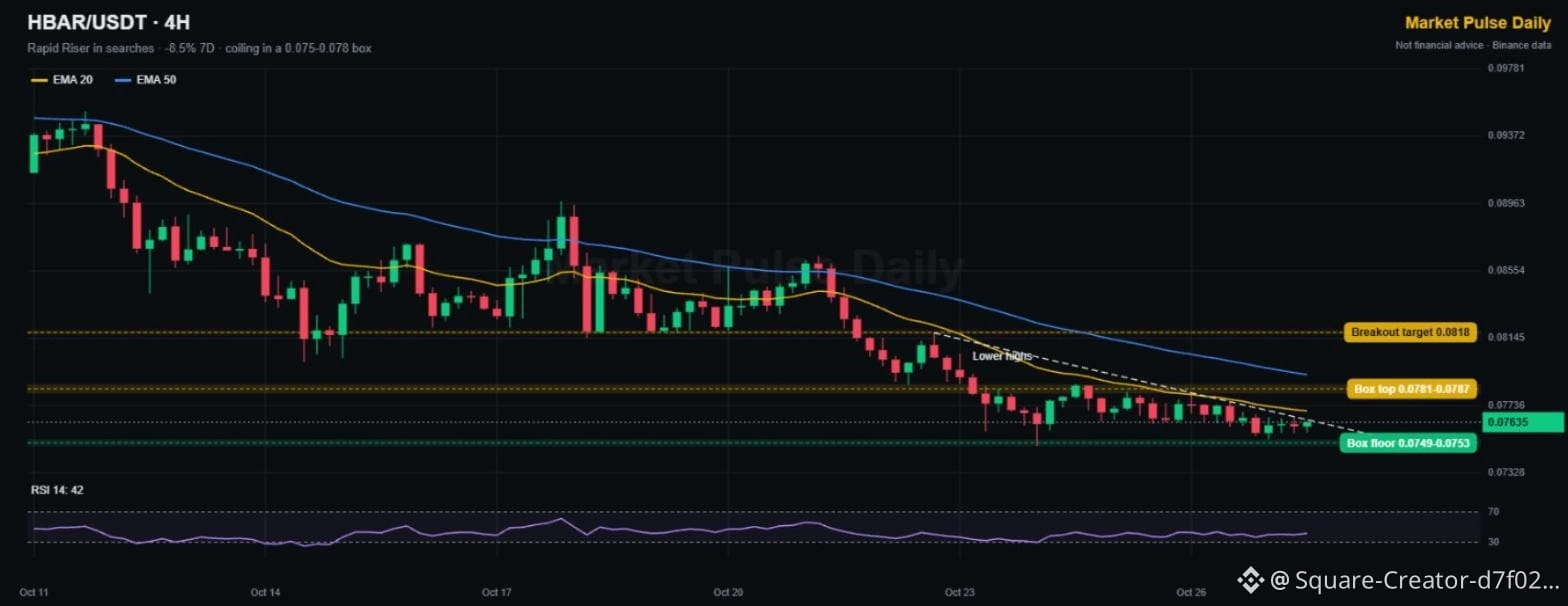
$HBAR just got the "Rapid Riser" badge in Square searches, but price hasn't caught up yet 👀
The 4H chart is a tight box: 0.0749-0.0787 for five days, with lower highs pressing down from above. That's a coil, and coils don't last forever.
🟢 Floor: 0.0749-0.0753
🔴 Box top: 0.0781-0.0787
🎯 Breakout target: 0.0818
When search interest rises before price does, it's worth watching. A 4H close above 0.0787 confirms it for $HBAR
. Lose 0.0749 and the box breaks the wrong way. NFA
Which way does it break? Up or down 👇
#HBAR #Altcoins #FOMCWatch
No Binance account yet? Get 20% of your trading fees back 👉 [Sign up on Binance](https://www.binance.com/register?ref=TGCSTKKM)
{spot}(HBARUSDT)
$HBAR just got the "Rapid Riser" badge in Square searches, but price hasn't caught up yet 👀
The 4H chart is a tight box: 0.0749-0.0787 for five days, with lower highs pressing down from above. That's a coil, and coils don't last forever.
🟢 Floor: 0.0749-0.0753
🔴 Box top: 0.0781-0.0787
🎯 Breakout target: 0.0818
When search interest rises before price does, it's worth watching. A 4H close above 0.0787 confirms it for $HBAR
. Lose 0.0749 and the box breaks the wrong way. NFA
Which way does it break? Up or down 👇
#HBAR #Altcoins #FOMCWatch
No Binance account yet? Get 20% of your trading fees back 👉 Sign up on Binance
13
·
--
ブリッシュ
翻訳参照
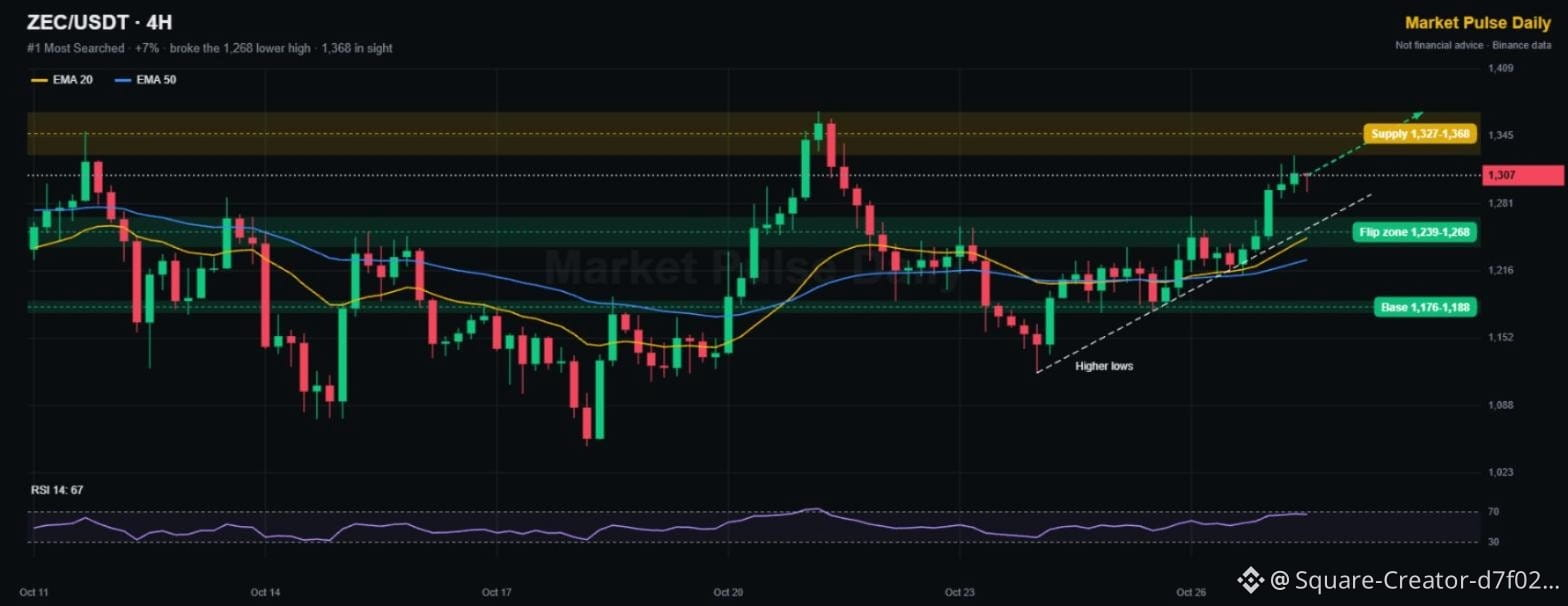
$ZEC is the #1 most searched coin on Square again, and the chart shows why 🔥
+7% today, a clean break of the 1,268 lower high, and higher lows since Oct 24. Both 4H EMAs are turning up under price.
🟢 Flip zone: 1,239-1,268
🟢 Base: 1,176-1,188
🔴 Supply: 1,327-1,368 (where the Oct 21 rally died)
RSI is at 67, so a retest of 1,268 wouldn't hurt the setup. Hold it and $ZEC
has a real shot at 1,368. NFA
Privacy coins leading again. Are you in or watching? 👇
#Zcash #PrivacyCoins #FOMCWatch
No Binance account yet? Get 20% of your trading fees back 👉 [Sign up on Binance](https://www.binance.com/register?ref=TGCSTKKM)
{spot}(ZECUSDT)
$ZEC is the #1 most searched coin on Square again, and the chart shows why 🔥
+7% today, a clean break of the 1,268 lower high, and higher lows since Oct 24. Both 4H EMAs are turning up under price.
🟢 Flip zone: 1,239-1,268
🟢 Base: 1,176-1,188
🔴 Supply: 1,327-1,368 (where the Oct 21 rally died)
RSI is at 67, so a retest of 1,268 wouldn't hurt the setup. Hold it and $ZEC
has a real shot at 1,368. NFA
Privacy coins leading again. Are you in or watching? 👇
#Zcash #PrivacyCoins #FOMCWatch
No Binance account yet? Get 20% of your trading fees back 👉 Sign up on Binance
96
翻訳参照
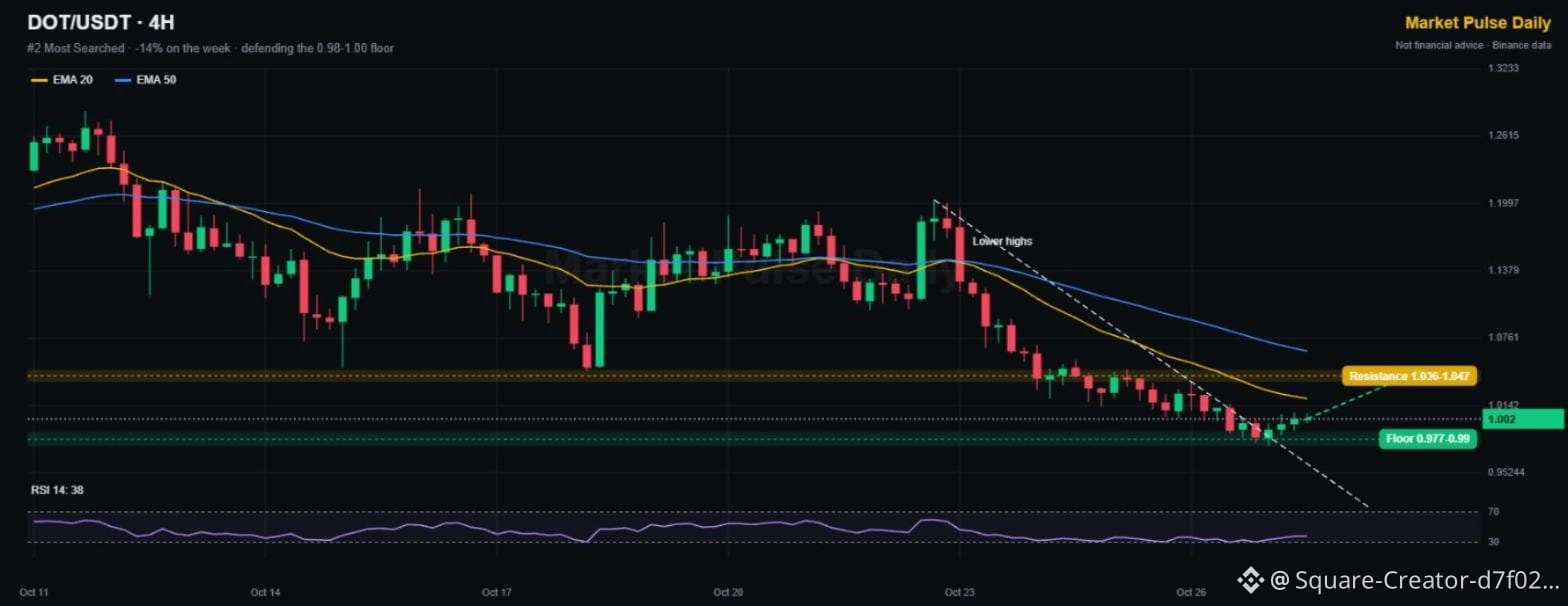
$DOT is the #2 most searched coin on Square right now 🔍
Everyone's looking, but the chart is still heavy: down about 14% on the week, a clean line of lower highs since Oct 22, and both 4H EMAs overhead.
The good part: buyers keep defending the 0.977-0.99 floor and the downtrend line just got tagged.
🟢 Floor: 0.977-0.99
🔴 First test: 1.036-1.047
Reclaim 1.047 and $DOT
finally breaks the pattern. Lose 0.977 and it's fresh lows. Searches can lead price, but they can't replace a breakout. NFA
Bottom or bull trap? 👇
#Polkadot #Altcoins #TechnicalAnalysis
No Binance account yet? Get 20% of your trading fees back 👉 [Sign up on Binance](https://www.binance.com/register?ref=TGCSTKKM)
{spot}(DOTUSDT)
$DOT is the #2 most searched coin on Square right now 🔍
Everyone's looking, but the chart is still heavy: down about 14% on the week, a clean line of lower highs since Oct 22, and both 4H EMAs overhead.
The good part: buyers keep defending the 0.977-0.99 floor and the downtrend line just got tagged.
🟢 Floor: 0.977-0.99
🔴 First test: 1.036-1.047
Reclaim 1.047 and $DOT
finally breaks the pattern. Lose 0.977 and it's fresh lows. Searches can lead price, but they can't replace a breakout. NFA
Bottom or bull trap? 👇
#Polkadot #Altcoins #TechnicalAnalysis
No Binance account yet? Get 20% of your trading fees back 👉 Sign up on Binance
11
翻訳参照
$BTC has a 36-hour gauntlet ahead ⏳
Today (Wed):
🏛 Fed decision 18:00 UTC, Warsh presser 18:30
💻 Microsoft + Alphabet earnings after the close
Tomorrow (Thu):
📊 PCE inflation + Q3 GDP at 12:30 UTC
📦 $AMZNB and Intel report after the bell
Markets price only about a 12% chance of another hike, so a hold is the base case. The real mover is the tone: a calm Fed plus soft PCE is the friendliest mix for risk assets. A hawkish surprise hits tech and crypto together.
My plan: no new size on $BTC
until the presser ends. Volatility first, direction second. NFA
Hold, hike or cut? Drop your call 👇
#FOMC #Fed #Earnings
No Binance account yet? Get 20% of your trading fees back 👉 [Sign up on Binance](https://www.binance.com/register?ref=TGCSTKKM)
$BTC has a 36-hour gauntlet ahead ⏳
Today (Wed):
🏛 Fed decision 18:00 UTC, Warsh presser 18:30
💻 Microsoft + Alphabet earnings after the close
Tomorrow (Thu):
📊 PCE inflation + Q3 GDP at 12:30 UTC
📦 $AMZNB and Intel report after the bell
Markets price only about a 12% chance of another hike, so a hold is the base case. The real mover is the tone: a calm Fed plus soft PCE is the friendliest mix for risk assets. A hawkish surprise hits tech and crypto together.
My plan: no new size on $BTC
until the presser ends. Volatility first, direction second. NFA
Hold, hike or cut? Drop your call 👇
#FOMC #Fed #Earnings
No Binance account yet? Get 20% of your trading fees back 👉 Sign up on Binance
9
翻訳参照
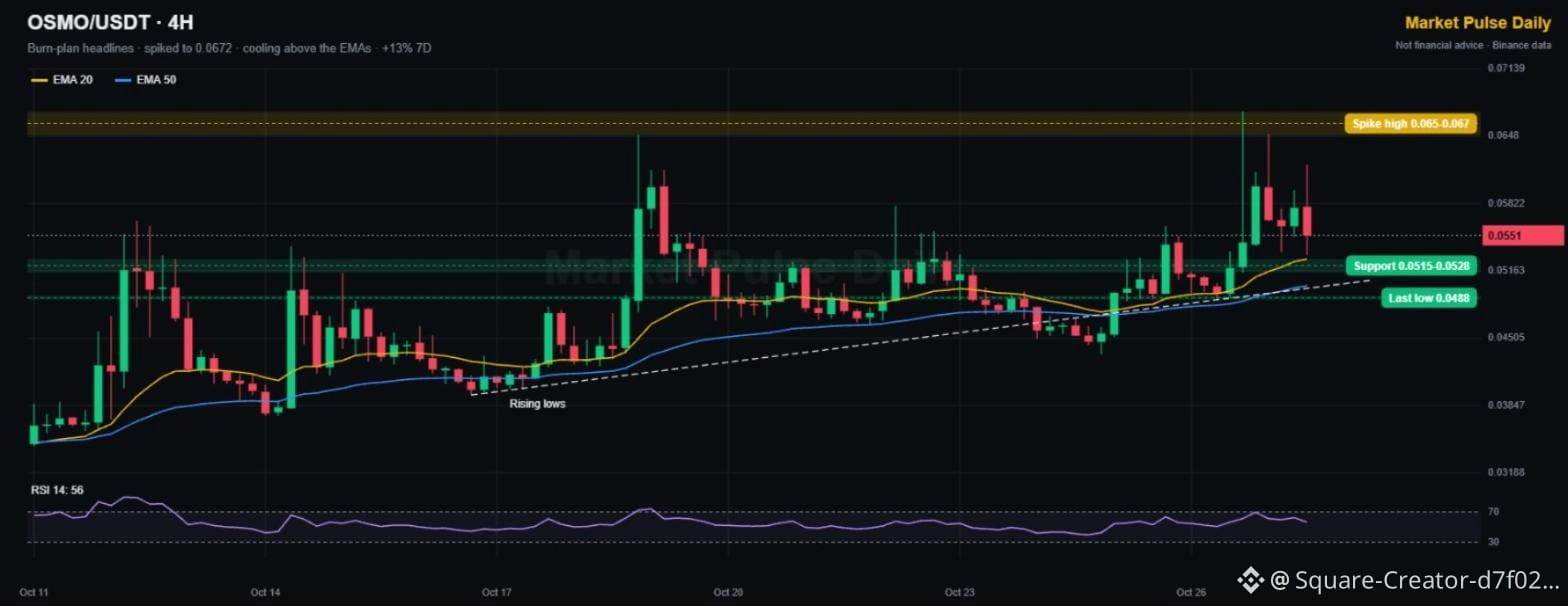
$OSMO spiked to 0.0672 on the 100M token burn plan, then gave back a chunk 🔥
That's normal after a headline wick. What matters more is the bigger picture: up about 13% on the week, a clean line of rising lows since mid-October, and price still above both 4H EMAs.
🔴 Spike high: 0.065-0.067
🟢 Support: 0.0515-0.0528
🟢 Last higher low: 0.0488
As long as 0.0488 holds, the uptrend in $OSMO
is intact. Supply cuts only matter if demand shows up, so watch volume on the next push. NFA
#Osmosis #Altcoins #TechnicalAnalysis
No Binance account yet? Get 20% of your trading fees back 👉 [Sign up on Binance](https://www.binance.com/register?ref=TGCSTKKM)
$OSMO spiked to 0.0672 on the 100M token burn plan, then gave back a chunk 🔥
That's normal after a headline wick. What matters more is the bigger picture: up about 13% on the week, a clean line of rising lows since mid-October, and price still above both 4H EMAs.
🔴 Spike high: 0.065-0.067
🟢 Support: 0.0515-0.0528
🟢 Last higher low: 0.0488
As long as 0.0488 holds, the uptrend in $OSMO
is intact. Supply cuts only matter if demand shows up, so watch volume on the next push. NFA
#Osmosis #Altcoins #TechnicalAnalysis
No Binance account yet? Get 20% of your trading fees back 👉 Sign up on Binance
2
翻訳参照
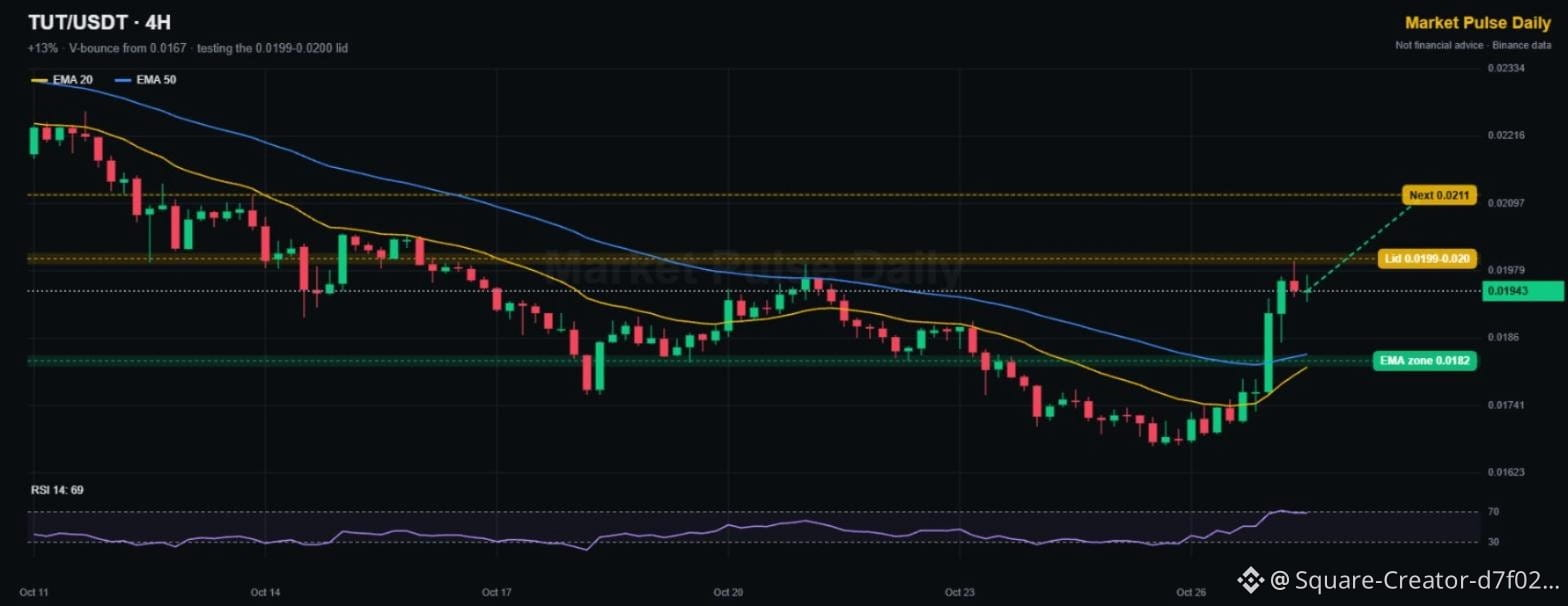
$TUT is one of today's top gainers, +13% 📈
A sharp V-bounce from 0.0167 reclaimed both 4H EMAs in two candles. Now it's sitting right under the 0.0199-0.020 lid, the same area that stopped it on Oct 20.
🔴 Lid: 0.0199-0.020
🟢 EMA support: around 0.0182
🎯 Above the lid: 0.0211
RSI is near 69, so chasing here is risky. A dip that holds 0.0182 would be the cleaner look for $TUT
. NFA
#TopGainers #Altcoins #TechnicalAnalysis
No Binance account yet? Get 20% of your trading fees back 👉 [Sign up on Binance](https://www.binance.com/register?ref=TGCSTKKM)
$TUT is one of today's top gainers, +13% 📈
A sharp V-bounce from 0.0167 reclaimed both 4H EMAs in two candles. Now it's sitting right under the 0.0199-0.020 lid, the same area that stopped it on Oct 20.
🔴 Lid: 0.0199-0.020
🟢 EMA support: around 0.0182
🎯 Above the lid: 0.0211
RSI is near 69, so chasing here is risky. A dip that holds 0.0182 would be the cleaner look for $TUT
. NFA
#TopGainers #Altcoins #TechnicalAnalysis
No Binance account yet? Get 20% of your trading fees back 👉 Sign up on Binance
62
翻訳参照
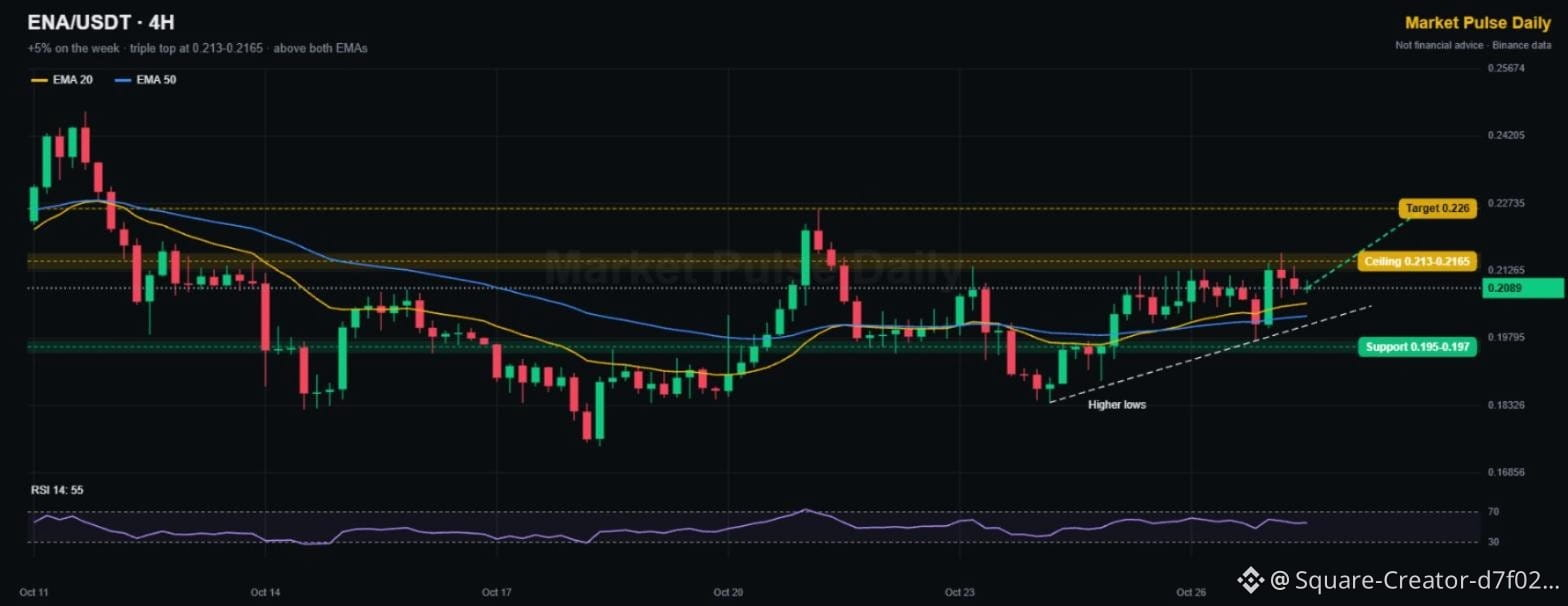
$ENA has knocked on the same door three times 🚪
Up about 5% on the week and holding above both 4H EMAs, but 0.213-0.2165 has capped every push since Oct 21. The good news: the lows keep rising (0.184, then 0.197).
🔴 Ceiling: 0.213-0.2165
🟢 Support: 0.195-0.197
🎯 Breakout target: 0.226
The more often a level gets tested, the weaker it usually gets. A clean close above 0.2165 opens 0.226 for $ENA
. Under 0.195, the setup is off. NFA
Fourth time lucky? 👇
#Ethena #Altcoins #TechnicalAnalysis
No Binance account yet? Get 20% of your trading fees back 👉 [Sign up on Binance](https://www.binance.com/register?ref=TGCSTKKM)
$ENA has knocked on the same door three times 🚪
Up about 5% on the week and holding above both 4H EMAs, but 0.213-0.2165 has capped every push since Oct 21. The good news: the lows keep rising (0.184, then 0.197).
🔴 Ceiling: 0.213-0.2165
🟢 Support: 0.195-0.197
🎯 Breakout target: 0.226
The more often a level gets tested, the weaker it usually gets. A clean close above 0.2165 opens 0.226 for $ENA
. Under 0.195, the setup is off. NFA
Fourth time lucky? 👇
#Ethena #Altcoins #TechnicalAnalysis
No Binance account yet? Get 20% of your trading fees back 👉 Sign up on Binance
38
翻訳参照
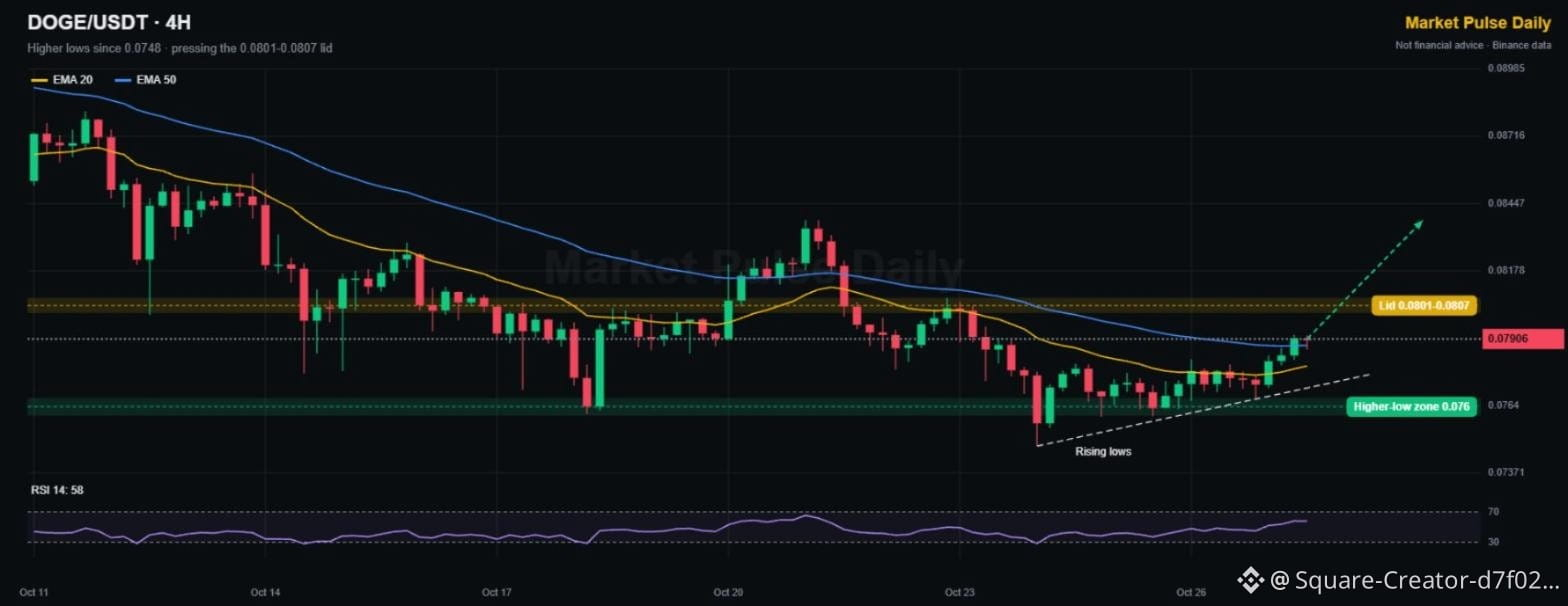
$DOGE is quietly building higher lows 🐕
Since the 0.0748 flush, every dip has been bought higher: 0.0760, then 0.0767. Price is now around 0.0791, back above the 4H EMA20 and testing the EMA50.
🔴 Lid: 0.0801-0.0807 (rejected here twice)
🟢 Higher-low zone: 0.0760-0.0767
🎯 Above the lid, 0.0838 is the next stop
A 4H close over 0.0807 flips $DOGE
bullish on this timeframe. Losing 0.076 breaks the structure. NFA
Who's still holding the dog? 👇
#DOGE #Memecoins #TechnicalAnalysis
No Binance account yet? Get 20% of your trading fees back 👉 [Sign up on Binance](https://www.binance.com/register?ref=TGCSTKKM)
$DOGE is quietly building higher lows 🐕
Since the 0.0748 flush, every dip has been bought higher: 0.0760, then 0.0767. Price is now around 0.0791, back above the 4H EMA20 and testing the EMA50.
🔴 Lid: 0.0801-0.0807 (rejected here twice)
🟢 Higher-low zone: 0.0760-0.0767
🎯 Above the lid, 0.0838 is the next stop
A 4H close over 0.0807 flips $DOGE
bullish on this timeframe. Losing 0.076 breaks the structure. NFA
Who's still holding the dog? 👇
#DOGE #Memecoins #TechnicalAnalysis
No Binance account yet? Get 20% of your trading fees back 👉 Sign up on Binance
12
翻訳参照
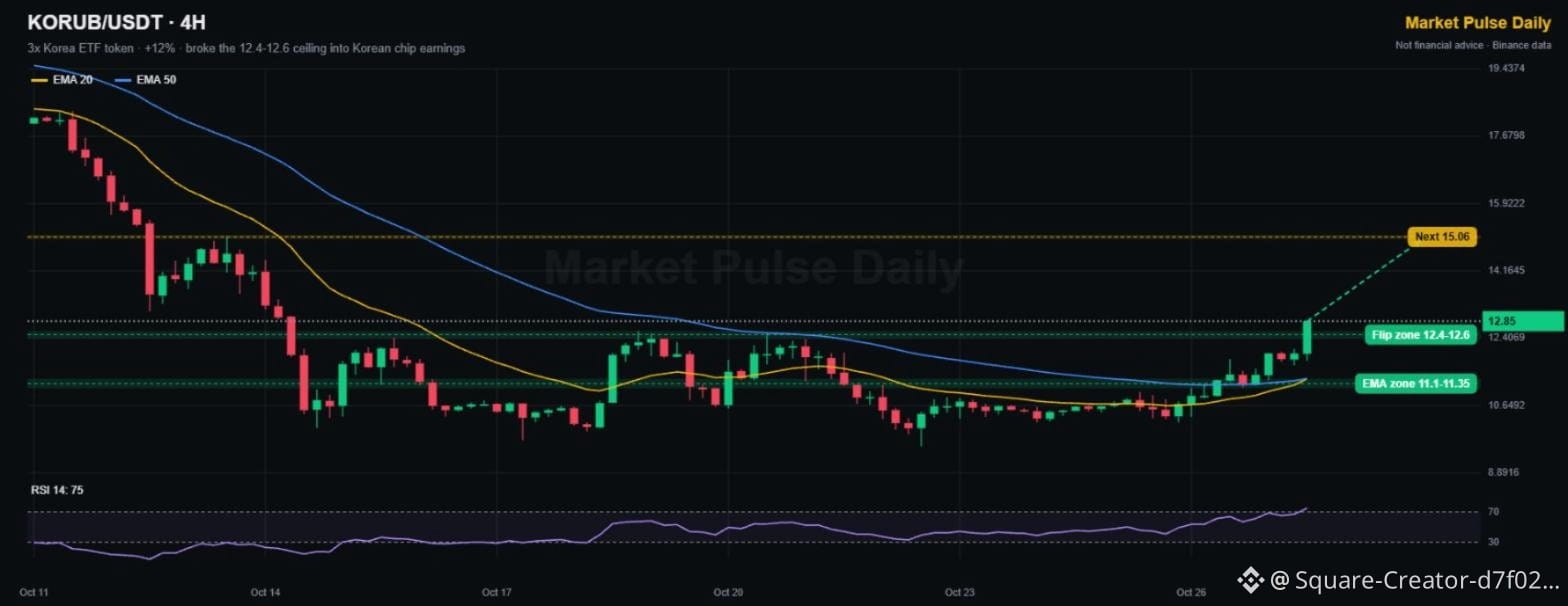
$KORUB just pushed through its 12.4-12.6 ceiling, up about 12% on the day 🇰🇷
The 3x Korea token is riding chip earnings momentum. The 4H RSI sits at 75, which is hot, so a pullback to retest the old ceiling would be healthy.
📍 Flip zone: 12.4-12.6 (old lid, now support)
📍 EMA zone: 11.1-11.35
🎯 Next level: 15.06
Hold 12.4 and $KORUB
keeps the breakout alive. Lose it and it's back in the range. Remember it's 3x, so moves cut both ways. NFA
#StockTokens #TechnicalAnalysis #Breakout
No Binance account yet? Get 20% of your trading fees back 👉 [Sign up on Binance](https://www.binance.com/register?ref=TGCSTKKM)
$KORUB just pushed through its 12.4-12.6 ceiling, up about 12% on the day 🇰🇷
The 3x Korea token is riding chip earnings momentum. The 4H RSI sits at 75, which is hot, so a pullback to retest the old ceiling would be healthy.
📍 Flip zone: 12.4-12.6 (old lid, now support)
📍 EMA zone: 11.1-11.35
🎯 Next level: 15.06
Hold 12.4 and $KORUB
keeps the breakout alive. Lose it and it's back in the range. Remember it's 3x, so moves cut both ways. NFA
#StockTokens #TechnicalAnalysis #Breakout
No Binance account yet? Get 20% of your trading fees back 👉 Sign up on Binance
41
翻訳参照
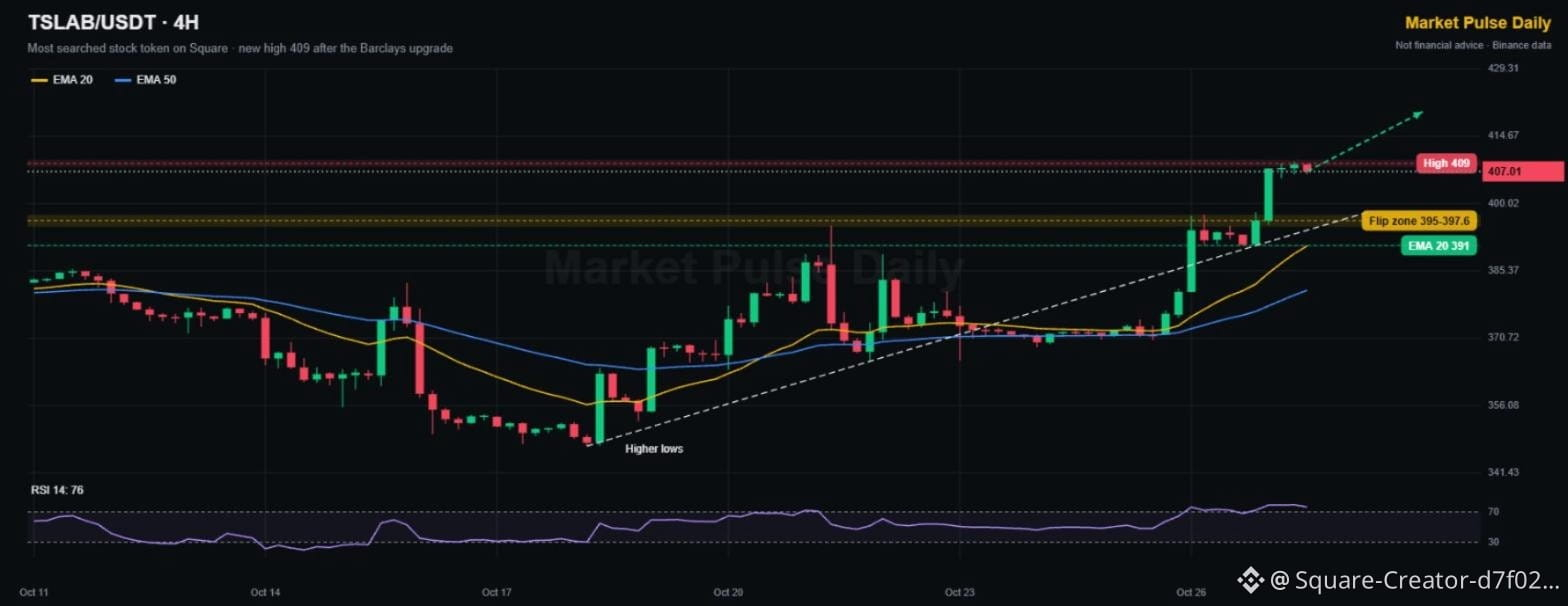
$TSLAB is the most searched stock token on Square, and it just printed a new high at 409 🚗
Tesla jumped after Barclays raised its rating and price target, and the tokenized stock is +7% on the week.
The 4H chart:
• Higher lows since Oct 18: 347 → 366 → 371 → 391
• Broke the 395 to 397.6 lid that rejected it twice
• New high: 409
• EMA 20 at 391 is rising fast
• RSI 76, overbought
The plan:
🟢 Strong trends often stay overbought. Dips that hold the 395 to 397.6 flip zone are the cleaner entries
🔴 A 4H close back under 391 = momentum is fading
Stock tokens trade 24/7, so you can follow Tesla's momentum even while Wall Street is closed.
Are you holding $TSLAB or waiting for a pullback? 👇
NFA
#Tesla #StockTokens #TechnicalAnalysis
No Binance account yet? Get 20% of your trading fees back 👉 [Sign up on Binance](https://www.binance.com/register?ref=TGCSTKKM)
$TSLAB is the most searched stock token on Square, and it just printed a new high at 409 🚗
Tesla jumped after Barclays raised its rating and price target, and the tokenized stock is +7% on the week.
The 4H chart:
• Higher lows since Oct 18: 347 → 366 → 371 → 391
• Broke the 395 to 397.6 lid that rejected it twice
• New high: 409
• EMA 20 at 391 is rising fast
• RSI 76, overbought
The plan:
🟢 Strong trends often stay overbought. Dips that hold the 395 to 397.6 flip zone are the cleaner entries
🔴 A 4H close back under 391 = momentum is fading
Stock tokens trade 24/7, so you can follow Tesla's momentum even while Wall Street is closed.
Are you holding $TSLAB or waiting for a pullback? 👇
NFA
#Tesla #StockTokens #TechnicalAnalysis
No Binance account yet? Get 20% of your trading fees back 👉 Sign up on Binance
2
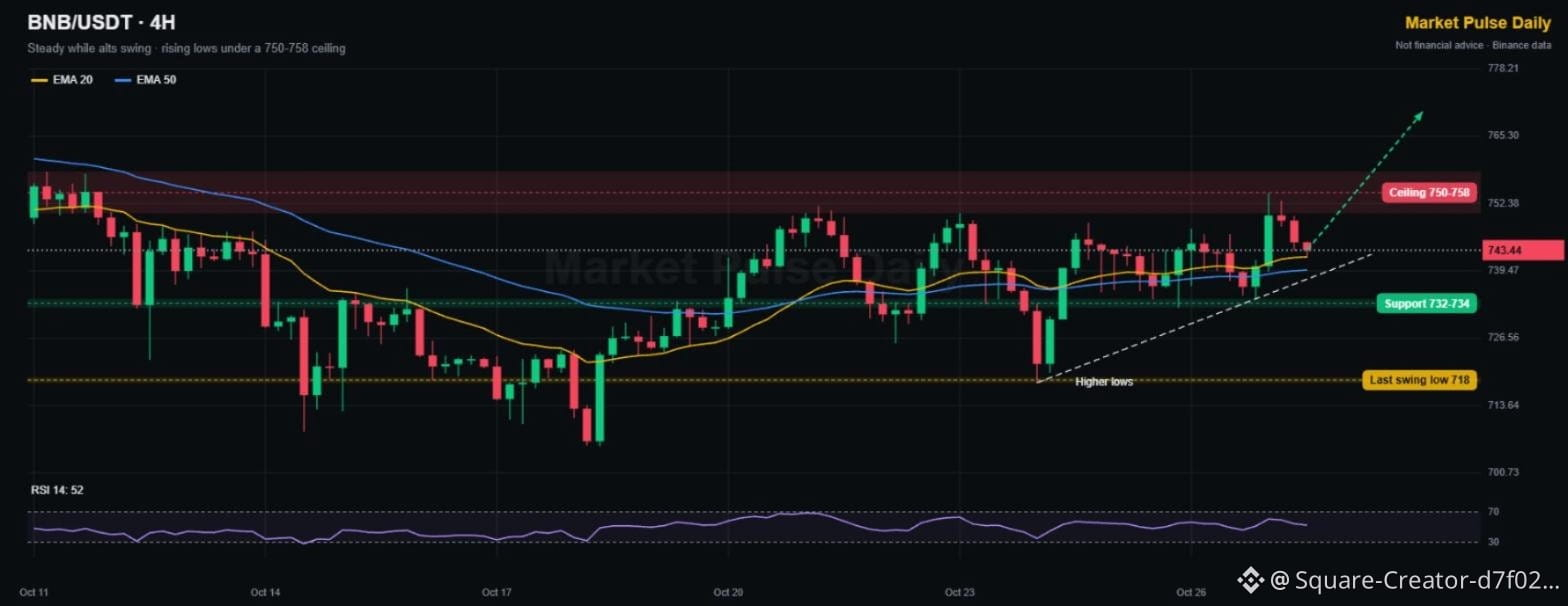
$BNB は市場で最も値動きの穏やかな大型銘柄で、静かなチャートほど大きく崩れることがよくあります 🧘
アルトコインが10%〜30%動くなか、これは743で週を通して横ばいとなり、静かにエネルギーをためています。
4時間足チャート:
• 安値切り上げ:718 → 732 → 734
• 上値抵抗:750〜758。昨日754をつけたものの、押し戻されました
• サポート:732〜734
• 価格はEMA 20(742)付近で推移し、すぐ下にEMA 50(740)があります
• RSI 52
戦略:
🟢 4時間足で758を上回って引ければ、10月の上値抵抗を突破し、770超えが視野に入ります
🔴 732を割ると、718まで戻る可能性があります
ニュース:CZはBNB ChainをAIを活用した決済の拠点として売り込んでおり、ネットワークへのアクティビティも増え続けています。
$BNB はFRBの前、それとも後にブレイクアウトするでしょうか? 👇
投資助言ではありません
#BNB #BNBChain #TechnicalAnalysis
まだBinanceのアカウントをお持ちでない方は、取引手数料の20%が戻ってきます 👉 [Sign up on Binance](https://www.binance.com/register?ref=TGCSTKKM)
$BNB は市場で最も値動きの穏やかな大型銘柄で、静かなチャートほど大きく崩れることがよくあります 🧘
アルトコインが10%〜30%動くなか、これは743で週を通して横ばいとなり、静かにエネルギーをためています。
4時間足チャート:
• 安値切り上げ:718 → 732 → 734
• 上値抵抗:750〜758。昨日754をつけたものの、押し戻されました
• サポート:732〜734
• 価格はEMA 20(742)付近で推移し、すぐ下にEMA 50(740)があります
• RSI 52
戦略:
🟢 4時間足で758を上回って引ければ、10月の上値抵抗を突破し、770超えが視野に入ります
🔴 732を割ると、718まで戻る可能性があります
ニュース:CZはBNB ChainをAIを活用した決済の拠点として売り込んでおり、ネットワークへのアクティビティも増え続けています。
$BNB はFRBの前、それとも後にブレイクアウトするでしょうか? 👇
投資助言ではありません
#BNB #BNBChain #TechnicalAnalysis
まだBinanceのアカウントをお持ちでない方は、取引手数料の20%が戻ってきます 👉 Sign up on Binance
13
翻訳参照
$WLD -26% in a week. Here's the oversold watchlist while everyone chases gainers 📉
Three big names that got hit hard this week (4H):
1️⃣ Worldcoin: 0.4385, -26% in 7 days
• Fresh low at 0.4249 yesterday, RSI 35
• First lid: the EMA 20 at 0.451, then 0.4529
2️⃣ $AAVE 133.45, -14% in 7 days
• Six lower highs in a row, new low at 129.5, RSI 38
• Needs a close above 135.7 (EMA 20) to show any strength
3️⃣ $SUI 0.93, -9.4% in 7 days
• Holding a double bottom at 0.900, RSI 48
• Lid at 0.937, then the EMA 50 at 0.955
Oversold isn't a buy signal by itself. In a downtrend, RSI can stay low for days. What turns oversold into opportunity:
✅ A higher low
✅ A 4H close above the EMA 20
✅ Volume on green candles
Sui is closest to confirming. Worldcoin and Aave still need patience.
Which one do you think bounces first? 👇
NFA
#Altcoins #Oversold #TechnicalAnalysis
No Binance account yet? Get 20% of your trading fees back 👉 [Sign up on Binance](https://www.binance.com/register?ref=TGCSTKKM)
$WLD -26% in a week. Here's the oversold watchlist while everyone chases gainers 📉
Three big names that got hit hard this week (4H):
1️⃣ Worldcoin: 0.4385, -26% in 7 days
• Fresh low at 0.4249 yesterday, RSI 35
• First lid: the EMA 20 at 0.451, then 0.4529
2️⃣ $AAVE 133.45, -14% in 7 days
• Six lower highs in a row, new low at 129.5, RSI 38
• Needs a close above 135.7 (EMA 20) to show any strength
3️⃣ $SUI 0.93, -9.4% in 7 days
• Holding a double bottom at 0.900, RSI 48
• Lid at 0.937, then the EMA 50 at 0.955
Oversold isn't a buy signal by itself. In a downtrend, RSI can stay low for days. What turns oversold into opportunity:
✅ A higher low
✅ A 4H close above the EMA 20
✅ Volume on green candles
Sui is closest to confirming. Worldcoin and Aave still need patience.
Which one do you think bounces first? 👇
NFA
#Altcoins #Oversold #TechnicalAnalysis
No Binance account yet? Get 20% of your trading fees back 👉 Sign up on Binance
90
翻訳参照
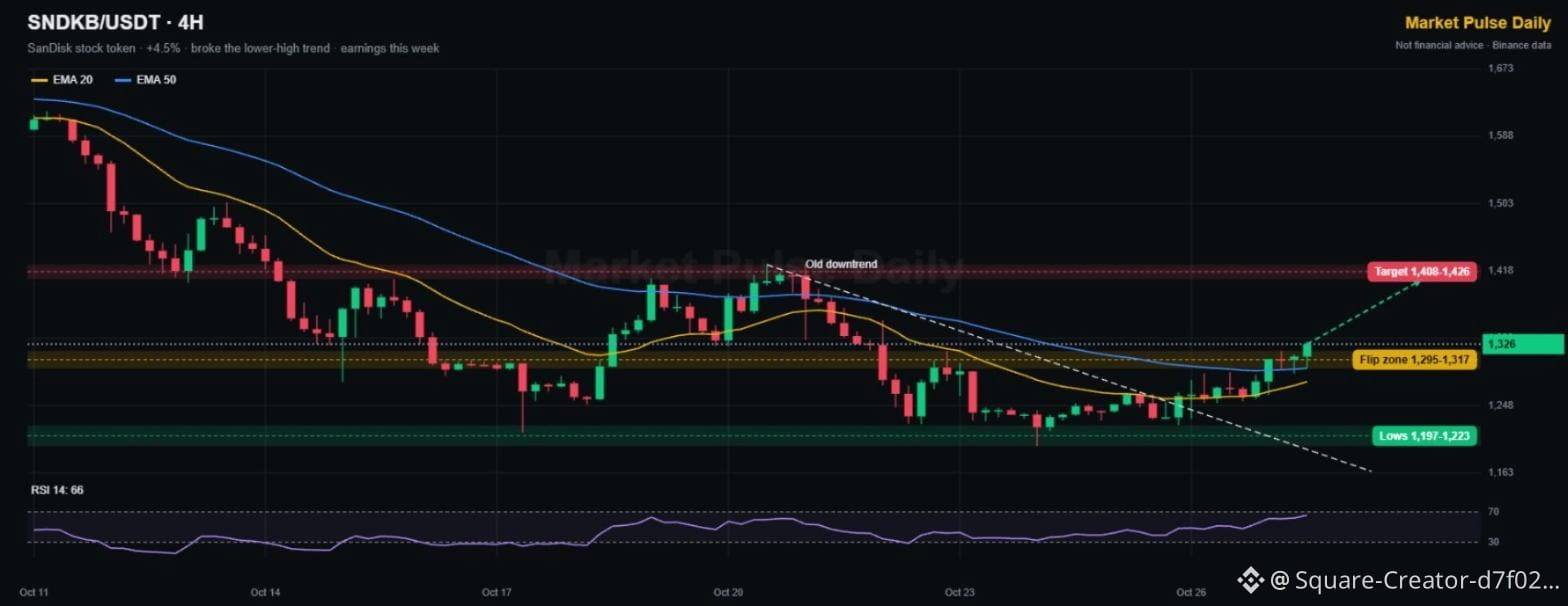
$SNDKB just broke its downtrend. The memory chip trade is spreading 💾
SanDisk's tokenized stock is +4.5% to 1,326 and is one of the most traded stock tokens on Binance today. SK Hynix reports today, and SanDisk is due around Oct 30.
The 4H chart:
• Broke the falling trendline from the Oct 21 high
• Back above both EMAs (1,278 and 1,295)
• Lows held at 1,197 to 1,223 for a week
• Flip zone: 1,295 to 1,317
• Target: 1,408 to 1,426, the Oct 19 to 22 highs
• RSI 66
The plan:
🟢 Holding above 1,295 keeps the breakout alive, with room to 1,408
🔴 Back under 1,278 = the breakout failed
Memory chips are the AI trade nobody talks about until earnings. Watch SK Hynix's results as the first signal.
Are you trading $SNDKB into the chip earnings? 👇
NFA
#StockTokens #EarningsSeason #TechnicalAnalysis
No Binance account yet? Get 20% of your trading fees back 👉 [Sign up on Binance](https://www.binance.com/register?ref=TGCSTKKM)
$SNDKB just broke its downtrend. The memory chip trade is spreading 💾
SanDisk's tokenized stock is +4.5% to 1,326 and is one of the most traded stock tokens on Binance today. SK Hynix reports today, and SanDisk is due around Oct 30.
The 4H chart:
• Broke the falling trendline from the Oct 21 high
• Back above both EMAs (1,278 and 1,295)
• Lows held at 1,197 to 1,223 for a week
• Flip zone: 1,295 to 1,317
• Target: 1,408 to 1,426, the Oct 19 to 22 highs
• RSI 66
The plan:
🟢 Holding above 1,295 keeps the breakout alive, with room to 1,408
🔴 Back under 1,278 = the breakout failed
Memory chips are the AI trade nobody talks about until earnings. Watch SK Hynix's results as the first signal.
Are you trading $SNDKB into the chip earnings? 👇
NFA
#StockTokens #EarningsSeason #TechnicalAnalysis
No Binance account yet? Get 20% of your trading fees back 👉 Sign up on Binance
16
翻訳参照
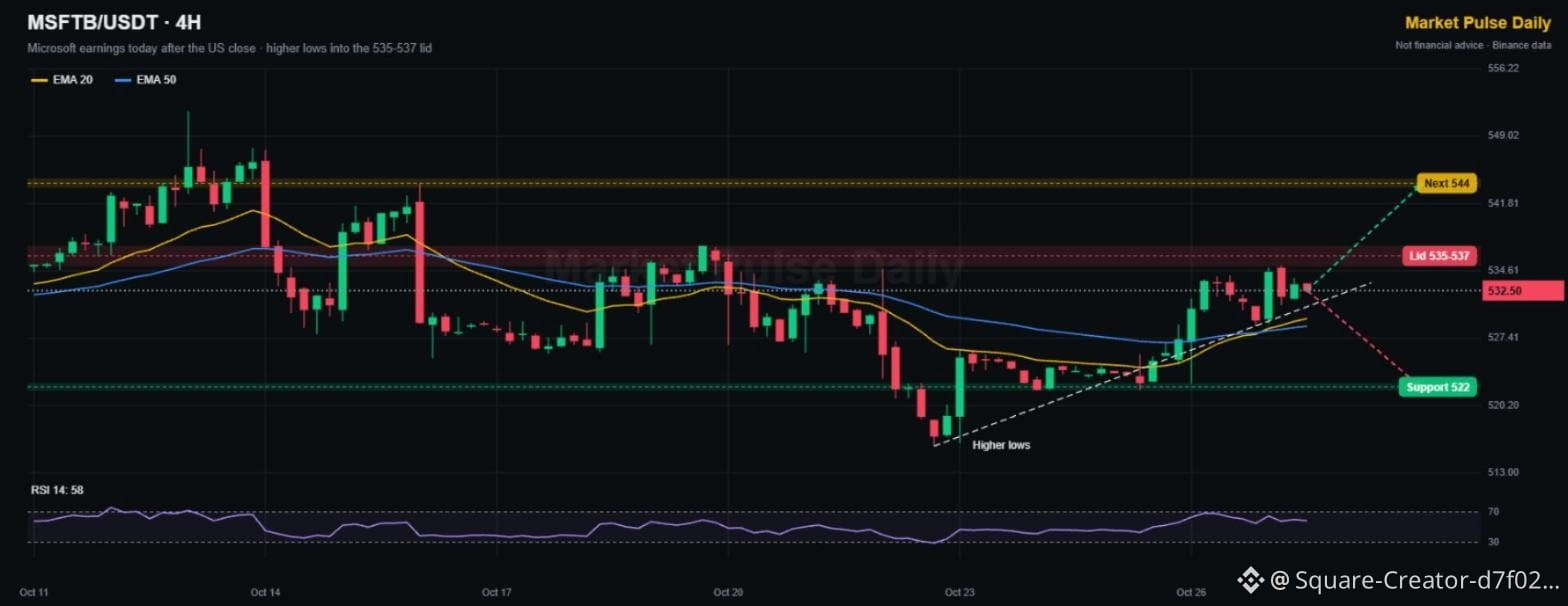
$MSFTB Can Microsoft deliver on AI? We find out tonight. Here's the chart going in 🤖
Microsoft reports after the US close, with the call at 21:30 UTC. Wall Street expects about 4.82 dollars EPS and about 92.5 billion dollars in revenue. Azure cloud growth is the number that moves the stock.
The tokenized stock (4H):
• Price: 532.50
• Higher lows since the Oct 23 low: 515.9 → 521.8 → 528.7
• Lid: 535 to 537, rejected twice this week
• Above that: 544, the mid-October highs
• Support: 522
• RSI 58, sitting just above both EMAs
Earnings scenarios:
🟢 Strong Azure + AI revenue: a break of 537 targets 544
🔴 Disappointing guidance: a drop back to 522, where the higher-low trend gets tested
With the Fed decision a few hours earlier, this could be the busiest night of the month.
Beat or miss for $MSFTB ? 👇
NFA
#CanMicrosoftDeliverOnAI #StockTokens #EarningsSeason
No Binance account yet? Get 20% of your trading fees back 👉 [Sign up on Binance](https://www.binance.com/register?ref=TGCSTKKM)
$MSFTB Can Microsoft deliver on AI? We find out tonight. Here's the chart going in 🤖
Microsoft reports after the US close, with the call at 21:30 UTC. Wall Street expects about 4.82 dollars EPS and about 92.5 billion dollars in revenue. Azure cloud growth is the number that moves the stock.
The tokenized stock (4H):
• Price: 532.50
• Higher lows since the Oct 23 low: 515.9 → 521.8 → 528.7
• Lid: 535 to 537, rejected twice this week
• Above that: 544, the mid-October highs
• Support: 522
• RSI 58, sitting just above both EMAs
Earnings scenarios:
🟢 Strong Azure + AI revenue: a break of 537 targets 544
🔴 Disappointing guidance: a drop back to 522, where the higher-low trend gets tested
With the Fed decision a few hours earlier, this could be the busiest night of the month.
Beat or miss for $MSFTB ? 👇
NFA
#CanMicrosoftDeliverOnAI #StockTokens #EarningsSeason
No Binance account yet? Get 20% of your trading fees back 👉 Sign up on Binance
6
ログインして、さらにコンテンツを読む
厳選トピックで世界の暗号資産トレーダーの仲間入り
⚡️ 暗号資産に関する最新かつ有益な情報が見つかります。
💬 世界最大の暗号資産取引所から信頼されています。
👍 認証を受けたクリエイターから、有益なインサイトを得られます。
メール / 電話番号