
Jengoms
788 投稿

Jengoms
報告
ユーザーをブロック
18 フォロー
34 フォロワー
407 いいね
投稿
すべて
引用
動画
·
--
翻訳参照
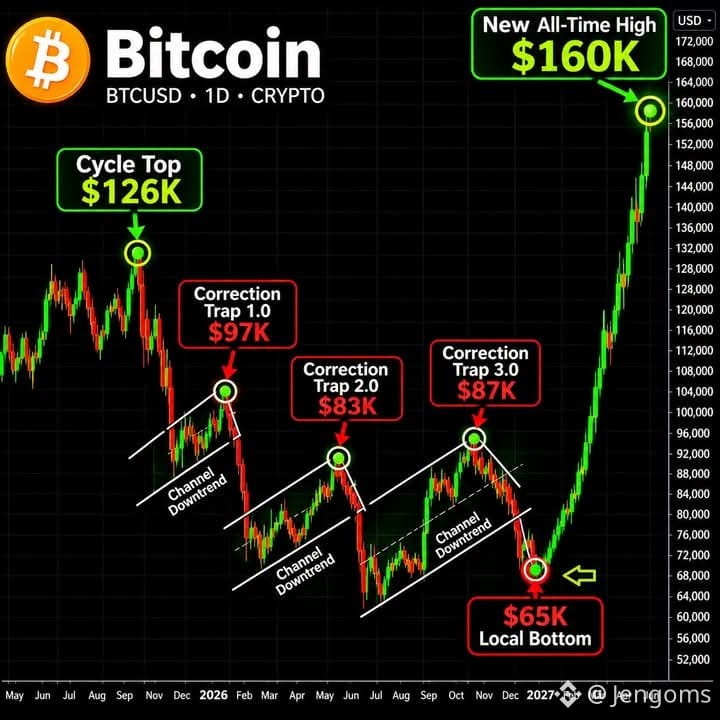
Bitcoin's biggest moves often begin when the majority gets the market completely wrong.
Look closely at this chart.
Three separate correction structures:
- $97K
- $83K
- $87K
Each one looked like a potential breakdown. Yet the chart's projected structure points toward a local bottom near $65K, followed by a possible expansion toward $160K.
But here's what I find more interesting than the price targets.
In a market increasingly influenced by institutional capital, ETF flows, liquidity conditions, and large-holder positioning, corrections deserve a closer look.
Is capital actually leaving Bitcoin, or is it simply changing hands?
Are long-term holders distributing into demand, while new institutional buyers absorb supply?
And are these repeated correction patterns creating liquidity for the next expansion, or are we looking at a structure that's becoming increasingly fragile?
I want to hear your actual market thesis:
If BTC drops toward $65K, would you:
1. Accumulate aggressively.
2. Wait for confirmation of a reversal.
3. Stay out until liquidity conditions improve.
4. Expect an even deeper correction.
And one final question:
Is $160K a realistic next-cycle target, or is the market pricing in too much optimism?
Don't just pick a number. Tell us what you're watching: ETF flows, exchange balances, whale activity, stablecoin liquidity, or something else.
Let's see who is actually reading the market rather than just following the candles. 👇 #bitcoin
Bitcoin's biggest moves often begin when the majority gets the market completely wrong.
Look closely at this chart.
Three separate correction structures:
- $97K
- $83K
- $87K
Each one looked like a potential breakdown. Yet the chart's projected structure points toward a local bottom near $65K, followed by a possible expansion toward $160K.
But here's what I find more interesting than the price targets.
In a market increasingly influenced by institutional capital, ETF flows, liquidity conditions, and large-holder positioning, corrections deserve a closer look.
Is capital actually leaving Bitcoin, or is it simply changing hands?
Are long-term holders distributing into demand, while new institutional buyers absorb supply?
And are these repeated correction patterns creating liquidity for the next expansion, or are we looking at a structure that's becoming increasingly fragile?
I want to hear your actual market thesis:
If BTC drops toward $65K, would you:
1. Accumulate aggressively.
2. Wait for confirmation of a reversal.
3. Stay out until liquidity conditions improve.
4. Expect an even deeper correction.
And one final question:
Is $160K a realistic next-cycle target, or is the market pricing in too much optimism?
Don't just pick a number. Tell us what you're watching: ETF flows, exchange balances, whale activity, stablecoin liquidity, or something else.
Let's see who is actually reading the market rather than just following the candles. 👇 #bitcoin
Look closely at this chart.
Three separate correction structures:
- $97K
- $83K
- $87K
Each one looked like a potential breakdown. Yet the chart's projected structure points toward a local bottom near $65K, followed by a possible expansion toward $160K.
But here's what I find more interesting than the price targets.
In a market increasingly influenced by institutional capital, ETF flows, liquidity conditions, and large-holder positioning, corrections deserve a closer look.
Is capital actually leaving Bitcoin, or is it simply changing hands?
Are long-term holders distributing into demand, while new institutional buyers absorb supply?
And are these repeated correction patterns creating liquidity for the next expansion, or are we looking at a structure that's becoming increasingly fragile?
I want to hear your actual market thesis:
If BTC drops toward $65K, would you:
1. Accumulate aggressively.
2. Wait for confirmation of a reversal.
3. Stay out until liquidity conditions improve.
4. Expect an even deeper correction.
And one final question:
Is $160K a realistic next-cycle target, or is the market pricing in too much optimism?
Don't just pick a number. Tell us what you're watching: ETF flows, exchange balances, whale activity, stablecoin liquidity, or something else.
Let's see who is actually reading the market rather than just following the candles. 👇 #bitcoin
2
·
--
翻訳参照
🔥 $SOL : Solana tokens can now be traded through X Cashtags using Fomo’s trading platform.#HotCPIDecemberHikePriced
🔥 $SOL : Solana tokens can now be traded through X Cashtags using Fomo’s trading platform.#HotCPIDecemberHikePriced

56
·
--
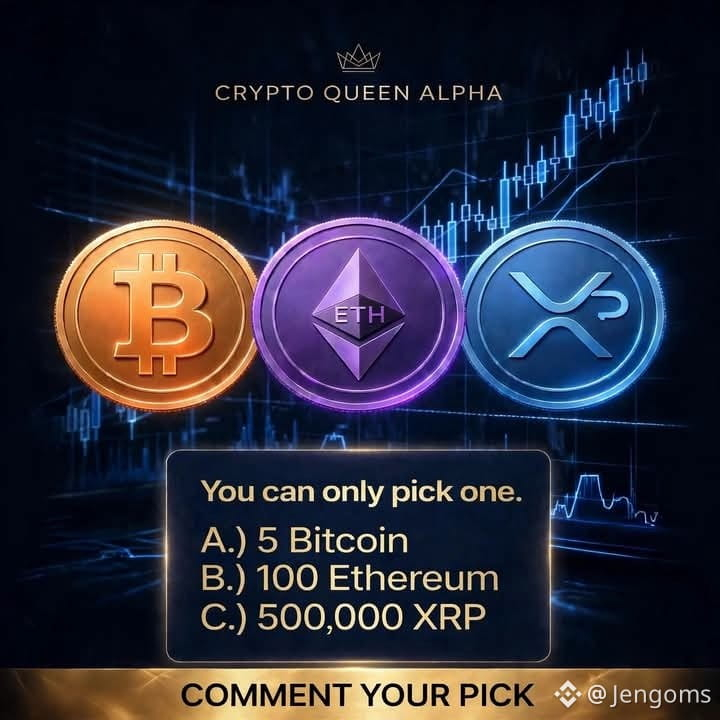
次の強気相場に備えよう…どのセットを選ぶ? 🚀
A.) ビットコイン 5枚
B.) イーサリアム 100枚
C.) XRP 500,000枚
下のコメント欄に選んだものを書いて、どのコミュニティが一番盛り上がるか見てみよう! 👇💬
#Bitcoin #Ethereum✅ #CommunityUnity #Altcoins!
次の強気相場に備えよう…どのセットを選ぶ? 🚀
A.) ビットコイン 5枚
B.) イーサリアム 100枚
C.) XRP 500,000枚
下のコメント欄に選んだものを書いて、どのコミュニティが一番盛り上がるか見てみよう! 👇💬
#Bitcoin #Ethereum✅ #CommunityUnity #Altcoins!
A.) ビットコイン 5枚
B.) イーサリアム 100枚
C.) XRP 500,000枚
下のコメント欄に選んだものを書いて、どのコミュニティが一番盛り上がるか見てみよう! 👇💬
#Bitcoin #Ethereum✅ #CommunityUnity #Altcoins!
99
·
--
$XRP
{spot}(XRPUSDT)
XRP対ビットコイン。
XRPは下落しているように見えるかもしれませんが、XRPを侮らないでください。$BTC
{spot}(BTCUSDT)
$XRP
XRP対ビットコイン。
XRPは下落しているように見えるかもしれませんが、XRPを侮らないでください。$BTC
XRP対ビットコイン。
XRPは下落しているように見えるかもしれませんが、XRPを侮らないでください。$BTC
58
·
--
$PEPE PEPEは、現在の弱気相場の影響を受けていない唯一の時価総額トップ100入り暗号資産です。
弱気相場にもかかわらず、PEPEは持ちこたえました。
PEPEの回復力は、大きな可能性を示す重要な兆しです。
#pepe
#pepecommunity #UpdateAlert
$PEPE PEPEは、現在の弱気相場の影響を受けていない唯一の時価総額トップ100入り暗号資産です。
弱気相場にもかかわらず、PEPEは持ちこたえました。
PEPEの回復力は、大きな可能性を示す重要な兆しです。
#pepe
#pepecommunity #UpdateAlert
弱気相場にもかかわらず、PEPEは持ちこたえました。
PEPEの回復力は、大きな可能性を示す重要な兆しです。
#pepe
#pepecommunity #UpdateAlert

25
·
--
翻訳参照
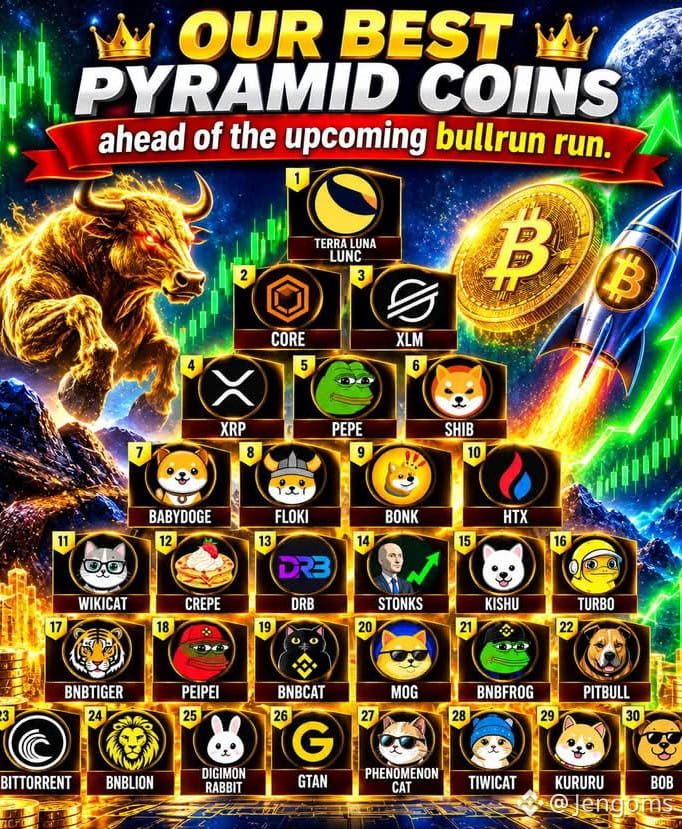
The pyramid of coin ahead of the Bullrun.
There are tendency that bullrun will affect few or some of these coins. #Market_Update
The pyramid of coin ahead of the Bullrun.
There are tendency that bullrun will affect few or some of these coins. #Market_Update
There are tendency that bullrun will affect few or some of these coins. #Market_Update
192
·
--
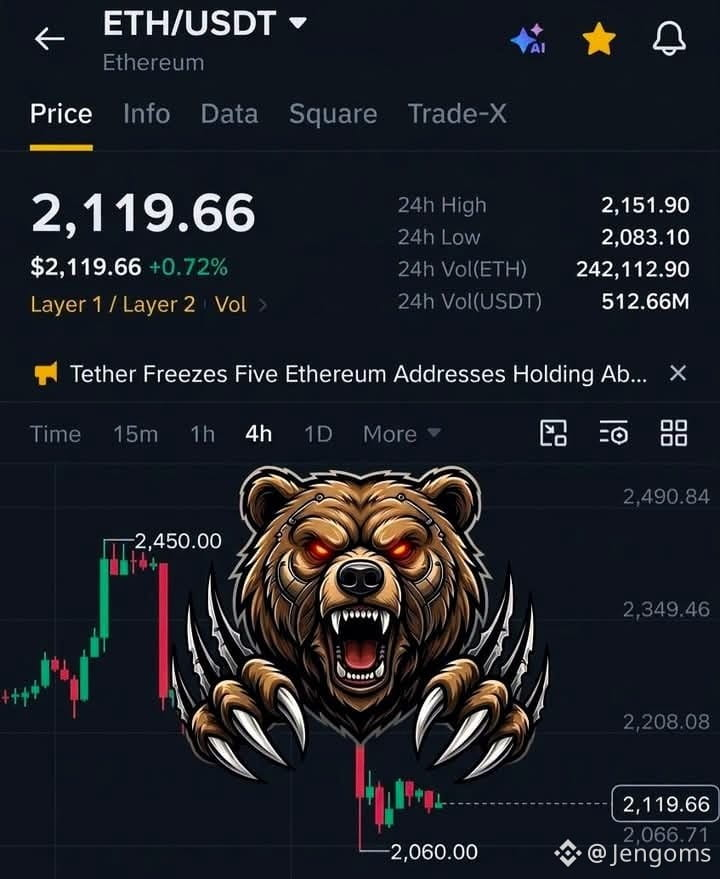
"#Ethereum✅ での急激な調整:重要なサポート水準を割り込んだ後、弱気派が激しく売り込む"
"#Ethereum✅ での急激な調整:重要なサポート水準を割り込んだ後、弱気派が激しく売り込む"
7
·
--
🚨 市場の低迷にウォール街は震えていますが、#crypto の世界では、私たちはすでに市場を生き抜く訓練を受けています。#market_tips
🚨 市場の低迷にウォール街は震えていますが、#crypto の世界では、私たちはすでに市場を生き抜く訓練を受けています。#market_tips

2
·
--
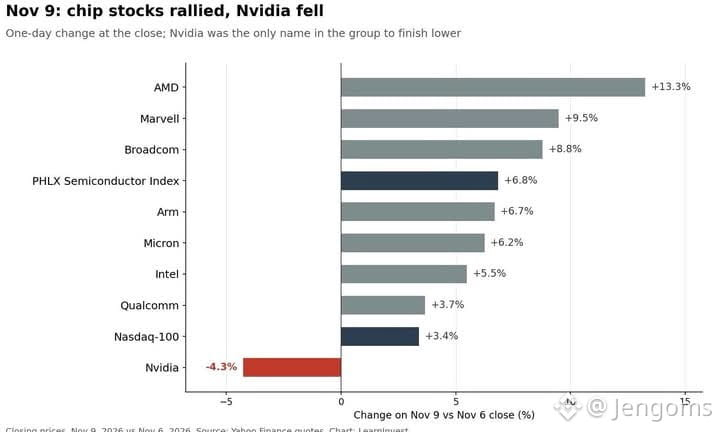
ウォール街の基準から見ても、今日の市場の動きは驚異的でした。
エヌビディアの時価総額は3,000億ドル近く減少する一方、米国株は7カ月ぶりの大幅高となりました。
世界最大の企業であり、S&P 500の8%を占めるエヌビディアが大きく売られたにもかかわらず、米国株式市場の時価総額は1日の取引でおよそ1兆5,000億ドル増加しました。
買いはS&P 500の11セクターすべてに広がりました。
ナスダック100は4.1%上昇し、S&P 500は2.35%急伸。4月8日以来、最大の1日上昇率となりました。
AIブームを牽引した同社は、自社の半導体株指数を11ポイント以上下回って取引を終えました。
投資家は米国のテクノロジー株の押し目買いに驚くほど積極的で、AI革命を牽引する企業を置き去りにしてでも買いに動いています。
#BreakingNewsBreakingNews #StocksDown
ウォール街の基準から見ても、今日の市場の動きは驚異的でした。
エヌビディアの時価総額は3,000億ドル近く減少する一方、米国株は7カ月ぶりの大幅高となりました。
世界最大の企業であり、S&P 500の8%を占めるエヌビディアが大きく売られたにもかかわらず、米国株式市場の時価総額は1日の取引でおよそ1兆5,000億ドル増加しました。
買いはS&P 500の11セクターすべてに広がりました。
ナスダック100は4.1%上昇し、S&P 500は2.35%急伸。4月8日以来、最大の1日上昇率となりました。
AIブームを牽引した同社は、自社の半導体株指数を11ポイント以上下回って取引を終えました。
投資家は米国のテクノロジー株の押し目買いに驚くほど積極的で、AI革命を牽引する企業を置き去りにしてでも買いに動いています。
#BreakingNewsBreakingNews #StocksDown
エヌビディアの時価総額は3,000億ドル近く減少する一方、米国株は7カ月ぶりの大幅高となりました。
世界最大の企業であり、S&P 500の8%を占めるエヌビディアが大きく売られたにもかかわらず、米国株式市場の時価総額は1日の取引でおよそ1兆5,000億ドル増加しました。
買いはS&P 500の11セクターすべてに広がりました。
ナスダック100は4.1%上昇し、S&P 500は2.35%急伸。4月8日以来、最大の1日上昇率となりました。
AIブームを牽引した同社は、自社の半導体株指数を11ポイント以上下回って取引を終えました。
投資家は米国のテクノロジー株の押し目買いに驚くほど積極的で、AI革命を牽引する企業を置き去りにしてでも買いに動いています。
#BreakingNewsBreakingNews #StocksDown
74
·
--
#TrumpCrypto 最新情報:WSJによると、トランプ・メディア&テクノロジー・グループは、主にデジタル資産の評価益により、第3四半期に4億970万ドルの利益を計上しました。
#TrumpCrypto 最新情報:WSJによると、トランプ・メディア&テクノロジー・グループは、主にデジタル資産の評価益により、第3四半期に4億970万ドルの利益を計上しました。
21
·
--
: MEXCのCEO、Vugar Usi氏によると、同取引所はFinCENに連絡し、書面での要請を受領したとの確認を得た。
同氏は、同社は全面的に協力する用意があり、プラットフォームは通常どおり運営を続けていると述べた。 #MEXC
: MEXCのCEO、Vugar Usi氏によると、同取引所はFinCENに連絡し、書面での要請を受領したとの確認を得た。
同氏は、同社は全面的に協力する用意があり、プラットフォームは通常どおり運営を続けていると述べた。 #MEXC
同氏は、同社は全面的に協力する用意があり、プラットフォームは通常どおり運営を続けていると述べた。 #MEXC

1
·
--
翻訳参照
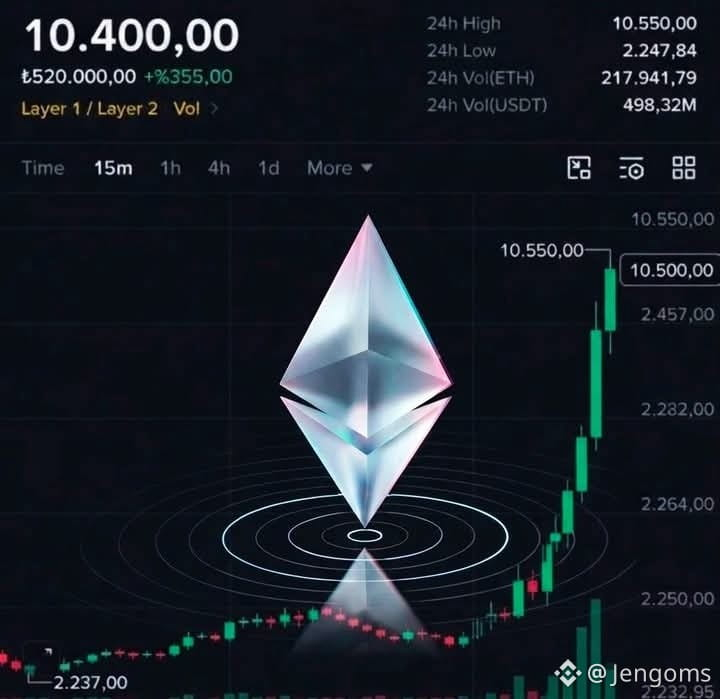
🚨 #Ethereum✅ alcanza $10,400 USDT en un aumento masivo del +355%! Año 2032.
🚨 #Ethereum✅ alcanza $10,400 USDT en un aumento masivo del +355%! Año 2032.
46
·
--
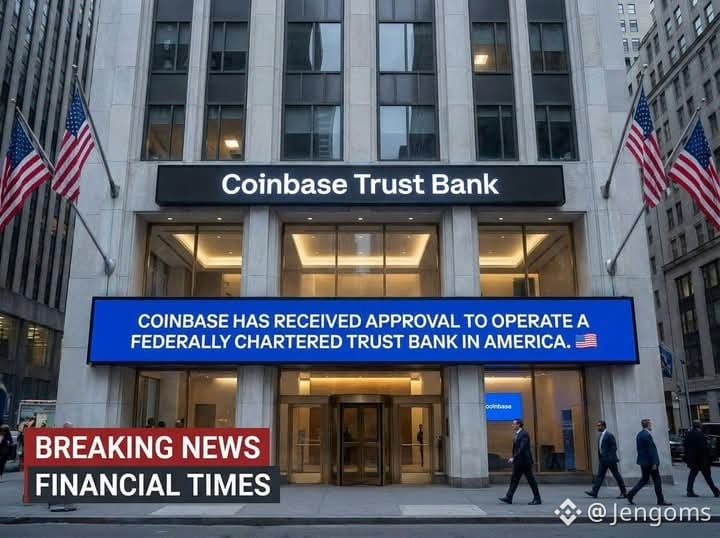
Coinbaseが、数年前なら暗号資産業界の多くの人が不可能だと思っていたことを、ついに成し遂げました!👀
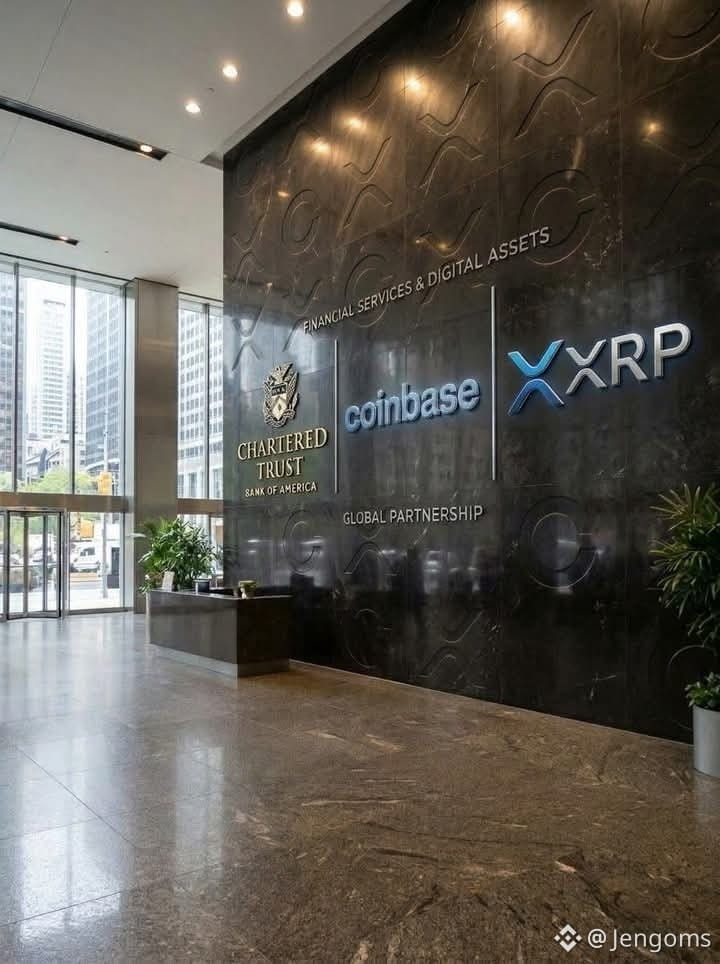
Coinbaseは、アメリカで連邦政府公認の信託銀行を運営する承認を得ました。🇺🇸
そして、$XRPを手がける企業である#Rippleも、米国で独自の全米信託銀行免許の承認を得たことを忘れてはいけません 🇺🇸
#coinbase
#Crypto_Jobs🎯
Coinbaseが、数年前なら暗号資産業界の多くの人が不可能だと思っていたことを、ついに成し遂げました!👀
Coinbaseは、アメリカで連邦政府公認の信託銀行を運営する承認を得ました。🇺🇸
そして、$XRPを手がける企業である#Rippleも、米国で独自の全米信託銀行免許の承認を得たことを忘れてはいけません 🇺🇸
#coinbase
#Crypto_Jobs🎯
Coinbaseは、アメリカで連邦政府公認の信託銀行を運営する承認を得ました。🇺🇸
そして、$XRPを手がける企業である#Rippleも、米国で独自の全米信託銀行免許の承認を得たことを忘れてはいけません 🇺🇸
#coinbase
#Crypto_Jobs🎯
149
·
--
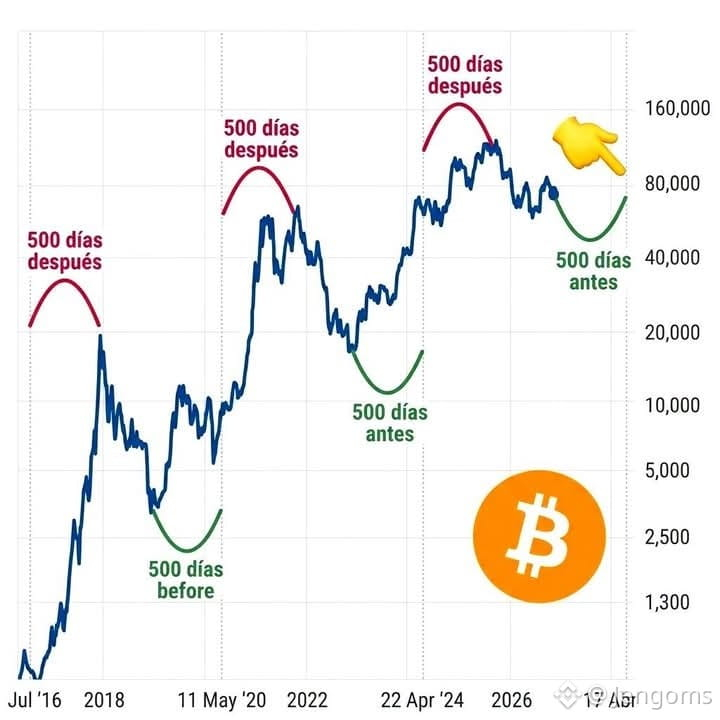
🚨 #Bitcoinのサイクル:半減期に基づく高値と安値の予測 #StrategyBuys1037BTCLastWeek $BTC
🚨 #Bitcoinのサイクル:半減期に基づく高値と安値の予測 #StrategyBuys1037BTCLastWeek $BTC
84
·
--
#BitcoinFiveWeeklyLosses 🚨 0.85ドルまで?#DOTが最高値に迫っていた頃、再び底まで下落するなんて誰も信じていなかった。
#BitcoinFiveWeeklyLosses 🚨 0.85ドルまで?#DOTが最高値に迫っていた頃、再び底まで下落するなんて誰も信じていなかった。

82
ログインして、さらにコンテンツを読む
厳選トピックで世界の暗号資産トレーダーの仲間入り
⚡️ 暗号資産に関する最新かつ有益な情報が見つかります。
💬 世界最大の暗号資産取引所から信頼されています。
👍 認証を受けたクリエイターから、有益なインサイトを得られます。
メール / 電話番号