Binance Square
mrD-Indicators
51 投稿

mrD-Indicators

Find pre-filtered Altcoin & Forex trends in seconds. Smart market screeners • Clean trading signals • Faster decision making.
11 フォロー
61 フォロワー
77 いいね
投稿
·
--
記事
翻訳参照
What Is GEX? Gamma Exposure Explained for TradersMost traders read price and volume and stop there. But on any market with a liquid options chain — equity indices, gold, and increasingly BTC and ETH — there is a second, hidden order flow that often decides whether the next move pins in a range or runs in a trend: the hedging flow of options dealers. GEX — gamma exposure — is the single number that measures it. The one-sentence version: GEX tells you whether the biggest, most price-insensitive hedgers in the market are currently dampening volatility or amplifying it. When GEX is strongly positive, dealer hedging leans against every move, and price tends to mean-revert and pin. When GEX is negative, dealer hedging pushes with every move, and price tends to trend, gap, and squeeze. Knowing which regime you are in changes how you should trade the same chart. This guide is the study-led, basics-to-advanced explainer: what gamma is, why dealers must hedge it, what GEX actually measures, the two regimes it defines, and the levels it surfaces — gamma flip, max pain, call walls, and put walls — that you can act on. We cite the literature so you can verify the mechanism, then translate it into a regime-based trading playbook. What is gamma? (the 60-second options primer) You do not need to trade options to use GEX, but you do need two Greek letters. Delta is how much an option's price moves for a $1 move in the underlying. A delta of 0.50 means the option gains about 50 cents when the underlying gains a dollar. Delta also doubles as a hedge ratio: to neutralise the directional risk of an option, you hold the opposite delta in the underlying.Gamma is how much delta itself changes for a $1 move in the underlying. It is the "acceleration" term. Gamma is largest for at-the-money options near expiry and shrinks as strikes move far in- or out-of-the-money. The reason gamma matters for the whole market, not just the option holder, is hedging. Anyone who is delta-hedging an option position must re-hedge as the price moves, because gamma keeps changing their delta. The direction in which they are forced to re-hedge depends on whether they are long gamma or short gamma, and that is the entire mechanism behind GEX. Who hedges gamma — and why dealers are the key Options dealers (market makers) exist to take the other side of customer orders. Across a typical chain, customers are net buyers of options (for leverage, for hedges, for lottery-ticket upside), which leaves dealers net sellers — and a seller of an option is short gamma on that contract. Here is the asymmetry that drives everything: A dealer who is short gamma has a delta that moves against them as the price moves. To stay hedged, they must buy the underlying as the price rises and sell it as the price falls. That is hedging in the direction of the move — it adds fuel.A dealer who is long gamma has a delta that moves with them. To stay hedged, they sell into rallies and buy into dips — hedging against the move. That removes fuel. Because dealers are enormous, price-insensitive, and mechanically obligated to hedge, their aggregate gamma position is one of the most reliable sources of non-discretionary flow in the market. GEX is the attempt to measure the sign and size of that flow. The mental model: dealers are not trying to predict direction. They are robots keeping a hedge balanced. GEX tells you which way those robots are forced to lean. What GEX actually measures Gamma exposure (GEX) aggregates the gamma of every open option position across the chain, weights each by its open interest (how many contracts are actually held), and sums them into one signed number — typically expressed as the dollar amount dealers must hedge per 1% move in the underlying. The standard sign convention (popularised by the SqueezeMetrics Gamma Exposure whitepaper) treats dealers as long call gamma and short put gamma. Under that convention: Positive GEX → dealers are net long gamma → they hedge against moves → volatility is suppressed.Negative GEX → dealers are net short gamma → they hedge with moves → volatility is amplified. You do not need to compute it by hand — the tool surfaces the aggregate as the NET GEX tile and breaks it down by strike in the profile. What matters for trading is the sign (which regime) and the levels where gamma concentrates (which strikes the hedging clusters around). The two regimes: positive vs negative gamma This is the most important section in the article, because it is the part that changes how you trade. Positive-gamma regime (the market pins) When net GEX is strongly positive — typically when price sits above the gamma flip — dealers are long gamma and sell strength / buy weakness to stay hedged. The consequences: Volatility is dampened. Rallies get sold into, dips get bought, realised volatility compresses.Price tends to pin and mean-revert, often gravitating toward the strike with the most open interest (close to max pain).Breakouts fail more often. A push toward a large call wall is met by hedging supply. How to trade it: favour range and mean-reversion tactics. Fade extremes back toward the centre of the GEX profile, treat call walls as resistance and put walls as support, and be sceptical of breakouts until the regime changes. This is the environment premium-sellers love. Negative-gamma regime (the market trends) When net GEX is negative — typically when price is below the gamma flip — dealers are short gamma and buy strength / sell weakness, hedging with the move. The consequences: Volatility is amplified. Each move forces hedging in the same direction, which extends the move.Trends run, and gaps stick. Breakouts have follow-through; squeezes and air-pockets appear.Support and resistance break more easily because the hedging flow is pushing through them, not defending them. How to trade it: favour momentum and trend-continuation tactics, use wider stops (the amplified vol will hunt tight ones), and respect that a level breaking in negative gamma is more likely to keep going than to reverse. This is the environment that produces the fast, violent moves. The gamma flip — the regime pivot The gamma flip (also called the zero-gamma level) is the price at which aggregate dealer gamma changes sign. It is the single most important level GEX produces, because it is the boundary between the two regimes above: Above the gamma flip → positive-gamma, vol-suppressing, mean-reverting.Below the gamma flip → negative-gamma, vol-amplifying, trending. Practically, traders treat a decisive cross of the gamma flip the way they treat a regime change: the character of price action is expected to switch. A market that was quietly pinning above the flip can turn fast and trendy once it loses it — and vice versa, a violent market often calms the moment it reclaims the flip. The headline tile shows the current gamma flip level; the most actionable use is simply to know which side of it you are on before you choose a range tactic or a momentum tactic. Max pain — the expiry magnet Max pain is the strike at which the aggregate value of open options is smallest for buyers at expiry — equivalently, the price at which the most contracts expire worthless. The idea has a long history in the options-pinning literature: Ni, Pearson, and Poteshman ("Stock Price Clustering on Option Expiration Dates", Journal of Financial Economics, 2005) documented that stocks cluster toward strikes with large open interest on expiry days, consistent with hedging-driven pinning. For the GEX trader, max pain is most useful as a directional bias into expiry inside a positive-gamma regime: when dealers are long gamma and actively suppressing vol, price tends to drift toward the concentration of open interest. It is a magnet, not a guarantee — in a negative-gamma regime, the amplifying flow can easily overwhelm it. Read max pain together with the GEX sign, never alone. GEX by strike: call walls and put walls Net GEX tells you the regime; the GEX-by-strike profile tells you where the hedging concentrates, and those concentrations become tradeable levels on the chart. Call wall — the strike above price with the largest positive gamma exposure. Dealer hedging there sells into strength, so it tends to act as resistance and an upside magnet/cap. Price often grinds toward it and stalls in a positive-gamma regime.Put wall — the strike below price with the largest negative gamma exposure. Hedging there buys into weakness, so it tends to act as support. It is the level that the downside most often respects while positioning holds. Together, the call wall and put wall bracket the range the market is most likely to honour until the option positioning meaningfully changes (typically around expiry or after a large repositioning). Drawing them on the price chart turns an abstract options statistic into concrete support/resistance you can plan entries, stops, and targets around. A note on VEX and CEX The profile also exposes two second-order cousins of GEX that advanced traders watch: VEX (vanna exposure) — sensitivity of dealer delta to changes in implied volatility. When IV moves, vanna hedging adds flow; it is a big driver of the slow grind higher in falling-IV environments.CEX (charm exposure) — sensitivity of dealer delta to the passage of time (delta decay). Charm flows are strongest into expiry and help explain end-of-week and end-of-day drift. You can trade GEX well without mastering these — treat them as confirmation. When VEX and CEX point the same way as the gamma read, conviction is higher. GEX for crypto, gold, and indices GEX began as an equity-index tool, but the mechanism is asset-agnostic: anywhere there is a deep options chain with real open interest, dealers hedge gamma, and the regime read applies. mrD computes the full GEX picture across asset classes: Crypto (#BTC, #ETH). Both have liquid options markets, so the gamma flip, walls, max pain, and the positive/negative regime all translate directly. The crypto view adds an ATM IV read, a volatility index, and a skew / risk-reversal tile so you can see whether the crowd is paying up for upside or downside — context that complements the gamma read. Crypto also trades 24/7, so the underlying keeps moving even when the options positioning (which only changes as new contracts trade) updates more slowly.Gold and major US index ETFs. The same headline tiles and walls apply; the levels are mapped onto whatever instrument you chart, so they line up with your price scale. The practical payoff of multi-asset coverage is the same as for any scanner: a clean, tradeable GEX setup — a fresh gamma-flip cross, or price pinned between a loaded call and put wall — does not appear on every market every day, but across crypto, gold, and indices it tends to line up somewhere. How to trade with GEX — a regime-based playbook GEX is not a buy/sell signal; it is a context filter that tells you which playbook to run on the chart you are already reading. Read the sign first (regime). Is net GEX positive (expect pinning, mean reversion) or negative (expect trending, amplification)? This decides whether you are a fader or a momentum trader today.Locate yourself against the gamma flip. Above it confirms the positive-gamma regime; below it confirms the negative. A market hovering right at the flip is the least predictable — size down or stand aside until it picks a side.Mark the walls. Draw the call wall (resistance/cap) and put the wall (support). In positive gamma, fade toward the centre and treat the walls as the range boundaries. In negative gamma, a wall that breaks is more likely to become a launchpad than a reversal.Add max pain as an expiry bias. In a positive-gamma regime approaching expiry, lean toward the drift into max pain. Drop it in negative gamma.Confirm with the rest of your reading. #GEX positioning plus your usual structure (trend, support/resistance) plus order flow (orderbook depth, CVD) is a far stronger thesis than #GEX alone. The levels are most powerful where they coincide with a structural level you already respected. The discipline is the same as every other tool on the platform: GEX supplies the bias and the levels; your entry trigger and invalidation still come from price and structure. Common mistakes Treating GEX as a signal instead of a regime. GEX does not say "buy here." It says "in this regime, range tactics work / momentum tactics work." Trading it as a trigger is the most common beginner error. Ignoring the sign and trading the walls blindly. A call wall is resistance in positive gamma. In negative gamma, the same wall can be sliced straight through as amplifying flow runs the market. Always read the sign before you trust a wall. Forgetting positioning is a snapshot, not a guarantee. GEX is computed from the current open interest. It is an estimate of likely dealer flow under standard assumptions, not a record of every dealer's book. Around large expiries or after a big repositioning, the whole map can shift. Re-read it; do not anchor to a stale level. Using max pain alone. Max pain is a magnet only when the regime supports it. In negative gamma, it is routinely overrun. Pair it with the GEX sign or skip it. Confusing GEX with resting liquidity or forced flow. GEX is an options dealer positioning. It is a different lens from the orderbook heatmap (resting limit orders) and the liquidation heatmap (forced leverage flow). They are complementary, not interchangeable — the strongest reads stack all three. References and further reading SqueezeMetrics. Gamma Exposure (GEX). The whitepaper that popularised the dealer-gamma framing and the sign convention used above.Ni, S. X., Pearson, N. D. & Poteshman, A. M. (2005). Stock Price Clustering on Option Expiration Dates. Journal of Financial Economics, 78(1) — empirical evidence for option-expiry pinning.Gârleanu, N., Pedersen, L. H. & Poteshman, A. M. (2009). Demand-Based Option Pricing. Review of Financial Studies, 22(10) — how customer demand and dealer inventory affect option prices and hedging.Black, F. & Scholes, M. (1973). The Pricing of Options and Corporate Liabilities. Journal of Political Economy — the delta-hedging foundation that makes gamma hedging necessary in the first place. This article is educational, not financial advice. GEX is a model-based estimate of dealer positioning, not a record of real orders. Trading involves risk; never risk capital you cannot afford to lose.

What Is GEX? Gamma Exposure Explained for Traders

Most traders read price and volume and stop there. But on any market with a liquid options chain — equity indices, gold, and increasingly BTC and ETH — there is a second, hidden order flow that often decides whether the next move pins in a range or runs in a trend: the hedging flow of options dealers. GEX — gamma exposure — is the single number that measures it.
The one-sentence version: GEX tells you whether the biggest, most price-insensitive hedgers in the market are currently dampening volatility or amplifying it. When GEX is strongly positive, dealer hedging leans against every move, and price tends to mean-revert and pin. When GEX is negative, dealer hedging pushes with every move, and price tends to trend, gap, and squeeze. Knowing which regime you are in changes how you should trade the same chart.
This guide is the study-led, basics-to-advanced explainer: what gamma is, why dealers must hedge it, what GEX actually measures, the two regimes it defines, and the levels it surfaces — gamma flip, max pain, call walls, and put walls — that you can act on. We cite the literature so you can verify the mechanism, then translate it into a regime-based trading playbook.
What is gamma? (the 60-second options primer)
You do not need to trade options to use GEX, but you do need two Greek letters.
Delta is how much an option's price moves for a $1 move in the underlying. A delta of 0.50 means the option gains about 50 cents when the underlying gains a dollar. Delta also doubles as a hedge ratio: to neutralise the directional risk of an option, you hold the opposite delta in the underlying.Gamma is how much delta itself changes for a $1 move in the underlying. It is the "acceleration" term. Gamma is largest for at-the-money options near expiry and shrinks as strikes move far in- or out-of-the-money.
The reason gamma matters for the whole market, not just the option holder, is hedging. Anyone who is delta-hedging an option position must re-hedge as the price moves, because gamma keeps changing their delta. The direction in which they are forced to re-hedge depends on whether they are long gamma or short gamma, and that is the entire mechanism behind GEX.
Who hedges gamma — and why dealers are the key
Options dealers (market makers) exist to take the other side of customer orders. Across a typical chain, customers are net buyers of options (for leverage, for hedges, for lottery-ticket upside), which leaves dealers net sellers — and a seller of an option is short gamma on that contract.
Here is the asymmetry that drives everything:
A dealer who is short gamma has a delta that moves against them as the price moves. To stay hedged, they must buy the underlying as the price rises and sell it as the price falls. That is hedging in the direction of the move — it adds fuel.A dealer who is long gamma has a delta that moves with them. To stay hedged, they sell into rallies and buy into dips — hedging against the move. That removes fuel.
Because dealers are enormous, price-insensitive, and mechanically obligated to hedge, their aggregate gamma position is one of the most reliable sources of non-discretionary flow in the market. GEX is the attempt to measure the sign and size of that flow.
The mental model: dealers are not trying to predict direction. They are robots keeping a hedge balanced. GEX tells you which way those robots are forced to lean.
What GEX actually measures
Gamma exposure (GEX) aggregates the gamma of every open option position across the chain, weights each by its open interest (how many contracts are actually held), and sums them into one signed number — typically expressed as the dollar amount dealers must hedge per 1% move in the underlying.
The standard sign convention (popularised by the SqueezeMetrics Gamma Exposure whitepaper) treats dealers as long call gamma and short put gamma. Under that convention:
Positive GEX → dealers are net long gamma → they hedge against moves → volatility is suppressed.Negative GEX → dealers are net short gamma → they hedge with moves → volatility is amplified.
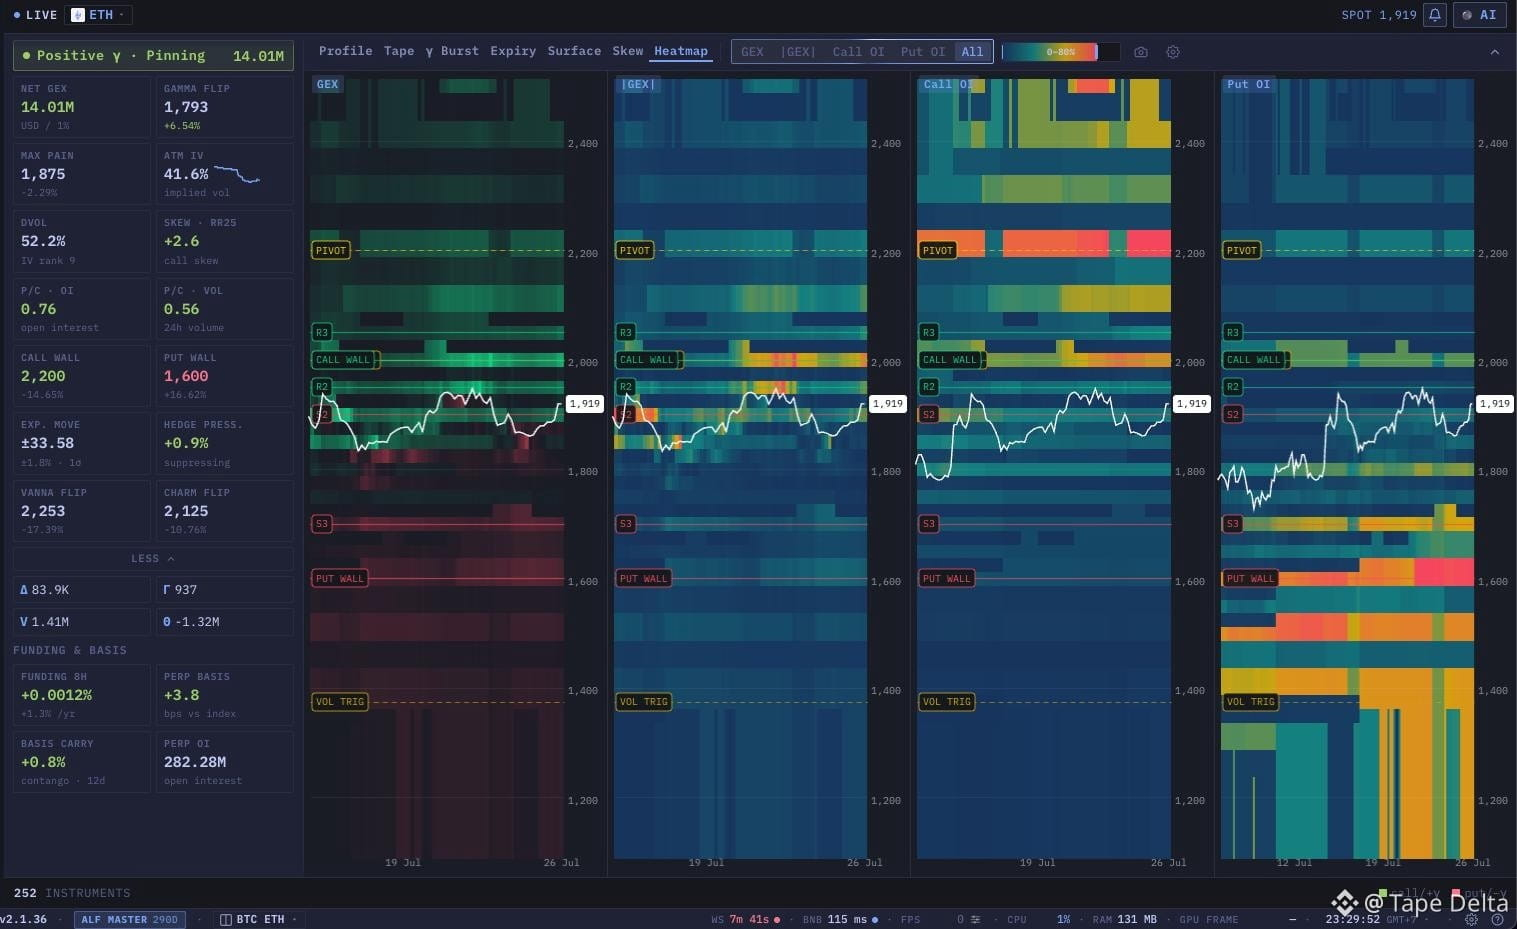
You do not need to compute it by hand — the tool surfaces the aggregate as the NET GEX tile and breaks it down by strike in the profile. What matters for trading is the sign (which regime) and the levels where gamma concentrates (which strikes the hedging clusters around).
The two regimes: positive vs negative gamma
This is the most important section in the article, because it is the part that changes how you trade.
Positive-gamma regime (the market pins)
When net GEX is strongly positive — typically when price sits above the gamma flip — dealers are long gamma and sell strength / buy weakness to stay hedged. The consequences:
Volatility is dampened. Rallies get sold into, dips get bought, realised volatility compresses.Price tends to pin and mean-revert, often gravitating toward the strike with the most open interest (close to max pain).Breakouts fail more often. A push toward a large call wall is met by hedging supply.
How to trade it: favour range and mean-reversion tactics. Fade extremes back toward the centre of the GEX profile, treat call walls as resistance and put walls as support, and be sceptical of breakouts until the regime changes. This is the environment premium-sellers love.
Negative-gamma regime (the market trends)
When net GEX is negative — typically when price is below the gamma flip — dealers are short gamma and buy strength / sell weakness, hedging with the move. The consequences:
Volatility is amplified. Each move forces hedging in the same direction, which extends the move.Trends run, and gaps stick. Breakouts have follow-through; squeezes and air-pockets appear.Support and resistance break more easily because the hedging flow is pushing through them, not defending them.
How to trade it: favour momentum and trend-continuation tactics, use wider stops (the amplified vol will hunt tight ones), and respect that a level breaking in negative gamma is more likely to keep going than to reverse. This is the environment that produces the fast, violent moves.
The gamma flip — the regime pivot
The gamma flip (also called the zero-gamma level) is the price at which aggregate dealer gamma changes sign. It is the single most important level GEX produces, because it is the boundary between the two regimes above:
Above the gamma flip → positive-gamma, vol-suppressing, mean-reverting.Below the gamma flip → negative-gamma, vol-amplifying, trending.
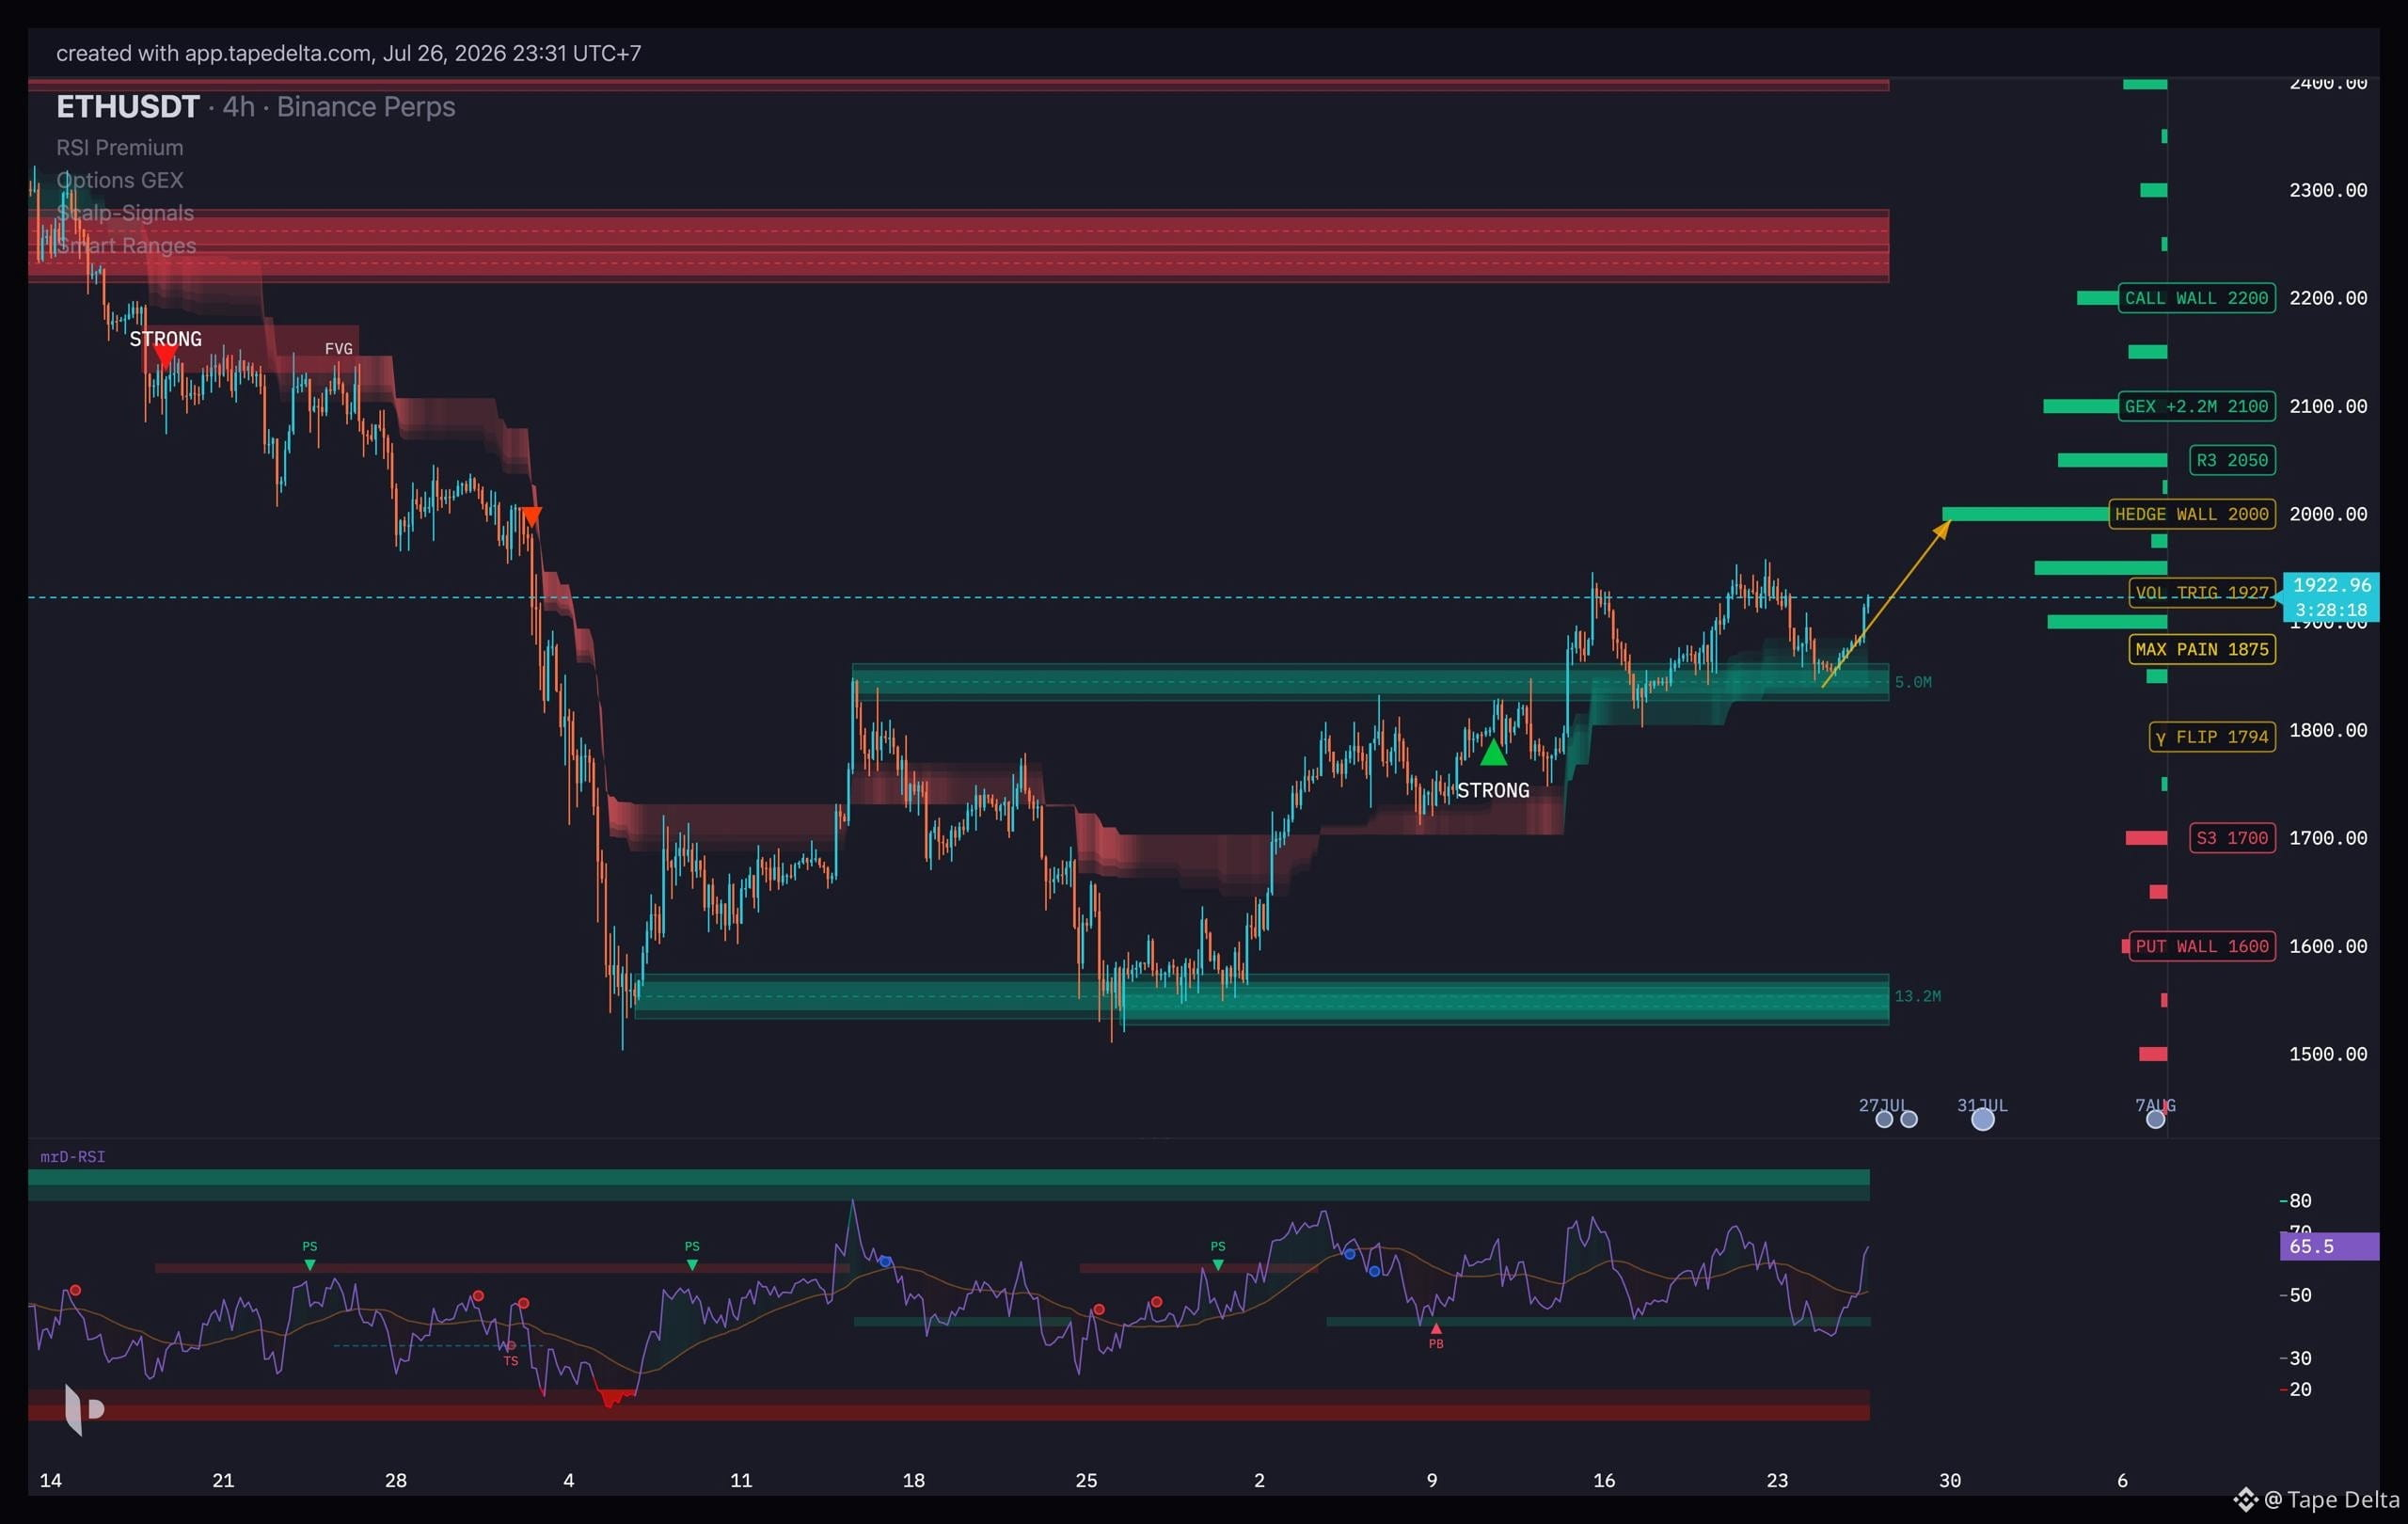
Practically, traders treat a decisive cross of the gamma flip the way they treat a regime change: the character of price action is expected to switch. A market that was quietly pinning above the flip can turn fast and trendy once it loses it — and vice versa, a violent market often calms the moment it reclaims the flip. The headline tile shows the current gamma flip level; the most actionable use is simply to know which side of it you are on before you choose a range tactic or a momentum tactic.
Max pain — the expiry magnet
Max pain is the strike at which the aggregate value of open options is smallest for buyers at expiry — equivalently, the price at which the most contracts expire worthless. The idea has a long history in the options-pinning literature: Ni, Pearson, and Poteshman ("Stock Price Clustering on Option Expiration Dates", Journal of Financial Economics, 2005) documented that stocks cluster toward strikes with large open interest on expiry days, consistent with hedging-driven pinning.
For the GEX trader, max pain is most useful as a directional bias into expiry inside a positive-gamma regime: when dealers are long gamma and actively suppressing vol, price tends to drift toward the concentration of open interest. It is a magnet, not a guarantee — in a negative-gamma regime, the amplifying flow can easily overwhelm it. Read max pain together with the GEX sign, never alone.
GEX by strike: call walls and put walls
Net GEX tells you the regime; the GEX-by-strike profile tells you where the hedging concentrates, and those concentrations become tradeable levels on the chart.
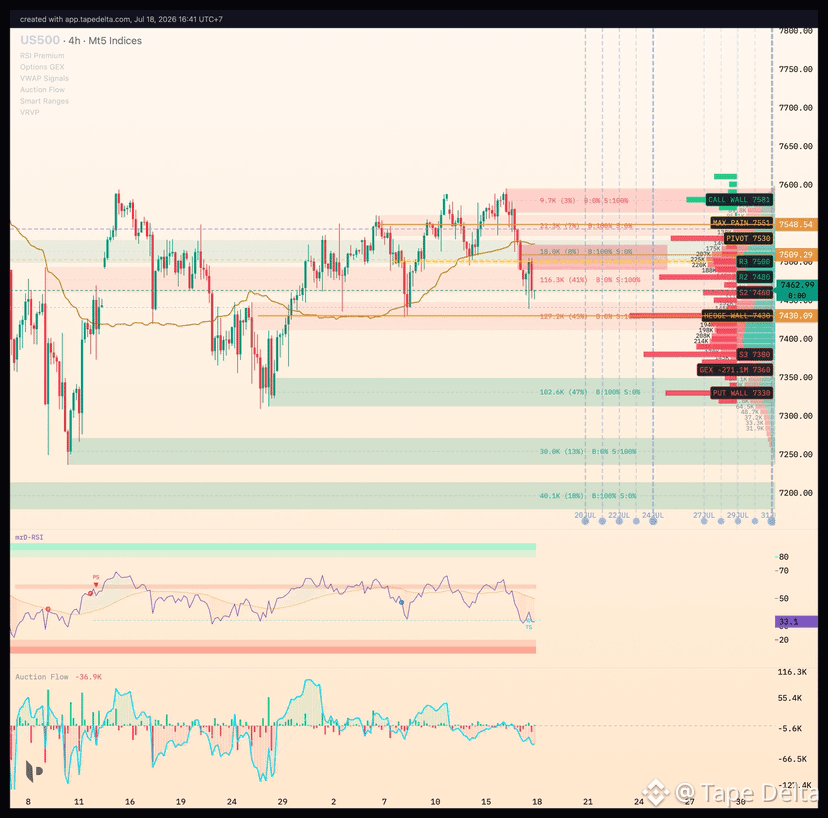
Call wall — the strike above price with the largest positive gamma exposure. Dealer hedging there sells into strength, so it tends to act as resistance and an upside magnet/cap. Price often grinds toward it and stalls in a positive-gamma regime.Put wall — the strike below price with the largest negative gamma exposure. Hedging there buys into weakness, so it tends to act as support. It is the level that the downside most often respects while positioning holds.
Together, the call wall and put wall bracket the range the market is most likely to honour until the option positioning meaningfully changes (typically around expiry or after a large repositioning). Drawing them on the price chart turns an abstract options statistic into concrete support/resistance you can plan entries, stops, and targets around.
A note on VEX and CEX
The profile also exposes two second-order cousins of GEX that advanced traders watch:
VEX (vanna exposure) — sensitivity of dealer delta to changes in implied volatility. When IV moves, vanna hedging adds flow; it is a big driver of the slow grind higher in falling-IV environments.CEX (charm exposure) — sensitivity of dealer delta to the passage of time (delta decay). Charm flows are strongest into expiry and help explain end-of-week and end-of-day drift.
You can trade GEX well without mastering these — treat them as confirmation. When VEX and CEX point the same way as the gamma read, conviction is higher.
GEX for crypto, gold, and indices
GEX began as an equity-index tool, but the mechanism is asset-agnostic: anywhere there is a deep options chain with real open interest, dealers hedge gamma, and the regime read applies. mrD computes the full GEX picture across asset classes:
Crypto (#BTC, #ETH). Both have liquid options markets, so the gamma flip, walls, max pain, and the positive/negative regime all translate directly. The crypto view adds an ATM IV read, a volatility index, and a skew / risk-reversal tile so you can see whether the crowd is paying up for upside or downside — context that complements the gamma read. Crypto also trades 24/7, so the underlying keeps moving even when the options positioning (which only changes as new contracts trade) updates more slowly.Gold and major US index ETFs. The same headline tiles and walls apply; the levels are mapped onto whatever instrument you chart, so they line up with your price scale.
The practical payoff of multi-asset coverage is the same as for any scanner: a clean, tradeable GEX setup — a fresh gamma-flip cross, or price pinned between a loaded call and put wall — does not appear on every market every day, but across crypto, gold, and indices it tends to line up somewhere.
How to trade with GEX — a regime-based playbook
GEX is not a buy/sell signal; it is a context filter that tells you which playbook to run on the chart you are already reading.
Read the sign first (regime). Is net GEX positive (expect pinning, mean reversion) or negative (expect trending, amplification)? This decides whether you are a fader or a momentum trader today.Locate yourself against the gamma flip. Above it confirms the positive-gamma regime; below it confirms the negative. A market hovering right at the flip is the least predictable — size down or stand aside until it picks a side.Mark the walls. Draw the call wall (resistance/cap) and put the wall (support). In positive gamma, fade toward the centre and treat the walls as the range boundaries. In negative gamma, a wall that breaks is more likely to become a launchpad than a reversal.Add max pain as an expiry bias. In a positive-gamma regime approaching expiry, lean toward the drift into max pain. Drop it in negative gamma.Confirm with the rest of your reading. #GEX positioning plus your usual structure (trend, support/resistance) plus order flow (orderbook depth, CVD) is a far stronger thesis than #GEX alone. The levels are most powerful where they coincide with a structural level you already respected.
The discipline is the same as every other tool on the platform: GEX supplies the bias and the levels; your entry trigger and invalidation still come from price and structure.
Common mistakes
Treating GEX as a signal instead of a regime. GEX does not say "buy here." It says "in this regime, range tactics work / momentum tactics work." Trading it as a trigger is the most common beginner error.
Ignoring the sign and trading the walls blindly. A call wall is resistance in positive gamma. In negative gamma, the same wall can be sliced straight through as amplifying flow runs the market. Always read the sign before you trust a wall.
Forgetting positioning is a snapshot, not a guarantee. GEX is computed from the current open interest. It is an estimate of likely dealer flow under standard assumptions, not a record of every dealer's book. Around large expiries or after a big repositioning, the whole map can shift. Re-read it; do not anchor to a stale level.
Using max pain alone. Max pain is a magnet only when the regime supports it. In negative gamma, it is routinely overrun. Pair it with the GEX sign or skip it.
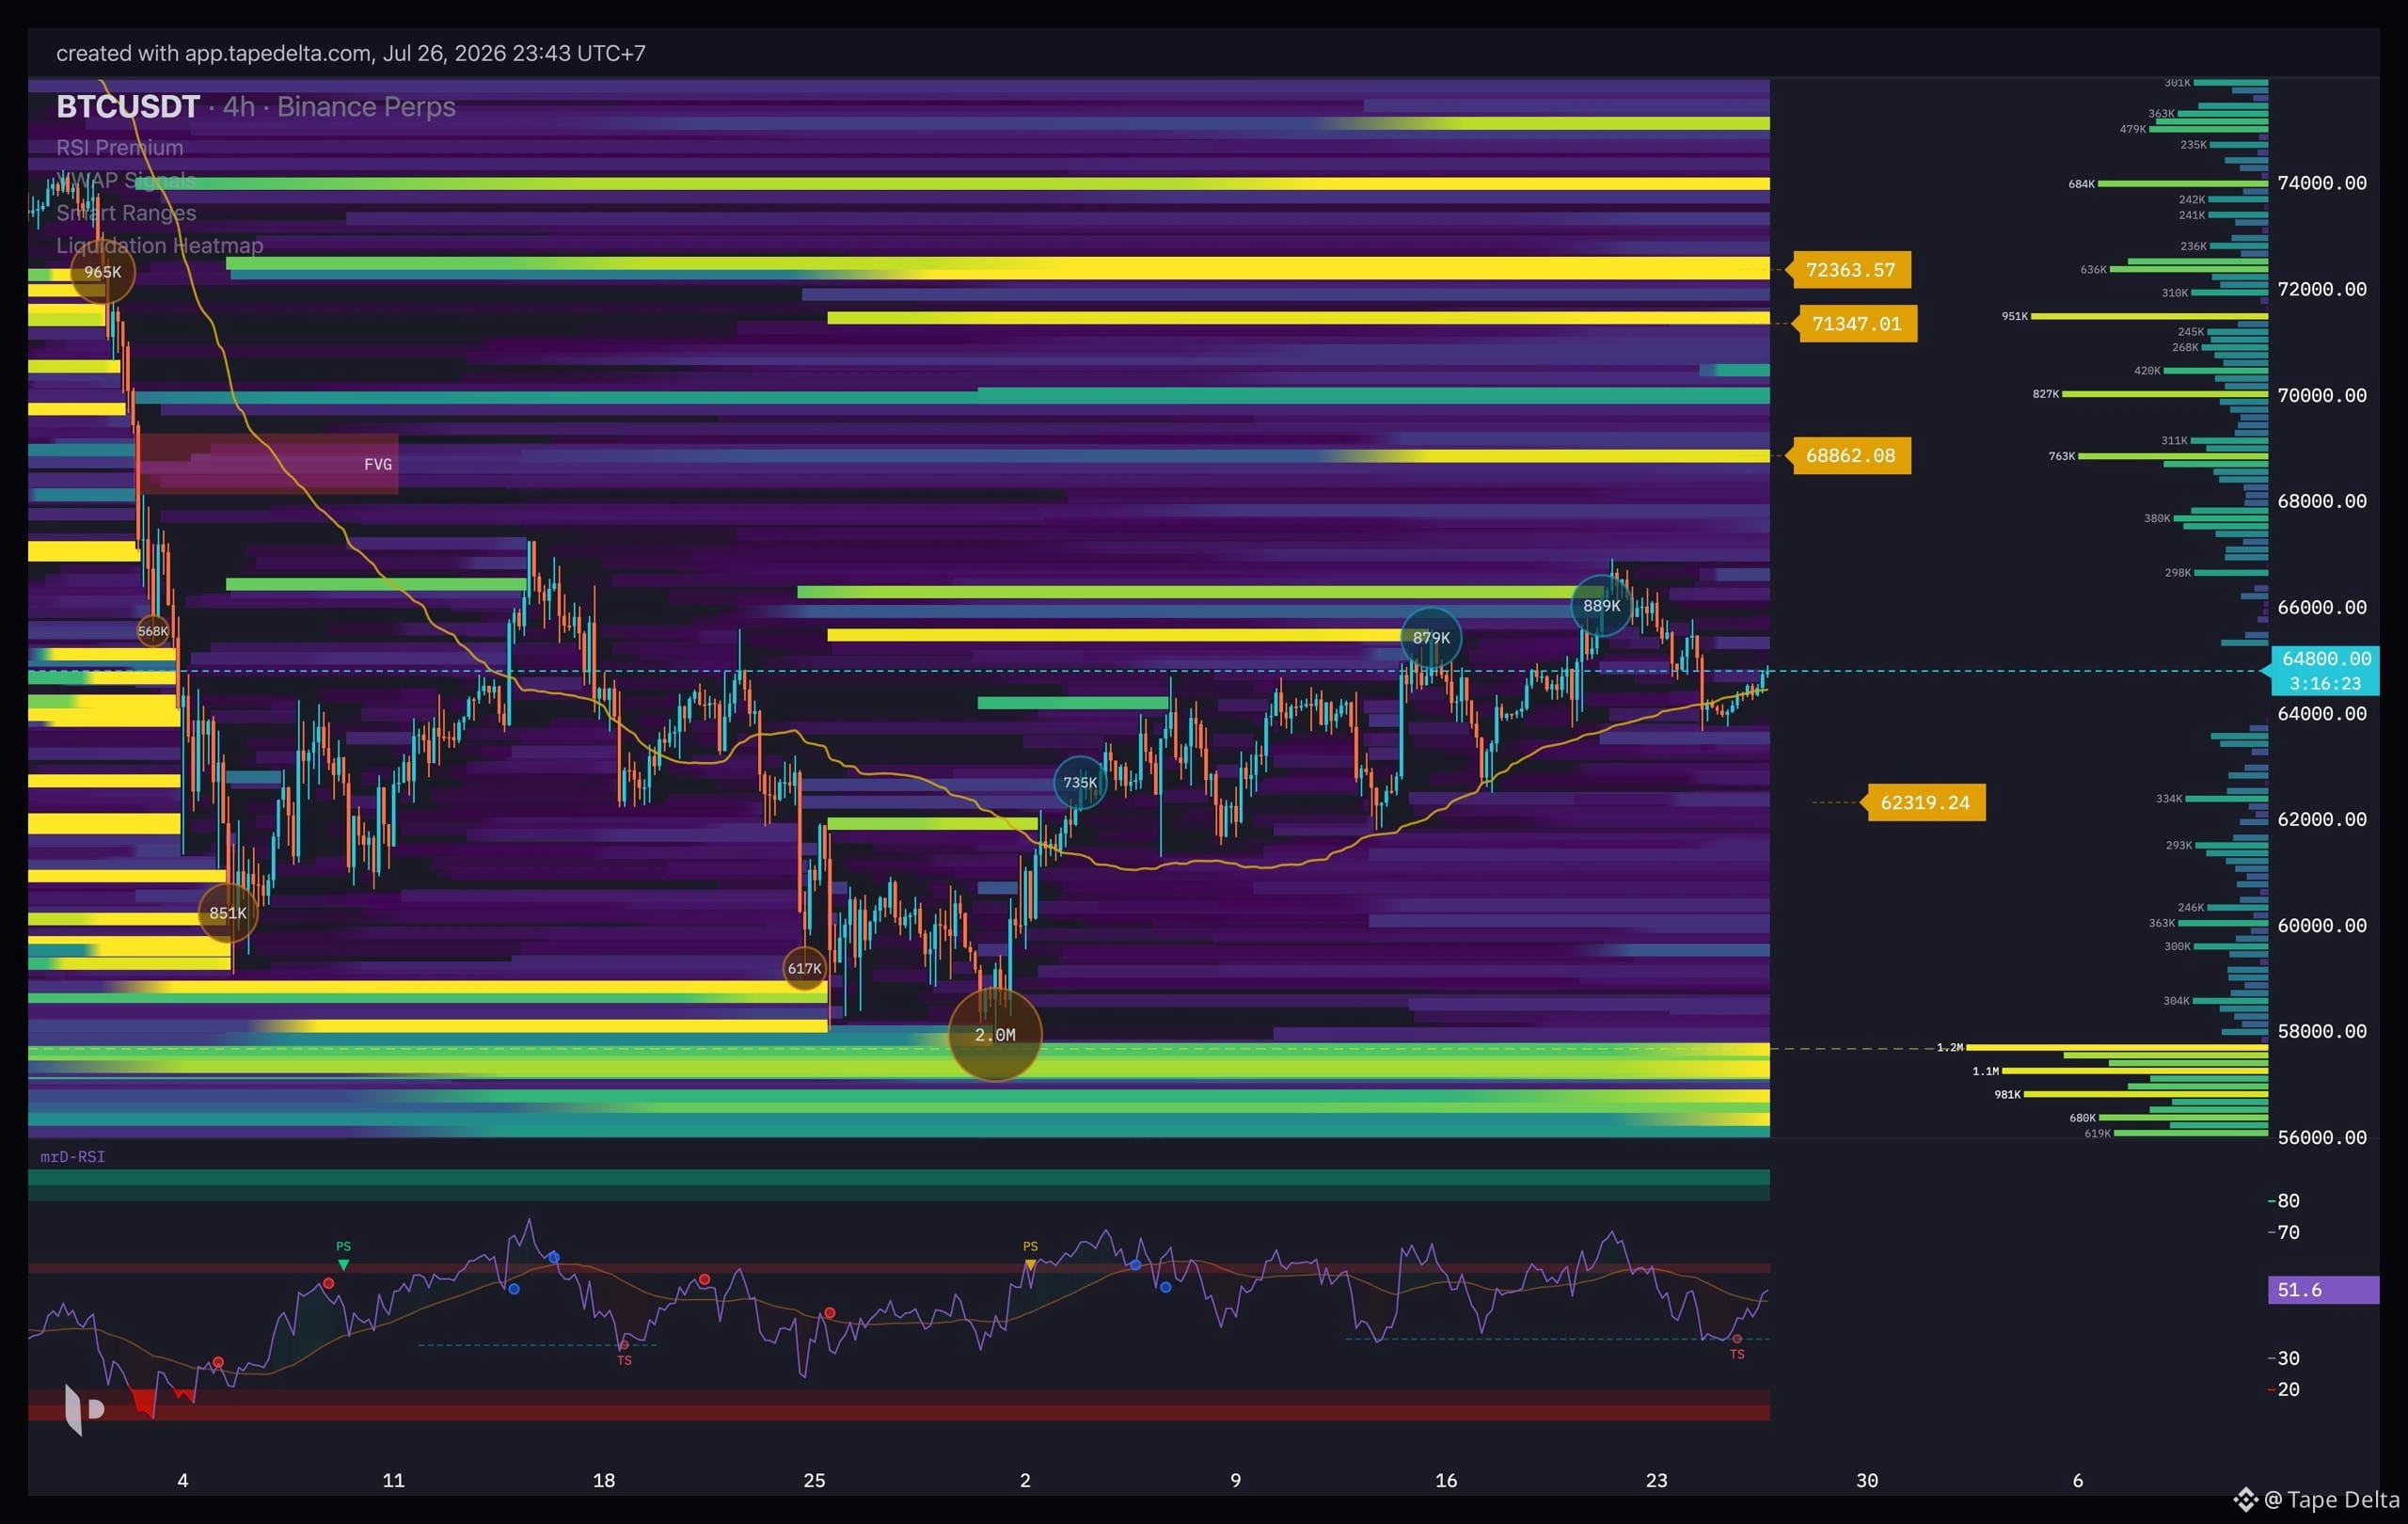
Confusing GEX with resting liquidity or forced flow. GEX is an options dealer positioning. It is a different lens from the orderbook heatmap (resting limit orders) and the liquidation heatmap (forced leverage flow). They are complementary, not interchangeable — the strongest reads stack all three.
References and further reading
SqueezeMetrics. Gamma Exposure (GEX). The whitepaper that popularised the dealer-gamma framing and the sign convention used above.Ni, S. X., Pearson, N. D. & Poteshman, A. M. (2005). Stock Price Clustering on Option Expiration Dates. Journal of Financial Economics, 78(1) — empirical evidence for option-expiry pinning.Gârleanu, N., Pedersen, L. H. & Poteshman, A. M. (2009). Demand-Based Option Pricing. Review of Financial Studies, 22(10) — how customer demand and dealer inventory affect option prices and hedging.Black, F. & Scholes, M. (1973). The Pricing of Options and Corporate Liabilities. Journal of Political Economy — the delta-hedging foundation that makes gamma hedging necessary in the first place.
This article is educational, not financial advice. GEX is a model-based estimate of dealer positioning, not a record of real orders. Trading involves risk; never risk capital you cannot afford to lose.
記事
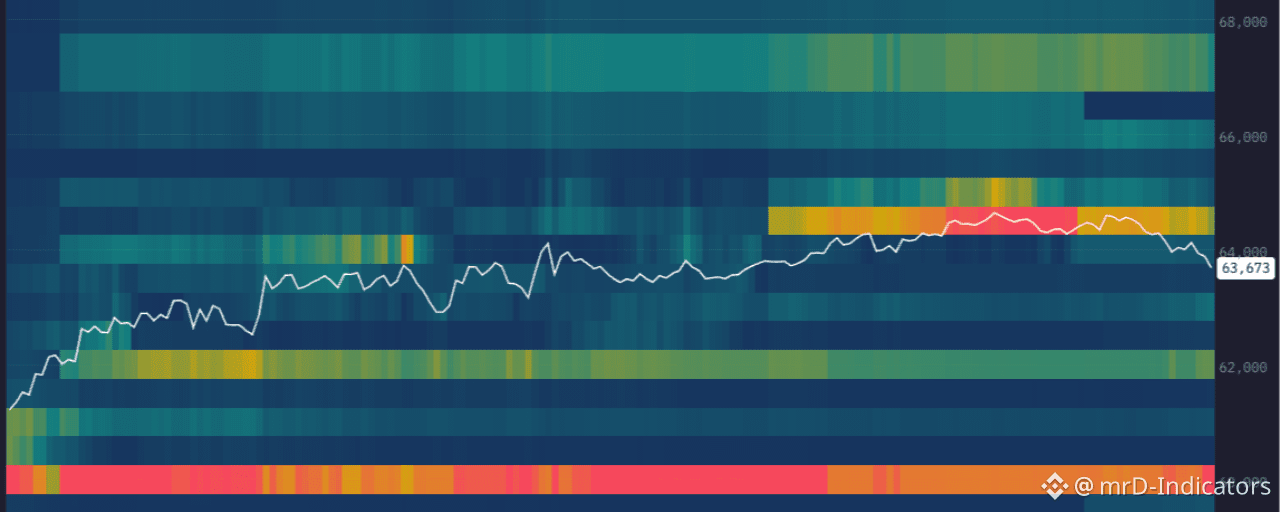
清算ヒートマップ + RSI: 長期トレンド波のトレード大半の清算ヒートマップの紹介は、価格が集まった流動性に引き寄せられ、タップして反転するマグネットとして教えています — だからそのタップをフェードするんです。その説明は間違ってはいませんが、不完全です。そして、数週間の波を乗りこなそうとしているトレーダーにとって、それはしばしばあまり利益の出ない側面です。このガイドでは、もう一方の側面を真剣に取り扱います。清算クラスターを静的なサポートやレジスタンスではなく、優勢なトレンドの燃料として捉え、RSIと組み合わせて — モメンタムレジームのツールとして読み取り — 長期的な波を定義し、乗りこなします。

清算ヒートマップ + RSI: 長期トレンド波のトレード

大半の清算ヒートマップの紹介は、価格が集まった流動性に引き寄せられ、タップして反転するマグネットとして教えています — だからそのタップをフェードするんです。その説明は間違ってはいませんが、不完全です。そして、数週間の波を乗りこなそうとしているトレーダーにとって、それはしばしばあまり利益の出ない側面です。このガイドでは、もう一方の側面を真剣に取り扱います。清算クラスターを静的なサポートやレジスタンスではなく、優勢なトレンドの燃料として捉え、RSIと組み合わせて — モメンタムレジームのツールとして読み取り — 長期的な波を定義し、乗りこなします。
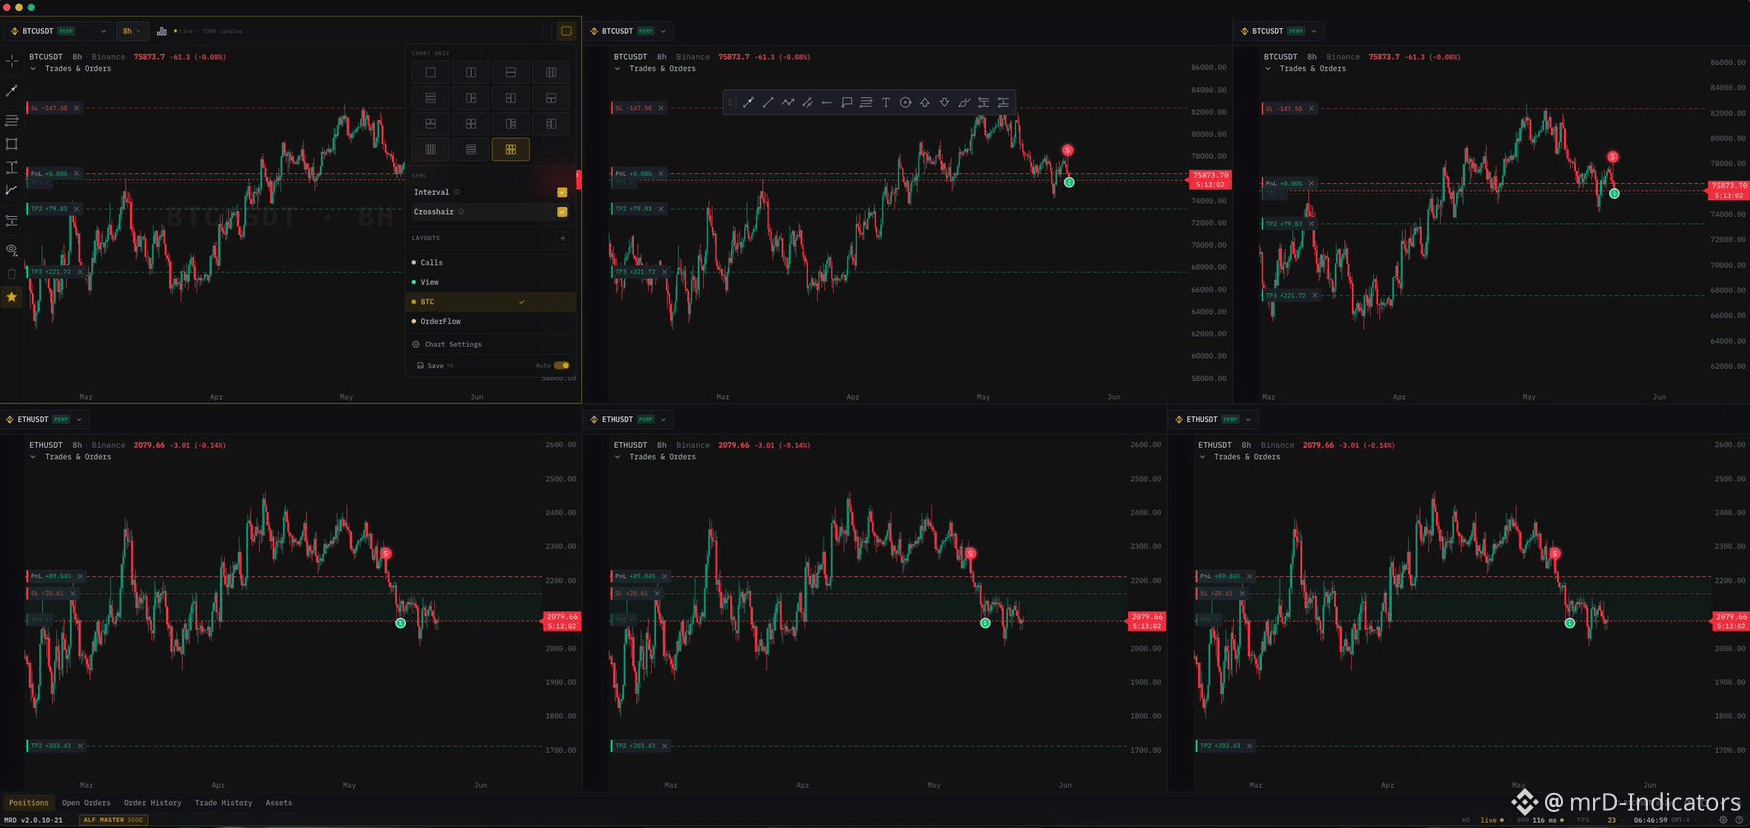
マルチチャートモードで全てのセットアップを同期 — BTC、ETH、複数のタイムフレーム、トレードシグナルを一つのクリーンなワークスペースで追跡し、動きを逃さない。
·
--
弱気相場
$ZEC クリーンな売りシグナルがRSI抵抗で発生🔥 「S」シグナルが出た後、価格はアグレッシブに崩れ、複数のTPレベルを粉砕しました📉 これが、プルバックエントリーとRSIモメンタムを組み合わせることで、トレンドを早期にキャッチし、ムーブに乗る手助けになる理由です。
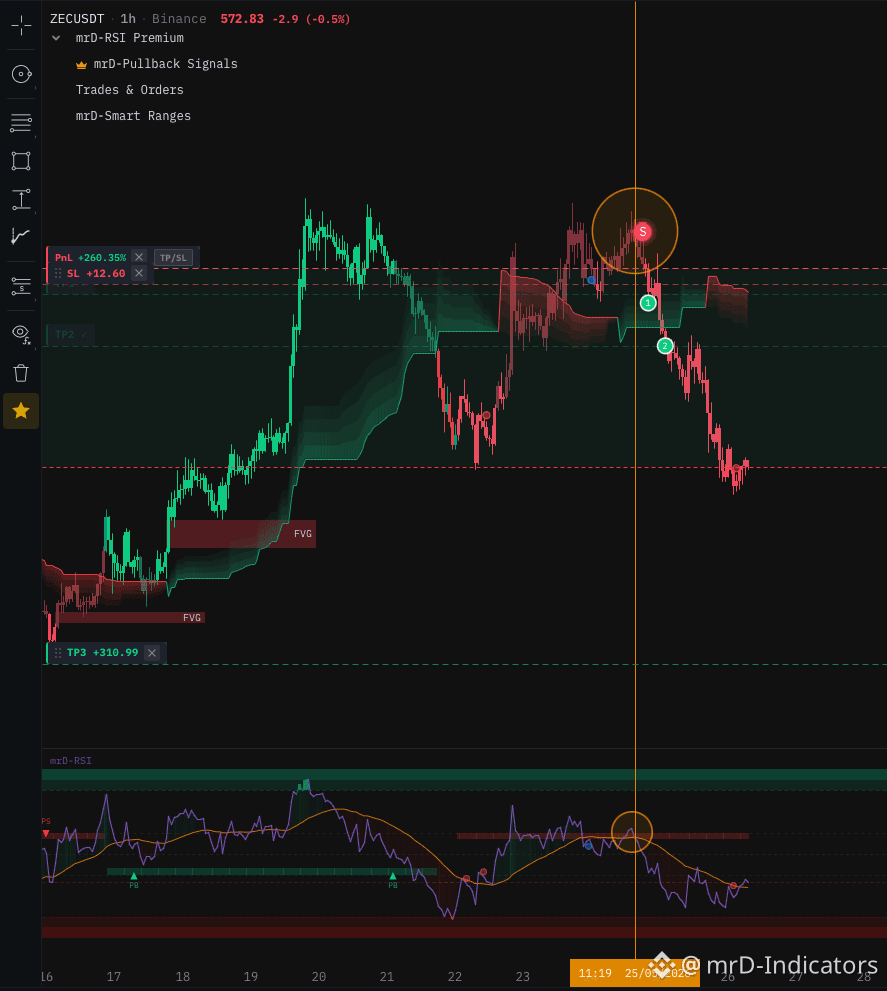
$ZEC クリーンな売りシグナルがRSI抵抗で発生🔥

「S」シグナルが出た後、価格はアグレッシブに崩れ、複数のTPレベルを粉砕しました📉

これが、プルバックエントリーとRSIモメンタムを組み合わせることで、トレンドを早期にキャッチし、ムーブに乗る手助けになる理由です。
·
--
ブリッシュ
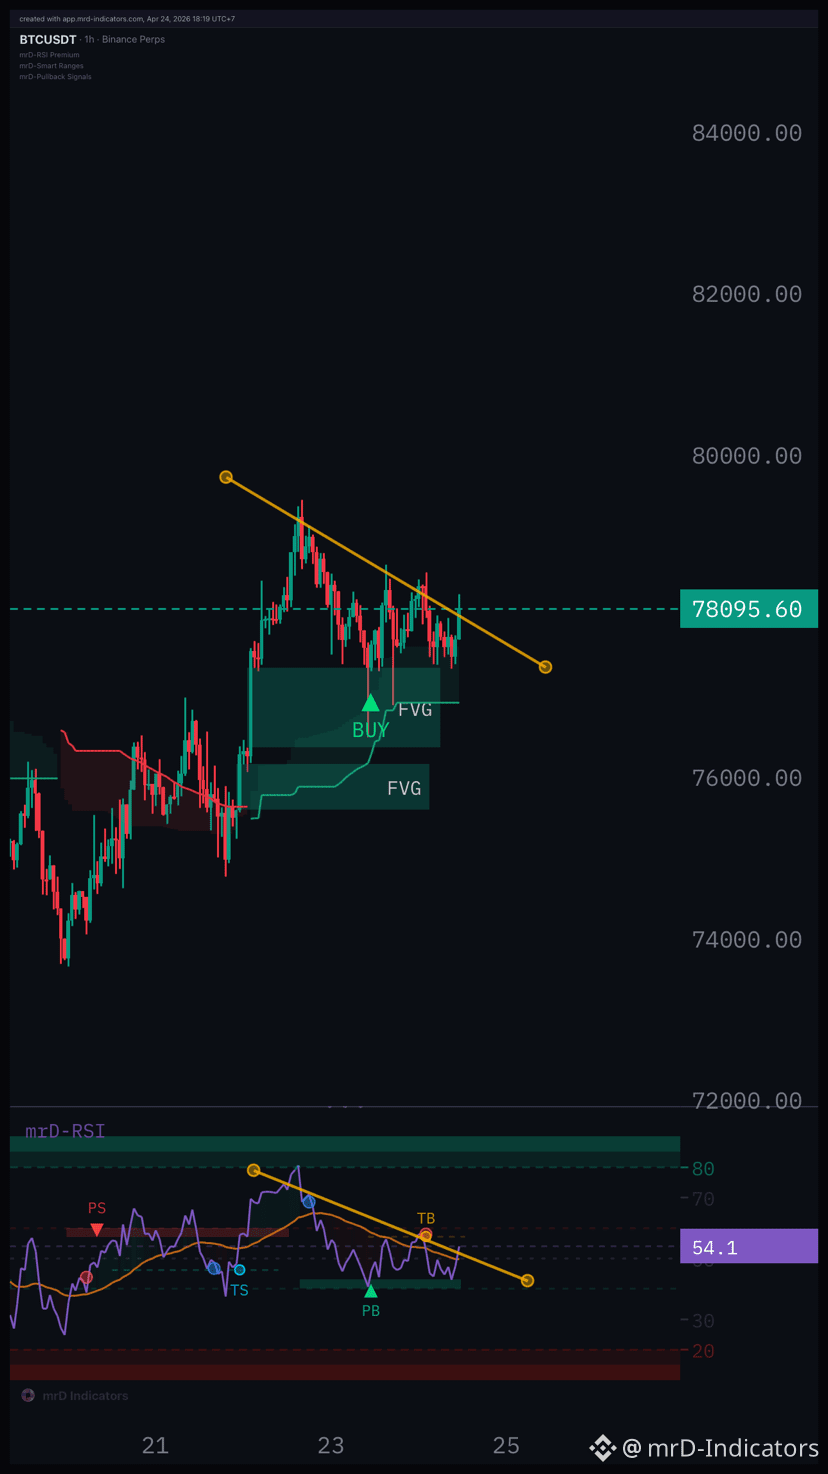
高値が下がってきてる…BTCの次はどうなる? #btc
高値が下がってきてる…BTCの次はどうなる?
#btc
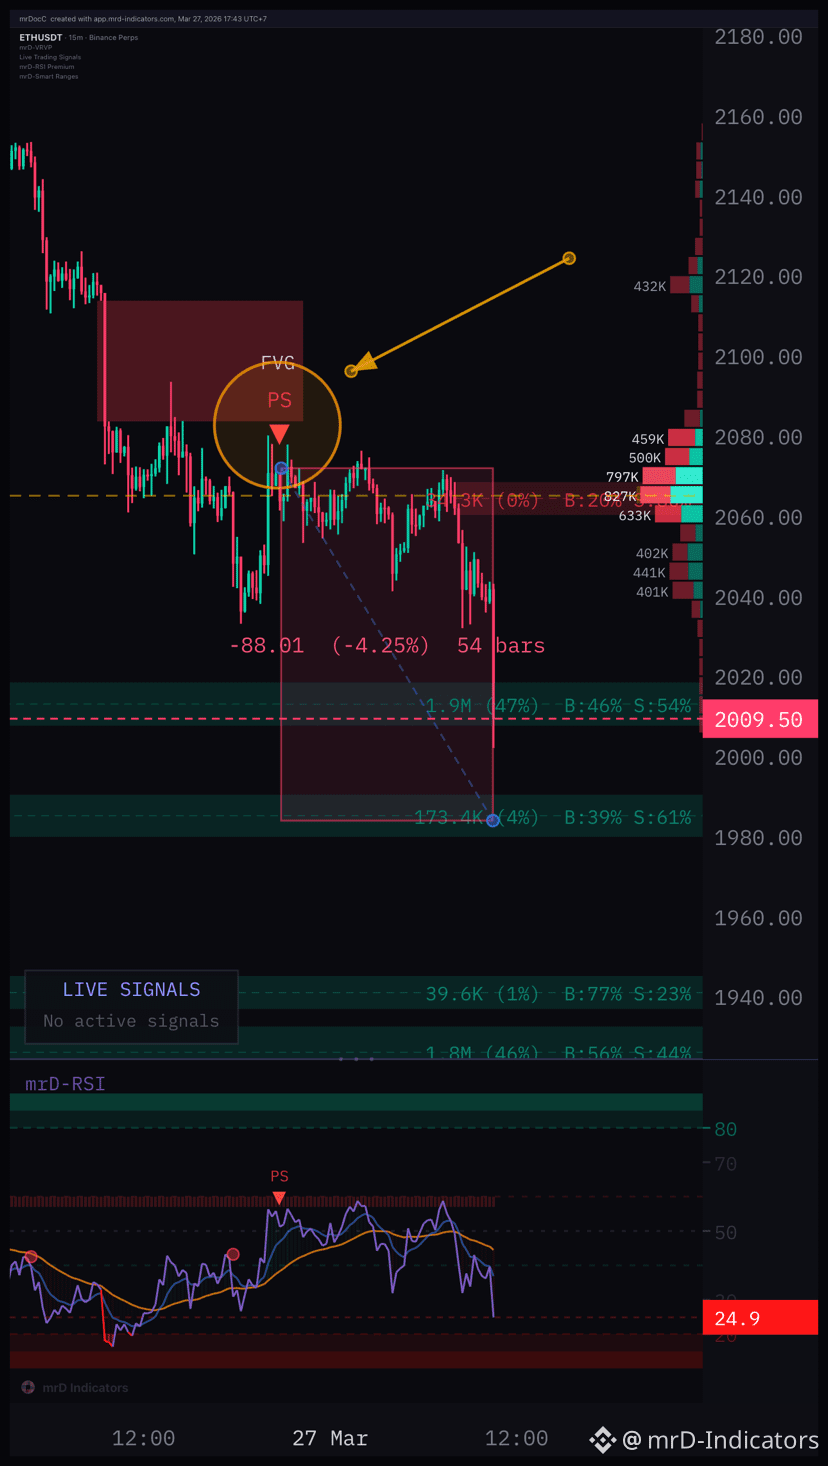
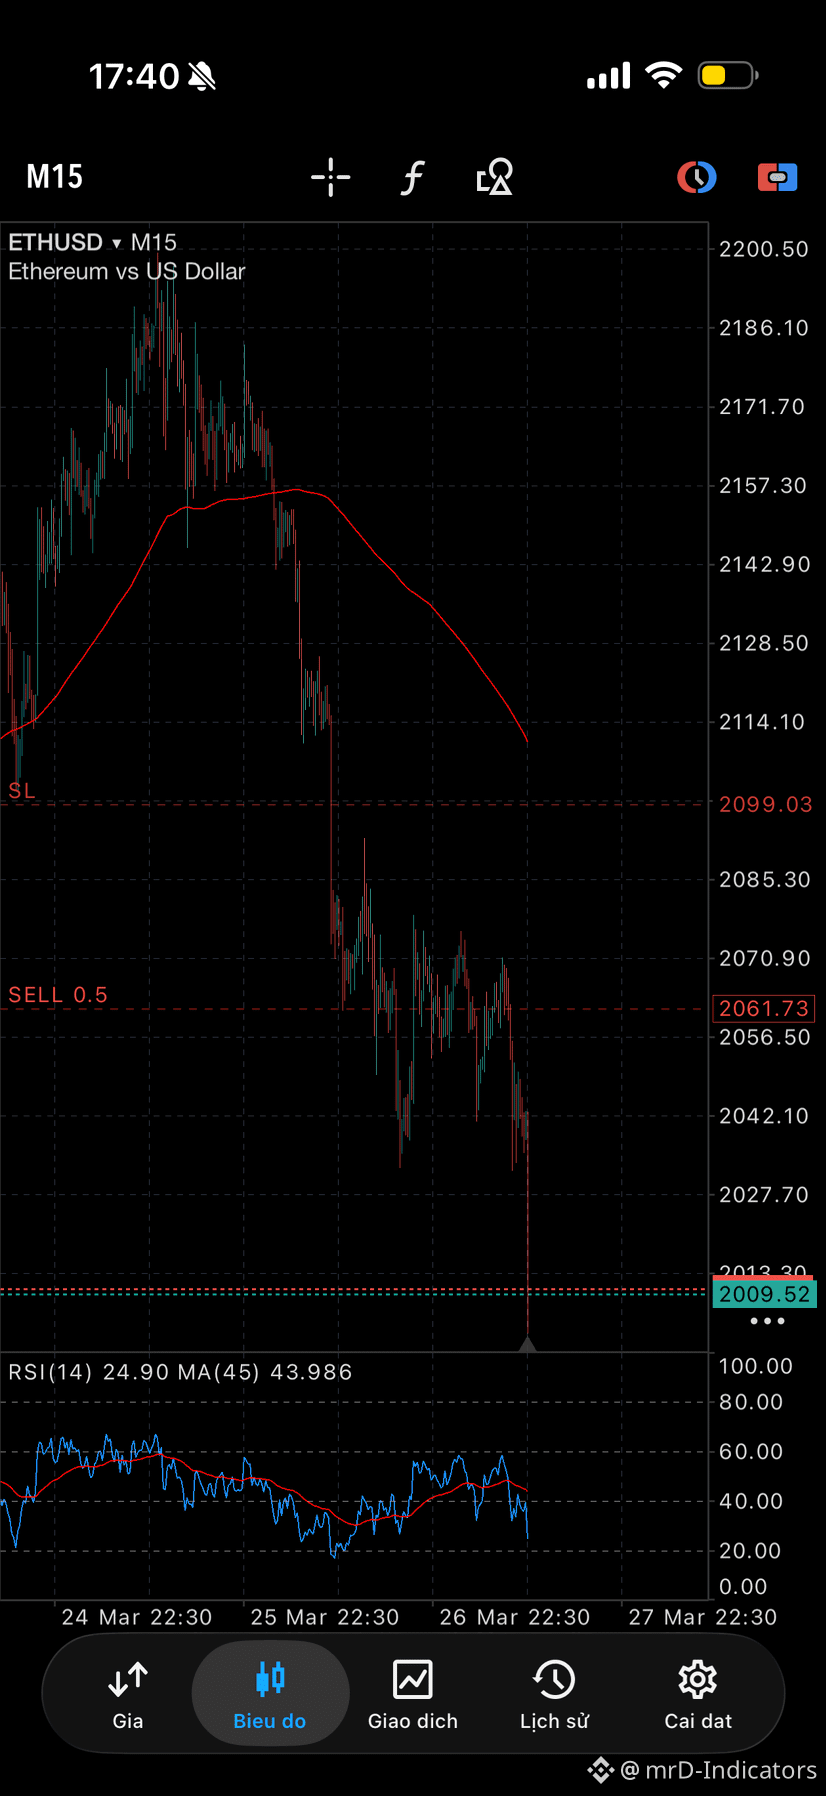
#ETH 売却の押し戻し 15分
#ETH 売却の押し戻し 15分
·
--
ブリッシュ
·
--
ブリッシュ
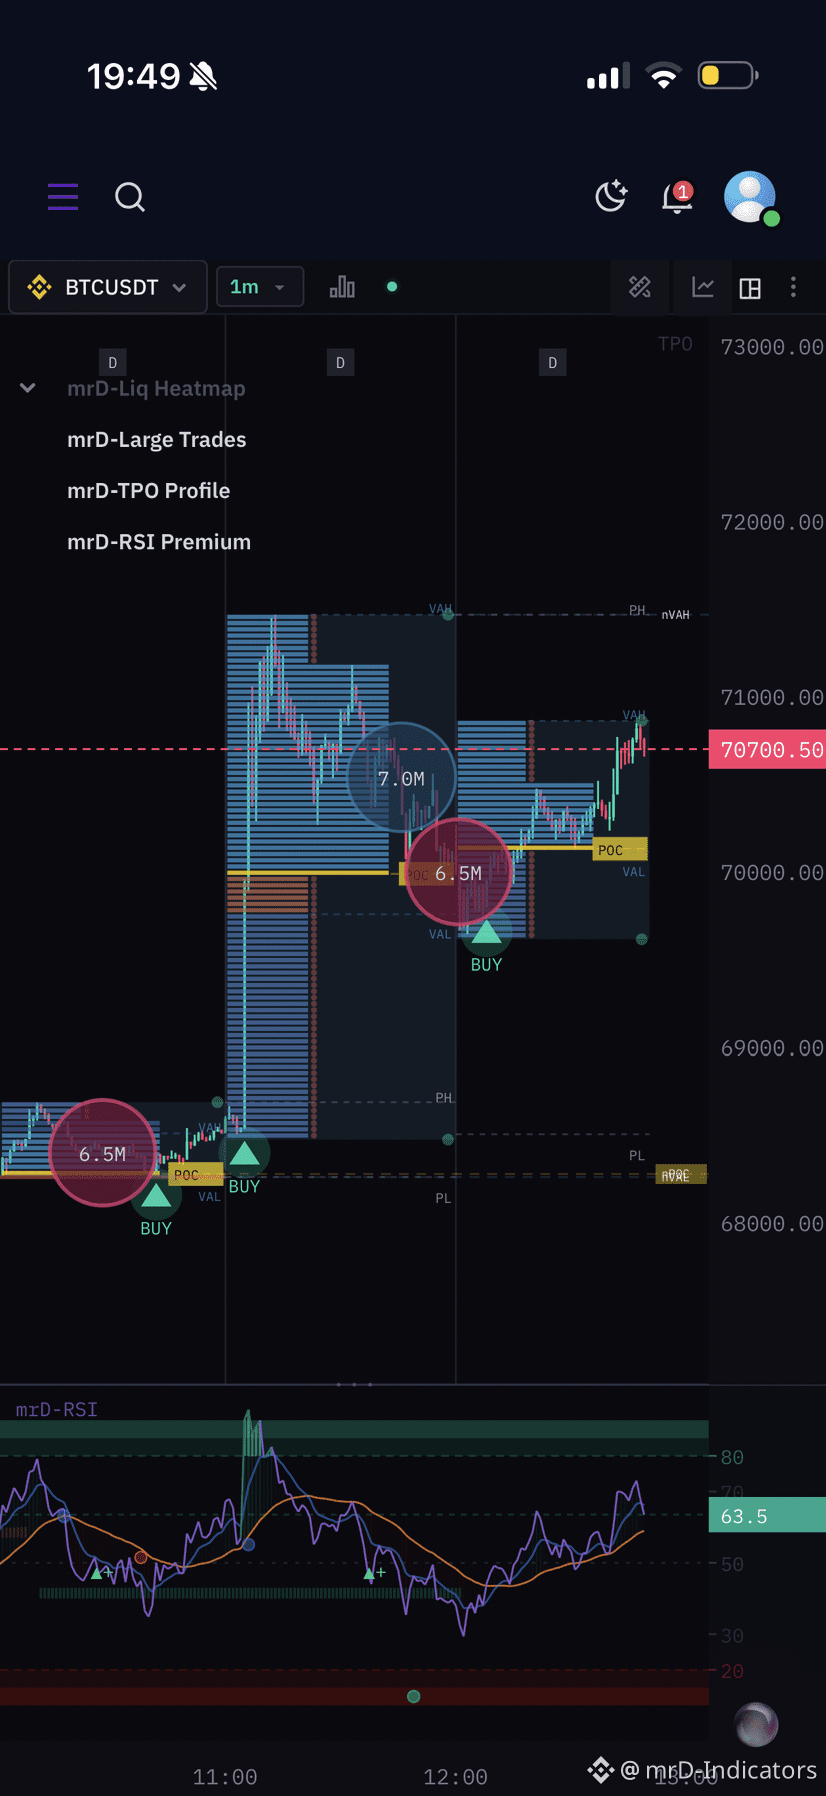
💬 $BTC 注文書 #ヒートマップ分析 (1H) 🔝 市場のバイアス ▫️ バイアス: 強気の継続 ▫️ 価格は$70,000周辺の重要なブレイクアウトレベルを上回っています ▫️ 流動性ターゲットは明確に$の上に見えています ✗ ブレイクアウトの高値で価格を追いかけないでください。 代わりに、最適な戦略は流動性に支えられた需要ゾーンへの押し目を探すことです。 🔝 利益確定ゾーン (流動性ベースのターゲット) •TP1: $71,200 – $71,800 •TP2: $72,000 – $72,600 •TP3: $73,800 – $74,000 💵 トレーディングプラン (ロングセットアップ) エントリー戦略 (押し目買いのみ)。 ✗ 現在の高値でのFOMOロングはありません。 価格が流動性に支えられたゾーンに戻るのを待ちます。
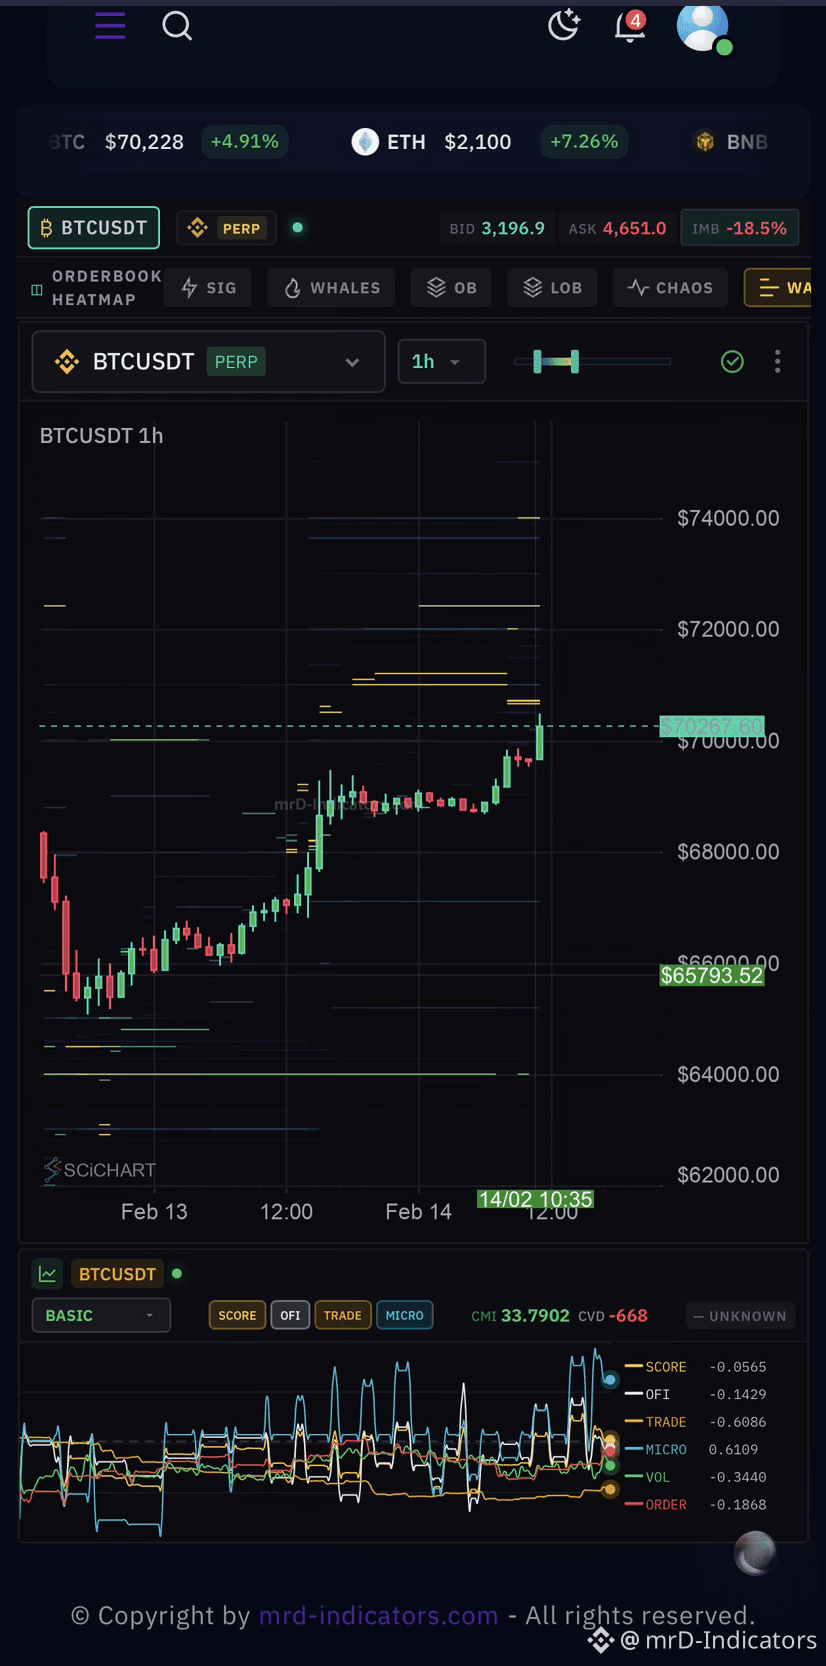
💬 $BTC 注文書 #ヒートマップ分析 (1H)

🔝 市場のバイアス

▫️ バイアス: 強気の継続
▫️ 価格は$70,000周辺の重要なブレイクアウトレベルを上回っています
▫️ 流動性ターゲットは明確に$の上に見えています

✗ ブレイクアウトの高値で価格を追いかけないでください。
代わりに、最適な戦略は流動性に支えられた需要ゾーンへの押し目を探すことです。
🔝 利益確定ゾーン (流動性ベースのターゲット)
•TP1: $71,200 – $71,800
•TP2: $72,000 – $72,600
•TP3: $73,800 – $74,000
💵 トレーディングプラン (ロングセットアップ)

エントリー戦略 (押し目買いのみ)。
✗ 現在の高値でのFOMOロングはありません。
価格が流動性に支えられたゾーンに戻るのを待ちます。
🎯 究極のトレーディングツールキット – 本物のトレーダーのために あなたが取引に真剣で、実際に機能するツールが必要であれば、https://app.mrd-indicators.com/ スイートは、リアルタイムでのセットアップ確認から機会のスキャンまで、必要なすべてを提供します。 ✅ 含まれるもの: ⭐️ シグナルスキャナー & アラート RSIスキャナーアラート RSIプルバックシグナル(先物 & スポット) ポンプ検出アラート ボリュームスキャナー ⭐️ マーケットヒートマップ RSIヒートマップ(先物 & スポット) 清算ヒートマップ オーダーブックヒートマップ ⭐️ 確認 & ストラテジーツール スマートレンジ フリップゾーン オープンインタレストインジケーター トレーディングストラテジーフレームワーク ⭐️ プレミアムアクセス プライベートテレグラムシグナル USDⓈ-M先物シグナル スポットシグナル 🔧 すべてのインジケーターは、実行可能な洞察を得るために構築されており、ノイズをフィルタリングし、エントリーを確認し、市場の動きに先んじる必要があるトレーダーに理想的です。 💥 あなたがプルバック、ブレイクアウト、あるいはトレンド継続を狙っているかどうかに関わらず — このシステムは強力で、迅速で、実証済みです。
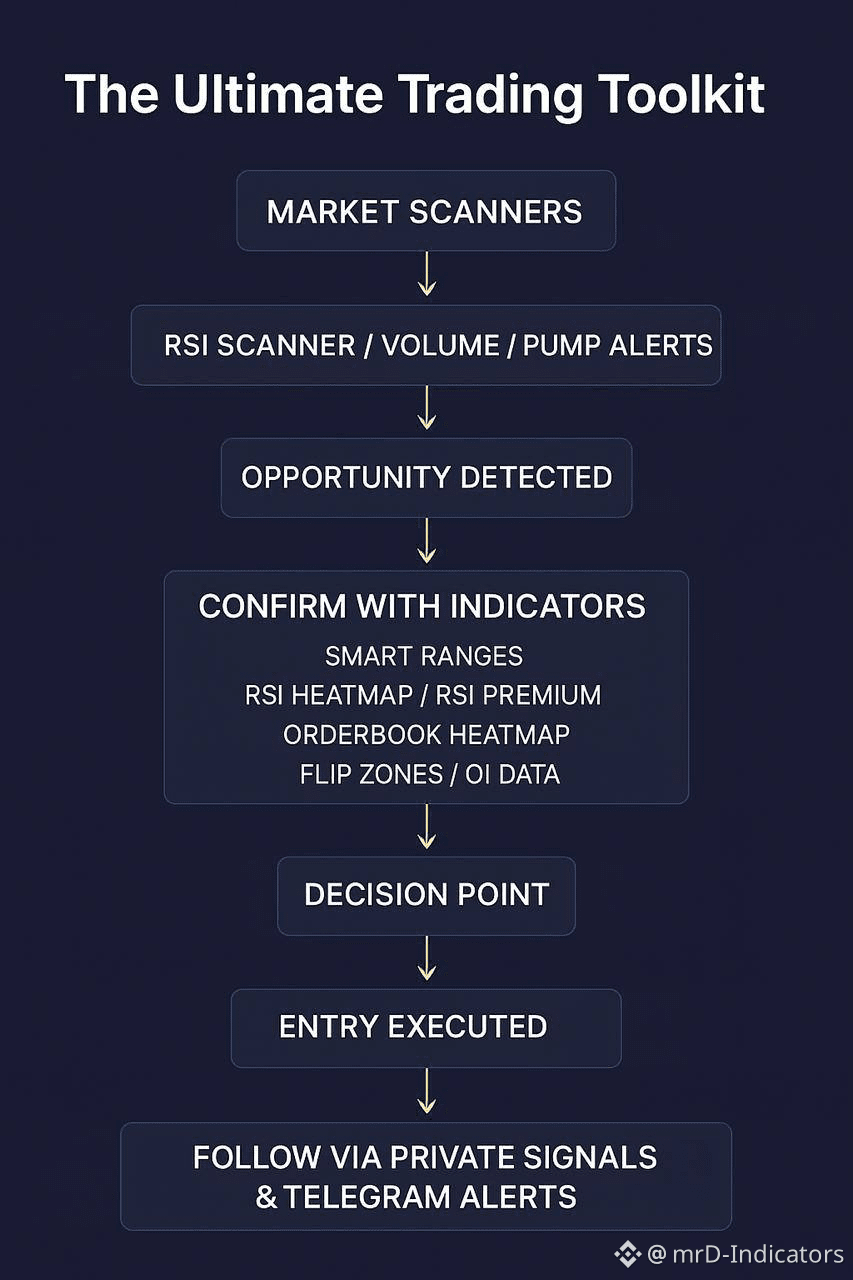
🎯 究極のトレーディングツールキット – 本物のトレーダーのために

あなたが取引に真剣で、実際に機能するツールが必要であれば、https://app.mrd-indicators.com/ スイートは、リアルタイムでのセットアップ確認から機会のスキャンまで、必要なすべてを提供します。

✅ 含まれるもの:

⭐️ シグナルスキャナー & アラート
RSIスキャナーアラート
RSIプルバックシグナル(先物 & スポット)
ポンプ検出アラート
ボリュームスキャナー

⭐️ マーケットヒートマップ
RSIヒートマップ(先物 & スポット)
清算ヒートマップ
オーダーブックヒートマップ

⭐️ 確認 & ストラテジーツール
スマートレンジ
フリップゾーン
オープンインタレストインジケーター
トレーディングストラテジーフレームワーク

⭐️ プレミアムアクセス
プライベートテレグラムシグナル
USDⓈ-M先物シグナル
スポットシグナル

🔧 すべてのインジケーターは、実行可能な洞察を得るために構築されており、ノイズをフィルタリングし、エントリーを確認し、市場の動きに先んじる必要があるトレーダーに理想的です。

💥 あなたがプルバック、ブレイクアウト、あるいはトレンド継続を狙っているかどうかに関わらず — このシステムは強力で、迅速で、実証済みです。
·
--
弱気相場
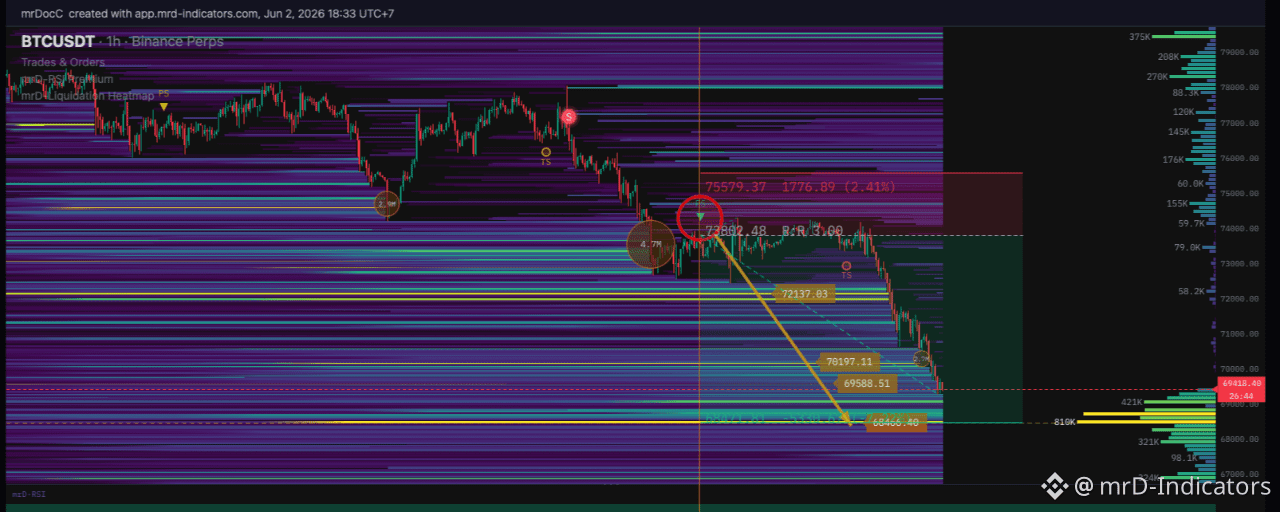
✔️ 市場アップデート: #BTC • 価格はピークから50%以上下落しており、この下落トレンドが減速している明確な兆候はまだありません。 • 日々の抵抗レベルは68Kゾーン周辺で相対的に弱いままです。 • 長期的な買いエントリーには注意が必要です。
✔️ 市場アップデート: #BTC

• 価格はピークから50%以上下落しており、この下落トレンドが減速している明確な兆候はまだありません。
• 日々の抵抗レベルは68Kゾーン周辺で相対的に弱いままです。
• 長期的な買いエントリーには注意が必要です。
·
--
ブリッシュ
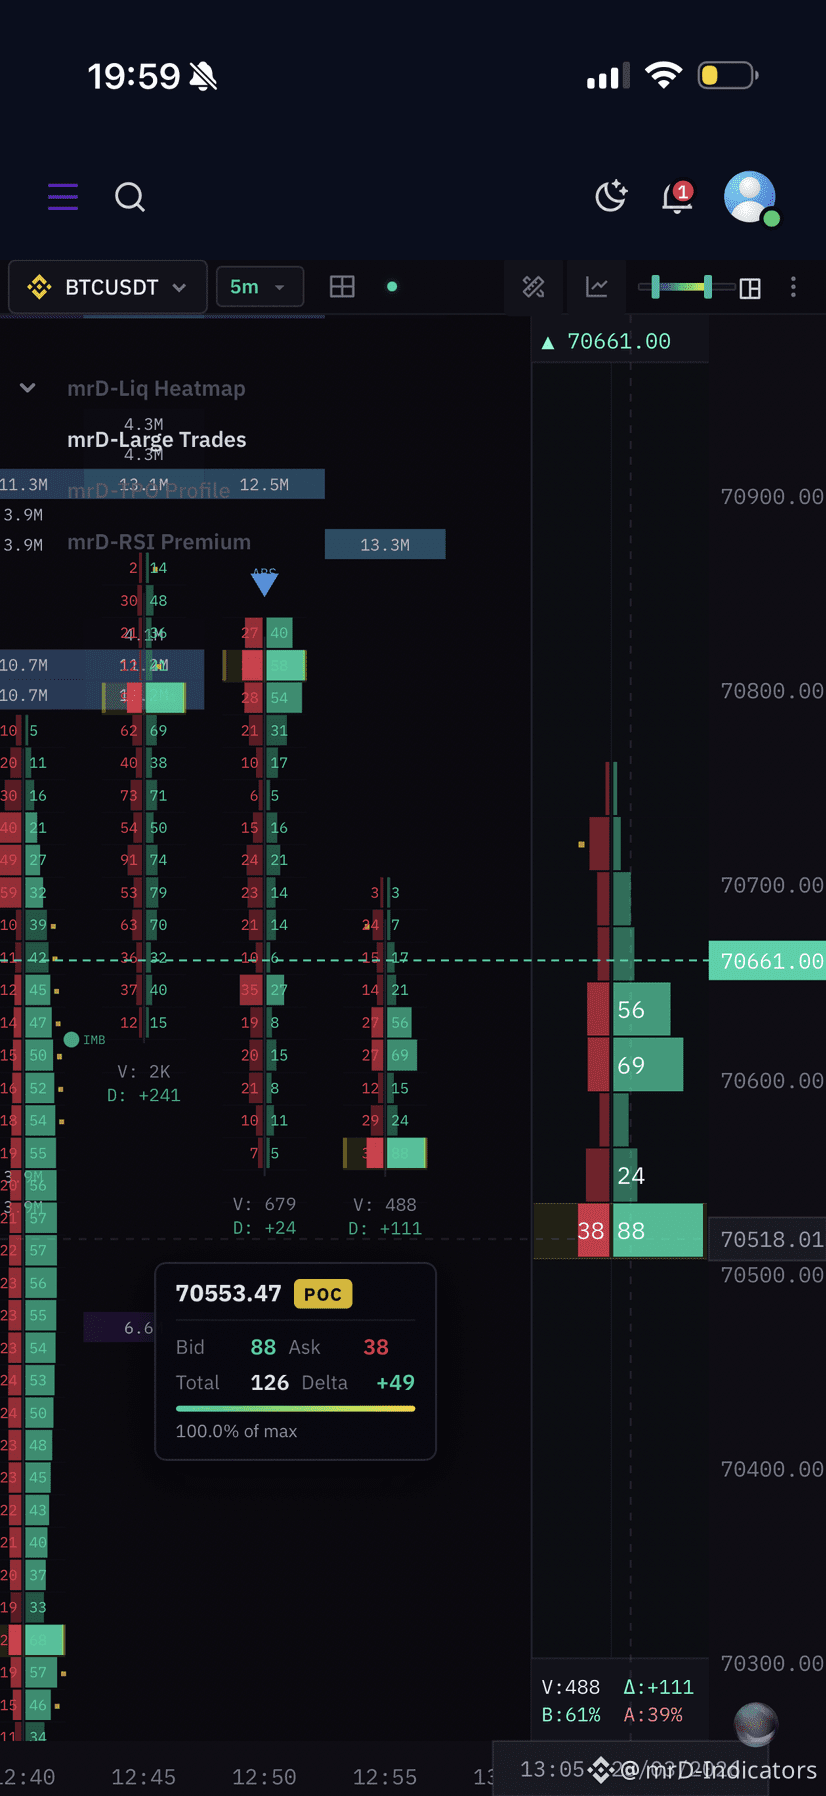
#XAUUST Perp バイナンス ライブオーダーブック ヒートマップ #xau
🚀 mrD-Indicatorsによる外国為替シグナルの紹介 スマート。正確。リアルトレーダーのために構築されました。 チャートを分析するのに何時間も費やしたり、重要な市場の動きを逃したりして疲れていませんか? 外国為替シグナルは、明確さ、自信、そして一貫性を持って取引を行うために設計された最新の製品です。 📺 なぜ外国為替シグナルを選ぶべきか? ✅ 明確なエントリー – TP – SLを持つ高品質のBUY/SELLセットアップ ✅ 複数の時間枠 ✅ 透明なパフォーマンスと勝率の追跡 🔔 シグナルがライブになるとリアルタイムでアラート ✅ 高確率の取引のみに最適化されています 💡 取引アシスタントのように構築されています 私たちは、誇大広告ではなく、正確性、リスク管理、長期的な収益性に焦点を当てています。 📈 いますぐ使用を開始: 👉 https://app.mrd-indicators.com/trading-signals/forex-signals
🚀 mrD-Indicatorsによる外国為替シグナルの紹介
スマート。正確。リアルトレーダーのために構築されました。

チャートを分析するのに何時間も費やしたり、重要な市場の動きを逃したりして疲れていませんか?
外国為替シグナルは、明確さ、自信、そして一貫性を持って取引を行うために設計された最新の製品です。

📺 なぜ外国為替シグナルを選ぶべきか?

✅ 明確なエントリー – TP – SLを持つ高品質のBUY/SELLセットアップ
✅ 複数の時間枠
✅ 透明なパフォーマンスと勝率の追跡
🔔 シグナルがライブになるとリアルタイムでアラート
✅ 高確率の取引のみに最適化されています

💡 取引アシスタントのように構築されています
私たちは、誇大広告ではなく、正確性、リスク管理、長期的な収益性に焦点を当てています。

📈 いますぐ使用を開始:
👉 https://app.mrd-indicators.com/trading-signals/forex-signals
$SOL
$SOL
Lina Indicators
·
--
📉 $SOL 2 売りシグナル – 両方とも利益
* 🔻 売り #1 (mrD-Signals プレミアム): +12.47%
* 🔻 売り #2 (mrD-RSI プルバック): +4.96%
合計利益: +17% on $SOL 🚀
$SOL


#sol #クリプト #先物 #mrDインジケーター #トレーディングシグナル
#BTC
#BTC
Lina Indicators
·
--
📉 3つの強力な売り信号 – すべて利益あり

* 🔻 売り #1 (mrD-Signals プレミアム): +$4,305
* 🔻 売り #2 (mrD-RSI プルバック): +$3,084
* 🔻 売り #3 (mrD-RSI プルバック): +$1,721

利益の可能性: +$9,100 on $BTC 🎯

$BTC


#BTC #暗号 #先物 #mrDインジケーター #取引信号
ログインして、さらにコンテンツを読む
厳選トピックで世界の暗号資産トレーダーの仲間入り
⚡️ 暗号資産に関する最新かつ有益な情報が見つかります。
💬 世界最大の暗号資産取引所から信頼されています。
👍 認証を受けたクリエイターから、有益なインサイトを得られます。
メール / 電話番号
サイトマップ
Cookieの設定
プラットフォーム利用規約