
Gabbbar
17 投稿

Gabbbar
報告
ユーザーをブロック
超高頻度トレーダー
5.7年
38 フォロー
13 フォロワー
2 いいね
投稿
·
--
翻訳参照
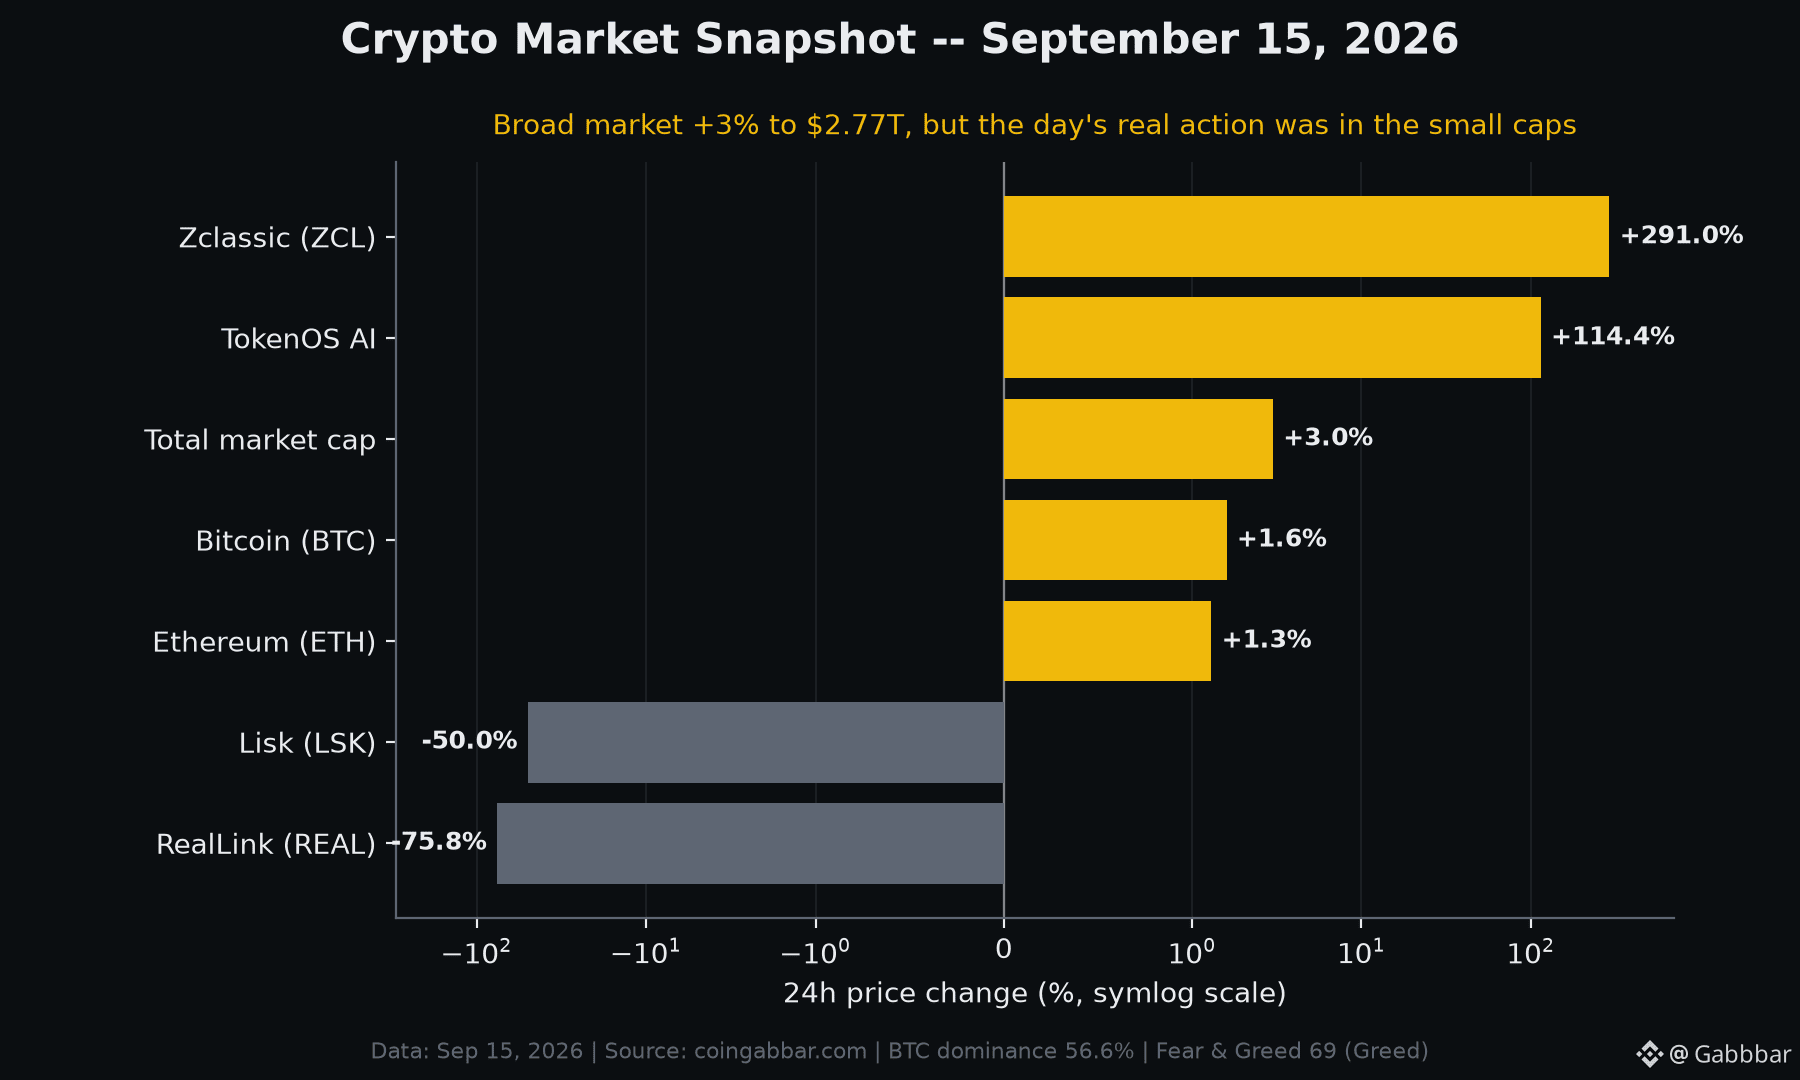
A green day at the index level can hide a 366-percentage-point spread underneath it. On September 15, 2026, the total crypto market cap rose about 3% to $2.77 trillion -- a calm, broadly positive session on the surface. But the day's real story was dispersion between the majors and the small caps.
The majors moved modestly:
- Total market cap: $2.77T (+3.0%)
- Bitcoin: $77,983.80 (+1.6%)
- Ethereum: $2,514.02 (+1.3%)
- 24h total volume: $91.8B
Structure of the market that day:
- BTC dominance: 56.6%
- ETH dominance: 11.1%
- Fear & Greed Index: 69 (Greed)
Now the tails. Among the notable movers on Sep 15, Zclassic (ZCL) reportedly jumped about +291% and TokenOS AI roughly +114%, while RealLink (REAL) fell about -75.8% and Lisk (LSK) around -50%. That is a spread of more than 366 percentage points between the biggest gainer and biggest loser in a single 24-hour window -- on a day the headline number was a quiet +3%.
This is a recurring pattern worth internalizing: a Greed reading and a rising total cap describe the average, not the distribution. Beneath a stable BTC-dominant market, low-liquidity small caps can still swing triple digits in either direction within hours.
When you read a market update, do you check the headline market-cap change, the Fear & Greed number, or the spread between the day's best and worst performers -- and which one actually tells you the most about risk?
#CryptoMarket #Bitcoin #Ethereum
A green day at the index level can hide a 366-percentage-point spread underneath it. On September 15, 2026, the total crypto market cap rose about 3% to $2.77 trillion -- a calm, broadly positive session on the surface. But the day's real story was dispersion between the majors and the small caps.
The majors moved modestly:
- Total market cap: $2.77T (+3.0%)
- Bitcoin: $77,983.80 (+1.6%)
- Ethereum: $2,514.02 (+1.3%)
- 24h total volume: $91.8B
Structure of the market that day:
- BTC dominance: 56.6%
- ETH dominance: 11.1%
- Fear & Greed Index: 69 (Greed)
Now the tails. Among the notable movers on Sep 15, Zclassic (ZCL) reportedly jumped about +291% and TokenOS AI roughly +114%, while RealLink (REAL) fell about -75.8% and Lisk (LSK) around -50%. That is a spread of more than 366 percentage points between the biggest gainer and biggest loser in a single 24-hour window -- on a day the headline number was a quiet +3%.
This is a recurring pattern worth internalizing: a Greed reading and a rising total cap describe the average, not the distribution. Beneath a stable BTC-dominant market, low-liquidity small caps can still swing triple digits in either direction within hours.
When you read a market update, do you check the headline market-cap change, the Fear & Greed number, or the spread between the day's best and worst performers -- and which one actually tells you the most about risk?
#CryptoMarket #Bitcoin #Ethereum
The majors moved modestly:
- Total market cap: $2.77T (+3.0%)
- Bitcoin: $77,983.80 (+1.6%)
- Ethereum: $2,514.02 (+1.3%)
- 24h total volume: $91.8B
Structure of the market that day:
- BTC dominance: 56.6%
- ETH dominance: 11.1%
- Fear & Greed Index: 69 (Greed)
Now the tails. Among the notable movers on Sep 15, Zclassic (ZCL) reportedly jumped about +291% and TokenOS AI roughly +114%, while RealLink (REAL) fell about -75.8% and Lisk (LSK) around -50%. That is a spread of more than 366 percentage points between the biggest gainer and biggest loser in a single 24-hour window -- on a day the headline number was a quiet +3%.
This is a recurring pattern worth internalizing: a Greed reading and a rising total cap describe the average, not the distribution. Beneath a stable BTC-dominant market, low-liquidity small caps can still swing triple digits in either direction within hours.
When you read a market update, do you check the headline market-cap change, the Fear & Greed number, or the spread between the day's best and worst performers -- and which one actually tells you the most about risk?
#CryptoMarket #Bitcoin #Ethereum
1
266
·
--
翻訳参照
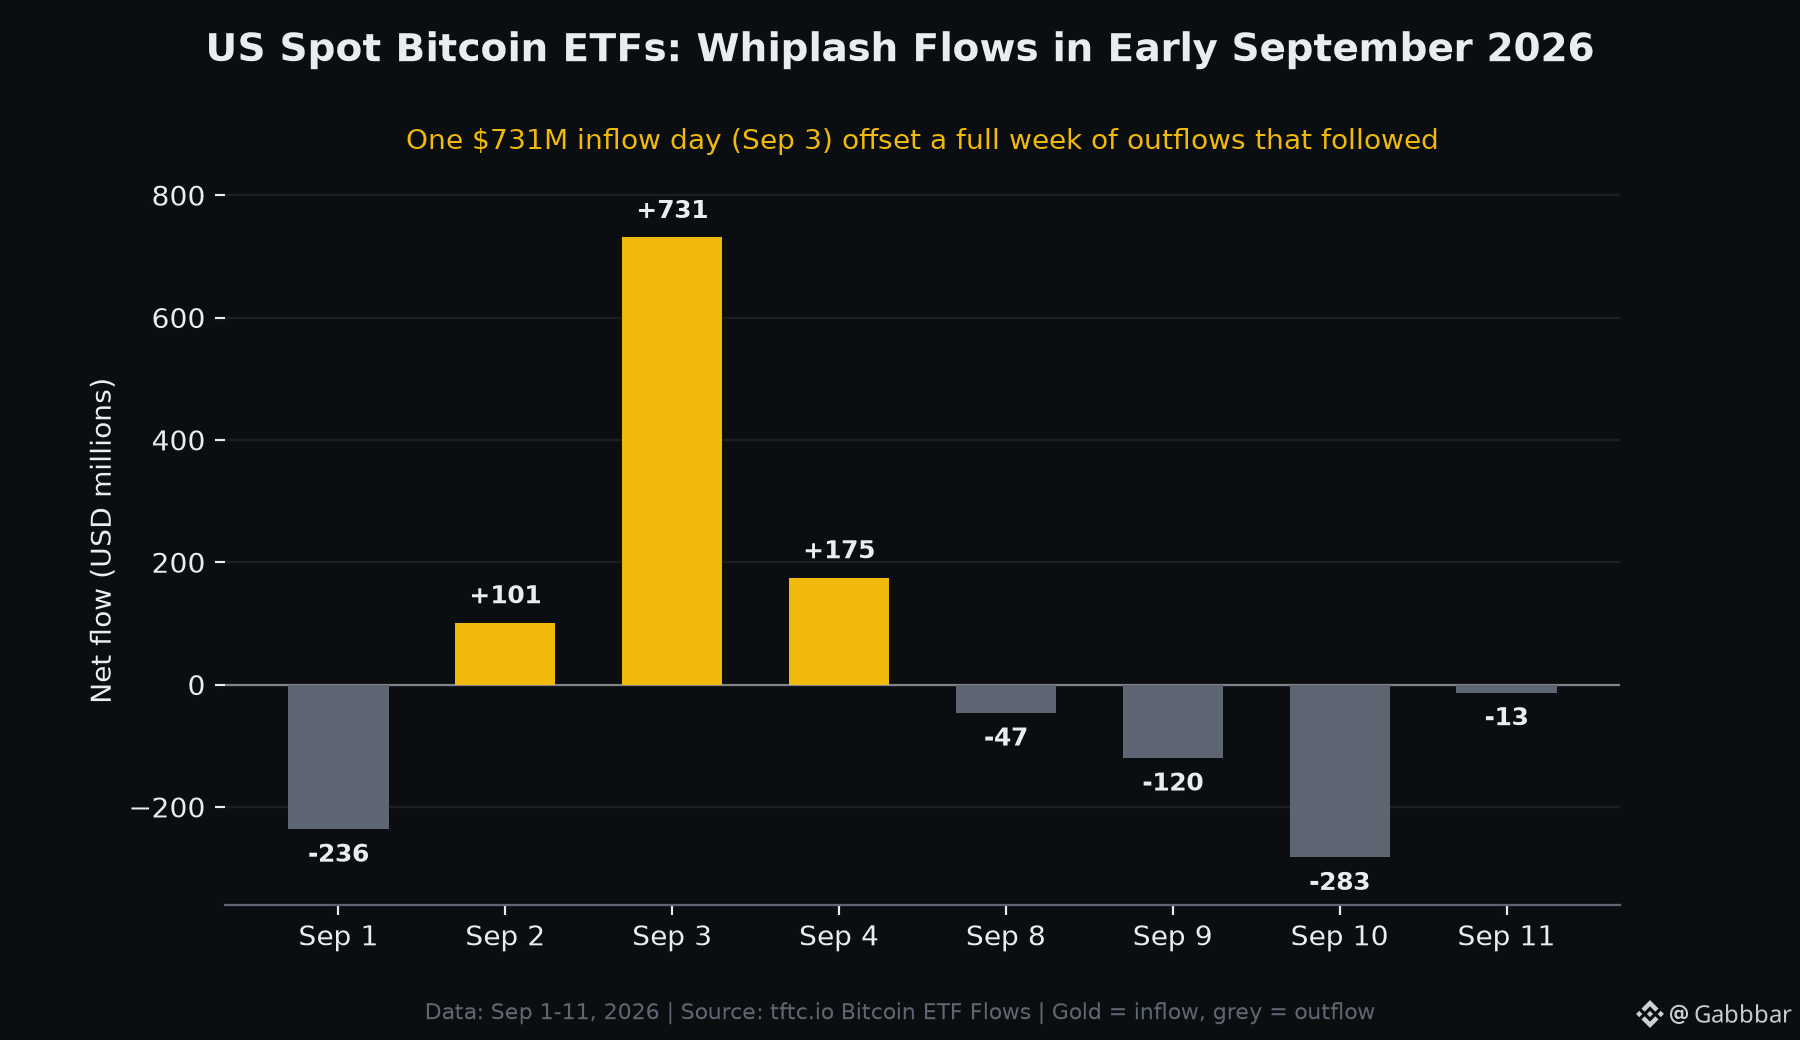
One record day did most of the work. On September 3, 2026, US spot Bitcoin ETFs pulled in $730.9 million in a single session -- their largest daily net inflow since January 2026. But zoom out to the eleven days around it and the picture is far messier than one green bar suggests.
Here is the full early-September sequence (net flows, USD):
- Sep 1: -$236.5M (outflow)
- Sep 2: +$101.1M
- Sep 3: +$730.9M
- Sep 4: +$174.6M
- Sep 8: -$46.6M
- Sep 9: -$120.2M
- Sep 10: -$282.6M
- Sep 11: -$13.3M
Add it up and the eight trading days net to roughly +$307M. In other words, the entire stretch was positive only because of that one Sep 3 spike -- every session that followed it saw money leave.
A concentration detail worth noting: on Sep 3, BlackRock's IBIT alone captured about $454M, more than 60% of all money entering the sector that day, with ARKB (~$138M) and FBTC (~$74M) taking most of the rest. Single-day totals are increasingly driven by one or two funds.
For context, combined US Bitcoin ETF net assets sat near $103.34 billion as of early September 2026 -- roughly 6.3% of Bitcoin's total market cap.
The takeaway isn't direction, it's dispersion: daily ETF flow headlines can swing from record inflow to week-long outflow within days. When you see a single-day flow number, what's the right window to judge institutional demand -- a day, a week, or a month?
#Bitcoin #BitcoinETF #CryptoNews
One record day did most of the work. On September 3, 2026, US spot Bitcoin ETFs pulled in $730.9 million in a single session -- their largest daily net inflow since January 2026. But zoom out to the eleven days around it and the picture is far messier than one green bar suggests.
Here is the full early-September sequence (net flows, USD):
- Sep 1: -$236.5M (outflow)
- Sep 2: +$101.1M
- Sep 3: +$730.9M
- Sep 4: +$174.6M
- Sep 8: -$46.6M
- Sep 9: -$120.2M
- Sep 10: -$282.6M
- Sep 11: -$13.3M
Add it up and the eight trading days net to roughly +$307M. In other words, the entire stretch was positive only because of that one Sep 3 spike -- every session that followed it saw money leave.
A concentration detail worth noting: on Sep 3, BlackRock's IBIT alone captured about $454M, more than 60% of all money entering the sector that day, with ARKB (~$138M) and FBTC (~$74M) taking most of the rest. Single-day totals are increasingly driven by one or two funds.
For context, combined US Bitcoin ETF net assets sat near $103.34 billion as of early September 2026 -- roughly 6.3% of Bitcoin's total market cap.
The takeaway isn't direction, it's dispersion: daily ETF flow headlines can swing from record inflow to week-long outflow within days. When you see a single-day flow number, what's the right window to judge institutional demand -- a day, a week, or a month?
#Bitcoin #BitcoinETF #CryptoNews
Here is the full early-September sequence (net flows, USD):
- Sep 1: -$236.5M (outflow)
- Sep 2: +$101.1M
- Sep 3: +$730.9M
- Sep 4: +$174.6M
- Sep 8: -$46.6M
- Sep 9: -$120.2M
- Sep 10: -$282.6M
- Sep 11: -$13.3M
Add it up and the eight trading days net to roughly +$307M. In other words, the entire stretch was positive only because of that one Sep 3 spike -- every session that followed it saw money leave.
A concentration detail worth noting: on Sep 3, BlackRock's IBIT alone captured about $454M, more than 60% of all money entering the sector that day, with ARKB (~$138M) and FBTC (~$74M) taking most of the rest. Single-day totals are increasingly driven by one or two funds.
For context, combined US Bitcoin ETF net assets sat near $103.34 billion as of early September 2026 -- roughly 6.3% of Bitcoin's total market cap.
The takeaway isn't direction, it's dispersion: daily ETF flow headlines can swing from record inflow to week-long outflow within days. When you see a single-day flow number, what's the right window to judge institutional demand -- a day, a week, or a month?
#Bitcoin #BitcoinETF #CryptoNews
62
·
--
ビットコインのドミナンスは、暗号資産界で最も引用される数値の1つである一方、最も一貫性に欠ける数値でもあります。
今すぐ3つのトラッカーを確認すると、57%、59%、60%が見えてくるかもしれません。どれも間違いではありません。微妙に違う質問に答えているだけです。
式はシンプルです。BTCの時価総額 ÷ 暗号資産全体の時価総額 × 100。
議論になっているのは、分母に何を入れるかという点です。
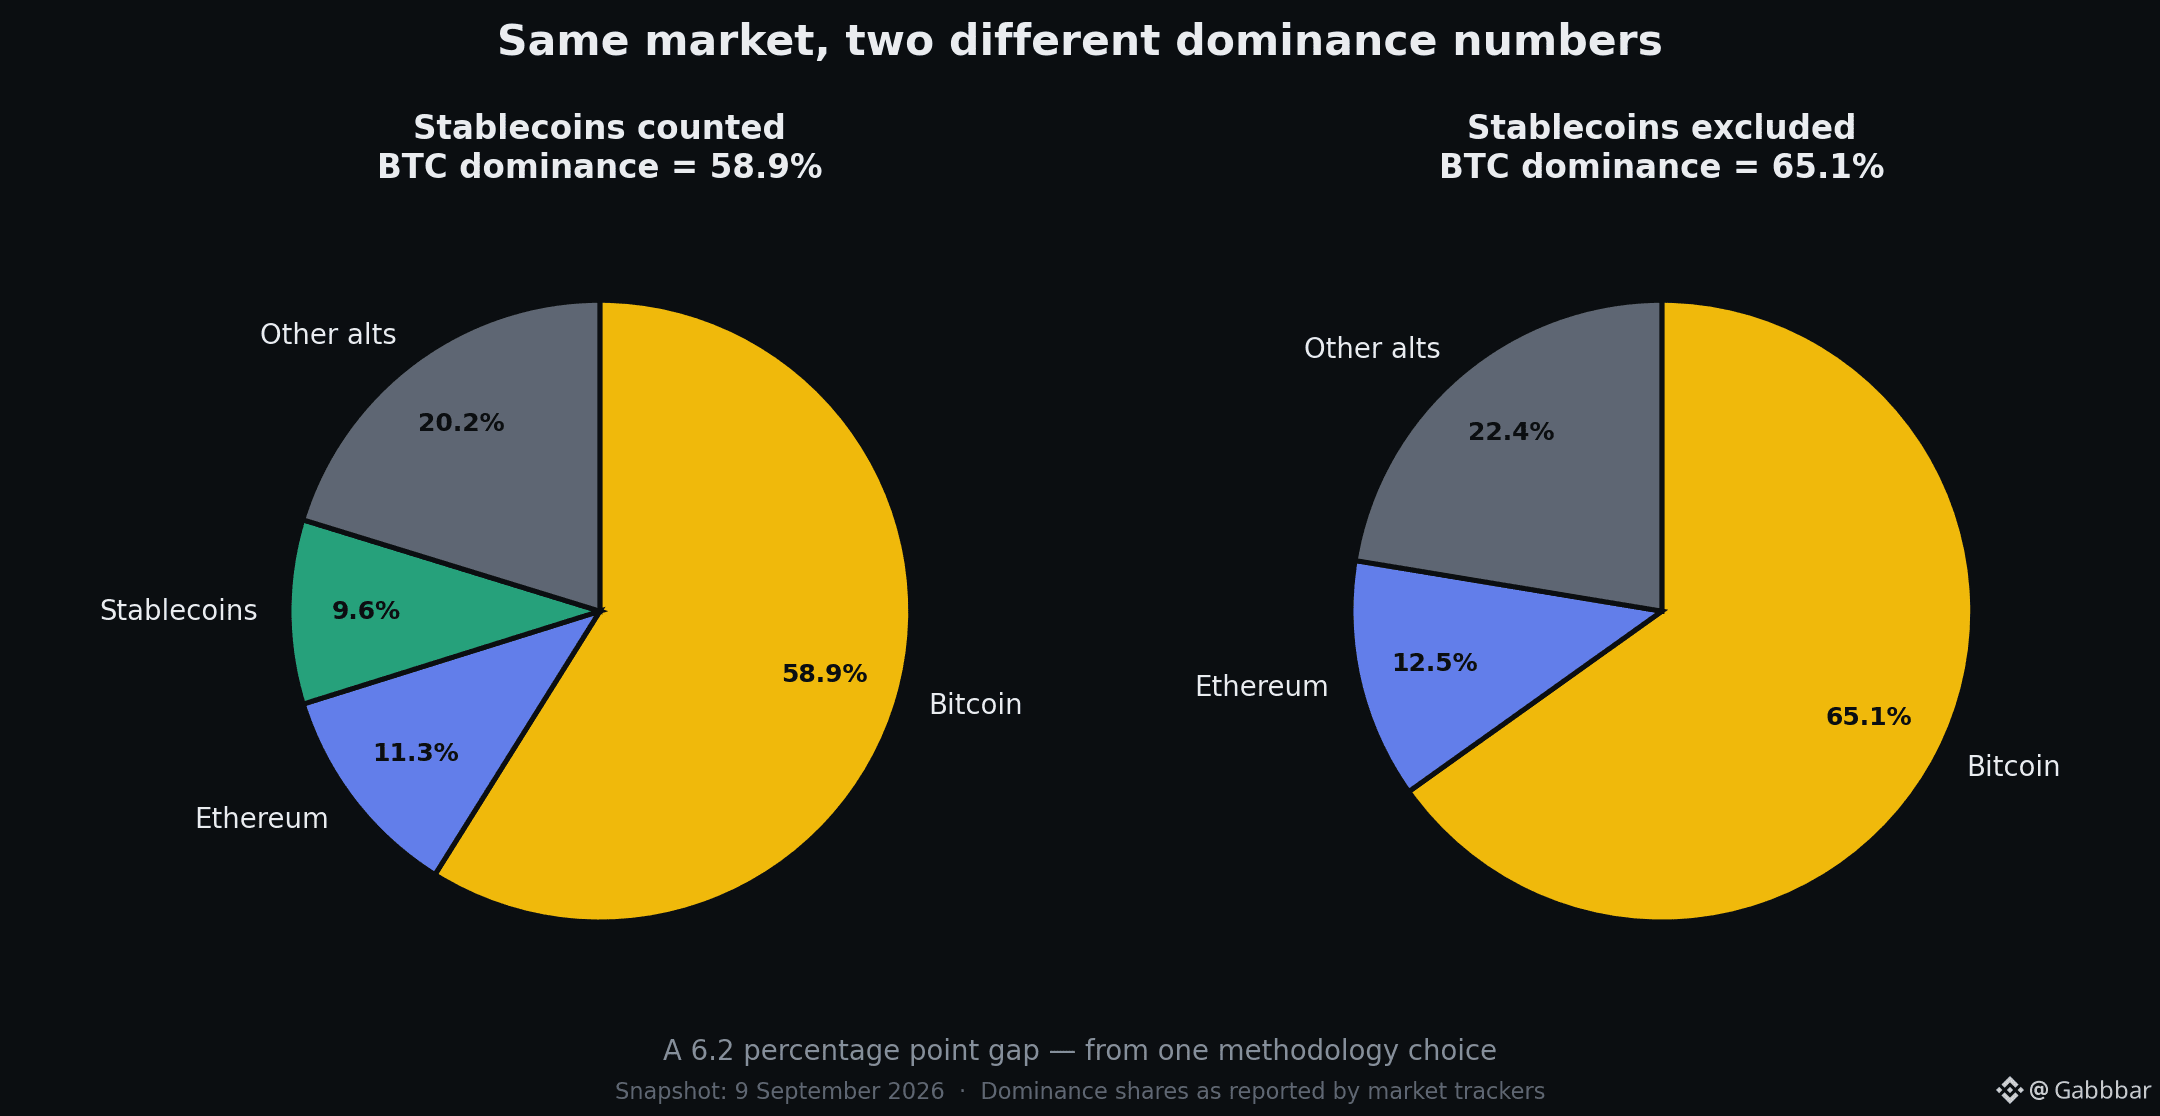
ステーブルコインは現在、暗号資産全体の10%弱に位置しています。これを含めると、BTCドミナンスは約58.9%になります。除外すると、同じ市場で約65.1%です。
同じ日。同じ市場。差は6.2ポイント。
除外すべきだという主張:ステーブルコインは、資本を巡ってビットコインと競合しているわけではありません。駐車された現金であり、投入されるのを待つ“待機資金”です。
含めるべきだという主張:その“駐車された現金”も、暗号資産の中に存在する資本であり、どこに置かれているかがポジショニングを示してくれます。
実務上、知っておく価値がある結果があります。アルトコインがより速く下落している場合、ビットコインが下落していてもBTCドミナンスは上がり得ます。ドミナンスは価格ではなく“シェア”を測っているからです。
次に、ドミナンスのチャートを引用されるときに役立つ問いは、「これは強気なのか?」ではなく、「分母には何が入っているのか?」です。
#Bitcoin #BTC #CryptoEducation
ビットコインのドミナンスは、暗号資産界で最も引用される数値の1つである一方、最も一貫性に欠ける数値でもあります。
今すぐ3つのトラッカーを確認すると、57%、59%、60%が見えてくるかもしれません。どれも間違いではありません。微妙に違う質問に答えているだけです。
式はシンプルです。BTCの時価総額 ÷ 暗号資産全体の時価総額 × 100。
議論になっているのは、分母に何を入れるかという点です。
ステーブルコインは現在、暗号資産全体の10%弱に位置しています。これを含めると、BTCドミナンスは約58.9%になります。除外すると、同じ市場で約65.1%です。
同じ日。同じ市場。差は6.2ポイント。
除外すべきだという主張:ステーブルコインは、資本を巡ってビットコインと競合しているわけではありません。駐車された現金であり、投入されるのを待つ“待機資金”です。
含めるべきだという主張:その“駐車された現金”も、暗号資産の中に存在する資本であり、どこに置かれているかがポジショニングを示してくれます。
実務上、知っておく価値がある結果があります。アルトコインがより速く下落している場合、ビットコインが下落していてもBTCドミナンスは上がり得ます。ドミナンスは価格ではなく“シェア”を測っているからです。
次に、ドミナンスのチャートを引用されるときに役立つ問いは、「これは強気なのか?」ではなく、「分母には何が入っているのか?」です。
#Bitcoin #BTC #CryptoEducation
今すぐ3つのトラッカーを確認すると、57%、59%、60%が見えてくるかもしれません。どれも間違いではありません。微妙に違う質問に答えているだけです。
式はシンプルです。BTCの時価総額 ÷ 暗号資産全体の時価総額 × 100。
議論になっているのは、分母に何を入れるかという点です。
ステーブルコインは現在、暗号資産全体の10%弱に位置しています。これを含めると、BTCドミナンスは約58.9%になります。除外すると、同じ市場で約65.1%です。
同じ日。同じ市場。差は6.2ポイント。
除外すべきだという主張:ステーブルコインは、資本を巡ってビットコインと競合しているわけではありません。駐車された現金であり、投入されるのを待つ“待機資金”です。
含めるべきだという主張:その“駐車された現金”も、暗号資産の中に存在する資本であり、どこに置かれているかがポジショニングを示してくれます。
実務上、知っておく価値がある結果があります。アルトコインがより速く下落している場合、ビットコインが下落していてもBTCドミナンスは上がり得ます。ドミナンスは価格ではなく“シェア”を測っているからです。
次に、ドミナンスのチャートを引用されるときに役立つ問いは、「これは強気なのか?」ではなく、「分母には何が入っているのか?」です。
#Bitcoin #BTC #CryptoEducation
140
ログインして、さらにコンテンツを読む
厳選トピックで世界の暗号資産トレーダーの仲間入り
⚡️ 暗号資産に関する最新かつ有益な情報が見つかります。
💬 世界最大の暗号資産取引所から信頼されています。
👍 認証を受けたクリエイターから、有益なインサイトを得られます。
メール / 電話番号
トレンドトピック
BitcoinReboundsTo$79K
閲覧回数 22,458
206人が討論中
🚨 $BTC はさらに上昇しようとしています。
ビットコインは約 $78,804 で取引されており、先ほど $78K の水準を回復したことでおよそ 1.9% 上昇しています。次に注目すべきは、日中の高値である約 $78,905 です。
その水準を明確に上抜けると、$79K〜$80K へ向かう道が開ける可能性があります。もしBTCが跳ね返される場合、サポートは $78,300 あたりにあり、その次は $77,975 です。
強気筋には勢いがありますが、BTC は $78K を上回って維持する必要があります。
#Bitcoin #BTC #CryptoTrading #CryptoMarket #CryptoAnalysis
PulseON
·いいね:18件
·閲覧回数 18.2k
BitcoinSpotETFsNetInflow$160M
閲覧回数 618
45人が討論中
SouthKoreaCryptoTaxDelayPetitionTops50000
閲覧回数 15,224
420人が討論中