

AikidoXPN
176 投稿
AikidoXPN
報告
ユーザーをブロック
Crypto-enthusiastic | Blockchain-powered | Finance-futurist | Community-builder

Content Master Angel
取引を発注
低高頻度トレーダー
6.6年
196 フォロー
201 フォロワー
174 いいね
1 バッジ
投稿
ポートフォリオ
すべて
引用
動画
ライブ
·
--
🪄 いっしょに夢を見よう
よし、ビルダーたち、サトシたち、そしてプロトコル好きの皆さん。今回の件、あなたの頭脳を貸してください。
状況説明です:明日目覚めると、ひとつの願いが叶えられている。**バイナンス・エコシステム全体に、まったく新しい機能・プロダクト・プリミティブがネイティブで存在するようになった。** つまり、今この瞬間は稼働していない何かが、存在するようになったのです。この業界が静かに欠けていた“何か”。ポフッ。願いは叶った。もう現実です。
あなたは何を思い描いた?
「ガス代がもっと速くなる」みたいな話じゃありません。スクロールの途中で人がふと止まって、*「待って…それ、なんでまだ存在しないの?」* ってなるような発想です。深夜2時のグループチャットで議論されるやつ。誰も考えるのをやめられないタイプのやつ。
じゃあ本当にそこまで行こう!下に、あなたのいちばん大胆で鋭く、技術的に根拠のあるアイデアを投げてください:
- 🔮 **それは何?**(すでに出荷されているかのように名前を付けて)
- ⚡ **なぜこのエコシステムに必要?**(どんなギャップを埋めるのか)
- 🙌 **誰が得をする?**(トレーダー、開発者、バリデーター、そして普段使いのユーザー。具体的に)
🪄 いっしょに夢を見よう
よし、ビルダーたち、サトシたち、そしてプロトコル好きの皆さん。今回の件、あなたの頭脳を貸してください。
状況説明です:明日目覚めると、ひとつの願いが叶えられている。**バイナンス・エコシステム全体に、まったく新しい機能・プロダクト・プリミティブがネイティブで存在するようになった。** つまり、今この瞬間は稼働していない何かが、存在するようになったのです。この業界が静かに欠けていた“何か”。ポフッ。願いは叶った。もう現実です。
あなたは何を思い描いた?
「ガス代がもっと速くなる」みたいな話じゃありません。スクロールの途中で人がふと止まって、*「待って…それ、なんでまだ存在しないの?」* ってなるような発想です。深夜2時のグループチャットで議論されるやつ。誰も考えるのをやめられないタイプのやつ。
じゃあ本当にそこまで行こう!下に、あなたのいちばん大胆で鋭く、技術的に根拠のあるアイデアを投げてください:
- 🔮 **それは何?**(すでに出荷されているかのように名前を付けて)
- ⚡ **なぜこのエコシステムに必要?**(どんなギャップを埋めるのか)
- 🙌 **誰が得をする?**(トレーダー、開発者、バリデーター、そして普段使いのユーザー。具体的に)
よし、ビルダーたち、サトシたち、そしてプロトコル好きの皆さん。今回の件、あなたの頭脳を貸してください。
状況説明です:明日目覚めると、ひとつの願いが叶えられている。**バイナンス・エコシステム全体に、まったく新しい機能・プロダクト・プリミティブがネイティブで存在するようになった。** つまり、今この瞬間は稼働していない何かが、存在するようになったのです。この業界が静かに欠けていた“何か”。ポフッ。願いは叶った。もう現実です。
あなたは何を思い描いた?
「ガス代がもっと速くなる」みたいな話じゃありません。スクロールの途中で人がふと止まって、*「待って…それ、なんでまだ存在しないの?」* ってなるような発想です。深夜2時のグループチャットで議論されるやつ。誰も考えるのをやめられないタイプのやつ。
じゃあ本当にそこまで行こう!下に、あなたのいちばん大胆で鋭く、技術的に根拠のあるアイデアを投げてください:
- 🔮 **それは何?**(すでに出荷されているかのように名前を付けて)
- ⚡ **なぜこのエコシステムに必要?**(どんなギャップを埋めるのか)
- 🙌 **誰が得をする?**(トレーダー、開発者、バリデーター、そして普段使いのユーザー。具体的に)
3
64
·
--
#binancesummercamp2026
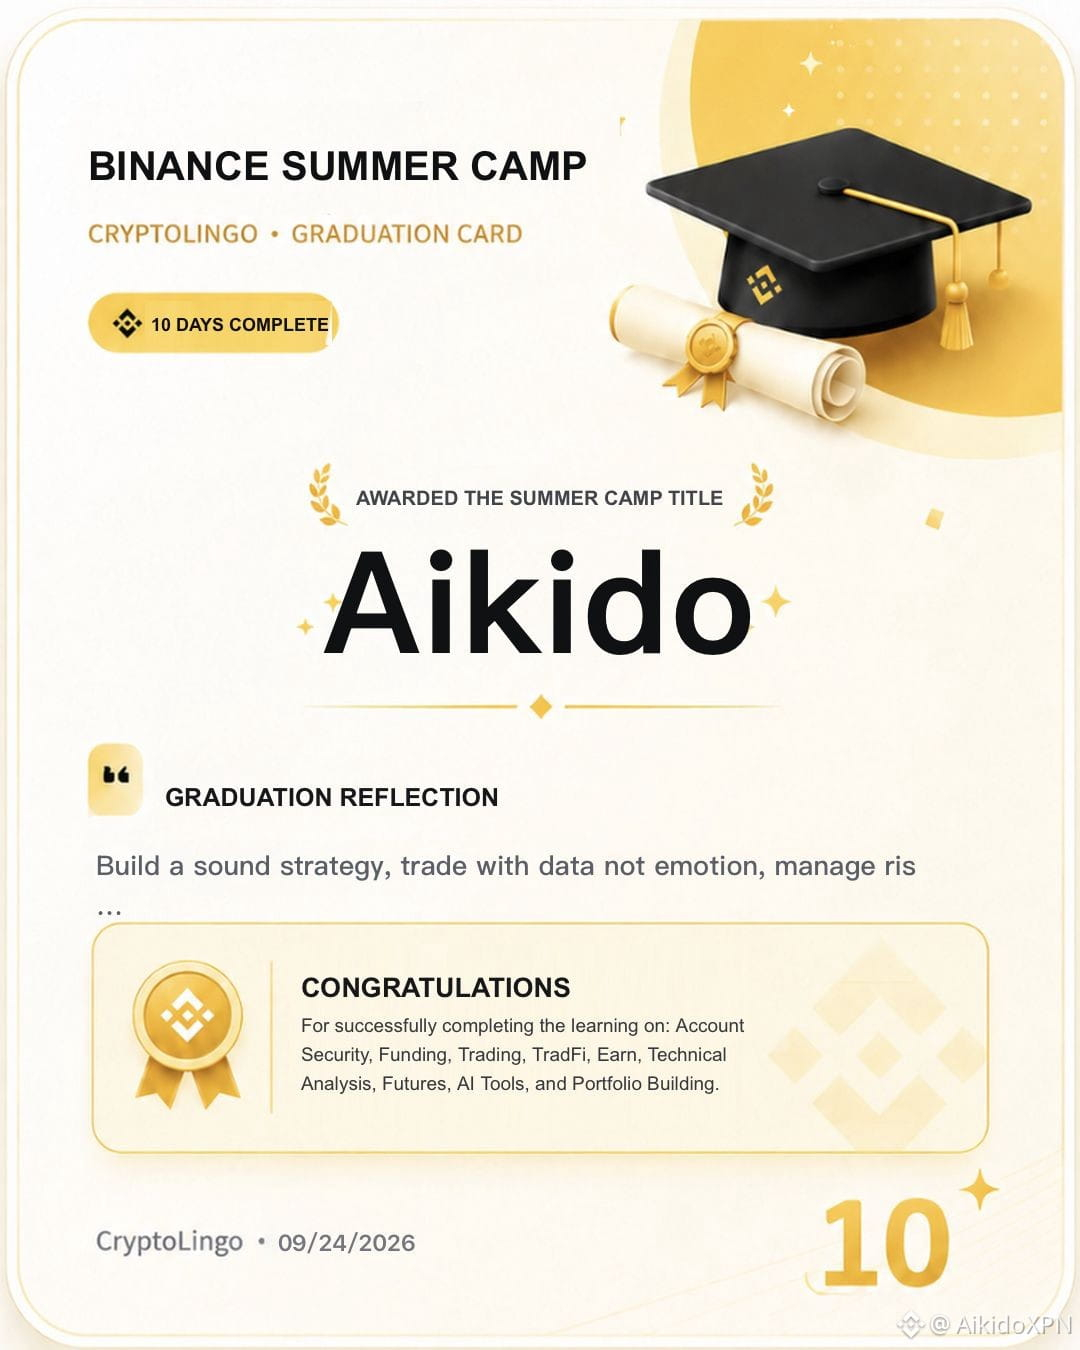
10日間の [Binance SummerCamp 2026](https://www.binance.com/en/ti/cryptolingo) をすべて修了し、素晴らしい結果とともに卒業できたことをとても嬉しく思います!
🎓 健全な戦略を築き、感情ではなくデータで取引し、リスクを管理し、ポートフォリオを最適化してください。stay #SAFU
#binancesummercamp2026
10日間の Binance SummerCamp 2026 をすべて修了し、素晴らしい結果とともに卒業できたことをとても嬉しく思います!
🎓 健全な戦略を築き、感情ではなくデータで取引し、リスクを管理し、ポートフォリオを最適化してください。stay #SAFU
10日間の Binance SummerCamp 2026 をすべて修了し、素晴らしい結果とともに卒業できたことをとても嬉しく思います!
🎓 健全な戦略を築き、感情ではなくデータで取引し、リスクを管理し、ポートフォリオを最適化してください。stay #SAFU
4
5
·
--
#binancesummercamp
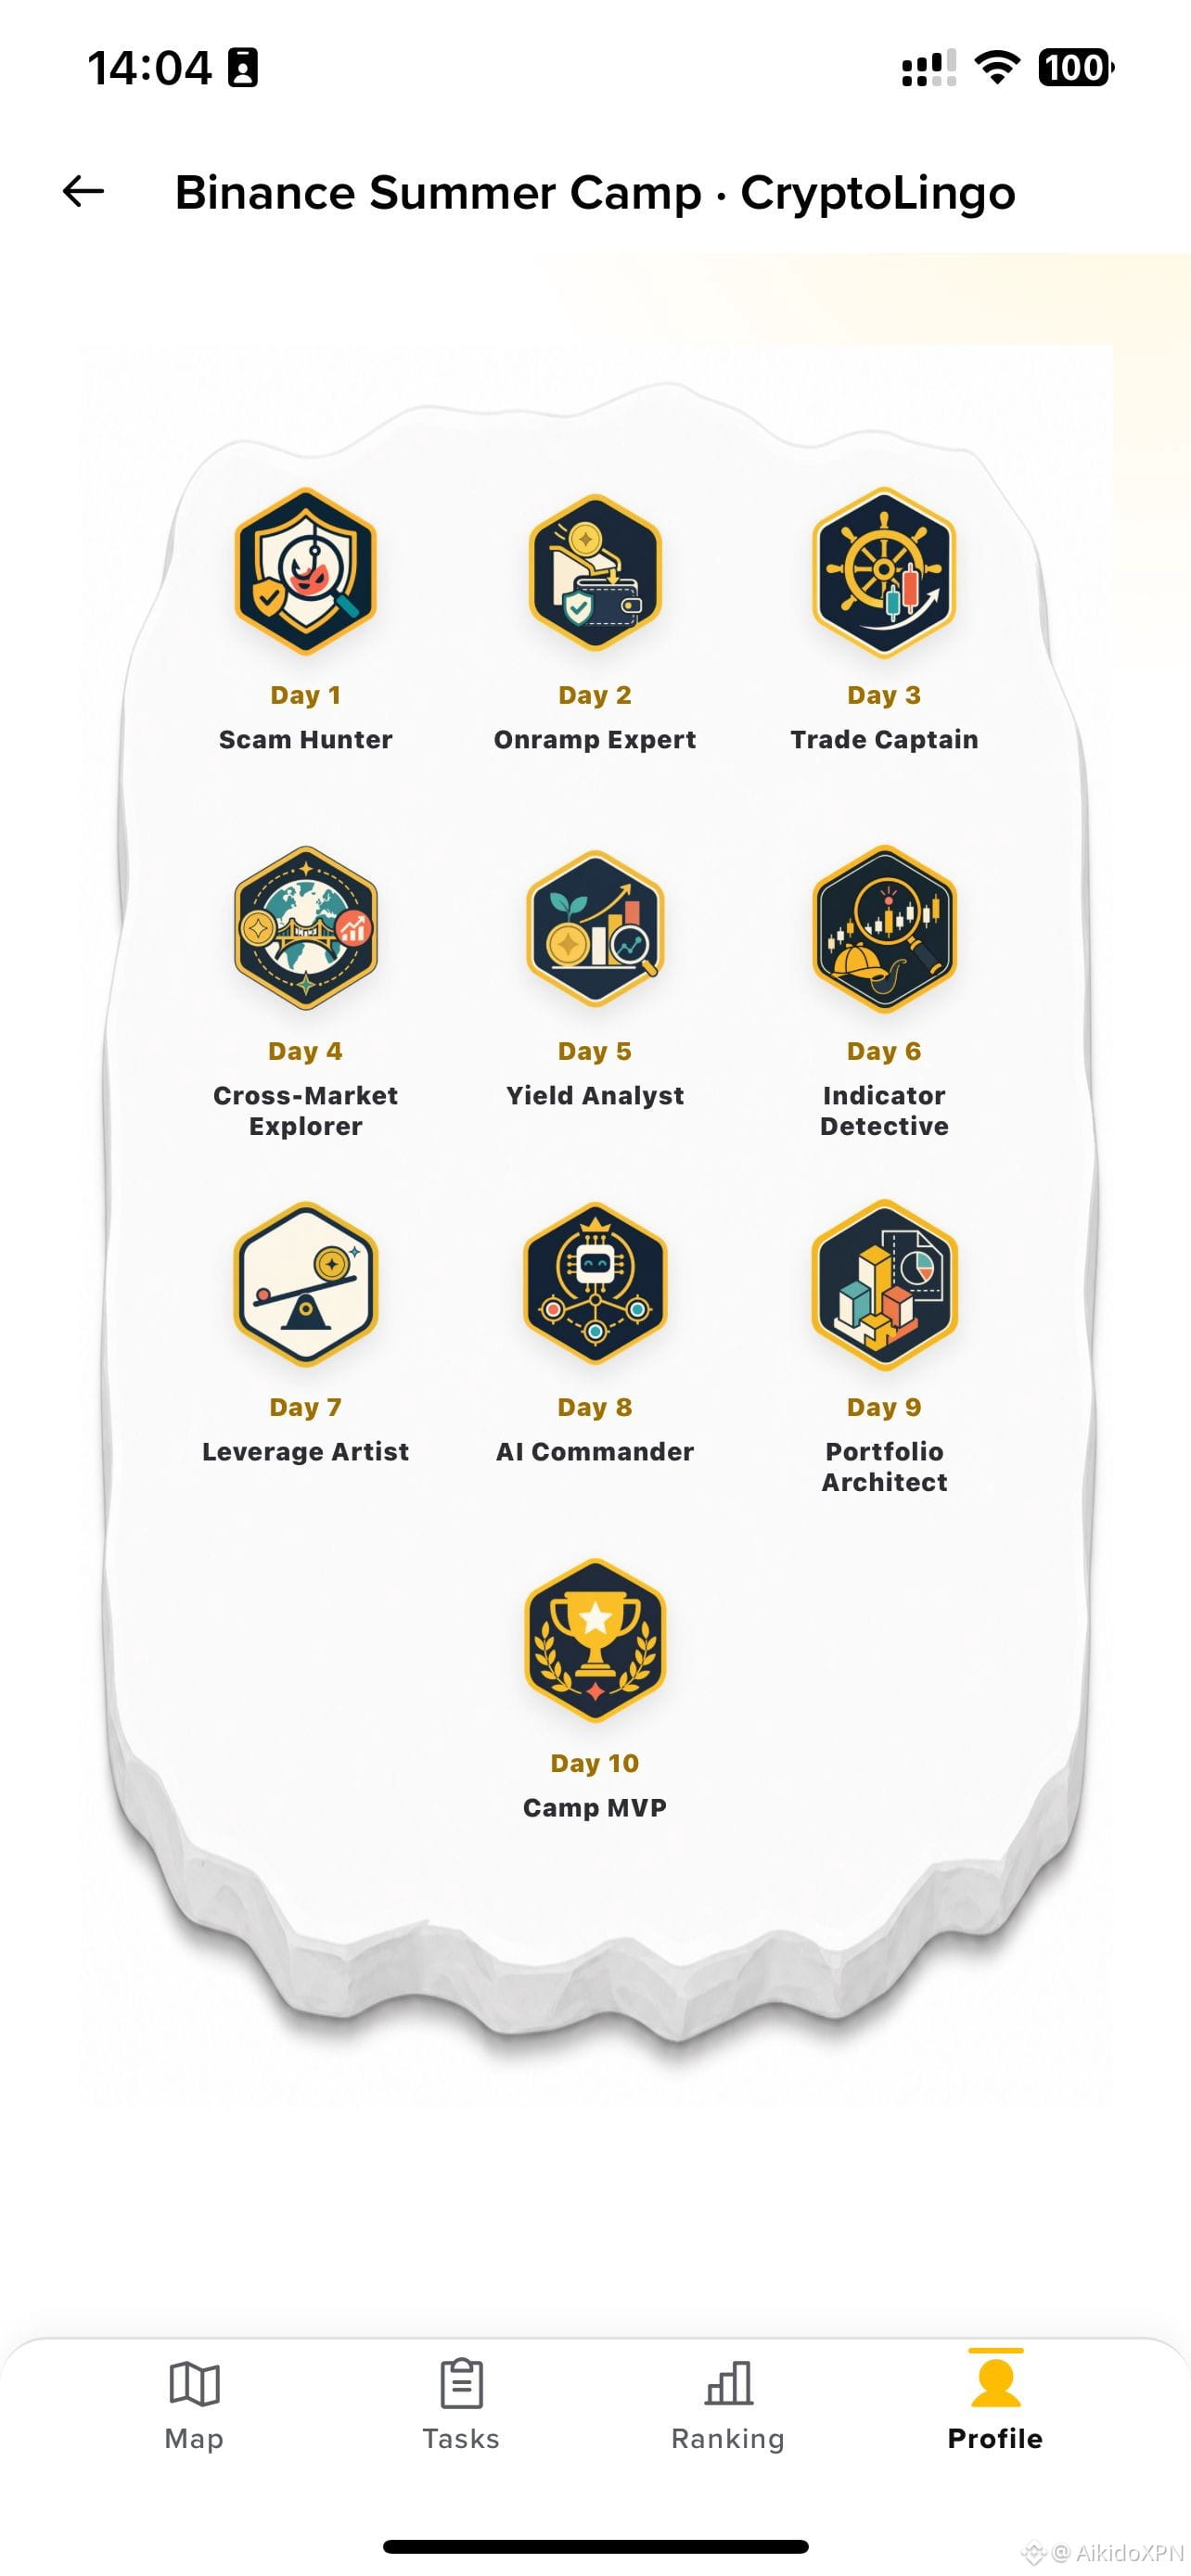
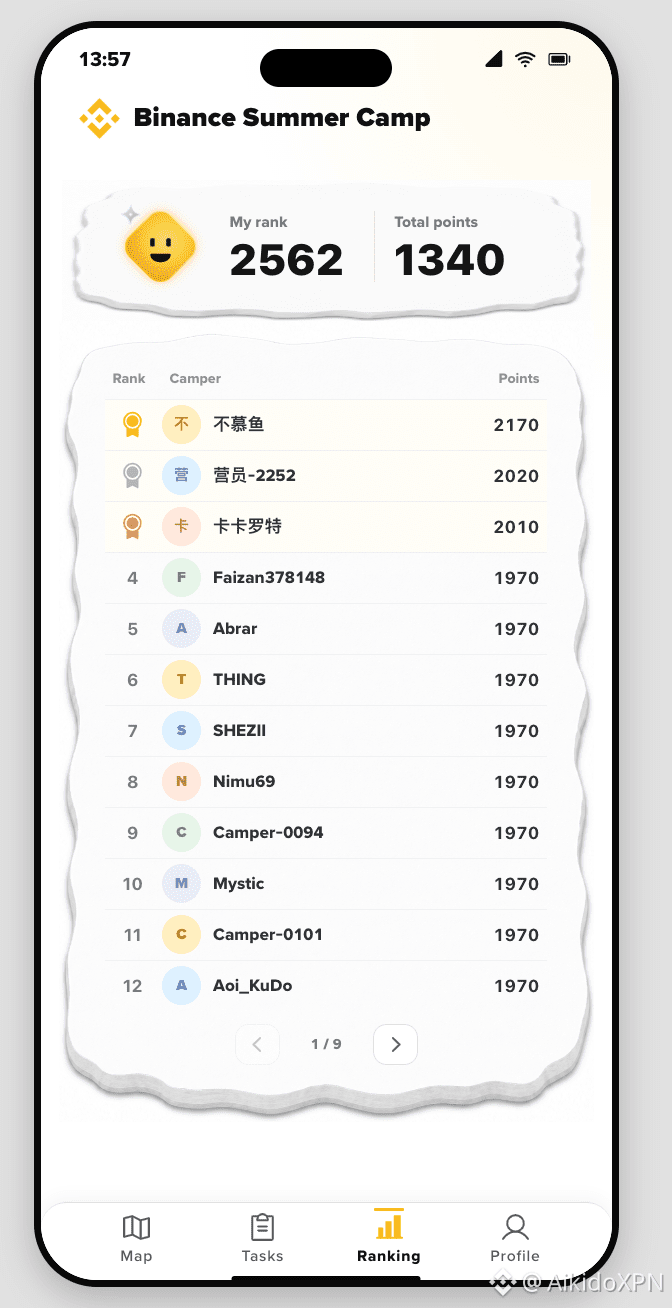
⛺ Binance Summer Camp | Day 10 Camp MVP! 🏆
#binancesummercamp
⛺ Binance Summer Camp | Day 10 Camp MVP! 🏆
まだ参加していないなら、ぜひこのキャンプに飛び込んでほしいです。
重要な学び: 🧠
• Secure: まずは資金を守ってから、リターンを追いかけましょう。 🛡️
• Understand: レバレッジやツールが実際にどう機能するのかを学んでから、リスクを取ってください。 📊
• Watch: 市場環境に目を配り、ポジションを注意深く監視しましょう。 👁️
• Trade: 低いレバレッジ、小さめのサイズ、厳格なストップロスで実行します。 🤝
ここまでのキャンプのハイライト: 「デビューにはスケールが必要だ」という誰かの言葉が、ここで一番笑えて、しかも一番間違っていました!スケールは初日からではなく、経験とともにやって来るものです。😅
下に私のキャンペーンカードを添付しています! 📸
参加しよう: 👇
キャンペーンページ: [https://www.binance.com/en/activity/marketing-campaign](https://www.binance.com/en/ti/cryptolingo)
これまでキャンプで聞いた中で、一番ワイルドだった気づきは何ですか?賢く取引して、みんなで勝ちましょう! 🤝
#CryptoLingo #BinanceEvent #binancecampaign
#binancesummercamp
⛺ Binance Summer Camp | Day 10 Camp MVP! 🏆
#binancesummercamp
⛺ Binance Summer Camp | Day 10 Camp MVP! 🏆
まだ参加していないなら、ぜひこのキャンプに飛び込んでほしいです。
重要な学び: 🧠
• Secure: まずは資金を守ってから、リターンを追いかけましょう。 🛡️
• Understand: レバレッジやツールが実際にどう機能するのかを学んでから、リスクを取ってください。 📊
• Watch: 市場環境に目を配り、ポジションを注意深く監視しましょう。 👁️
• Trade: 低いレバレッジ、小さめのサイズ、厳格なストップロスで実行します。 🤝
ここまでのキャンプのハイライト: 「デビューにはスケールが必要だ」という誰かの言葉が、ここで一番笑えて、しかも一番間違っていました!スケールは初日からではなく、経験とともにやって来るものです。😅
下に私のキャンペーンカードを添付しています! 📸
参加しよう: 👇
キャンペーンページ: https://www.binance.com/en/activity/marketing-campaign
これまでキャンプで聞いた中で、一番ワイルドだった気づきは何ですか?賢く取引して、みんなで勝ちましょう! 🤝
#CryptoLingo #BinanceEvent #binancecampaign
⛺ Binance Summer Camp | Day 10 Camp MVP! 🏆
#binancesummercamp
⛺ Binance Summer Camp | Day 10 Camp MVP! 🏆
まだ参加していないなら、ぜひこのキャンプに飛び込んでほしいです。
重要な学び: 🧠
• Secure: まずは資金を守ってから、リターンを追いかけましょう。 🛡️
• Understand: レバレッジやツールが実際にどう機能するのかを学んでから、リスクを取ってください。 📊
• Watch: 市場環境に目を配り、ポジションを注意深く監視しましょう。 👁️
• Trade: 低いレバレッジ、小さめのサイズ、厳格なストップロスで実行します。 🤝
ここまでのキャンプのハイライト: 「デビューにはスケールが必要だ」という誰かの言葉が、ここで一番笑えて、しかも一番間違っていました!スケールは初日からではなく、経験とともにやって来るものです。😅
下に私のキャンペーンカードを添付しています! 📸
参加しよう: 👇
キャンペーンページ: https://www.binance.com/en/activity/marketing-campaign
これまでキャンプで聞いた中で、一番ワイルドだった気づきは何ですか?賢く取引して、みんなで勝ちましょう! 🤝
#CryptoLingo #BinanceEvent #binancecampaign
2
55
·
--
#binancesummercamp
⛺ Binance Summer Camp | Day 9 完了!🚀
本日のポートフォリオ戦略とリスク管理を完了しました。
守ることが、報酬プールを狙いながら安全に過ごす最善の方法です!💰
要点:
🎯 ・バラスト+ドライパウダー:コアの現物ポジションを維持して足場を固め、安定コインは押し目買いのために温存しましょう。
📉 ・自分の計画に従う:相場が下がったときに焦ったり、感情のまま売買したりしないでください。
下に添付したキャンペーンカードをチェック!📸
楽しもう:👇 ・キャンペーンページ:
[CLICK HERE](https://www.binance.com/en/ti/cryptolingo)
もうDay 9のタスクは終わりましたか?賢くトレードして一緒に勝ちましょう!🤝
#CryptoLingo #BinanceEvent #binancecampaign
#binancesummercamp
⛺ Binance Summer Camp | Day 9 完了!🚀
本日のポートフォリオ戦略とリスク管理を完了しました。
守ることが、報酬プールを狙いながら安全に過ごす最善の方法です!💰
要点:
🎯 ・バラスト+ドライパウダー:コアの現物ポジションを維持して足場を固め、安定コインは押し目買いのために温存しましょう。
📉 ・自分の計画に従う:相場が下がったときに焦ったり、感情のまま売買したりしないでください。
下に添付したキャンペーンカードをチェック!📸
楽しもう:👇 ・キャンペーンページ:
CLICK HERE
もうDay 9のタスクは終わりましたか?賢くトレードして一緒に勝ちましょう!🤝
#CryptoLingo #BinanceEvent #binancecampaign
⛺ Binance Summer Camp | Day 9 完了!🚀
本日のポートフォリオ戦略とリスク管理を完了しました。
守ることが、報酬プールを狙いながら安全に過ごす最善の方法です!💰
要点:
🎯 ・バラスト+ドライパウダー:コアの現物ポジションを維持して足場を固め、安定コインは押し目買いのために温存しましょう。
📉 ・自分の計画に従う:相場が下がったときに焦ったり、感情のまま売買したりしないでください。
下に添付したキャンペーンカードをチェック!📸
楽しもう:👇 ・キャンペーンページ:
CLICK HERE
もうDay 9のタスクは終わりましたか?賢くトレードして一緒に勝ちましょう!🤝
#CryptoLingo #BinanceEvent #binancecampaign
3
91
·
--
#binancesummercamp
⛺ Binance Summer Camp | 8日目 完了!🚀
本日のAIコマンドセンターのセッションが完了しました。トレーディングボットの最適化には、運だけでなく戦略が必要です!💰
主なポイント:
• AIは補助です:必ずリスク制限を設定し、ボットを注意深く監視しましょう。
• まずは小さくテスト:最初は少額を入れて、システムを学びましょう。
下にキャンペーンカードを添付しています!📸
楽しもう:[CLICK HERE](https://www.binance.com/en/ti/cryptolingo)
もう8日目のタスクは終わりましたか?賢くトレードして、一緒に勝ちましょう!
#CryptoLingo #BinanceEvent #binancecampaign
#binancesummercamp
⛺ Binance Summer Camp | 8日目 完了!🚀
本日のAIコマンドセンターのセッションが完了しました。トレーディングボットの最適化には、運だけでなく戦略が必要です!💰
主なポイント:
• AIは補助です:必ずリスク制限を設定し、ボットを注意深く監視しましょう。
• まずは小さくテスト:最初は少額を入れて、システムを学びましょう。
下にキャンペーンカードを添付しています!📸
楽しもう:CLICK HERE
もう8日目のタスクは終わりましたか?賢くトレードして、一緒に勝ちましょう!
#CryptoLingo #BinanceEvent #binancecampaign
⛺ Binance Summer Camp | 8日目 完了!🚀
本日のAIコマンドセンターのセッションが完了しました。トレーディングボットの最適化には、運だけでなく戦略が必要です!💰
主なポイント:
• AIは補助です:必ずリスク制限を設定し、ボットを注意深く監視しましょう。
• まずは小さくテスト:最初は少額を入れて、システムを学びましょう。
下にキャンペーンカードを添付しています!📸
楽しもう:CLICK HERE
もう8日目のタスクは終わりましたか?賢くトレードして、一緒に勝ちましょう!
#CryptoLingo #BinanceEvent #binancecampaign
2
90

·
--
#binancesummercamp
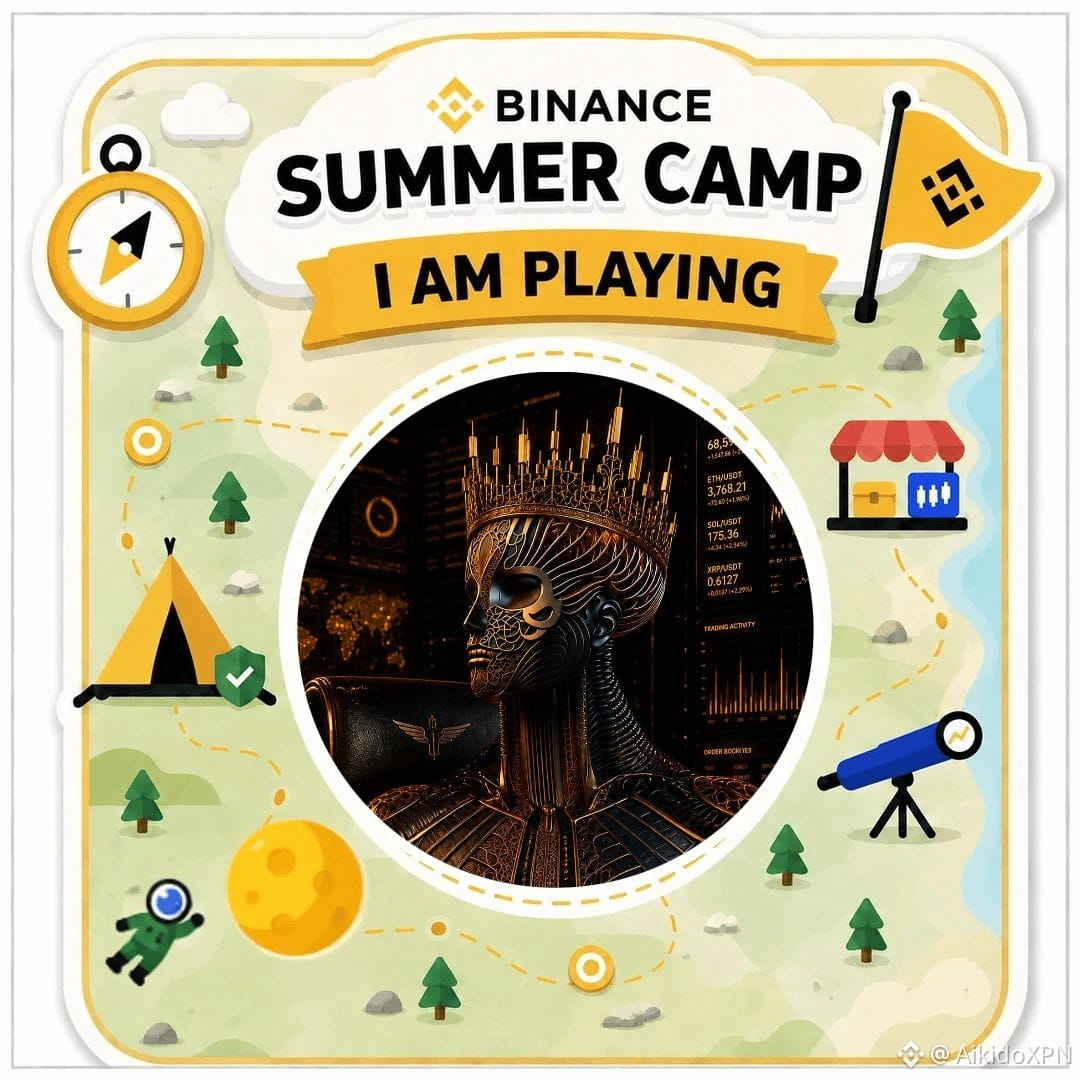
🏕️ Binance サマーキャンプ | 1日目完了! 🚀
最初のアクティビティが無事終了しました!今日はアカウント防御と暗号資産の基本用語を中心に学びました。 🔐✨
資金を適切に保護し、市場をうまく利用する方法を学ぶことが、10,000 USDCの報酬プールの一部を獲得しながら#SAFU でいられる究極の方法です! 🛡️💰
🎯 今日の重要ポイント:
* 資産を守るために、送金ネットワークは必ず二重確認しましょう。
* まずはセキュリティ、利益はその次! 📈
📸 下に添付された私のカスタムキャンペーンカードをチェック!
👇 楽しみに参加しよう:
* ➡️ キャンペーンページ: [Binance Summer Camp](https://www.binance.com/en/ti/cryptolingo)
* ❤️ チャレンジ投稿を提出: Binance Survey Hub
1日目のタスクはもう完了しましたか?一緒に学んで、稼ぎましょう!
#CryptoLingo #BinanceEvent #binancecampaign
👇 楽しみに参加しよう: [CLICK HERE](https://www.binance.com/en/survey/5888c17f86cf44e5ab5fd3b7e7c5bdf7)
#binancesummercamp
🏕️ Binance サマーキャンプ | 1日目完了! 🚀
最初のアクティビティが無事終了しました!今日はアカウント防御と暗号資産の基本用語を中心に学びました。 🔐✨
資金を適切に保護し、市場をうまく利用する方法を学ぶことが、10,000 USDCの報酬プールの一部を獲得しながら#SAFU でいられる究極の方法です! 🛡️💰
🎯 今日の重要ポイント:
* 資産を守るために、送金ネットワークは必ず二重確認しましょう。
* まずはセキュリティ、利益はその次! 📈
📸 下に添付された私のカスタムキャンペーンカードをチェック!
👇 楽しみに参加しよう:
* ➡️ キャンペーンページ: Binance Summer Camp
* ❤️ チャレンジ投稿を提出: Binance Survey Hub
1日目のタスクはもう完了しましたか?一緒に学んで、稼ぎましょう!
#CryptoLingo #BinanceEvent #binancecampaign
👇 楽しみに参加しよう: CLICK HERE
🏕️ Binance サマーキャンプ | 1日目完了! 🚀
最初のアクティビティが無事終了しました!今日はアカウント防御と暗号資産の基本用語を中心に学びました。 🔐✨
資金を適切に保護し、市場をうまく利用する方法を学ぶことが、10,000 USDCの報酬プールの一部を獲得しながら#SAFU でいられる究極の方法です! 🛡️💰
🎯 今日の重要ポイント:
* 資産を守るために、送金ネットワークは必ず二重確認しましょう。
* まずはセキュリティ、利益はその次! 📈
📸 下に添付された私のカスタムキャンペーンカードをチェック!
👇 楽しみに参加しよう:
* ➡️ キャンペーンページ: Binance Summer Camp
* ❤️ チャレンジ投稿を提出: Binance Survey Hub
1日目のタスクはもう完了しましたか?一緒に学んで、稼ぎましょう!
#CryptoLingo #BinanceEvent #binancecampaign
👇 楽しみに参加しよう: CLICK HERE
2
3
66
·
--
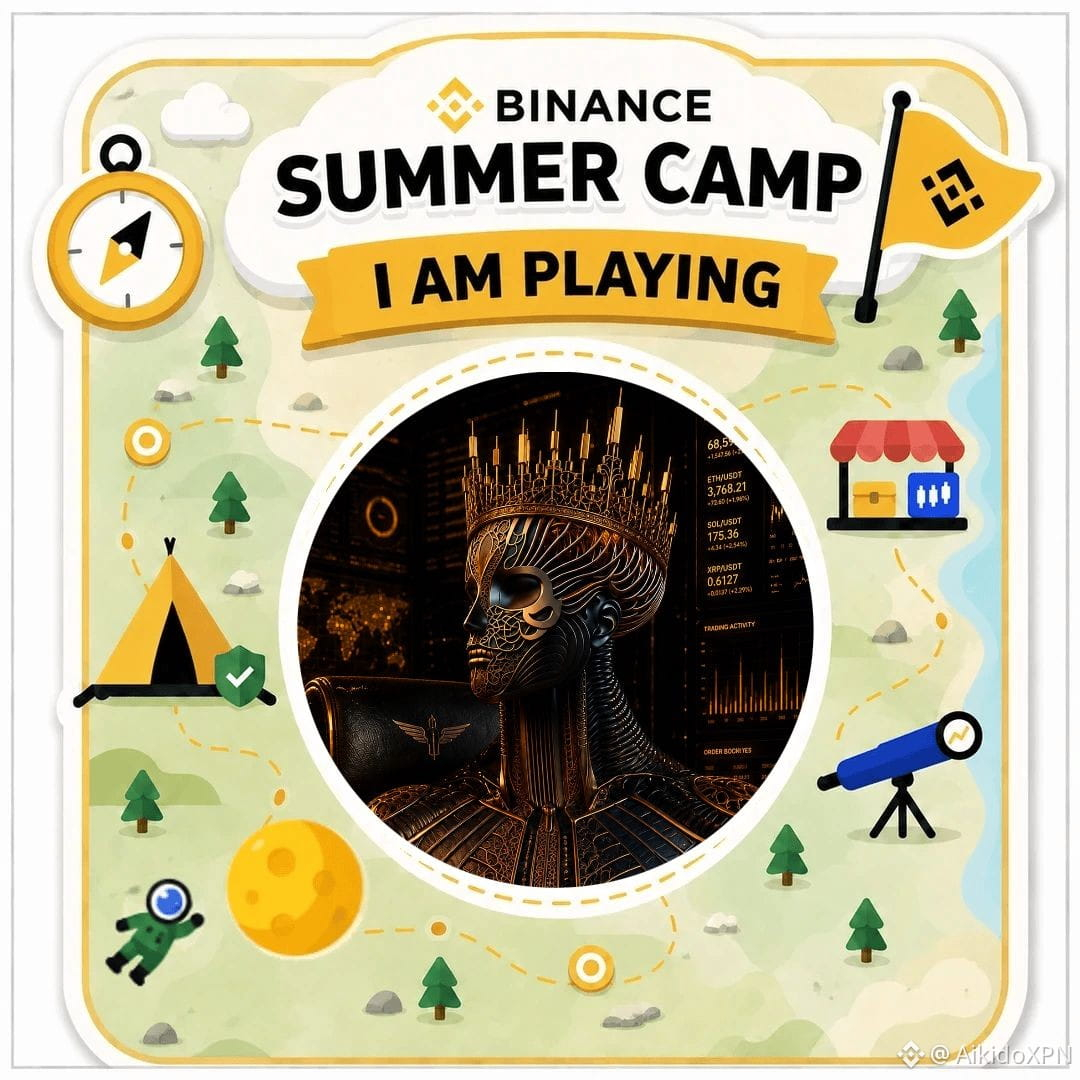
🏕️ Binance サマーキャンプ | 1日目 完了!🚀
#BinanceSummerCamp のアクティビティ初日が終わりました!今日のテーマは、アカウント防衛と暗号用語の基礎です。🔐✨
資金を適切に守り、市場を理解して動く方法を学ぶことが、#SAFU を維持しつつ 10,000 USDC のリワードプールから分け前を得るための究極の方法です!🛡️💰
🎯 今日のポイント:
* 資産を守るために、送金ネットワークは必ず二重チェックすること。
* セキュリティ第一、利益はその次!📈
📸 下に添付されたカスタムキャンペーンカードをぜひチェック!
👇 参加しよう:
* ➡️ キャンペーンページ:[Binance Summer Camp](https://www.binance.com/en/ti/cryptolingo)
* ❤️ チャレンジ投稿を提出:Binance Survey Hub
もう 1日目のタスクは完了しましたか?一緒に学んで稼ぎましょう!
#Binance #BinanceSummerCamp #CryptoLingo #BinanceEvent #CryptoSecurity #SAFU
👇 参加しよう:[CLICK HERE](https://www.binance.com/en/survey/5888c17f86cf44e5ab5fd3b7e7c5bdf7)
🏕️ Binance サマーキャンプ | 1日目 完了!🚀
#BinanceSummerCamp のアクティビティ初日が終わりました!今日のテーマは、アカウント防衛と暗号用語の基礎です。🔐✨
資金を適切に守り、市場を理解して動く方法を学ぶことが、#SAFU を維持しつつ 10,000 USDC のリワードプールから分け前を得るための究極の方法です!🛡️💰
🎯 今日のポイント:
* 資産を守るために、送金ネットワークは必ず二重チェックすること。
* セキュリティ第一、利益はその次!📈
📸 下に添付されたカスタムキャンペーンカードをぜひチェック!
👇 参加しよう:
* ➡️ キャンペーンページ:Binance Summer Camp
* ❤️ チャレンジ投稿を提出:Binance Survey Hub
もう 1日目のタスクは完了しましたか?一緒に学んで稼ぎましょう!
#Binance #BinanceSummerCamp #CryptoLingo #BinanceEvent #CryptoSecurity #SAFU
👇 参加しよう:CLICK HERE
#BinanceSummerCamp のアクティビティ初日が終わりました!今日のテーマは、アカウント防衛と暗号用語の基礎です。🔐✨
資金を適切に守り、市場を理解して動く方法を学ぶことが、#SAFU を維持しつつ 10,000 USDC のリワードプールから分け前を得るための究極の方法です!🛡️💰
🎯 今日のポイント:
* 資産を守るために、送金ネットワークは必ず二重チェックすること。
* セキュリティ第一、利益はその次!📈
📸 下に添付されたカスタムキャンペーンカードをぜひチェック!
👇 参加しよう:
* ➡️ キャンペーンページ:Binance Summer Camp
* ❤️ チャレンジ投稿を提出:Binance Survey Hub
もう 1日目のタスクは完了しましたか?一緒に学んで稼ぎましょう!
#Binance #BinanceSummerCamp #CryptoLingo #BinanceEvent #CryptoSecurity #SAFU
👇 参加しよう:CLICK HERE
3
61
·
--
実地で活躍: Binance Agent OSが1日で90,000件以上のリクエストを処理した方法実地で活躍: Binance Agent OSが1日で90,000件以上のリクエストを処理した方法
AIは何年もかけて、テクノロジーとの関わり方を変えると約束してきました。今、より面白い問いは、人々がそれを本当に役立つ作業に使っているのかどうかです。
Binance Agent OSの初期利用データによると、すでに変化の兆しが見え始めています。
稼働開始から最初の数週間で、Agent OSは1日で9万件以上のエージェントリクエストを処理しました。約97%のリクエストが正常に完了し、95%は60ミリ秒以内に提供されました。アクティブユーザーのほぼ半数が、1日あたり20件以上のリクエストを生成していました。
実地で活躍: Binance Agent OSが1日で90,000件以上のリクエストを処理した方法
実地で活躍: Binance Agent OSが1日で90,000件以上のリクエストを処理した方法
AIは何年もかけて、テクノロジーとの関わり方を変えると約束してきました。今、より面白い問いは、人々がそれを本当に役立つ作業に使っているのかどうかです。
Binance Agent OSの初期利用データによると、すでに変化の兆しが見え始めています。
稼働開始から最初の数週間で、Agent OSは1日で9万件以上のエージェントリクエストを処理しました。約97%のリクエストが正常に完了し、95%は60ミリ秒以内に提供されました。アクティブユーザーのほぼ半数が、1日あたり20件以上のリクエストを生成していました。
AIは何年もかけて、テクノロジーとの関わり方を変えると約束してきました。今、より面白い問いは、人々がそれを本当に役立つ作業に使っているのかどうかです。
Binance Agent OSの初期利用データによると、すでに変化の兆しが見え始めています。
稼働開始から最初の数週間で、Agent OSは1日で9万件以上のエージェントリクエストを処理しました。約97%のリクエストが正常に完了し、95%は60ミリ秒以内に提供されました。アクティブユーザーのほぼ半数が、1日あたり20件以上のリクエストを生成していました。
3
89
·
--
本当に思っているほど難しくありません
本当に思っているほど難しくありません
nyemangel
·
--
この動画では、Agent OS を接続する方法と、エージェントができる重要なことをいくつか学びます。👍
#BinanceAgentOS
@Binance Angels CONNECT BUILD CONTROL
Agent OS を使ってみて学んだ重要なことの1つは、セットアップにプログラミングのスキルは必要ないということ、そして自分でコントロールできるということです。
#BinanceAgentOS
@Binance Angels CONNECT BUILD CONTROL
Agent OS を使ってみて学んだ重要なことの1つは、セットアップにプログラミングのスキルは必要ないということ、そして自分でコントロールできるということです。
1
34
·
--
🚀
🚀


Binance Blog
·
--
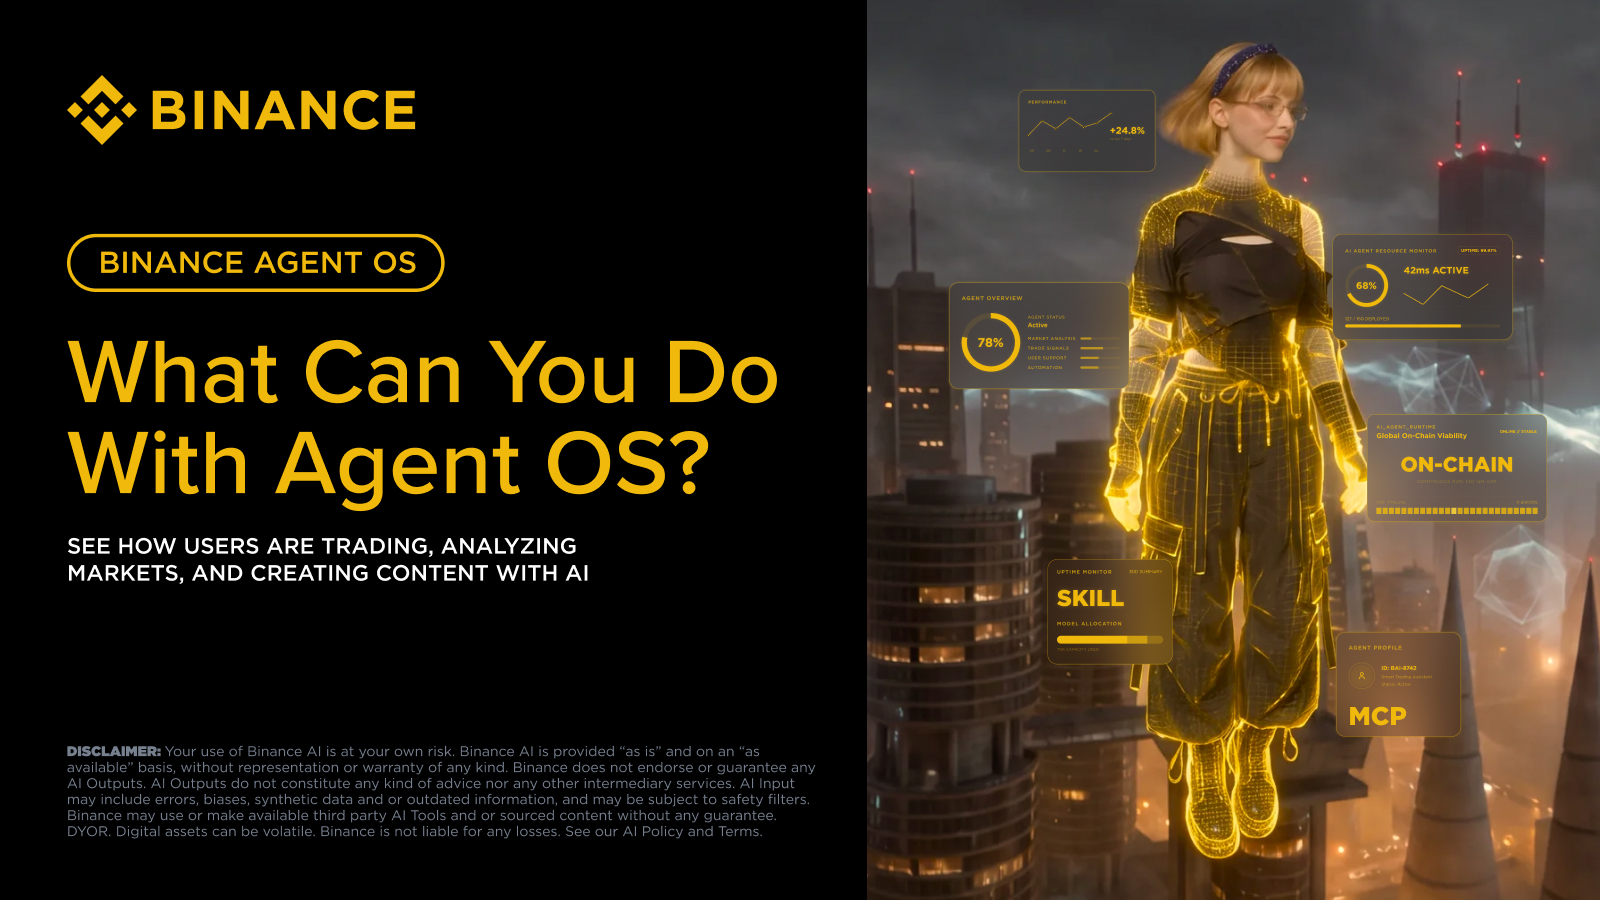
人々がすでにBinance Agent OSを使っている3つの方法
主なポイントBinance Agent OSは、Binanceの機能を、すでに毎日使われているAIツールやエージェントに取り込むためのプラットフォームおよびツールキットです。Binance MCPサーバーおよびその他のAgent OSツールを通じて、AIエージェントがBinanceの市場データ、取引、ウォレット、決済にアクセスできるようになります。Binanceの3人のユーザーが、すでにAgent OSをどのように活用しているかを語ります。私たちの多くにとって、AIエージェントのない生活を想像するのはもう難しいでしょう。ここ数年で、それらは単なるチャットボットから、私たちが毎日使うツールへと進化してきました。AIエージェントは情報を検索し、複数のプラットフォームで連携し、私たちの代わりに行動を起こすことができます。
1
7
·
--
静かな差別化要因:バイナンスのセキュリティが一年中バックグラウンドで機能してきた方法🛡️ 2026年で最も騒がれた仮想通貨の話題は、停止、ハッキング、そして見出しだ。いちばん静かなものは、より重要かもしれない。
この夏、AscendEX、BitMEX、BitMartはいずれも業務を縮小していく一方で、TRM Labsによると今年最初の4か月だけでも北朝鮮の関係者が約5億7700万ドルを盗み出していた。だが、それよりも目立たない——そしておそらくより重要な——動きが裏側では進行していた。つまり、ほとんどのユーザーが稼働に気づかないほど十分に機能しているセキュリティ体制が、その役割をきちんと果たしていたのだ。
今年実際に何が起きたのか
静かな差別化要因:バイナンスのセキュリティが一年中バックグラウンドで機能してきた方法
🛡️ 2026年で最も騒がれた仮想通貨の話題は、停止、ハッキング、そして見出しだ。いちばん静かなものは、より重要かもしれない。
この夏、AscendEX、BitMEX、BitMartはいずれも業務を縮小していく一方で、TRM Labsによると今年最初の4か月だけでも北朝鮮の関係者が約5億7700万ドルを盗み出していた。だが、それよりも目立たない——そしておそらくより重要な——動きが裏側では進行していた。つまり、ほとんどのユーザーが稼働に気づかないほど十分に機能しているセキュリティ体制が、その役割をきちんと果たしていたのだ。
今年実際に何が起きたのか
この夏、AscendEX、BitMEX、BitMartはいずれも業務を縮小していく一方で、TRM Labsによると今年最初の4か月だけでも北朝鮮の関係者が約5億7700万ドルを盗み出していた。だが、それよりも目立たない——そしておそらくより重要な——動きが裏側では進行していた。つまり、ほとんどのユーザーが稼働に気づかないほど十分に機能しているセキュリティ体制が、その役割をきちんと果たしていたのだ。
今年実際に何が起きたのか
2
9
·
--
記事
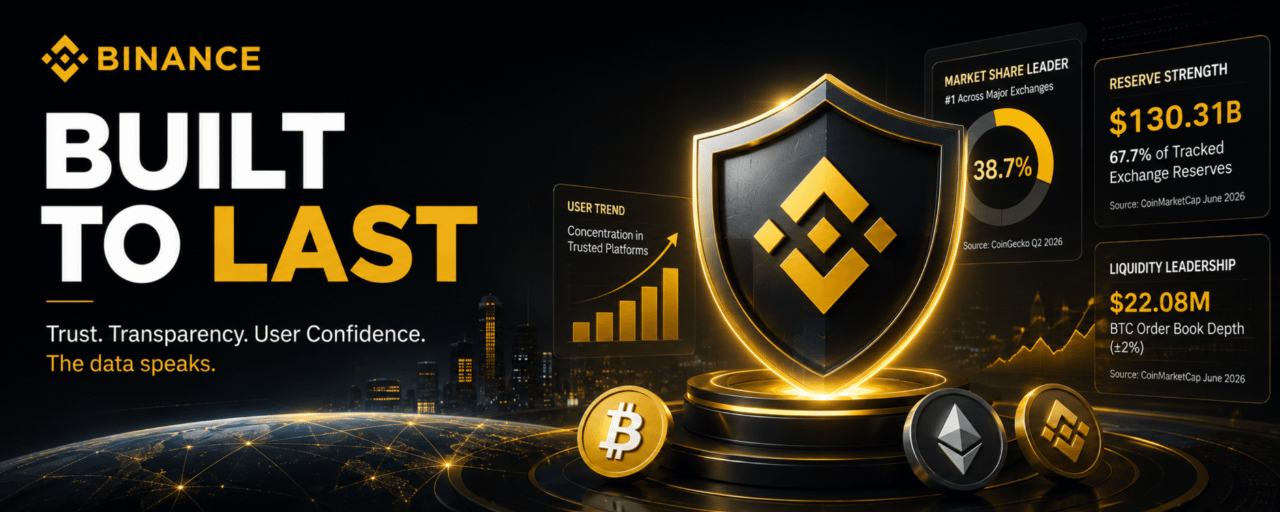
長く持つために作られている:暗号資産における信頼、透明性、そしてユーザー動向について第三者データが語ることわずか1か月の間に、3つの取引所が相次いで停止した。市場はほとんど動じなかった。
その反応――あるいは反応のなさ――こそが本当の物語だ。2026年7月にAscendEX、BitMEX、BitMartが相次いで閉鎖を発表したとき、反射的に湧いた疑問は「次は誰だ?」だった。だが、実際のデータを見れば別の物語が浮かび上がる。パニックではなく、利用者の資金がどこにあるかを裏付けられる取引所へ向けた、静かで測定可能な資本の移行だ。
実際に何が起きたのか
AscendEXは2026年7月1日に業務を停止した。EUのMiCA枠組みが完全に適用されたまさにその日である。新ルール下で認可を確保できなかったためだ。11年前に100倍のパーペチュアル・スワップを先駆けた取引所であるBitMEXは、7月23日に9月23日までに段階的に停止する方針を確認した。さらにHDR Global Tradingは、準備金が依然として顧客の負債を上回っていると明確に述べている。BitMartも7月26日に続き、「破産」ではなく「業務上の条件」を理由に挙げた。ロイターは、BitMEXの市場シェアが発表前には0.01%未満まで崩れていたと報じている。日次出来高は約40万ドルまで低下しており、累計で3兆ドル超を処理していた取引所からの驚くべき転落だ。
長く持つために作られている:暗号資産における信頼、透明性、そしてユーザー動向について第三者データが語ること
わずか1か月の間に、3つの取引所が相次いで停止した。市場はほとんど動じなかった。
その反応――あるいは反応のなさ――こそが本当の物語だ。2026年7月にAscendEX、BitMEX、BitMartが相次いで閉鎖を発表したとき、反射的に湧いた疑問は「次は誰だ?」だった。だが、実際のデータを見れば別の物語が浮かび上がる。パニックではなく、利用者の資金がどこにあるかを裏付けられる取引所へ向けた、静かで測定可能な資本の移行だ。
実際に何が起きたのか
AscendEXは2026年7月1日に業務を停止した。EUのMiCA枠組みが完全に適用されたまさにその日である。新ルール下で認可を確保できなかったためだ。11年前に100倍のパーペチュアル・スワップを先駆けた取引所であるBitMEXは、7月23日に9月23日までに段階的に停止する方針を確認した。さらにHDR Global Tradingは、準備金が依然として顧客の負債を上回っていると明確に述べている。BitMartも7月26日に続き、「破産」ではなく「業務上の条件」を理由に挙げた。ロイターは、BitMEXの市場シェアが発表前には0.01%未満まで崩れていたと報じている。日次出来高は約40万ドルまで低下しており、累計で3兆ドル超を処理していた取引所からの驚くべき転落だ。
その反応――あるいは反応のなさ――こそが本当の物語だ。2026年7月にAscendEX、BitMEX、BitMartが相次いで閉鎖を発表したとき、反射的に湧いた疑問は「次は誰だ?」だった。だが、実際のデータを見れば別の物語が浮かび上がる。パニックではなく、利用者の資金がどこにあるかを裏付けられる取引所へ向けた、静かで測定可能な資本の移行だ。
実際に何が起きたのか
AscendEXは2026年7月1日に業務を停止した。EUのMiCA枠組みが完全に適用されたまさにその日である。新ルール下で認可を確保できなかったためだ。11年前に100倍のパーペチュアル・スワップを先駆けた取引所であるBitMEXは、7月23日に9月23日までに段階的に停止する方針を確認した。さらにHDR Global Tradingは、準備金が依然として顧客の負債を上回っていると明確に述べている。BitMartも7月26日に続き、「破産」ではなく「業務上の条件」を理由に挙げた。ロイターは、BitMEXの市場シェアが発表前には0.01%未満まで崩れていたと報じている。日次出来高は約40万ドルまで低下しており、累計で3兆ドル超を処理していた取引所からの驚くべき転落だ。
1
3
66
·
--
長く使えるように設計:暗号資産における信頼・透明性・ユーザートレンドについて、第三者データが語ること取引所が消えると、ユーザーは単にプラットフォームを失うだけではありません。資本がそこにあったはずだという、安心感そのものを失います。
だからこそ、「次は誰?」という問いは、暗号資産の市場が冷え込み、規制の圧力が高まるたびに繰り返し浮上してきます。
しかし、憶測は簡単です。
数字のほうが、反論しにくいのです。
CoinMarketCap、CCData、CoinGeckoによる独立した調査では、交換(取引所)市場がますます集中していることが示されています。そして、Binanceはその中心に居続けています。
重要なのは、単に誰がいちばん大きな名前を持っているかではありません。
長く使えるように設計:暗号資産における信頼・透明性・ユーザートレンドについて、第三者データが語ること
取引所が消えると、ユーザーは単にプラットフォームを失うだけではありません。資本がそこにあったはずだという、安心感そのものを失います。
だからこそ、「次は誰?」という問いは、暗号資産の市場が冷え込み、規制の圧力が高まるたびに繰り返し浮上してきます。
しかし、憶測は簡単です。
数字のほうが、反論しにくいのです。
CoinMarketCap、CCData、CoinGeckoによる独立した調査では、交換(取引所)市場がますます集中していることが示されています。そして、Binanceはその中心に居続けています。
重要なのは、単に誰がいちばん大きな名前を持っているかではありません。
だからこそ、「次は誰?」という問いは、暗号資産の市場が冷え込み、規制の圧力が高まるたびに繰り返し浮上してきます。
しかし、憶測は簡単です。
数字のほうが、反論しにくいのです。
CoinMarketCap、CCData、CoinGeckoによる独立した調査では、交換(取引所)市場がますます集中していることが示されています。そして、Binanceはその中心に居続けています。
重要なのは、単に誰がいちばん大きな名前を持っているかではありません。
1
16
·
--
記事
最終結論:ウォール街が眠っている間にNvidiaの決算がAIサプライチェーン全体に与えた影響マクロ&デジタル・アセット・デスク | 2026年8月31日
要約:Nvidiaの8月26日のレポートは、このAI決算シーズンの最終試験でした——そしてそれは、アジアの取引日が始まろうとしているタイミングで、米国の取引終了後に公表されました。ウォール街が眠っている間、Binanceの24時間体制の市場(トークン化された米国株式プロダクトを含む)が、その“死んだ時間帯”を、リアルタイムの価格発見イベントへと変えました。Nvidiaのシグナルが、AIサプライチェーンの4つの層——相関が直接強いチップから、より広い指数に至るまで——へどのように伝播したのか、従来の取引所が休止していた状況も踏まえて解説します。
最終結論:ウォール街が眠っている間にNvidiaの決算がAIサプライチェーン全体に与えた影響
マクロ&デジタル・アセット・デスク | 2026年8月31日
要約:Nvidiaの8月26日のレポートは、このAI決算シーズンの最終試験でした——そしてそれは、アジアの取引日が始まろうとしているタイミングで、米国の取引終了後に公表されました。ウォール街が眠っている間、Binanceの24時間体制の市場(トークン化された米国株式プロダクトを含む)が、その“死んだ時間帯”を、リアルタイムの価格発見イベントへと変えました。Nvidiaのシグナルが、AIサプライチェーンの4つの層——相関が直接強いチップから、より広い指数に至るまで——へどのように伝播したのか、従来の取引所が休止していた状況も踏まえて解説します。
要約:Nvidiaの8月26日のレポートは、このAI決算シーズンの最終試験でした——そしてそれは、アジアの取引日が始まろうとしているタイミングで、米国の取引終了後に公表されました。ウォール街が眠っている間、Binanceの24時間体制の市場(トークン化された米国株式プロダクトを含む)が、その“死んだ時間帯”を、リアルタイムの価格発見イベントへと変えました。Nvidiaのシグナルが、AIサプライチェーンの4つの層——相関が直接強いチップから、より広い指数に至るまで——へどのように伝播したのか、従来の取引所が休止していた状況も踏まえて解説します。
2
47
·
--
私たちのエージェント、あなたの金融:AIエージェント時代のためにBinanceが金融レイヤーを構築する理由AIが答えを出すのをやめて、行動し始めたらどうなるのでしょうか?
その問いは、暗号資産(クリプト)においてこれまで以上に重要になっています。
何年もの間、AIは市場の説明、情報の要約、質問への回答に驚くほど優れてきました。しかし次の段階はそれとは違います。
AIエージェントは、何が起きているかを伝えるだけではありません。
それは行動できます。
そして、ソフトウェアが金融市場内で行動できるようになったら、知性以上のものが必要になります。
アクセス、許可、制限、そして説明責任が必要です。
その領域で、Binance Agent OSが登場します。
私たちのエージェント、あなたの金融:AIエージェント時代のためにBinanceが金融レイヤーを構築する理由
AIが答えを出すのをやめて、行動し始めたらどうなるのでしょうか?
その問いは、暗号資産(クリプト)においてこれまで以上に重要になっています。
何年もの間、AIは市場の説明、情報の要約、質問への回答に驚くほど優れてきました。しかし次の段階はそれとは違います。
AIエージェントは、何が起きているかを伝えるだけではありません。
それは行動できます。
そして、ソフトウェアが金融市場内で行動できるようになったら、知性以上のものが必要になります。
アクセス、許可、制限、そして説明責任が必要です。
その領域で、Binance Agent OSが登場します。
その問いは、暗号資産(クリプト)においてこれまで以上に重要になっています。
何年もの間、AIは市場の説明、情報の要約、質問への回答に驚くほど優れてきました。しかし次の段階はそれとは違います。
AIエージェントは、何が起きているかを伝えるだけではありません。
それは行動できます。
そして、ソフトウェアが金融市場内で行動できるようになったら、知性以上のものが必要になります。
アクセス、許可、制限、そして説明責任が必要です。
その領域で、Binance Agent OSが登場します。
2
93
ログインして、さらにコンテンツを読む
厳選トピックで世界の暗号資産トレーダーの仲間入り
⚡️ 暗号資産に関する最新かつ有益な情報が見つかります。
💬 世界最大の暗号資産取引所から信頼されています。
👍 認証を受けたクリエイターから、有益なインサイトを得られます。
メール / 電話番号