

Crypto box 007
44 投稿

Crypto box 007
報告
ユーザーをブロック
Crypto Analyst | Technical Trader. Sharing market insights & chart analysis. Not financial advice. DYOR
取引を発注
高頻度トレーダー
4.6年
7 フォロー
0 フォロワー
16 いいね
投稿
ポートフォリオ
すべて
引用
翻訳参照
ZEC/USDT Technical Analysis: Consolidation After a Strong Rally
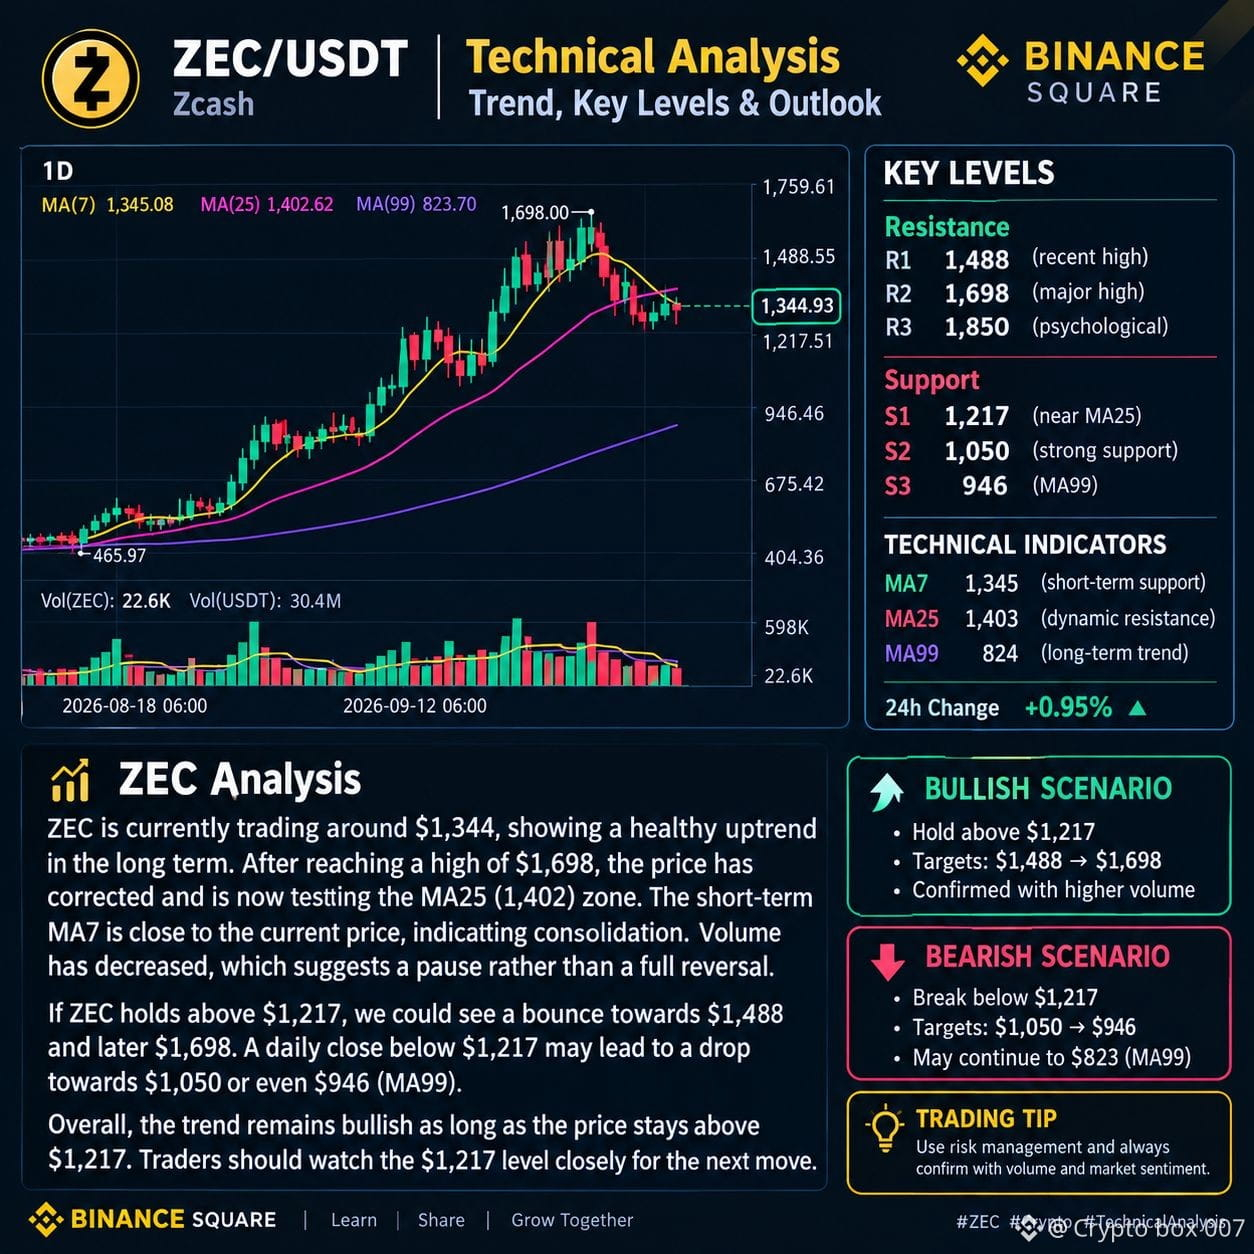
ZEC is trading around $1,345 on the daily chart after reaching a recent high near $1,698. The price has pulled back and is currently consolidating around the MA7 ($1,345) while remaining below the MA25 ($1,403).
The key level to watch is $1,217 support. If ZEC holds above this area, the current move could develop into another bullish continuation. A break above $1,403 would strengthen the short-term structure, with $1,488 and then $1,698 as major resistance zones.
On the downside, a daily close below $1,217 could increase selling pressure toward $1,050, followed by the $946 area. The long-term trend remains relatively strong while price stays well above the MA99 (~$824).
Key levels:
🟢 Support: $1,217 → $1,050 → $946
🔴 Resistance: $1,403 → $1,488 → $1,698
Overall, ZEC remains technically constructive, but confirmation above resistance or a strong hold at support is important before expecting the next major move.
#ZEC #zcash #BinanceSquare $ZEC
#DYOR🟢
ZEC/USDT Technical Analysis: Consolidation After a Strong Rally
ZEC is trading around $1,345 on the daily chart after reaching a recent high near $1,698. The price has pulled back and is currently consolidating around the MA7 ($1,345) while remaining below the MA25 ($1,403).
The key level to watch is $1,217 support. If ZEC holds above this area, the current move could develop into another bullish continuation. A break above $1,403 would strengthen the short-term structure, with $1,488 and then $1,698 as major resistance zones.
On the downside, a daily close below $1,217 could increase selling pressure toward $1,050, followed by the $946 area. The long-term trend remains relatively strong while price stays well above the MA99 (~$824).
Key levels:
🟢 Support: $1,217 → $1,050 → $946
🔴 Resistance: $1,403 → $1,488 → $1,698
Overall, ZEC remains technically constructive, but confirmation above resistance or a strong hold at support is important before expecting the next major move.
#ZEC #zcash #BinanceSquare $ZEC
#DYOR🟢
ZEC is trading around $1,345 on the daily chart after reaching a recent high near $1,698. The price has pulled back and is currently consolidating around the MA7 ($1,345) while remaining below the MA25 ($1,403).
The key level to watch is $1,217 support. If ZEC holds above this area, the current move could develop into another bullish continuation. A break above $1,403 would strengthen the short-term structure, with $1,488 and then $1,698 as major resistance zones.
On the downside, a daily close below $1,217 could increase selling pressure toward $1,050, followed by the $946 area. The long-term trend remains relatively strong while price stays well above the MA99 (~$824).
Key levels:
🟢 Support: $1,217 → $1,050 → $946
🔴 Resistance: $1,403 → $1,488 → $1,698
Overall, ZEC remains technically constructive, but confirmation above resistance or a strong hold at support is important before expecting the next major move.
#ZEC #zcash #BinanceSquare $ZEC
#DYOR🟢
148
翻訳参照
#SOL/USDT Daily Analysis — Binance Square
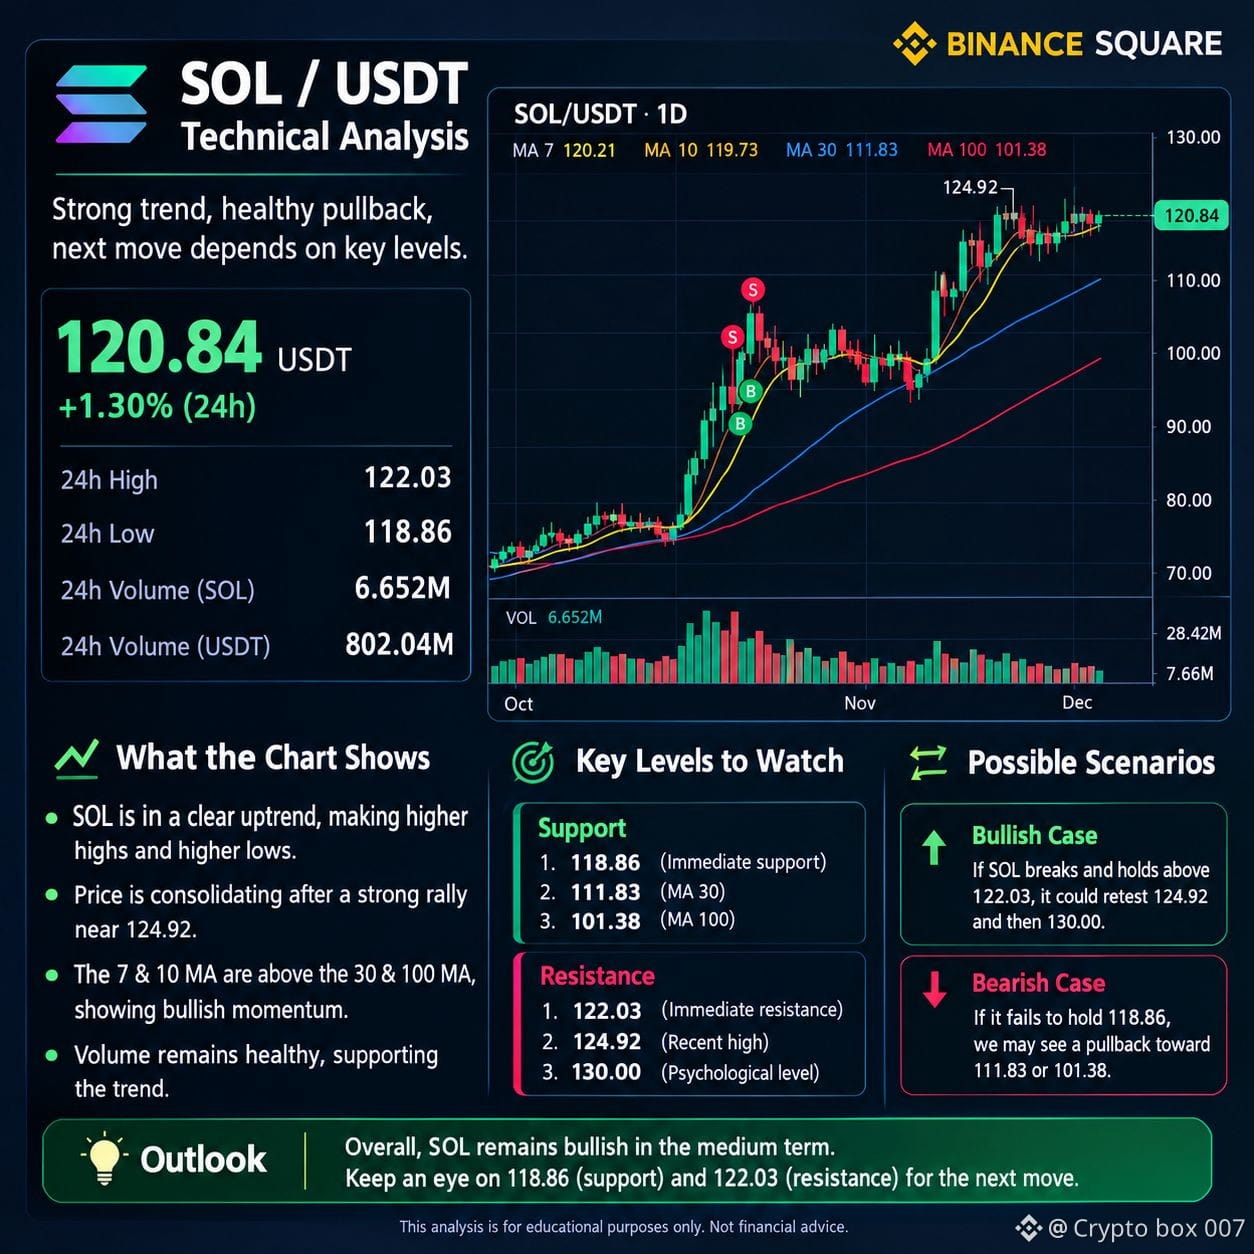
$SOL is showing a strong bullish structure on the 1D chart, but price is currently consolidating below the recent high of 124.92.
The key short-term resistance is 122.03, followed by 124.92. A confirmed breakout above 124.92 could open the way toward the 130 area.
On the downside, 118.86 is the first important support. If this level fails, SOL could pull back toward 111.83 (MA30). A deeper correction could bring 101.38 (MA100) into focus.
The moving averages remain bullish, with the short-term averages positioned above the longer-term averages. Overall, the structure remains positive as long as SOL holds above the major support zones.
Key Levels:
Support: 118.86 / 111.83 / 101.38
Resistance: 122.03 / 124.92 / 130.00
Bullish above 118.86, but a clean breakout above 124.92 would provide stronger confirmation of the next upside move.
This is technical analysis for educational purposes, not financial advice. $SOL
{future}(SOLUSDT)
#DYOR
#SOL/USDT Daily Analysis — Binance Square
$SOL is showing a strong bullish structure on the 1D chart, but price is currently consolidating below the recent high of 124.92.
The key short-term resistance is 122.03, followed by 124.92. A confirmed breakout above 124.92 could open the way toward the 130 area.
On the downside, 118.86 is the first important support. If this level fails, SOL could pull back toward 111.83 (MA30). A deeper correction could bring 101.38 (MA100) into focus.
The moving averages remain bullish, with the short-term averages positioned above the longer-term averages. Overall, the structure remains positive as long as SOL holds above the major support zones.
Key Levels:
Support: 118.86 / 111.83 / 101.38
Resistance: 122.03 / 124.92 / 130.00
Bullish above 118.86, but a clean breakout above 124.92 would provide stronger confirmation of the next upside move.
This is technical analysis for educational purposes, not financial advice. $SOL
#DYOR
$SOL is showing a strong bullish structure on the 1D chart, but price is currently consolidating below the recent high of 124.92.
The key short-term resistance is 122.03, followed by 124.92. A confirmed breakout above 124.92 could open the way toward the 130 area.
On the downside, 118.86 is the first important support. If this level fails, SOL could pull back toward 111.83 (MA30). A deeper correction could bring 101.38 (MA100) into focus.
The moving averages remain bullish, with the short-term averages positioned above the longer-term averages. Overall, the structure remains positive as long as SOL holds above the major support zones.
Key Levels:
Support: 118.86 / 111.83 / 101.38
Resistance: 122.03 / 124.92 / 130.00
Bullish above 118.86, but a clean breakout above 124.92 would provide stronger confirmation of the next upside move.
This is technical analysis for educational purposes, not financial advice. $SOL
#DYOR
84
翻訳参照
₿ BTC/USDT Daily Market Outlook
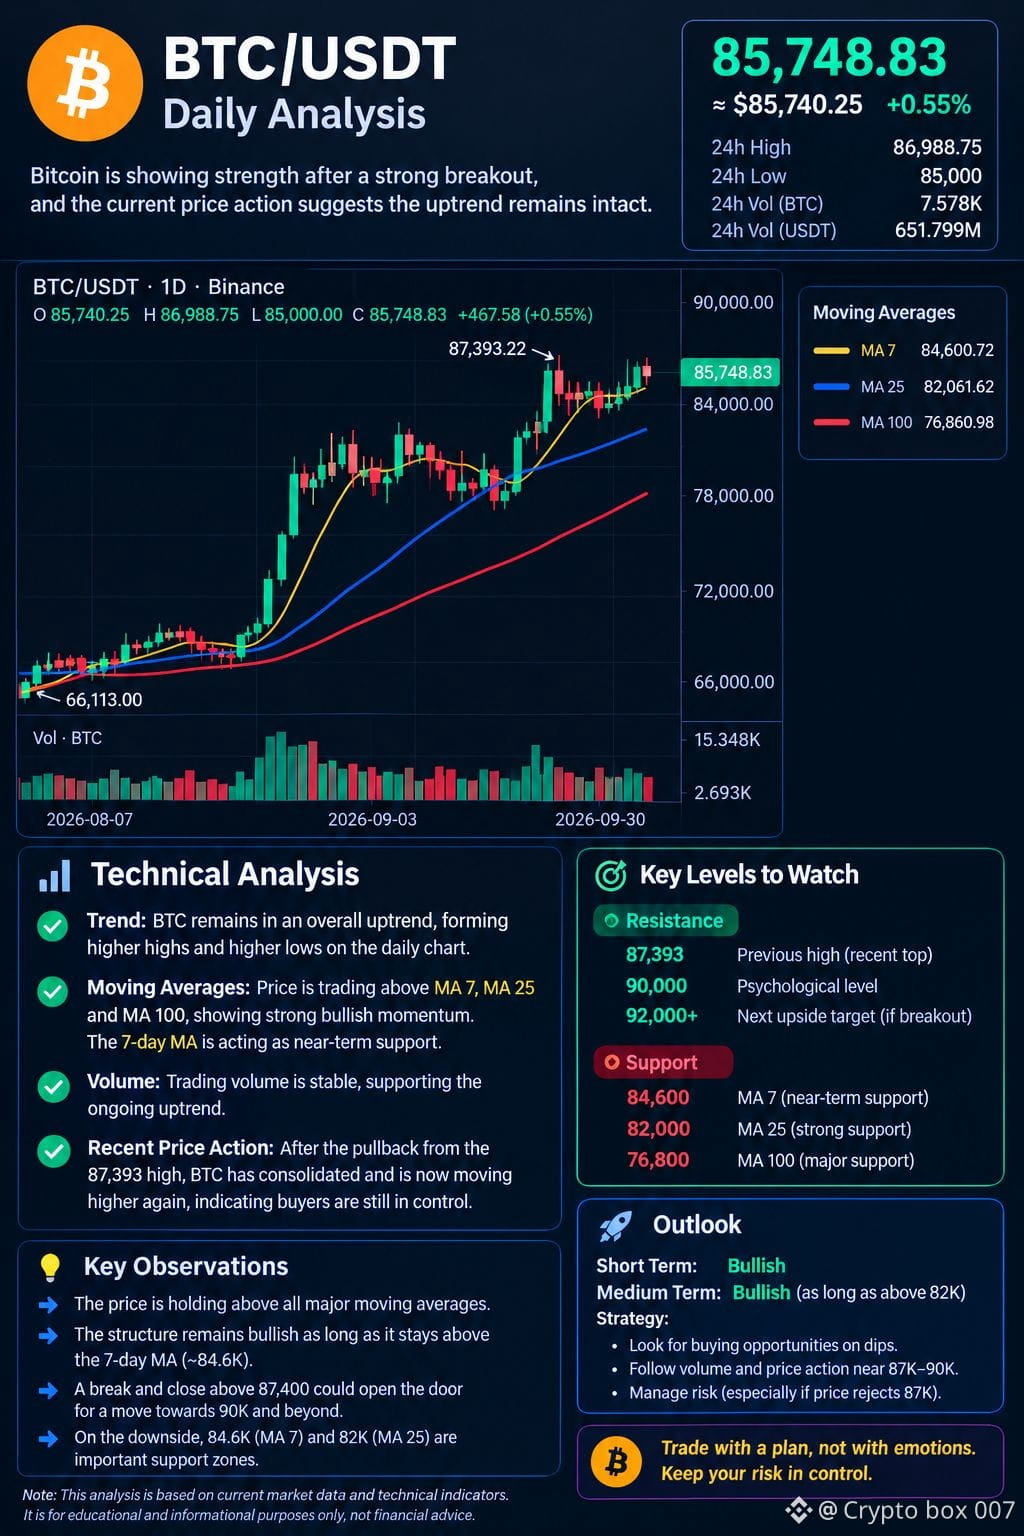
Bitcoin is currently trading near $85.75K, and the daily chart still shows a constructive bullish structure.
After the strong move from the $66K area, BTC pushed up toward $87.4K before entering a period of consolidation. Now, the price is attempting to regain upward momentum.
The key level: $87.4K
The $87,400 area is the most important resistance to watch right now.
If BTC can achieve a strong daily close above this level with increasing volume, the next major psychological target could be $90K. A successful breakout above $90K could potentially bring $92K+ into focus.
However, traders should be careful with a simple wick above resistance. A breakout followed by a rejection could turn into a false breakout.
📊 Support zones
The downside levels I am watching are:
$84.6K → Near-term support
$82K → Stronger support
$76.8K → Major support
As long as BTC maintains the $82K region, the broader bullish structure remains relatively healthy.
📈 Moving Average Perspective
BTC is currently trading above the major moving averages shown on the chart. This supports the idea that buyers still have the upper hand.
The short-term MA around $84.6K is especially important. Holding above it would keep the immediate momentum positive.
🧠 My Take
Right now, I would describe BTC as bullish but approaching resistance.
The best confirmation for another upward leg would be:
Break $87.4K → Hold above it → Retest successfully → Continue higher
If instead BTC gets rejected around $87K–$90K, a pullback toward $84.6K or $82K would not necessarily mean the bullish trend is over. It could simply be another consolidation phase.
🎯 Levels to Watch
🟢 Bullish breakout: $87.4K
🎯 Next target: $90K
🚀 Extended target: $92K+
🔴 First support: $84.6K
🛡️ Major support: $82K
⚠️ Deeper support: $76.8K
Bottom line: BTC bulls still have the advantage, but the $87.4K resistance needs to be conquered before expecting a stronger move higher.
Trade the confirmation, not the excitement. Stay patient. Stay disciplined. ₿
#DYOR
₿ BTC/USDT Daily Market Outlook
Bitcoin is currently trading near $85.75K, and the daily chart still shows a constructive bullish structure.
After the strong move from the $66K area, BTC pushed up toward $87.4K before entering a period of consolidation. Now, the price is attempting to regain upward momentum.
The key level: $87.4K
The $87,400 area is the most important resistance to watch right now.
If BTC can achieve a strong daily close above this level with increasing volume, the next major psychological target could be $90K. A successful breakout above $90K could potentially bring $92K+ into focus.
However, traders should be careful with a simple wick above resistance. A breakout followed by a rejection could turn into a false breakout.
📊 Support zones
The downside levels I am watching are:
$84.6K → Near-term support
$82K → Stronger support
$76.8K → Major support
As long as BTC maintains the $82K region, the broader bullish structure remains relatively healthy.
📈 Moving Average Perspective
BTC is currently trading above the major moving averages shown on the chart. This supports the idea that buyers still have the upper hand.
The short-term MA around $84.6K is especially important. Holding above it would keep the immediate momentum positive.
🧠 My Take
Right now, I would describe BTC as bullish but approaching resistance.
The best confirmation for another upward leg would be:
Break $87.4K → Hold above it → Retest successfully → Continue higher
If instead BTC gets rejected around $87K–$90K, a pullback toward $84.6K or $82K would not necessarily mean the bullish trend is over. It could simply be another consolidation phase.
🎯 Levels to Watch
🟢 Bullish breakout: $87.4K
🎯 Next target: $90K
🚀 Extended target: $92K+
🔴 First support: $84.6K
🛡️ Major support: $82K
⚠️ Deeper support: $76.8K
Bottom line: BTC bulls still have the advantage, but the $87.4K resistance needs to be conquered before expecting a stronger move higher.
Trade the confirmation, not the excitement. Stay patient. Stay disciplined. ₿
#DYOR
Bitcoin is currently trading near $85.75K, and the daily chart still shows a constructive bullish structure.
After the strong move from the $66K area, BTC pushed up toward $87.4K before entering a period of consolidation. Now, the price is attempting to regain upward momentum.
The key level: $87.4K
The $87,400 area is the most important resistance to watch right now.
If BTC can achieve a strong daily close above this level with increasing volume, the next major psychological target could be $90K. A successful breakout above $90K could potentially bring $92K+ into focus.
However, traders should be careful with a simple wick above resistance. A breakout followed by a rejection could turn into a false breakout.
📊 Support zones
The downside levels I am watching are:
$84.6K → Near-term support
$82K → Stronger support
$76.8K → Major support
As long as BTC maintains the $82K region, the broader bullish structure remains relatively healthy.
📈 Moving Average Perspective
BTC is currently trading above the major moving averages shown on the chart. This supports the idea that buyers still have the upper hand.
The short-term MA around $84.6K is especially important. Holding above it would keep the immediate momentum positive.
🧠 My Take
Right now, I would describe BTC as bullish but approaching resistance.
The best confirmation for another upward leg would be:
Break $87.4K → Hold above it → Retest successfully → Continue higher
If instead BTC gets rejected around $87K–$90K, a pullback toward $84.6K or $82K would not necessarily mean the bullish trend is over. It could simply be another consolidation phase.
🎯 Levels to Watch
🟢 Bullish breakout: $87.4K
🎯 Next target: $90K
🚀 Extended target: $92K+
🔴 First support: $84.6K
🛡️ Major support: $82K
⚠️ Deeper support: $76.8K
Bottom line: BTC bulls still have the advantage, but the $87.4K resistance needs to be conquered before expecting a stronger move higher.
Trade the confirmation, not the excitement. Stay patient. Stay disciplined. ₿
#DYOR
1
119
記事
Newton Protocol:次世代のWeb3を構築するNewton Protocol:次世代のWeb3を構築する
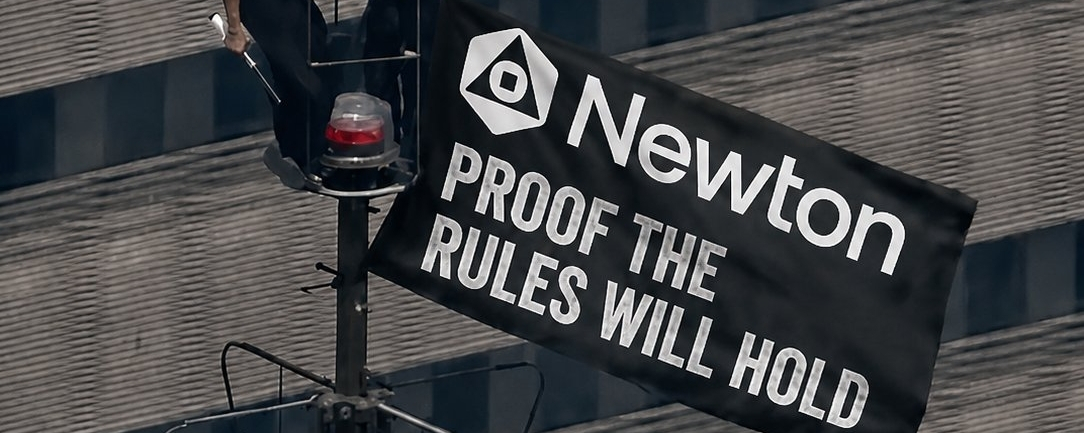
@NewtonProtocol の進展は、ブロックチェーンの革新に関心のある方にとってわくわくするものです。Newton Mainnet Beta のローンチは重要なマイルストーンであり、開発者やコミュニティメンバーが実環境でネットワークを探索しつつ、貴重なフィードバックを提供できるようになります。
成功したメインネットベータは、単なる技術リリースにとどまりません。より広範な普及に先立って、セキュリティ、安定性、ユーザー体験を改善するというプロジェクトの取り組みを示しています。エコシステムが成長するにつれ、開発者は分散型アプリケーションを構築し、新しいアイデアを試し、ネットワークの強化に貢献できます。
Newton Protocol:次世代のWeb3を構築する
Newton Protocol:次世代のWeb3を構築する
@NewtonProtocol の進展は、ブロックチェーンの革新に関心のある方にとってわくわくするものです。Newton Mainnet Beta のローンチは重要なマイルストーンであり、開発者やコミュニティメンバーが実環境でネットワークを探索しつつ、貴重なフィードバックを提供できるようになります。
成功したメインネットベータは、単なる技術リリースにとどまりません。より広範な普及に先立って、セキュリティ、安定性、ユーザー体験を改善するというプロジェクトの取り組みを示しています。エコシステムが成長するにつれ、開発者は分散型アプリケーションを構築し、新しいアイデアを試し、ネットワークの強化に貢献できます。
@NewtonProtocol の進展は、ブロックチェーンの革新に関心のある方にとってわくわくするものです。Newton Mainnet Beta のローンチは重要なマイルストーンであり、開発者やコミュニティメンバーが実環境でネットワークを探索しつつ、貴重なフィードバックを提供できるようになります。
成功したメインネットベータは、単なる技術リリースにとどまりません。より広範な普及に先立って、セキュリティ、安定性、ユーザー体験を改善するというプロジェクトの取り組みを示しています。エコシステムが成長するにつれ、開発者は分散型アプリケーションを構築し、新しいアイデアを試し、ネットワークの強化に貢献できます。
28
記事
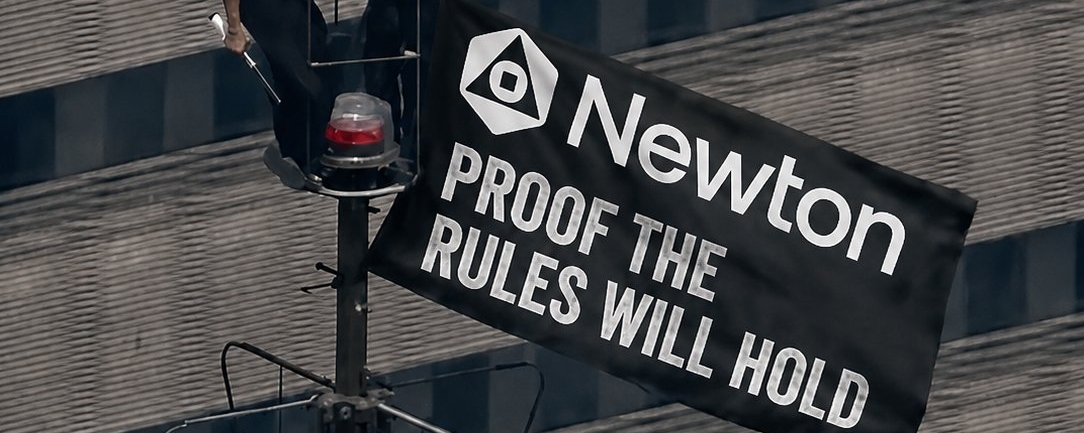
Newton Protocol:次世代Web3の構築@NewtonProtocolの進捗は、ブロックチェーンの革新に関心のある人にとってわくわくするものです。Newton Mainnet Betaのローンチは重要な節目であり、開発者やコミュニティメンバーが実環境でネットワークを探索しながら、貴重なフィードバックを提供できるようになります。
成功したメインネットベータは、単なる技術リリースにとどまりません。より広い普及に先立って、プロジェクトがセキュリティ、安定性、ユーザー体験の向上に取り組む姿勢を示すものです。エコシステムが成長するにつれて、開発者は分散型アプリケーションを構築し、新しいアイデアを試し、ネットワークをより強固にするために貢献できます。
Newton Protocol:次世代Web3の構築
@NewtonProtocolの進捗は、ブロックチェーンの革新に関心のある人にとってわくわくするものです。Newton Mainnet Betaのローンチは重要な節目であり、開発者やコミュニティメンバーが実環境でネットワークを探索しながら、貴重なフィードバックを提供できるようになります。
成功したメインネットベータは、単なる技術リリースにとどまりません。より広い普及に先立って、プロジェクトがセキュリティ、安定性、ユーザー体験の向上に取り組む姿勢を示すものです。エコシステムが成長するにつれて、開発者は分散型アプリケーションを構築し、新しいアイデアを試し、ネットワークをより強固にするために貢献できます。
成功したメインネットベータは、単なる技術リリースにとどまりません。より広い普及に先立って、プロジェクトがセキュリティ、安定性、ユーザー体験の向上に取り組む姿勢を示すものです。エコシステムが成長するにつれて、開発者は分散型アプリケーションを構築し、新しいアイデアを試し、ネットワークをより強固にするために貢献できます。
41
記事
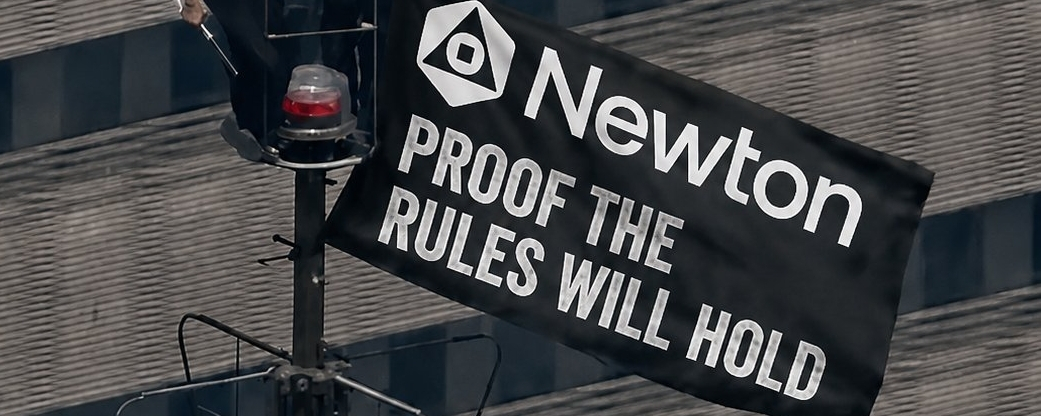
Newton Protocol メインネットベータ:Web3の未来に向けた大きな一歩Newton Protocol:次世代のWeb3を構築する
@NewtonProtocol の進展は、ブロックチェーンの革新に関心のあるすべての人にとって刺激的です。Newton メインネットベータのローンチは重要な節目であり、開発者やコミュニティメンバーが、貴重なフィードバックを提供しながら、実際の環境でネットワークを探ることを可能にします。
成功したメインネットベータは、単なる技術リリースにとどまりません。より広い普及の前に、セキュリティ、安定性、そしてユーザー体験の向上に取り組むプロジェクトの姿勢を示しています。エコシステムが成長するにつれ、開発者は分散型アプリケーションを構築し、新しいアイデアを試し、ネットワークの強化に貢献できるようになります。
Newton Protocol メインネットベータ:Web3の未来に向けた大きな一歩
Newton Protocol:次世代のWeb3を構築する
@NewtonProtocol の進展は、ブロックチェーンの革新に関心のあるすべての人にとって刺激的です。Newton メインネットベータのローンチは重要な節目であり、開発者やコミュニティメンバーが、貴重なフィードバックを提供しながら、実際の環境でネットワークを探ることを可能にします。
成功したメインネットベータは、単なる技術リリースにとどまりません。より広い普及の前に、セキュリティ、安定性、そしてユーザー体験の向上に取り組むプロジェクトの姿勢を示しています。エコシステムが成長するにつれ、開発者は分散型アプリケーションを構築し、新しいアイデアを試し、ネットワークの強化に貢献できるようになります。
@NewtonProtocol の進展は、ブロックチェーンの革新に関心のあるすべての人にとって刺激的です。Newton メインネットベータのローンチは重要な節目であり、開発者やコミュニティメンバーが、貴重なフィードバックを提供しながら、実際の環境でネットワークを探ることを可能にします。
成功したメインネットベータは、単なる技術リリースにとどまりません。より広い普及の前に、セキュリティ、安定性、そしてユーザー体験の向上に取り組むプロジェクトの姿勢を示しています。エコシステムが成長するにつれ、開発者は分散型アプリケーションを構築し、新しいアイデアを試し、ネットワークの強化に貢献できるようになります。
57
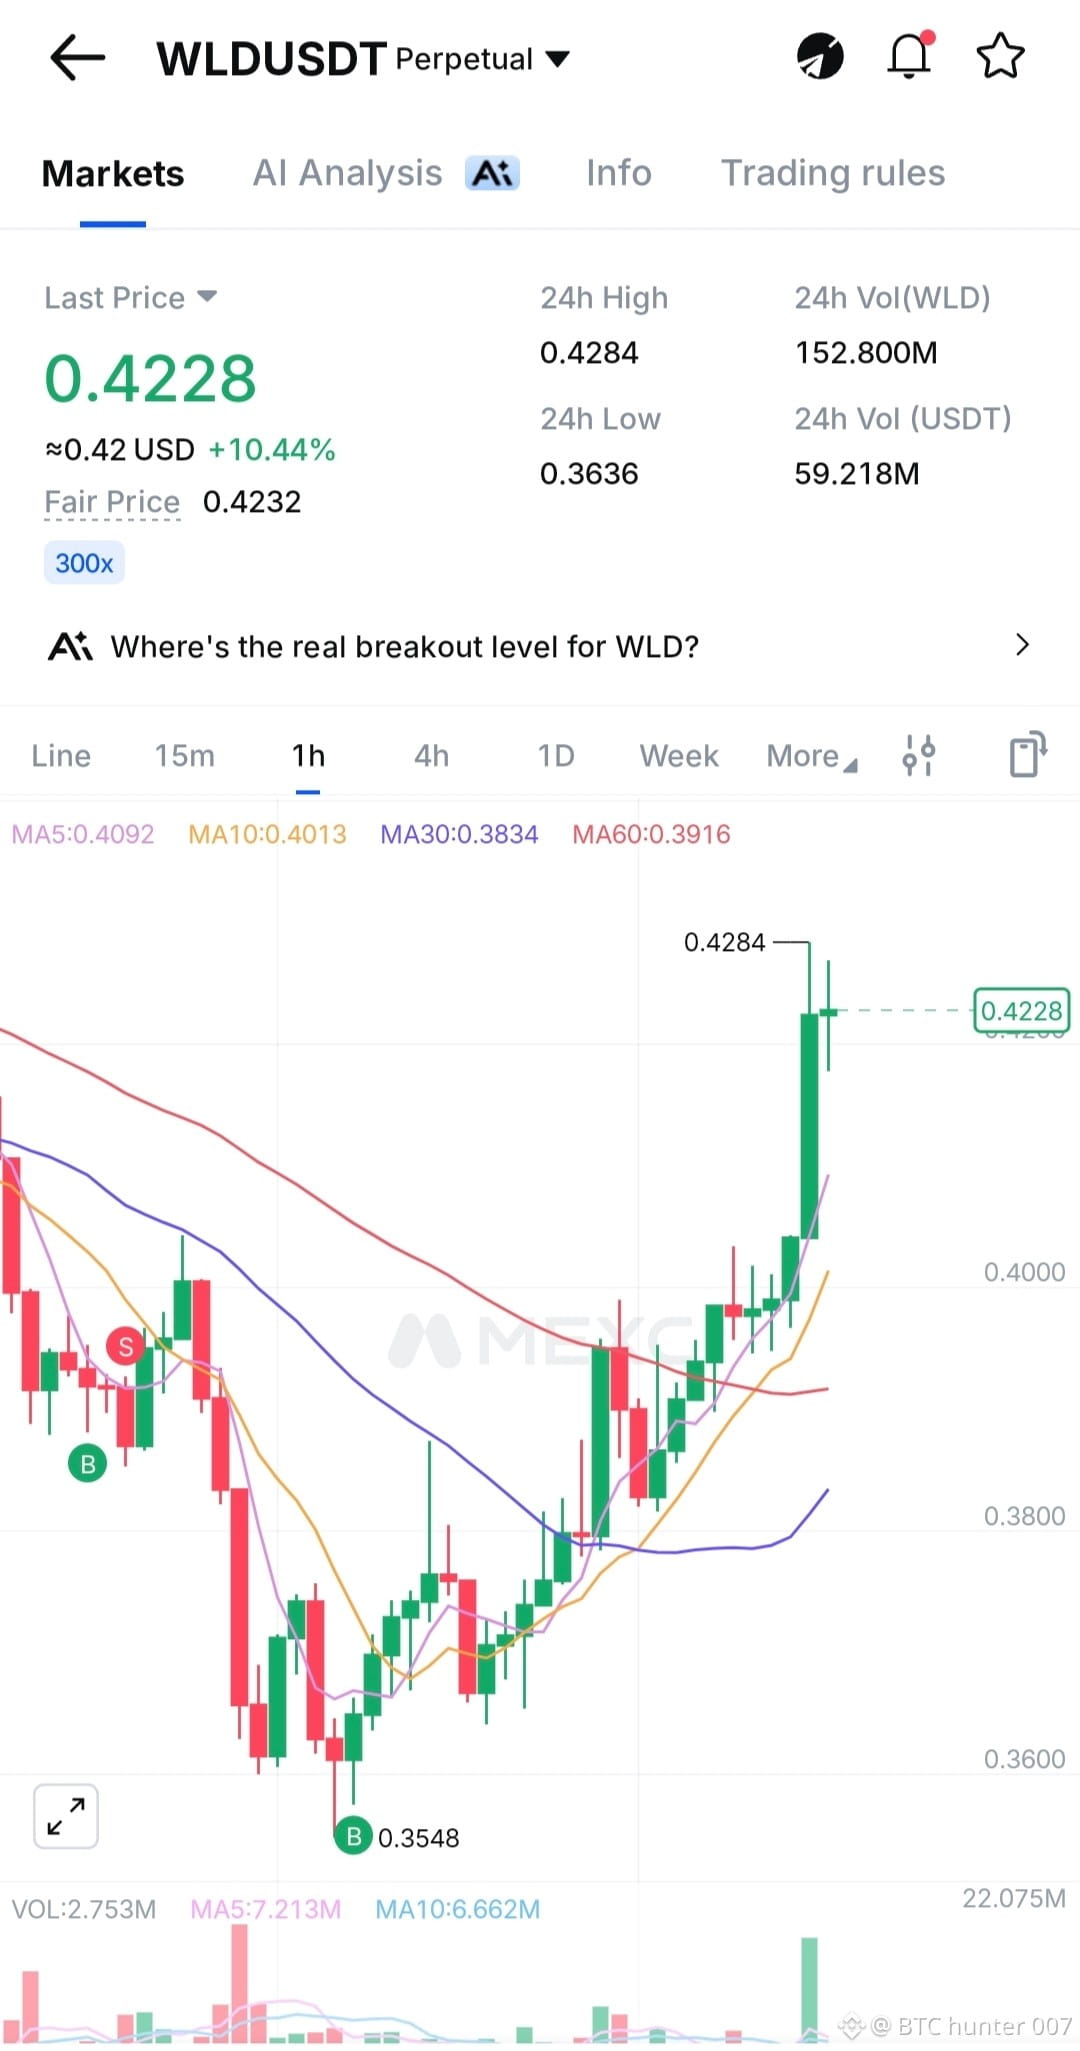
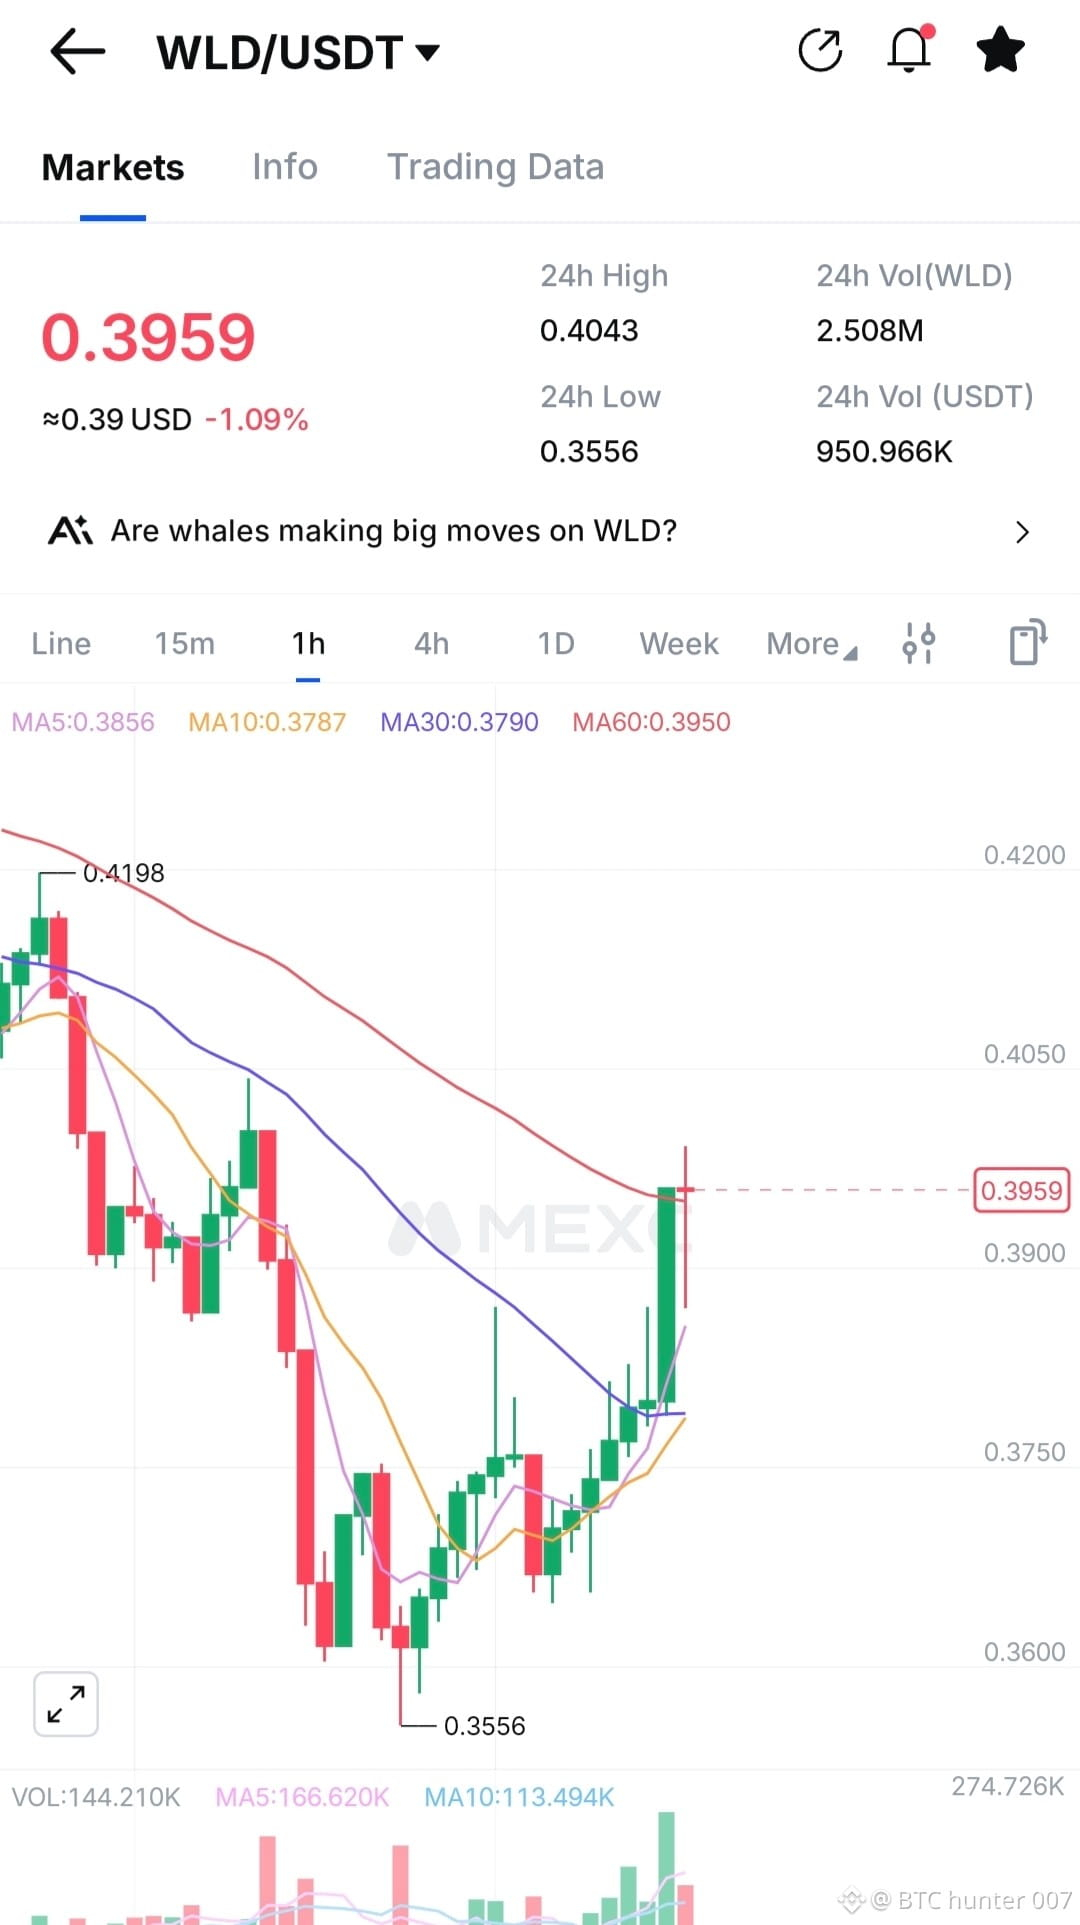
@NewtonProtocol の進捗を見るのが楽しみです!Newton Mainnet Beta は、よりスケーラブルで分散化されたエコシステムを構築するための重要なステップです。新機能の探索、コミュニティの成長、そして Web3 イノベーションの未来に期待しています。$NEWT #Newt
@NewtonProtocol の進捗を見るのが楽しみです!Newton Mainnet Beta は、よりスケーラブルで分散化されたエコシステムを構築するための重要なステップです。新機能の探索、コミュニティの成長、そして Web3 イノベーションの未来に期待しています。$NEWT #Newt
1
1
69
·
--
弱気相場
87

記事
BTCテクニカル分析 BTC/USDTテクニカル分析:注目すべきクリティカルレベル!🚨
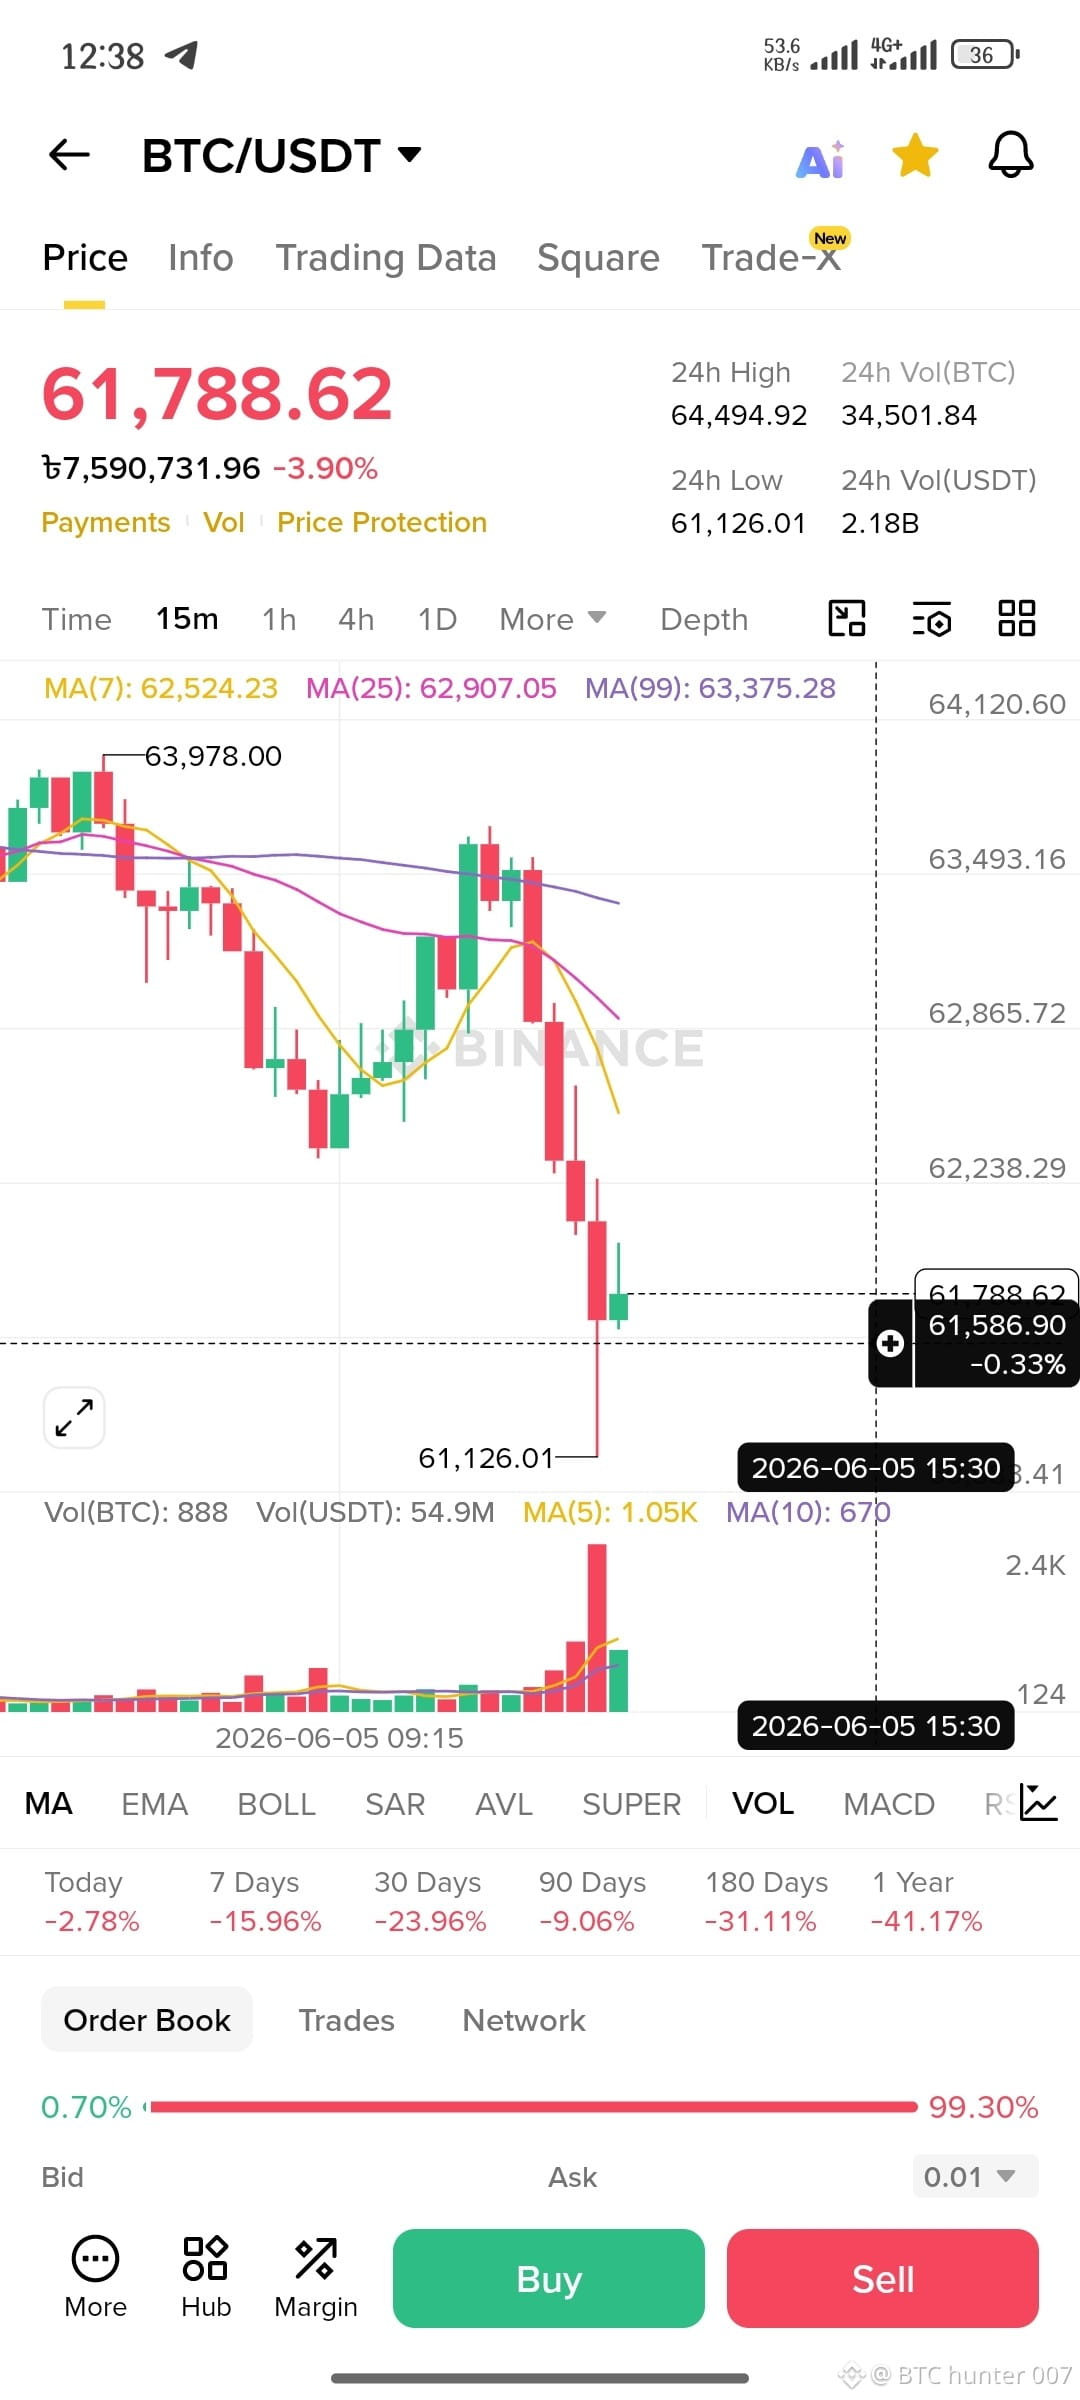
ビットコインの3Dチャートは、現在、上層からの急激な拒否の後に強いベアリッシュ構造を示しています。現在の価格アクション周辺の$61,364に基づいた主要なサポートとレジスタンスゾーンのブレイクダウンは以下の通りです:
🛑 レジスタンスゾーン(拒否レベル)
主要レジスタンス(心理的拒否):$100,000
これは依然として巨大な心理的およびテクニカルバリアです。チャートは、このゾーン周辺での強い拒否構造の整合性を示しており、長期的なブルたちが奪還すべき主要なターゲットとなっています。
BTCテクニカル分析
BTC/USDTテクニカル分析:注目すべきクリティカルレベル!🚨
ビットコインの3Dチャートは、現在、上層からの急激な拒否の後に強いベアリッシュ構造を示しています。現在の価格アクション周辺の$61,364に基づいた主要なサポートとレジスタンスゾーンのブレイクダウンは以下の通りです:
🛑 レジスタンスゾーン(拒否レベル)
主要レジスタンス(心理的拒否):$100,000
これは依然として巨大な心理的およびテクニカルバリアです。チャートは、このゾーン周辺での強い拒否構造の整合性を示しており、長期的なブルたちが奪還すべき主要なターゲットとなっています。
ビットコインの3Dチャートは、現在、上層からの急激な拒否の後に強いベアリッシュ構造を示しています。現在の価格アクション周辺の$61,364に基づいた主要なサポートとレジスタンスゾーンのブレイクダウンは以下の通りです:
🛑 レジスタンスゾーン(拒否レベル)
主要レジスタンス(心理的拒否):$100,000
これは依然として巨大な心理的およびテクニカルバリアです。チャートは、このゾーン周辺での強い拒否構造の整合性を示しており、長期的なブルたちが奪還すべき主要なターゲットとなっています。
107
53
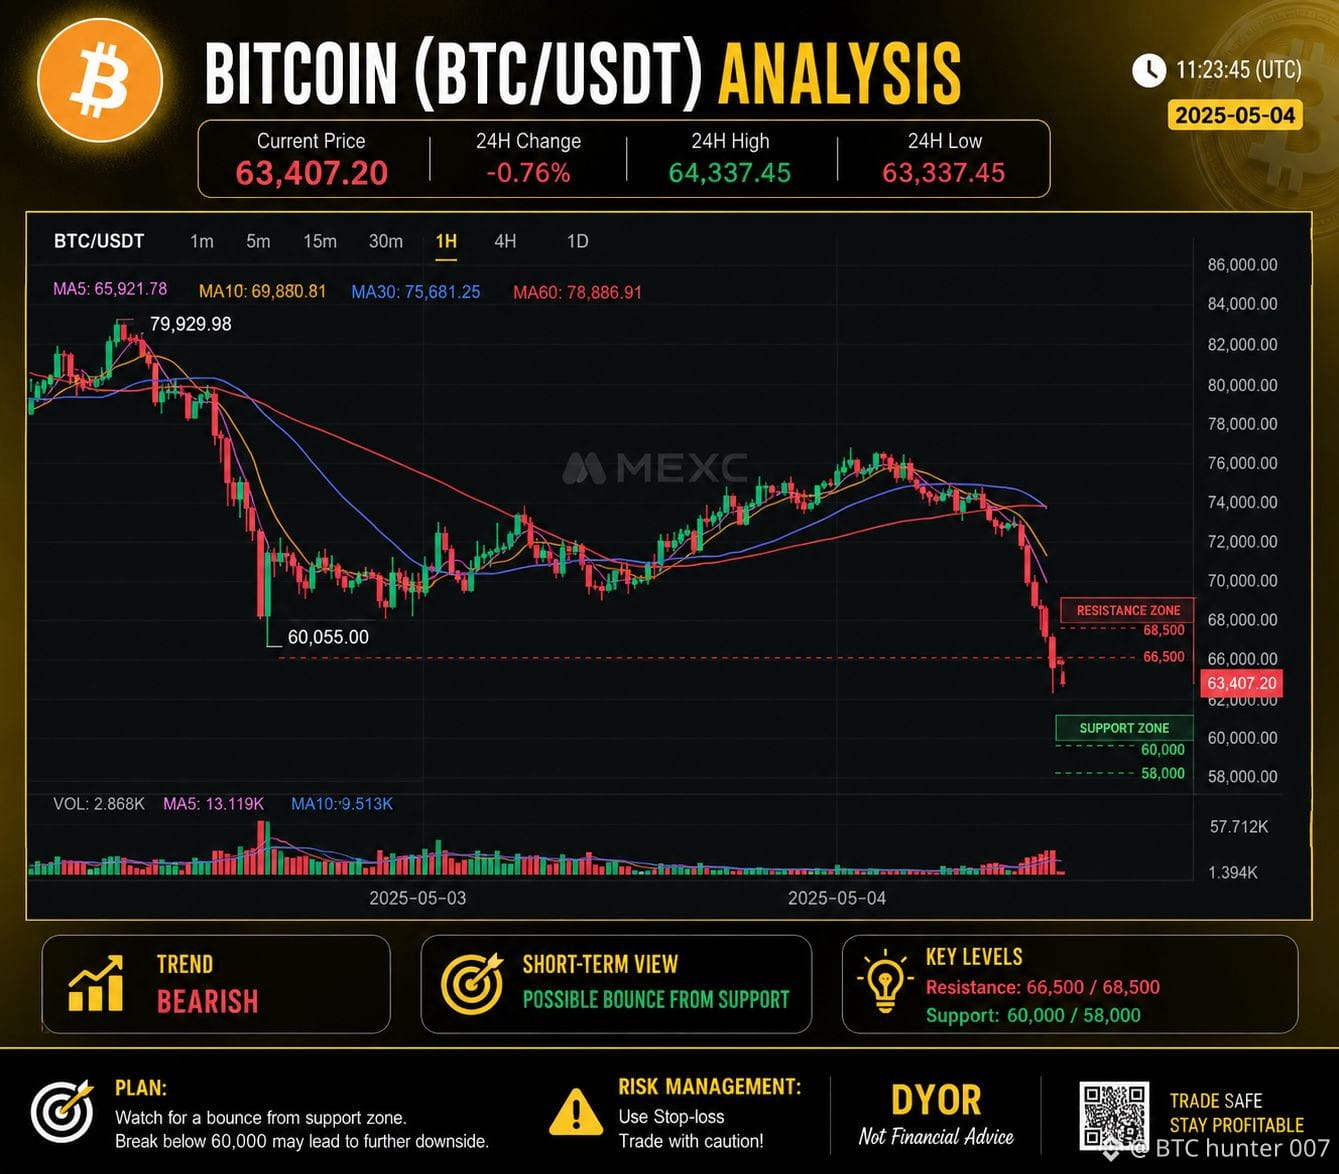
BTC/USDT アップデート
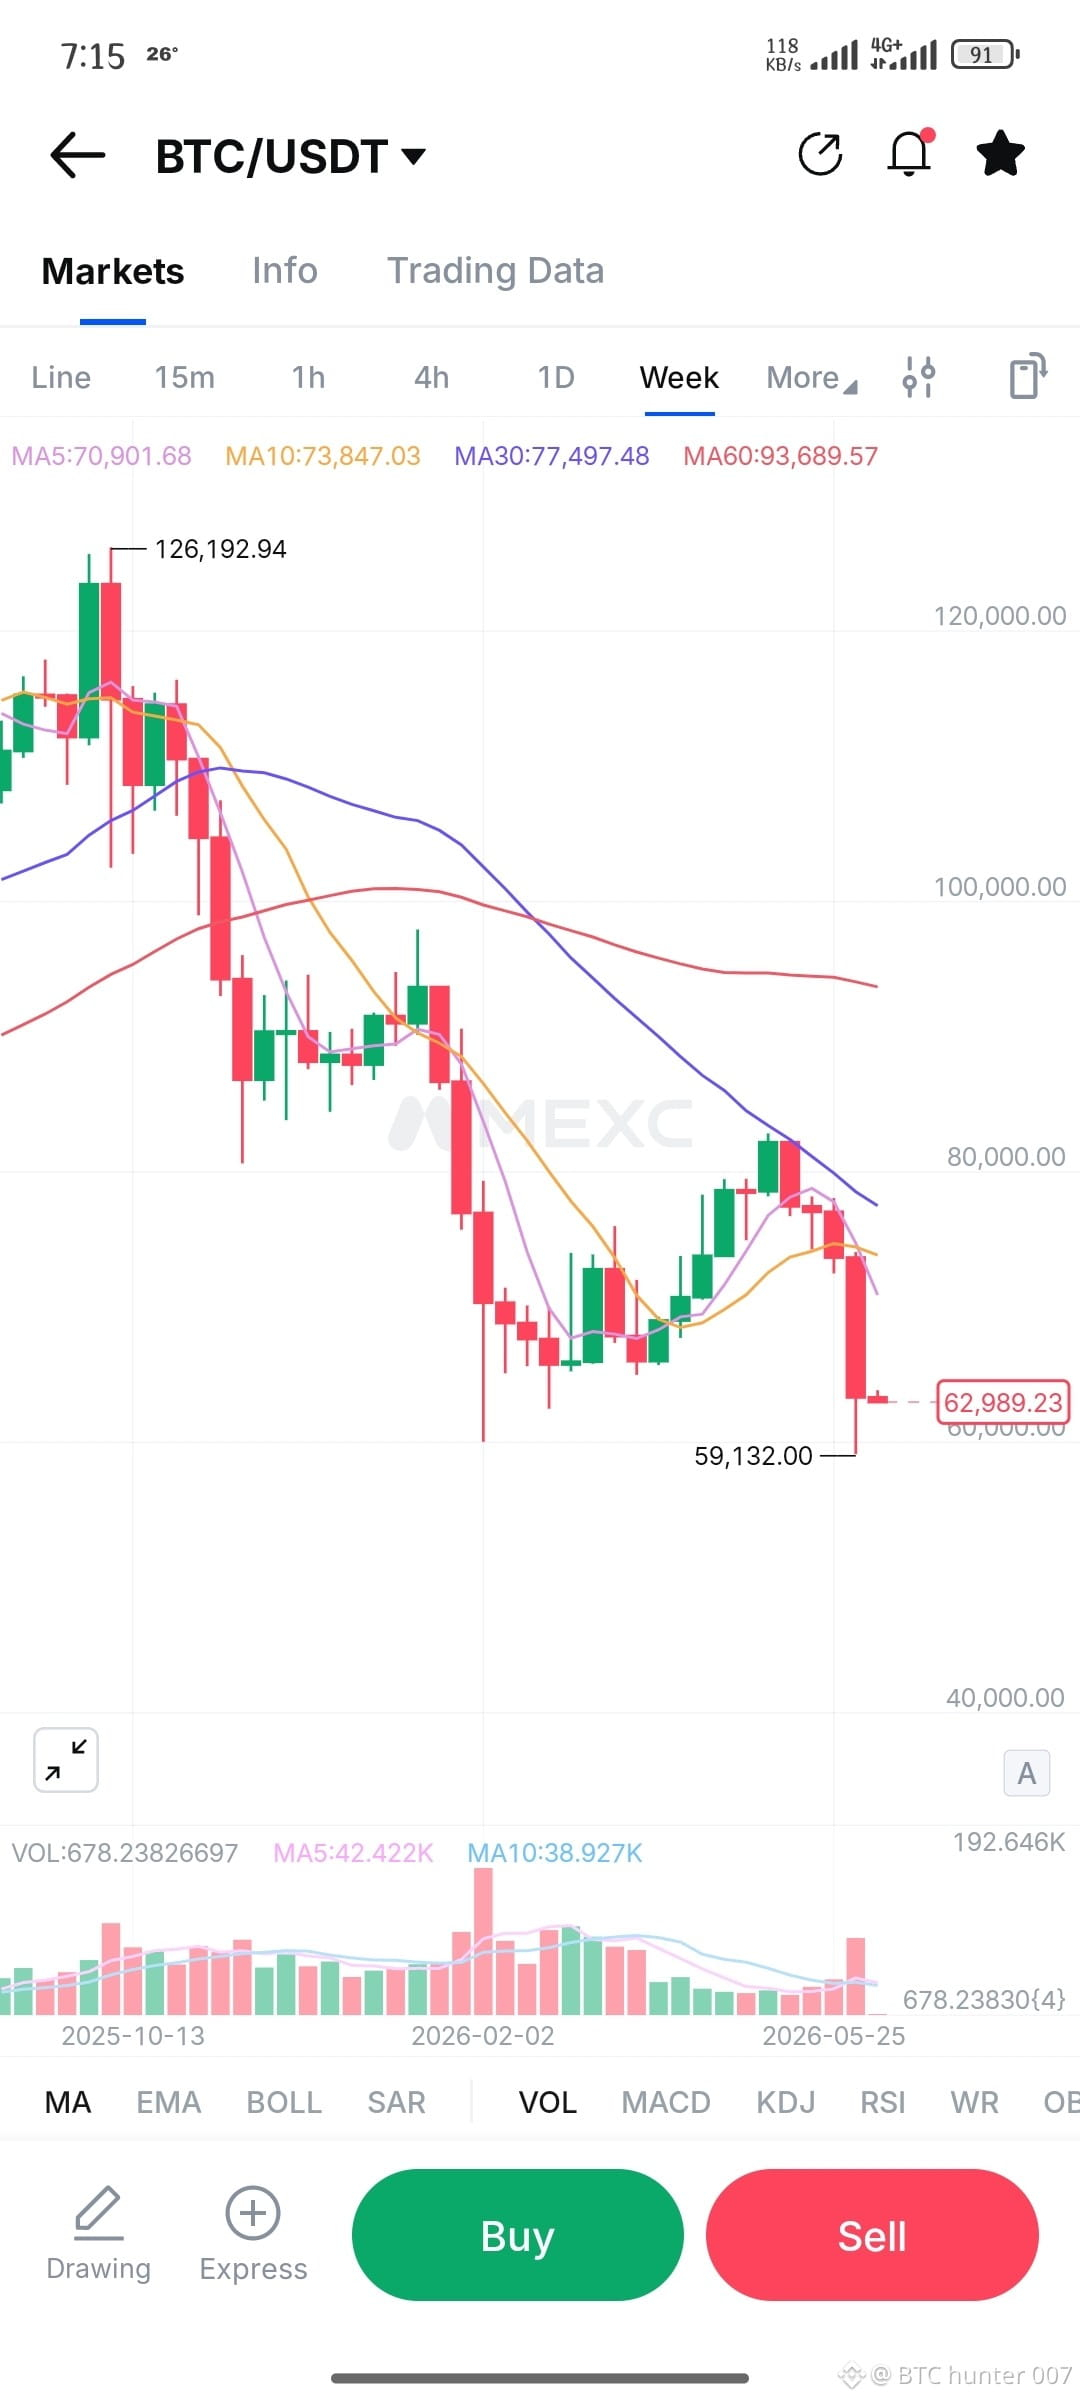
ビットコインは強いベアマーケットの動きの後、約$63.4Kで取引中。
🟢 サポート: $60K - $58K
🔴 レジスタンス: $66.5K - $68.5K
BTCがレジスタンスゾーンの下に留まる限り、トレンドはベアです。サポートからの反発は可能ですが、$60Kを失うとさらなる下落を引き起こすかもしれません。
反応を注意深く観察し、リスクを管理してください。
DYOR。NFA。
$BTC #trading #cryptooinsigts
BTC/USDT アップデート
ビットコインは強いベアマーケットの動きの後、約$63.4Kで取引中。
🟢 サポート: $60K - $58K
🔴 レジスタンス: $66.5K - $68.5K
BTCがレジスタンスゾーンの下に留まる限り、トレンドはベアです。サポートからの反発は可能ですが、$60Kを失うとさらなる下落を引き起こすかもしれません。
反応を注意深く観察し、リスクを管理してください。
DYOR。NFA。
$BTC #trading #cryptooinsigts
ビットコインは強いベアマーケットの動きの後、約$63.4Kで取引中。
🟢 サポート: $60K - $58K
🔴 レジスタンス: $66.5K - $68.5K
BTCがレジスタンスゾーンの下に留まる限り、トレンドはベアです。サポートからの反発は可能ですが、$60Kを失うとさらなる下落を引き起こすかもしれません。
反応を注意深く観察し、リスクを管理してください。
DYOR。NFA。
$BTC #trading #cryptooinsigts
1
40
·
--
ブリッシュ
ブル(上昇トレンド): 今日、ブラックロックが4730万ドル相当のビットコインを購入しました。
$BTC
ブル(上昇トレンド): 今日、ブラックロックが4730万ドル相当のビットコインを購入しました。
$BTC
$BTC

1
131
SOL/USDT テクニカル分析
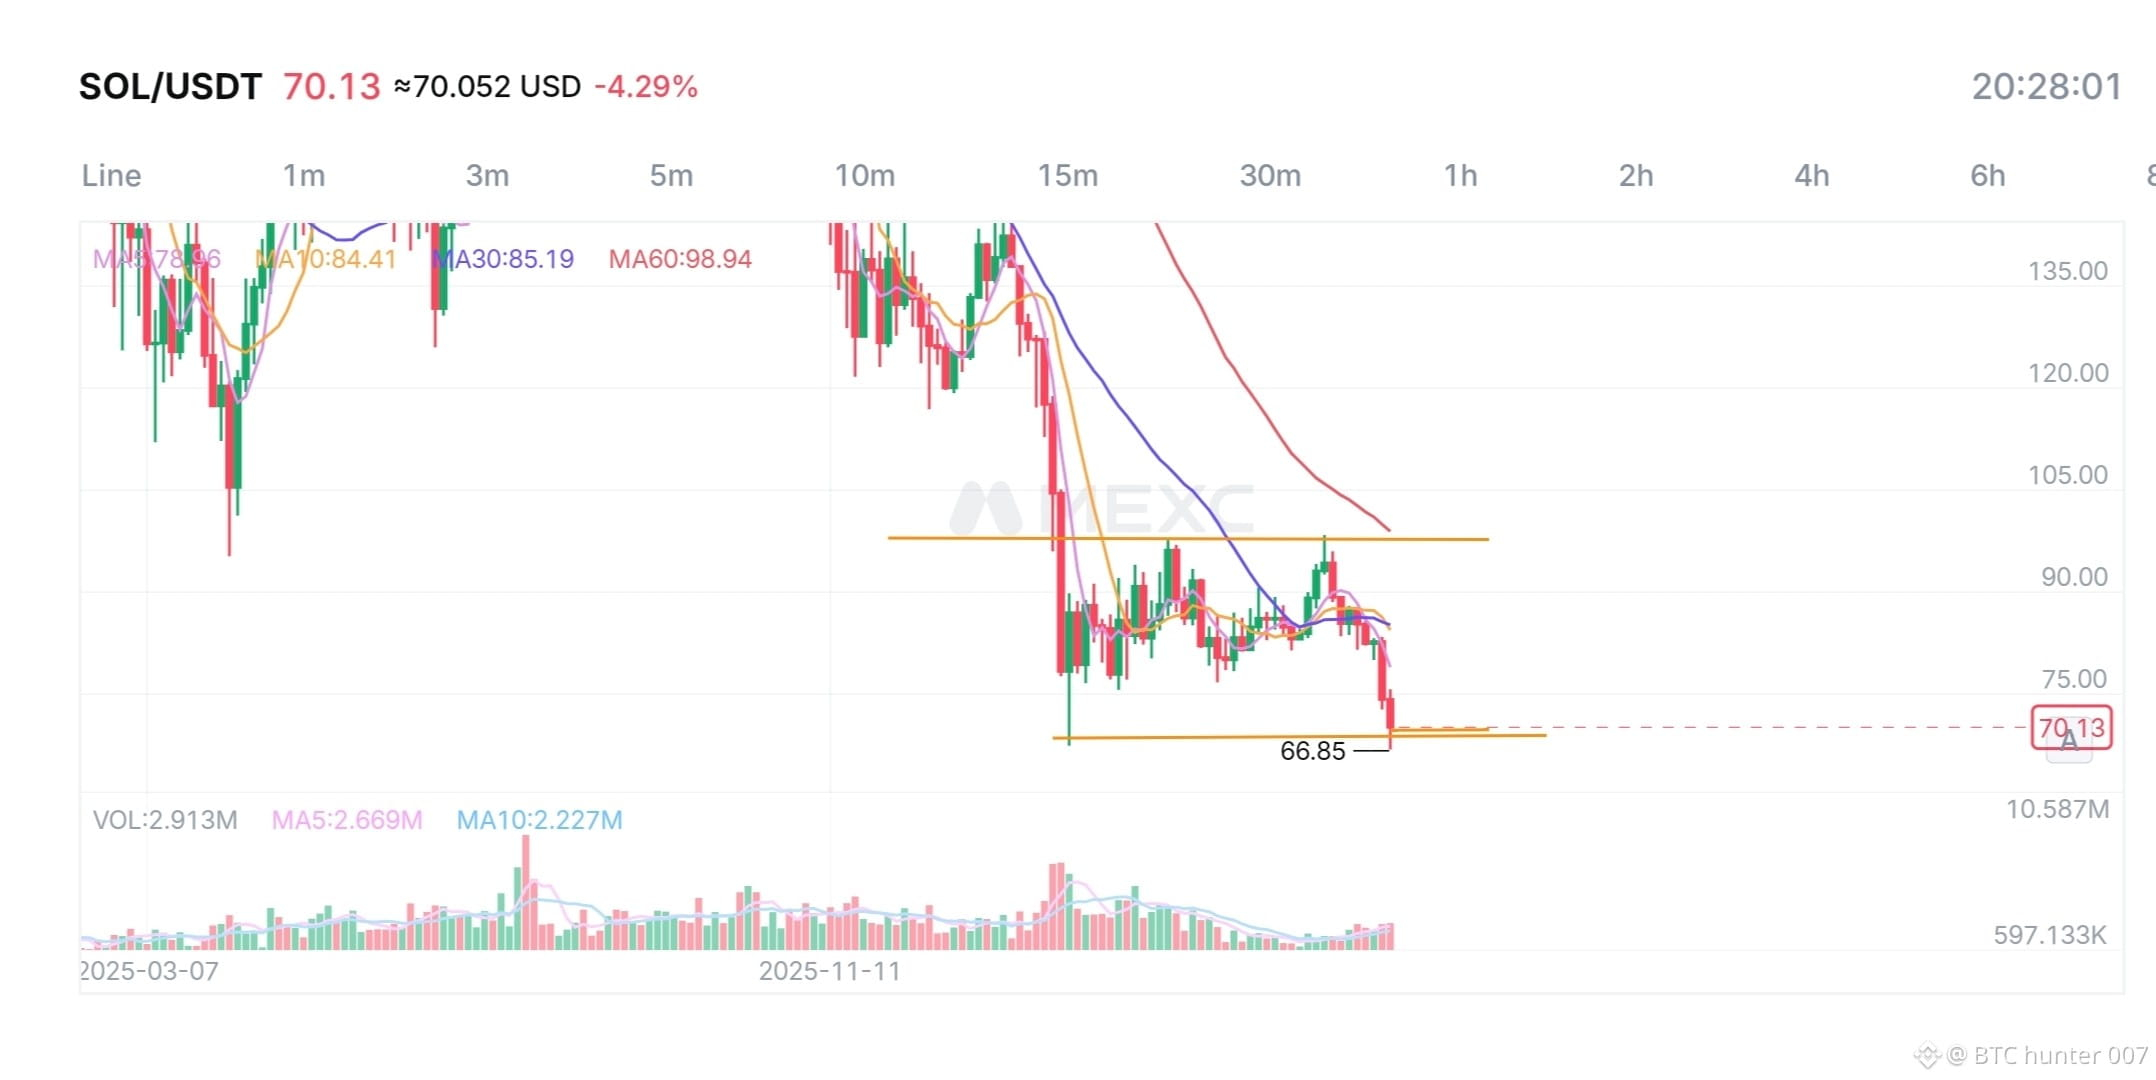
$SOL は現在$70エリアで取引中で、$66.8-$68付近の非常に重要なサポートゾーンをテストしています。
• 主要サポート: $66.8 - $68 • 次のサポート: $60 - $62 • 主要レジスタンス: $90 - $95 • 強いレジスタンス: $100 - $105
テクニカルな観点から見ると、SOLは主要な移動平均線の下で取引されているため、ベアリッシュな構造を維持しています。市場は$90-$95のレジスタンスゾーンを突破できず、売り手が依然としてコントロールを持っていることを示しています。
ブルシナリオ: SOLが現在のサポートを守ることができれば、$80-$90へのリリーフラリーが発生する可能性があり、$95が最初の主要なハードルとなります。
ベアシナリオ: $66.8以下の確定的なブレイクダウンは、$60-$62に向けてさらなる下落を引き起こす可能性があります。全体的な暗号市場のセンチメントが弱まると、$50-$55エリアへの拡張も排除できません。
今のところ、忍耐がカギです。主要なレジスタンスレベルの明確な回復が必要で、長期的なトレンドの反転を確認するためには重要です。
免責事項
{future}(SOLUSDT)
: 金融アドバイスではありません。常に自分で調査(DYOR)し、リスクを管理してください。
SOL/USDT テクニカル分析
$SOL は現在$70エリアで取引中で、$66.8-$68付近の非常に重要なサポートゾーンをテストしています。
• 主要サポート: $66.8 - $68 • 次のサポート: $60 - $62 • 主要レジスタンス: $90 - $95 • 強いレジスタンス: $100 - $105
テクニカルな観点から見ると、SOLは主要な移動平均線の下で取引されているため、ベアリッシュな構造を維持しています。市場は$90-$95のレジスタンスゾーンを突破できず、売り手が依然としてコントロールを持っていることを示しています。
ブルシナリオ: SOLが現在のサポートを守ることができれば、$80-$90へのリリーフラリーが発生する可能性があり、$95が最初の主要なハードルとなります。
ベアシナリオ: $66.8以下の確定的なブレイクダウンは、$60-$62に向けてさらなる下落を引き起こす可能性があります。全体的な暗号市場のセンチメントが弱まると、$50-$55エリアへの拡張も排除できません。
今のところ、忍耐がカギです。主要なレジスタンスレベルの明確な回復が必要で、長期的なトレンドの反転を確認するためには重要です。
免責事項
: 金融アドバイスではありません。常に自分で調査(DYOR)し、リスクを管理してください。
$SOL は現在$70エリアで取引中で、$66.8-$68付近の非常に重要なサポートゾーンをテストしています。
• 主要サポート: $66.8 - $68 • 次のサポート: $60 - $62 • 主要レジスタンス: $90 - $95 • 強いレジスタンス: $100 - $105
テクニカルな観点から見ると、SOLは主要な移動平均線の下で取引されているため、ベアリッシュな構造を維持しています。市場は$90-$95のレジスタンスゾーンを突破できず、売り手が依然としてコントロールを持っていることを示しています。
ブルシナリオ: SOLが現在のサポートを守ることができれば、$80-$90へのリリーフラリーが発生する可能性があり、$95が最初の主要なハードルとなります。
ベアシナリオ: $66.8以下の確定的なブレイクダウンは、$60-$62に向けてさらなる下落を引き起こす可能性があります。全体的な暗号市場のセンチメントが弱まると、$50-$55エリアへの拡張も排除できません。
今のところ、忍耐がカギです。主要なレジスタンスレベルの明確な回復が必要で、長期的なトレンドの反転を確認するためには重要です。
免責事項
: 金融アドバイスではありません。常に自分で調査(DYOR)し、リスクを管理してください。
50

·
--
弱気相場
速報:ブラックロックに関連するETFが約3億4234万ドル相当のビットコインを移動させたとの市場の更新があります。
$BTC
最新情報をフォローしてください
速報:ブラックロックに関連するETFが約3億4234万ドル相当のビットコインを移動させたとの市場の更新があります。
$BTC
最新情報をフォローしてください
$BTC
最新情報をフォローしてください
1
70
ログインして、さらにコンテンツを読む
厳選トピックで世界の暗号資産トレーダーの仲間入り
⚡️ 暗号資産に関する最新かつ有益な情報が見つかります。
💬 世界最大の暗号資産取引所から信頼されています。
👍 認証を受けたクリエイターから、有益なインサイトを得られます。
メール / 電話番号
トレンドトピック
BinanceLaunchesBinanceIntelligence
閲覧回数 430,542
3,159人が討論中
#BinanceLaunchesBinanceIntelligence
⚡ AIと暗号資産取引が融合:Binance Intelligenceが稼働開始!⚡
Binanceの新しいAIスイートで、取引が大きく進化しました:
1️⃣ Binance AI:パーソナライズされた市場ダッシュボードと、4時間ごとのマクロ市場音声ブリーフィング。
2️⃣ Binance AI Pro:自然な言葉で指示するだけで、自動売買戦略を構築・実行。
3️⃣ Binance Agent OS:自律型金融AIエージェント向けの開発者フレームワーク。
戦略を説明 ➔ ペーパーテスト ➔ 24時間365日実行。
AIを活用して、次の取引戦略を作っていますか?ぜひ下のコメント欄で教えてください!👇
#BinanceLaunchesBinanceIntelligence #BinanceSquare #CryptoAI #Trading $EDEN
Hazi BNB
·いいね:1件
·閲覧回数 954
BitcoinTargets2026OpenAt$87570
閲覧回数 2,721
79人が討論中
BitcoinRejectedAt$87KThirdTime
閲覧回数 2,627
66人が討論中