BTC LIQUIDATION HEATMAP: Where Is Bitcoin Heading Next?
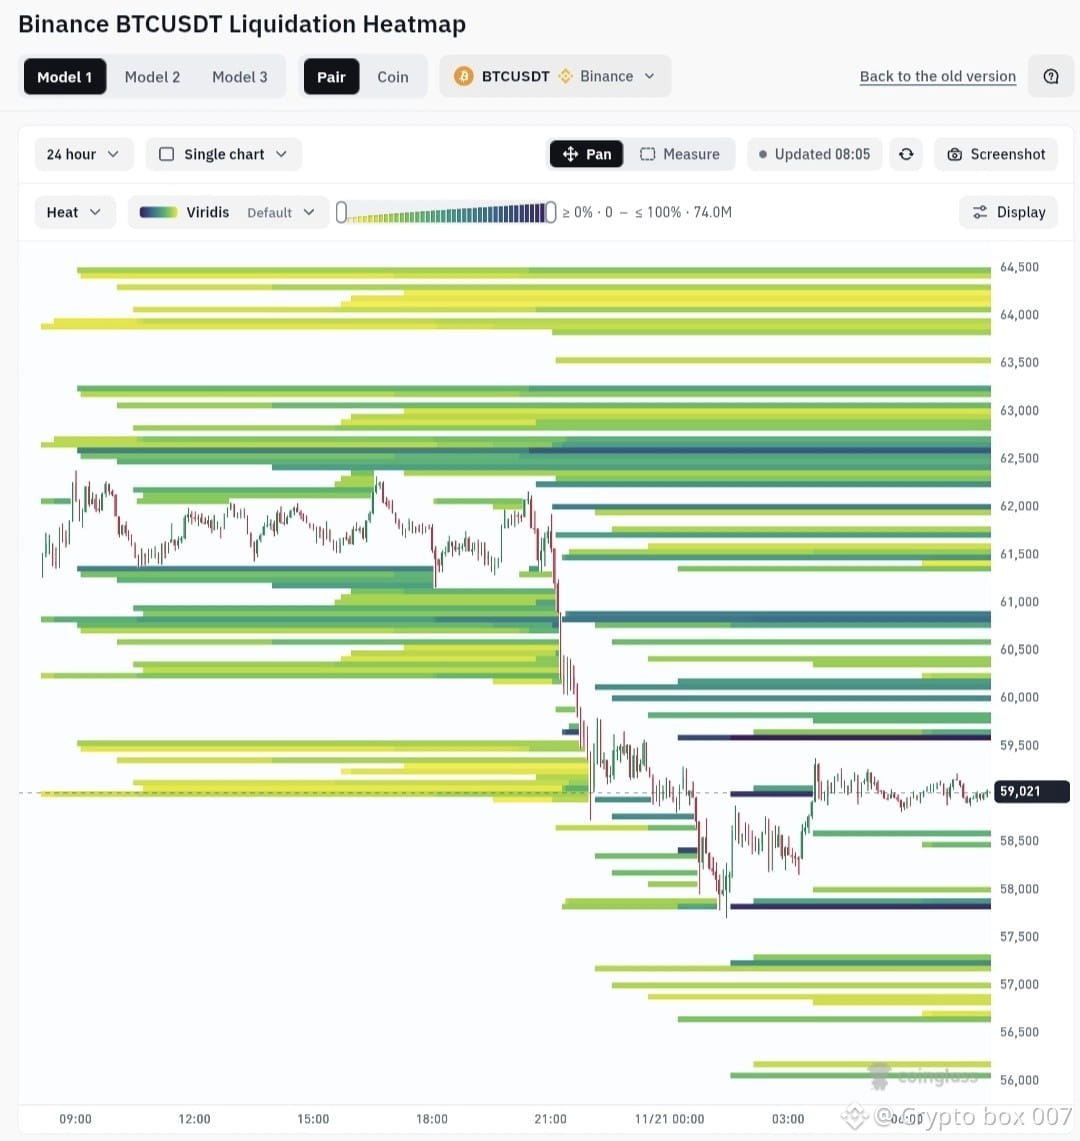
Bitcoin is currently trading around $59,021, and the latest Coinglass Liquidation Heatmap reveals several important liquidity zones on both sides of the market.
Let's break down the key levels.
🔴 1. Liquidity Above Current Price (Short Liquidations)
Potential upside liquidity targets:
$59,586: $74.0M
$60,823: $45.6M
$62,000: $39.1M
$62,589: $52.0M
The $59,586 zone stands out with approximately $74 million in potential short liquidations. A move into this area could trigger a short squeeze and accelerate upward momentum.
🟢 2. Liquidity Below Current Price (Long Liquidations)
Potential downside liquidity targets:
$58,585: $20.6M
$57,820: $66.8M
$57,231: $33.4M
$56,643: $14.3M
The most significant downside liquidity cluster is around $57,820, with approximately $66.8 million in potential long liquidations.
📊 3. Key Levels to Watch
Three levels deserve particular attention:
$59,586: Immediate upside liquidity target.
$58,585: Important near-term downside level.
$57,820: Major long liquidation cluster.
🚀 4. Two Possible Scenarios
Bullish Scenario: If BTC holds above $59,000 and successfully breaks $59,586, the next potential targets are $60,000–$60,823.
Bearish Scenario: If BTC loses the $58,585 level, downside liquidity around $57,820 could become the next area of interest.
My Take
Bitcoin is sitting between significant liquidity clusters. The next move could be driven by whichever side of the market gets targeted first.
However, remember that liquidation heatmaps show potential liquidity concentrations, not guaranteed price targets. Always wait for confirmation before entering a trade.
Trade smart. Manage your risk. Don't chase the market.
#bitcoin #BTC #crypto #LiquidationHeatmap #TradingSignals $BTC
Bitcoin is currently trading around $59,021, and the latest Coinglass Liquidation Heatmap reveals several important liquidity zones on both sides of the market.
Let's break down the key levels.
🔴 1. Liquidity Above Current Price (Short Liquidations)
Potential upside liquidity targets:
$59,586: $74.0M
$60,823: $45.6M
$62,000: $39.1M
$62,589: $52.0M
The $59,586 zone stands out with approximately $74 million in potential short liquidations. A move into this area could trigger a short squeeze and accelerate upward momentum.
🟢 2. Liquidity Below Current Price (Long Liquidations)
Potential downside liquidity targets:
$58,585: $20.6M
$57,820: $66.8M
$57,231: $33.4M
$56,643: $14.3M
The most significant downside liquidity cluster is around $57,820, with approximately $66.8 million in potential long liquidations.
📊 3. Key Levels to Watch
Three levels deserve particular attention:
$59,586: Immediate upside liquidity target.
$58,585: Important near-term downside level.
$57,820: Major long liquidation cluster.
🚀 4. Two Possible Scenarios
Bullish Scenario: If BTC holds above $59,000 and successfully breaks $59,586, the next potential targets are $60,000–$60,823.
Bearish Scenario: If BTC loses the $58,585 level, downside liquidity around $57,820 could become the next area of interest.
My Take
Bitcoin is sitting between significant liquidity clusters. The next move could be driven by whichever side of the market gets targeted first.
However, remember that liquidation heatmaps show potential liquidity concentrations, not guaranteed price targets. Always wait for confirmation before entering a trade.
Trade smart. Manage your risk. Don't chase the market.
#bitcoin #BTC #crypto #LiquidationHeatmap #TradingSignals $BTC