
asiftahsin
2.3k 投稿

asiftahsin
報告
ユーザーをブロック
Share Crypto Related Market Analysis, Share Crypto Related knowledge for my follower(brother and Sister)
32 フォロー
335 フォロワー
1.3K+ いいね
投稿
すべて
引用
·
--
記事
翻訳参照
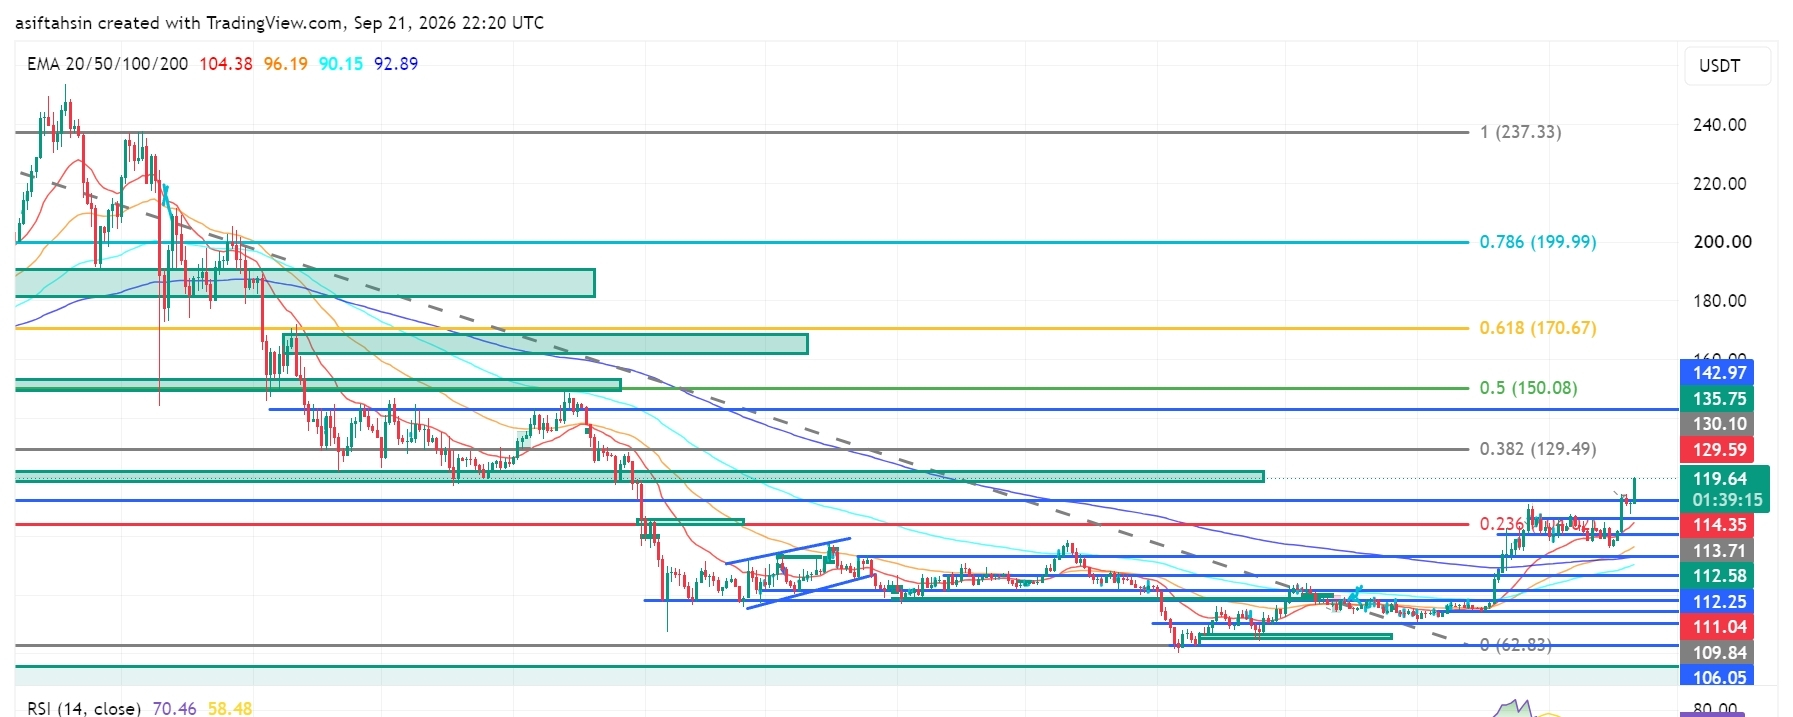
SOL Technical Outlook: Solana Pushes Toward $120 as Breakout Structure StrengthensSOL is currently trading around $119.61, holding well above the $112–$114 region after a strong recovery from the $104–$110 support zone.
The broader structure has improved significantly, with SOL reclaiming the $110–$114 area and now testing the $119–$120 resistance zone. A sustained breakout above this region would bring the higher Fibonacci levels back into focus.
📈 EMA Structure
20 EMA: $104.38
50 EMA: $96.19
100 EMA: $90.15
200 EMA: $92.89
SOL is trading significantly above all four major EMAs.
The 20 EMA remains above the 50 EMA, while the 50 EMA is also above the 200 EMA. This alignment reflects a strong recovery structure and improving medium-term trend.
The $104–$106 region is now an important deeper support zone, while the $110–$114 area has developed into a key structural support region after the recent breakout.
📐 Fibonacci Levels
0.236: $114.35
0.382: $129.49
0.5: $150.08
0.618: $170.67
0.786: $199.99
1.0: $237.33
SOL has reclaimed the 0.236 Fibonacci level around $114.35 and is now trading above it.
The next major Fibonacci resistance is $129.49, followed by $150.08.
🟢 Bullish Scenario
Immediate resistance is around:
$119.61 → $120
A clean breakout and sustained close above the $119–$120 zone could open the path toward:
$129.49 → $135.75 → $142.97 → $150.08
The $129.49 level is the next major Fibonacci resistance. A successful breakout and retest above $129.49 would strengthen the continuation structure and put the $150.08 level into focus.
Above $150.08, the higher Fibonacci references are:
$170.67 → $199.99 → $237.33
🔴 Pullback Scenario
Key support levels:
$114.35
$113.71
$112.58
$112.25
$111.04
$109.84
$106.05
$104.38
$96.19
$92.89
$90.15
The $111–$114 zone is particularly important.
A pullback into this area followed by a successful hold would keep the breakout structure constructive. Losing $109.84–$106.05 would indicate deeper consolidation, while a sustained move below the $104.38 20 EMA would significantly weaken the current recovery structure.
🧠 Market Structure & Liquidity
Liquidity Sweep → Accumulation → Higher Lows → Breakout → Expansion → Retest → Consolidation → Continuation
SOL has moved through several important structural phases, recovering from the June low around $62.83, building higher lows, reclaiming the $100 area, and then breaking above the previous $110–$114 resistance region.
The current move toward $120 represents another expansion phase, with $119–$120 acting as the immediate decision zone.
📊 RSI Momentum
RSI: 70.46
RSI MA: 58.48
RSI has moved above 70, showing strong bullish momentum but also entering an overbought region.
This does not automatically mean a reversal. However, after the recent expansion, SOL could experience short-term consolidation or a pullback before attempting another leg higher.
The key will be whether RSI can remain elevated while price holds the $114–$119 structure.
🎯 Key Levels
Resistance:
$119.61 → $120 → $129.49 → $135.75 → $142.97 → $150.08 → $170.67 → $199.99
Support:
$114.35 → $113.71 → $112.58 → $112.25 → $111.04 → $109.84 → $106.05 → $104.38
Major EMA Support:
$104.38 / $96.19 / $92.89 / $90.15
📌 Final Outlook
SOL has strengthened considerably after reclaiming the $110–$114 region and pushing toward $120.
The key battle now is $119–$120.
A sustained breakout above this zone could open the path toward $129.49, followed by $135.75–$142.97 and the major $150.08 Fibonacci level.
On the downside, $111–$114 is the first major retest zone. Holding this area would keep the breakout structure intact, while a deeper move below $106.05–$104.38 would weaken the current setup.
Bias: Recovery structure remains strong above $104.38. A sustained breakout above $119–$120 could open the path toward $129.49, with $150.08 as the next major Fibonacci objective.
$SOL
{future}(SOLUSDT)
SOL Technical Outlook: Solana Pushes Toward $120 as Breakout Structure Strengthens
SOL is currently trading around $119.61, holding well above the $112–$114 region after a strong recovery from the $104–$110 support zone.
The broader structure has improved significantly, with SOL reclaiming the $110–$114 area and now testing the $119–$120 resistance zone. A sustained breakout above this region would bring the higher Fibonacci levels back into focus.
📈 EMA Structure
20 EMA: $104.38
50 EMA: $96.19
100 EMA: $90.15
200 EMA: $92.89
SOL is trading significantly above all four major EMAs.
The 20 EMA remains above the 50 EMA, while the 50 EMA is also above the 200 EMA. This alignment reflects a strong recovery structure and improving medium-term trend.
The $104–$106 region is now an important deeper support zone, while the $110–$114 area has developed into a key structural support region after the recent breakout.
📐 Fibonacci Levels
0.236: $114.35
0.382: $129.49
0.5: $150.08
0.618: $170.67
0.786: $199.99
1.0: $237.33
SOL has reclaimed the 0.236 Fibonacci level around $114.35 and is now trading above it.
The next major Fibonacci resistance is $129.49, followed by $150.08.
🟢 Bullish Scenario
Immediate resistance is around:
$119.61 → $120
A clean breakout and sustained close above the $119–$120 zone could open the path toward:
$129.49 → $135.75 → $142.97 → $150.08
The $129.49 level is the next major Fibonacci resistance. A successful breakout and retest above $129.49 would strengthen the continuation structure and put the $150.08 level into focus.
Above $150.08, the higher Fibonacci references are:
$170.67 → $199.99 → $237.33
🔴 Pullback Scenario
Key support levels:
$114.35
$113.71
$112.58
$112.25
$111.04
$109.84
$106.05
$104.38
$96.19
$92.89
$90.15
The $111–$114 zone is particularly important.
A pullback into this area followed by a successful hold would keep the breakout structure constructive. Losing $109.84–$106.05 would indicate deeper consolidation, while a sustained move below the $104.38 20 EMA would significantly weaken the current recovery structure.
🧠 Market Structure & Liquidity
Liquidity Sweep → Accumulation → Higher Lows → Breakout → Expansion → Retest → Consolidation → Continuation
SOL has moved through several important structural phases, recovering from the June low around $62.83, building higher lows, reclaiming the $100 area, and then breaking above the previous $110–$114 resistance region.
The current move toward $120 represents another expansion phase, with $119–$120 acting as the immediate decision zone.
📊 RSI Momentum
RSI: 70.46
RSI MA: 58.48
RSI has moved above 70, showing strong bullish momentum but also entering an overbought region.
This does not automatically mean a reversal. However, after the recent expansion, SOL could experience short-term consolidation or a pullback before attempting another leg higher.
The key will be whether RSI can remain elevated while price holds the $114–$119 structure.
🎯 Key Levels
Resistance:
$119.61 → $120 → $129.49 → $135.75 → $142.97 → $150.08 → $170.67 → $199.99
Support:
$114.35 → $113.71 → $112.58 → $112.25 → $111.04 → $109.84 → $106.05 → $104.38
Major EMA Support:
$104.38 / $96.19 / $92.89 / $90.15
📌 Final Outlook
SOL has strengthened considerably after reclaiming the $110–$114 region and pushing toward $120.
The key battle now is $119–$120.
A sustained breakout above this zone could open the path toward $129.49, followed by $135.75–$142.97 and the major $150.08 Fibonacci level.
On the downside, $111–$114 is the first major retest zone. Holding this area would keep the breakout structure intact, while a deeper move below $106.05–$104.38 would weaken the current setup.
Bias: Recovery structure remains strong above $104.38. A sustained breakout above $119–$120 could open the path toward $129.49, with $150.08 as the next major Fibonacci objective.
$SOL
The broader structure has improved significantly, with SOL reclaiming the $110–$114 area and now testing the $119–$120 resistance zone. A sustained breakout above this region would bring the higher Fibonacci levels back into focus.
📈 EMA Structure
20 EMA: $104.38
50 EMA: $96.19
100 EMA: $90.15
200 EMA: $92.89
SOL is trading significantly above all four major EMAs.
The 20 EMA remains above the 50 EMA, while the 50 EMA is also above the 200 EMA. This alignment reflects a strong recovery structure and improving medium-term trend.
The $104–$106 region is now an important deeper support zone, while the $110–$114 area has developed into a key structural support region after the recent breakout.
📐 Fibonacci Levels
0.236: $114.35
0.382: $129.49
0.5: $150.08
0.618: $170.67
0.786: $199.99
1.0: $237.33
SOL has reclaimed the 0.236 Fibonacci level around $114.35 and is now trading above it.
The next major Fibonacci resistance is $129.49, followed by $150.08.
🟢 Bullish Scenario
Immediate resistance is around:
$119.61 → $120
A clean breakout and sustained close above the $119–$120 zone could open the path toward:
$129.49 → $135.75 → $142.97 → $150.08
The $129.49 level is the next major Fibonacci resistance. A successful breakout and retest above $129.49 would strengthen the continuation structure and put the $150.08 level into focus.
Above $150.08, the higher Fibonacci references are:
$170.67 → $199.99 → $237.33
🔴 Pullback Scenario
Key support levels:
$114.35
$113.71
$112.58
$112.25
$111.04
$109.84
$106.05
$104.38
$96.19
$92.89
$90.15
The $111–$114 zone is particularly important.
A pullback into this area followed by a successful hold would keep the breakout structure constructive. Losing $109.84–$106.05 would indicate deeper consolidation, while a sustained move below the $104.38 20 EMA would significantly weaken the current recovery structure.
🧠 Market Structure & Liquidity
Liquidity Sweep → Accumulation → Higher Lows → Breakout → Expansion → Retest → Consolidation → Continuation
SOL has moved through several important structural phases, recovering from the June low around $62.83, building higher lows, reclaiming the $100 area, and then breaking above the previous $110–$114 resistance region.
The current move toward $120 represents another expansion phase, with $119–$120 acting as the immediate decision zone.
📊 RSI Momentum
RSI: 70.46
RSI MA: 58.48
RSI has moved above 70, showing strong bullish momentum but also entering an overbought region.
This does not automatically mean a reversal. However, after the recent expansion, SOL could experience short-term consolidation or a pullback before attempting another leg higher.
The key will be whether RSI can remain elevated while price holds the $114–$119 structure.
🎯 Key Levels
Resistance:
$119.61 → $120 → $129.49 → $135.75 → $142.97 → $150.08 → $170.67 → $199.99
Support:
$114.35 → $113.71 → $112.58 → $112.25 → $111.04 → $109.84 → $106.05 → $104.38
Major EMA Support:
$104.38 / $96.19 / $92.89 / $90.15
📌 Final Outlook
SOL has strengthened considerably after reclaiming the $110–$114 region and pushing toward $120.
The key battle now is $119–$120.
A sustained breakout above this zone could open the path toward $129.49, followed by $135.75–$142.97 and the major $150.08 Fibonacci level.
On the downside, $111–$114 is the first major retest zone. Holding this area would keep the breakout structure intact, while a deeper move below $106.05–$104.38 would weaken the current setup.
Bias: Recovery structure remains strong above $104.38. A sustained breakout above $119–$120 could open the path toward $129.49, with $150.08 as the next major Fibonacci objective.
$SOL
35
·
--
記事
翻訳参照
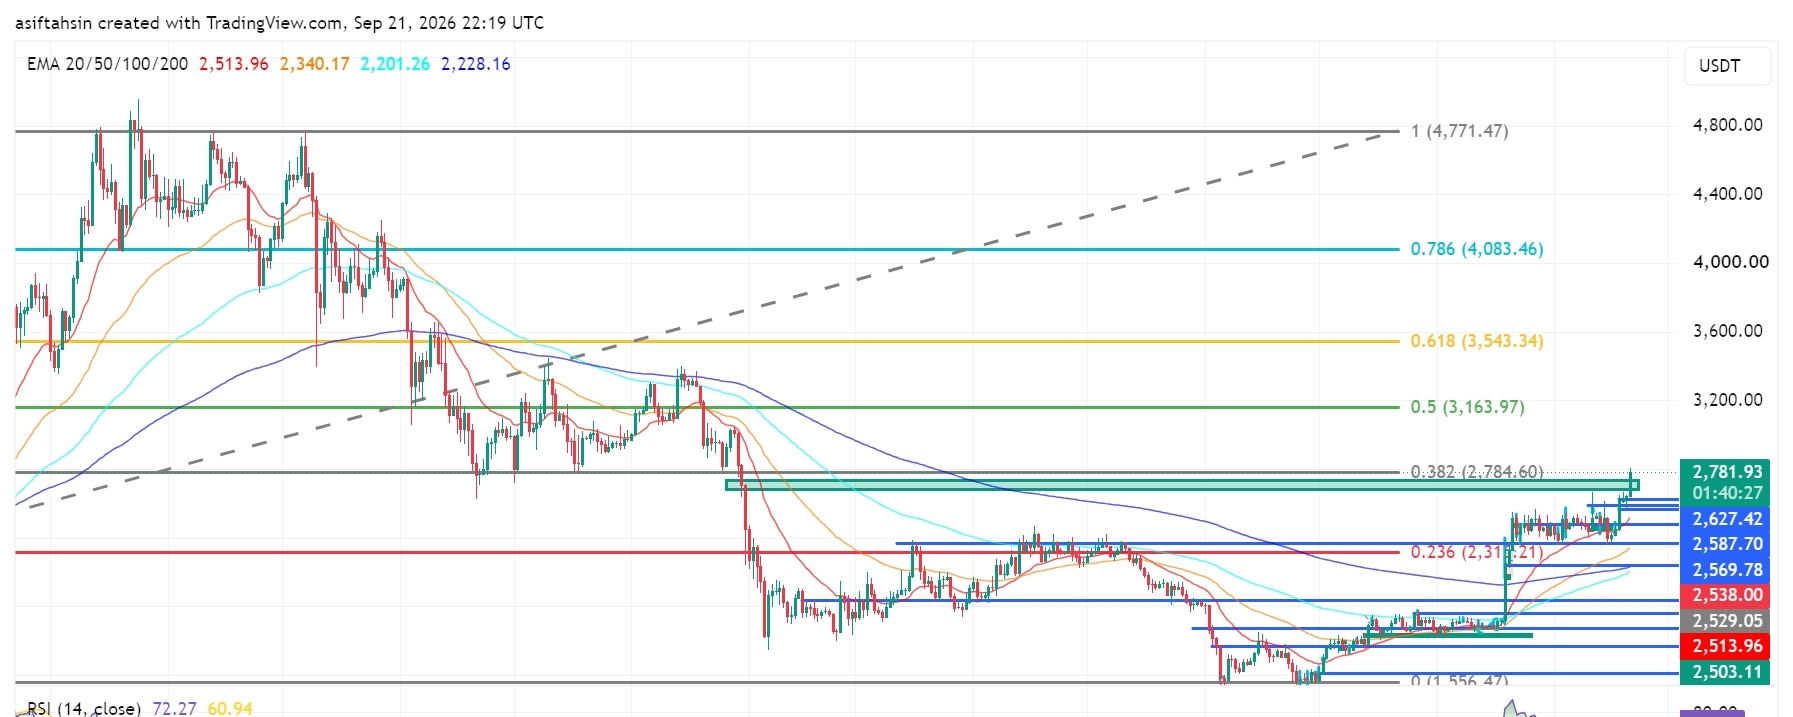
ETH Technical Outlook: Ethereum Reclaims $2.78K as Breakout Structure StrengthensETH is currently trading around $2,781.93, pushing into the major $2,784.60 Fibonacci resistance after a strong recovery from the $2,475–$2,500 area.
The broader structure has improved significantly, with ETH reclaiming the $2,500–$2,600 region and breaking above the previous consolidation range. A sustained breakout above $2,784.60 would bring the higher Fibonacci levels into focus.
📈 EMA Structure
20 EMA: $2,513.96
50 EMA: $2,340.17
100 EMA: $2,201.26
200 EMA: $2,228.16
ETH is trading well above all four major EMAs.
The 20 EMA remains above the 50 EMA, while the 100 EMA and 200 EMA are positioned significantly lower. This alignment reflects a strong recovery structure and improving medium-term momentum.
The $2,500–$2,540 region is now an important EMA/support zone.
📐 Fibonacci Levels
0.236: $2,315.21
0.382: $2,784.60
0.5: $3,163.97
0.618: $3,543.34
0.786: $4,083.46
1.0: $4,771.47
ETH is currently testing the 0.382 Fibonacci level at $2,784.60.
A clean breakout and sustained close above this level would shift attention toward $3,163.97, followed by the higher Fibonacci extensions.
🟢 Bullish Scenario
Immediate resistance sits around:
$2,784.60 → $2,800
A confirmed breakout above this area could open the path toward:
$3,163.97 → $3,543.34 → $4,083.46 → $4,771.47
The first major objective is the 0.5 Fibonacci level at $3,163.97. If ETH can establish support above $2,784.60 after the breakout, the recovery structure would become substantially stronger.
🔴 Pullback Scenario
Key support levels:
$2,672.47
$2,627.42
$2,587.70
$2,569.78
$2,538.00
$2,529.05
$2,513.96
$2,503.11
$2,479.06
$2,475.84
The $2,570–$2,630 zone is particularly important for a healthy retest.
Holding this area after a breakout would allow ETH to consolidate before another attempt higher. A deeper move below $2,500 would weaken the current breakout structure and bring the lower support zone back into focus.
🧠 Market Structure & Liquidity
Liquidity Sweep → Accumulation → Higher Lows → Breakout → Expansion → Retest → Consolidation → Continuation
ETH has transitioned from the prolonged decline into a clear recovery structure. The recent move above the $2,600–$2,670 region represents an important expansion phase, while the current move toward $2,784.60 is testing the next major structural resistance.
📊 RSI Momentum
RSI: 72.27
RSI MA: 60.94
RSI has moved above 70, showing strong momentum but also indicating that ETH is entering an overbought zone on this chart.
That does not automatically mean a reversal; however, after such a strong expansion, a short-term consolidation or pullback would be technically normal before another continuation attempt.
🎯 Key Levels
Resistance:
$2,784.60 → $2,800 → $3,163.97 → $3,543.34 → $4,083.46 → $4,771.47
Support:
$2,672.47 → $2,627.42 → $2,587.70 → $2,569.78 → $2,538 → $2,513.96 → $2,503.11 → $2,479.06
Major EMA Support:
$2,513.96 / $2,340.17 / $2,228.16 / $2,201.26
📌 Final Outlook
ETH has strengthened considerably after reclaiming the $2,500–$2,600 region and pushing toward the $2,784.60 Fibonacci resistance.
The key battle now is $2,784.60–$2,800.
A sustained breakout above this zone could open the path toward $3,163.97, followed by $3,543.34 and potentially $4,083.46.
On the downside, $2,570–$2,630 is the first major retest zone, while $2,500–$2,514 remains critical structural support.
Bias: Recovery structure remains strong above $2,500. A sustained breakout above $2,784.60 could open the path toward $3,163.97, with $3,543.34 as the next major Fibonacci level.
$ETH
{future}(ETHUSDT)
ETH Technical Outlook: Ethereum Reclaims $2.78K as Breakout Structure Strengthens
ETH is currently trading around $2,781.93, pushing into the major $2,784.60 Fibonacci resistance after a strong recovery from the $2,475–$2,500 area.
The broader structure has improved significantly, with ETH reclaiming the $2,500–$2,600 region and breaking above the previous consolidation range. A sustained breakout above $2,784.60 would bring the higher Fibonacci levels into focus.
📈 EMA Structure
20 EMA: $2,513.96
50 EMA: $2,340.17
100 EMA: $2,201.26
200 EMA: $2,228.16
ETH is trading well above all four major EMAs.
The 20 EMA remains above the 50 EMA, while the 100 EMA and 200 EMA are positioned significantly lower. This alignment reflects a strong recovery structure and improving medium-term momentum.
The $2,500–$2,540 region is now an important EMA/support zone.
📐 Fibonacci Levels
0.236: $2,315.21
0.382: $2,784.60
0.5: $3,163.97
0.618: $3,543.34
0.786: $4,083.46
1.0: $4,771.47
ETH is currently testing the 0.382 Fibonacci level at $2,784.60.
A clean breakout and sustained close above this level would shift attention toward $3,163.97, followed by the higher Fibonacci extensions.
🟢 Bullish Scenario
Immediate resistance sits around:
$2,784.60 → $2,800
A confirmed breakout above this area could open the path toward:
$3,163.97 → $3,543.34 → $4,083.46 → $4,771.47
The first major objective is the 0.5 Fibonacci level at $3,163.97. If ETH can establish support above $2,784.60 after the breakout, the recovery structure would become substantially stronger.
🔴 Pullback Scenario
Key support levels:
$2,672.47
$2,627.42
$2,587.70
$2,569.78
$2,538.00
$2,529.05
$2,513.96
$2,503.11
$2,479.06
$2,475.84
The $2,570–$2,630 zone is particularly important for a healthy retest.
Holding this area after a breakout would allow ETH to consolidate before another attempt higher. A deeper move below $2,500 would weaken the current breakout structure and bring the lower support zone back into focus.
🧠 Market Structure & Liquidity
Liquidity Sweep → Accumulation → Higher Lows → Breakout → Expansion → Retest → Consolidation → Continuation
ETH has transitioned from the prolonged decline into a clear recovery structure. The recent move above the $2,600–$2,670 region represents an important expansion phase, while the current move toward $2,784.60 is testing the next major structural resistance.
📊 RSI Momentum
RSI: 72.27
RSI MA: 60.94
RSI has moved above 70, showing strong momentum but also indicating that ETH is entering an overbought zone on this chart.
That does not automatically mean a reversal; however, after such a strong expansion, a short-term consolidation or pullback would be technically normal before another continuation attempt.
🎯 Key Levels
Resistance:
$2,784.60 → $2,800 → $3,163.97 → $3,543.34 → $4,083.46 → $4,771.47
Support:
$2,672.47 → $2,627.42 → $2,587.70 → $2,569.78 → $2,538 → $2,513.96 → $2,503.11 → $2,479.06
Major EMA Support:
$2,513.96 / $2,340.17 / $2,228.16 / $2,201.26
📌 Final Outlook
ETH has strengthened considerably after reclaiming the $2,500–$2,600 region and pushing toward the $2,784.60 Fibonacci resistance.
The key battle now is $2,784.60–$2,800.
A sustained breakout above this zone could open the path toward $3,163.97, followed by $3,543.34 and potentially $4,083.46.
On the downside, $2,570–$2,630 is the first major retest zone, while $2,500–$2,514 remains critical structural support.
Bias: Recovery structure remains strong above $2,500. A sustained breakout above $2,784.60 could open the path toward $3,163.97, with $3,543.34 as the next major Fibonacci level.
$ETH
The broader structure has improved significantly, with ETH reclaiming the $2,500–$2,600 region and breaking above the previous consolidation range. A sustained breakout above $2,784.60 would bring the higher Fibonacci levels into focus.
📈 EMA Structure
20 EMA: $2,513.96
50 EMA: $2,340.17
100 EMA: $2,201.26
200 EMA: $2,228.16
ETH is trading well above all four major EMAs.
The 20 EMA remains above the 50 EMA, while the 100 EMA and 200 EMA are positioned significantly lower. This alignment reflects a strong recovery structure and improving medium-term momentum.
The $2,500–$2,540 region is now an important EMA/support zone.
📐 Fibonacci Levels
0.236: $2,315.21
0.382: $2,784.60
0.5: $3,163.97
0.618: $3,543.34
0.786: $4,083.46
1.0: $4,771.47
ETH is currently testing the 0.382 Fibonacci level at $2,784.60.
A clean breakout and sustained close above this level would shift attention toward $3,163.97, followed by the higher Fibonacci extensions.
🟢 Bullish Scenario
Immediate resistance sits around:
$2,784.60 → $2,800
A confirmed breakout above this area could open the path toward:
$3,163.97 → $3,543.34 → $4,083.46 → $4,771.47
The first major objective is the 0.5 Fibonacci level at $3,163.97. If ETH can establish support above $2,784.60 after the breakout, the recovery structure would become substantially stronger.
🔴 Pullback Scenario
Key support levels:
$2,672.47
$2,627.42
$2,587.70
$2,569.78
$2,538.00
$2,529.05
$2,513.96
$2,503.11
$2,479.06
$2,475.84
The $2,570–$2,630 zone is particularly important for a healthy retest.
Holding this area after a breakout would allow ETH to consolidate before another attempt higher. A deeper move below $2,500 would weaken the current breakout structure and bring the lower support zone back into focus.
🧠 Market Structure & Liquidity
Liquidity Sweep → Accumulation → Higher Lows → Breakout → Expansion → Retest → Consolidation → Continuation
ETH has transitioned from the prolonged decline into a clear recovery structure. The recent move above the $2,600–$2,670 region represents an important expansion phase, while the current move toward $2,784.60 is testing the next major structural resistance.
📊 RSI Momentum
RSI: 72.27
RSI MA: 60.94
RSI has moved above 70, showing strong momentum but also indicating that ETH is entering an overbought zone on this chart.
That does not automatically mean a reversal; however, after such a strong expansion, a short-term consolidation or pullback would be technically normal before another continuation attempt.
🎯 Key Levels
Resistance:
$2,784.60 → $2,800 → $3,163.97 → $3,543.34 → $4,083.46 → $4,771.47
Support:
$2,672.47 → $2,627.42 → $2,587.70 → $2,569.78 → $2,538 → $2,513.96 → $2,503.11 → $2,479.06
Major EMA Support:
$2,513.96 / $2,340.17 / $2,228.16 / $2,201.26
📌 Final Outlook
ETH has strengthened considerably after reclaiming the $2,500–$2,600 region and pushing toward the $2,784.60 Fibonacci resistance.
The key battle now is $2,784.60–$2,800.
A sustained breakout above this zone could open the path toward $3,163.97, followed by $3,543.34 and potentially $4,083.46.
On the downside, $2,570–$2,630 is the first major retest zone, while $2,500–$2,514 remains critical structural support.
Bias: Recovery structure remains strong above $2,500. A sustained breakout above $2,784.60 could open the path toward $3,163.97, with $3,543.34 as the next major Fibonacci level.
$ETH
58
·
--
記事
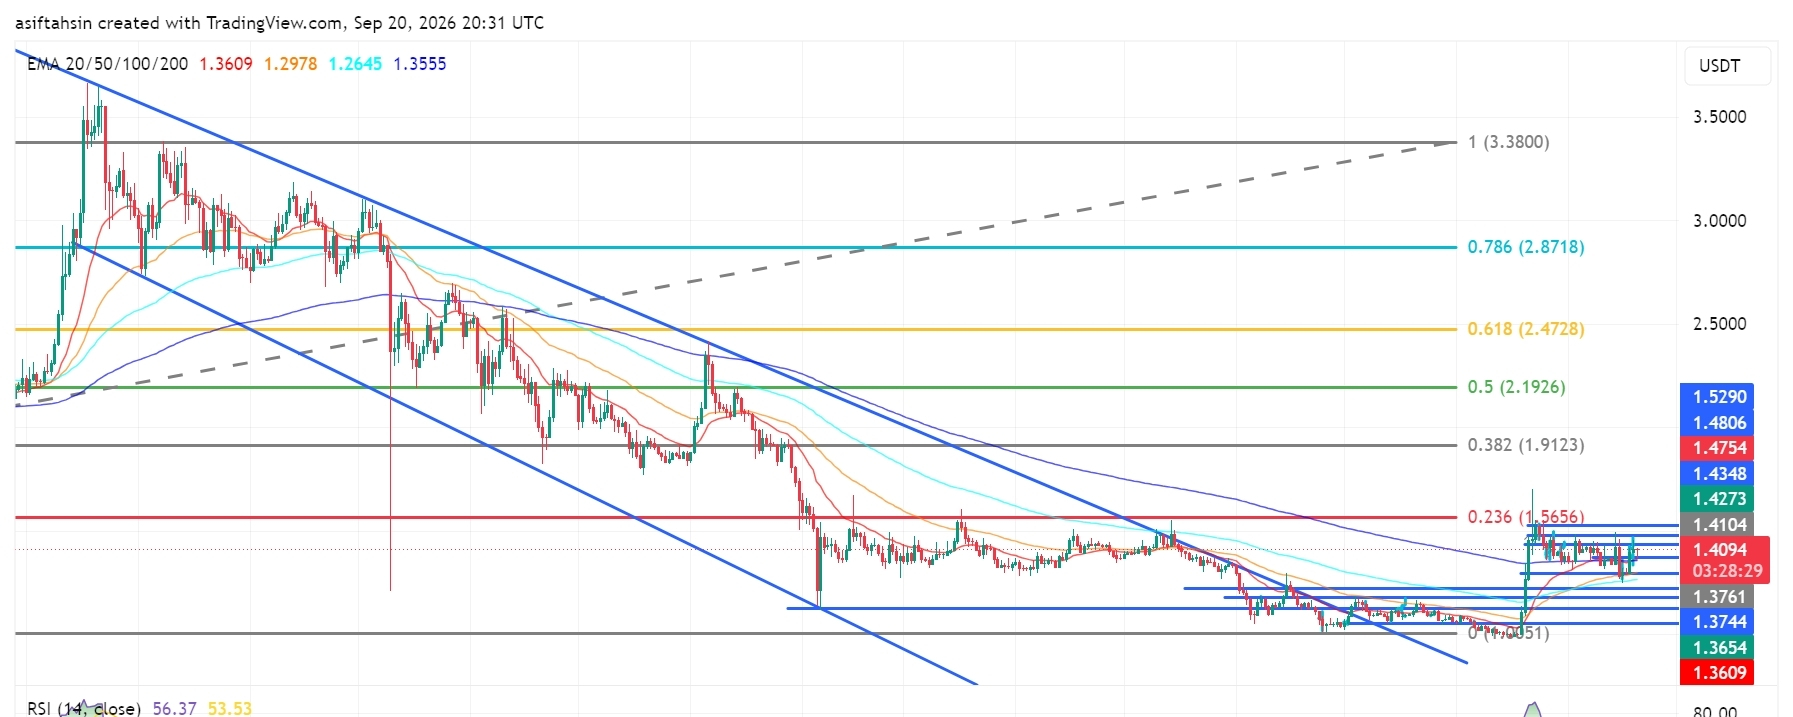
XRPテクニカル見通し:XRPは1.40ドル超を維持し、回復の構造が強まるXRPテクニカル見通し:XRPは1.40ドル超を維持し、回復の構造が強まる
XRPは現在約1.41ドルで取引されており、直近の1.25〜1.30ドルのサポート帯からの回復の後、1.37〜1.40ドルの範囲を上回って推移しています。
より広い構造は改善しており、価格は1.40ドルの水準を回復してから、主要な1.41〜1.48ドルのレジスタンス帯へ再び向かっています。このエリアを持続的に突破すれば、より高いフィボナッチの水準が再び注目されるでしょう。
最近の市場コメントでも、1.40ドルのエリアが重要なレジスタンス/回復水準として挙げられていますが、短期のモメンタムはこのゾーン付近で敏感に反応しています。
XRPテクニカル見通し:XRPは1.40ドル超を維持し、回復の構造が強まる
XRPテクニカル見通し:XRPは1.40ドル超を維持し、回復の構造が強まる
XRPは現在約1.41ドルで取引されており、直近の1.25〜1.30ドルのサポート帯からの回復の後、1.37〜1.40ドルの範囲を上回って推移しています。
より広い構造は改善しており、価格は1.40ドルの水準を回復してから、主要な1.41〜1.48ドルのレジスタンス帯へ再び向かっています。このエリアを持続的に突破すれば、より高いフィボナッチの水準が再び注目されるでしょう。
最近の市場コメントでも、1.40ドルのエリアが重要なレジスタンス/回復水準として挙げられていますが、短期のモメンタムはこのゾーン付近で敏感に反応しています。
XRPは現在約1.41ドルで取引されており、直近の1.25〜1.30ドルのサポート帯からの回復の後、1.37〜1.40ドルの範囲を上回って推移しています。
より広い構造は改善しており、価格は1.40ドルの水準を回復してから、主要な1.41〜1.48ドルのレジスタンス帯へ再び向かっています。このエリアを持続的に突破すれば、より高いフィボナッチの水準が再び注目されるでしょう。
最近の市場コメントでも、1.40ドルのエリアが重要なレジスタンス/回復水準として挙げられていますが、短期のモメンタムはこのゾーン付近で敏感に反応しています。
2
1.2k
·
--
記事
翻訳参照
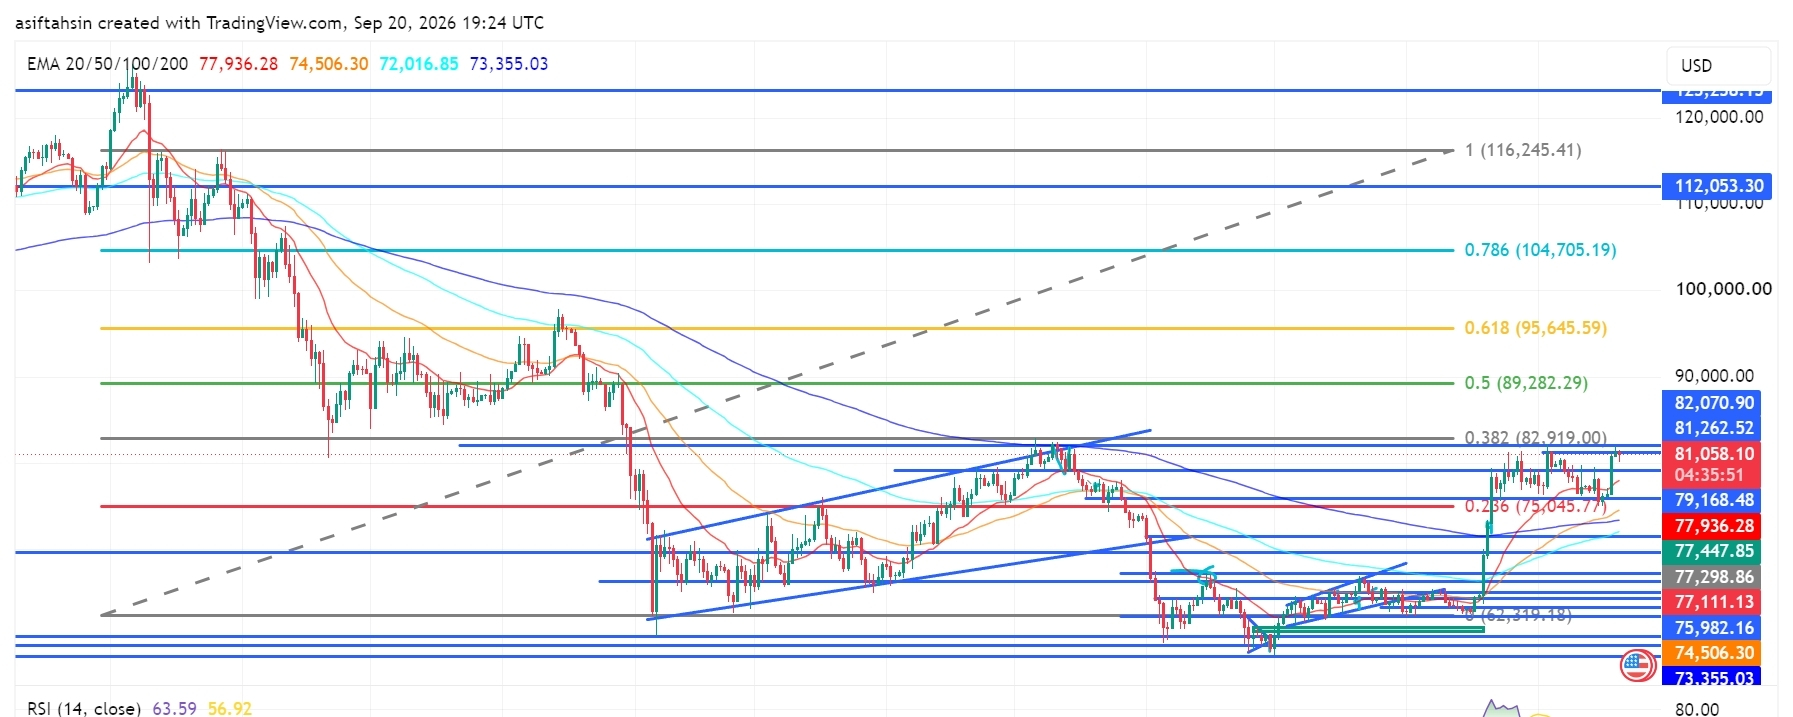
BTC Technical Outlook: Bitcoin Reclaims $81K as Recovery Structure StrengthensBTC is currently trading around $81,058, holding above the $79K–$80K region after the recent recovery from the $72K–$75K support area.
The broader structure has improved, with price reclaiming the $80K area and moving back toward the major $81.26K–$82.92K resistance zone. A sustained move through this area would put the higher Fibonacci levels back into focus.
📈 EMA Structure
20 EMA: $77,936.12
50 EMA: $74,506.24
100 EMA: $72,016.82
200 EMA: $73,355.02
BTC is currently trading well above the 20 EMA at $77,936.
The recovery above the 50 EMA at $74,506, 100 EMA at $72,016, and 200 EMA at $73,355 keeps the broader recovery structure constructive.
The 20 EMA remains above the longer-term EMA levels, showing improving short-term structure.
The $77.9K area remains an important dynamic support during any short-term pullback.
📐 Fibonacci Levels
Key Fibonacci levels:
0.236: $75,045.77
0.382: $82,919.00
0.5: $89,282.29
0.618: $95,645.59
0.786: $104,705.19
1.0: $116,245.41
BTC is currently trading above the 0.236 Fibonacci level at $75,045.77.
The next major Fibonacci reference is $82,919 — 0.382 Fib.
A sustained move above the $81K–$82.9K resistance area could bring $89,282 into focus, followed by $95,645.
🟢 Bullish Scenario
BTC has recovered strongly from the lower support structure and is now consolidating around $80K–$81K.
Immediate resistance:
$81,262.52
$82,070.90
$82,919.00 — 0.382 Fibonacci
$89,282.29 — 0.5 Fibonacci
$95,645.59 — 0.618 Fibonacci
A clean breakout and sustained close above $82K–$82.92K would provide stronger confirmation of continued recovery.
🎯 Target 1: $82,070.90
🎯 Target 2: $82,919.00 — 0.382 Fibonacci
🎯 Target 3: $89,282.29 — 0.5 Fibonacci
🎯 Target 4: $95,645.59 — 0.618 Fibonacci
🎯 Target 5: $104,705.19 — 0.786 Fibonacci
🎯 Target 6: $112,053.30
🎯 Target 7: $116,245.41 — 1.0 Fibonacci
A confirmed move through the $82.92K zone could strengthen the medium-term recovery structure and bring the $89K–$95K region into focus.
🔴 Pullback Scenario
After the recent expansion from the $75K region toward $81K, a retest of the breakout area would be normal.
Key supports:
$79,168.48
$77,936.12 — 20 EMA
$77,447.85
$77,298.86
$77,111.13
$75,982.16
$75,045.77 — 0.236 Fibonacci
$74,506.24 — 50 EMA
$73,355.02 — 200 EMA
$72,016.82 — 100 EMA
The $77K–$79K zone is particularly important.
If BTC continues to hold this area during a pullback, the current recovery structure remains active.
A sustained loss of $75,045 would weaken the current structure and bring the lower EMA support region back into focus.
🧠 Market Structure & Liquidity
BTC has formed a recovery structure after sweeping liquidity around the $72K–$75K region.
The recent move produced a strong recovery through $75K, followed by a breakout toward $80K–$81K.
BTC is now moving through an important:
Liquidity Sweep → Accumulation → Higher Lows → Breakout → Expansion → Retest → Consolidation → Continuation
structure.
The major upside liquidity and resistance are concentrated around the $81.26K–$82.92K region.
A decisive move through this area would place $89,282 as the next major Fibonacci reference.
📊 RSI Momentum
RSI (14): 63.59
RSI MA: 56.92
RSI has moved above the neutral 50 level and remains firmly in positive territory after the recent expansion.
The current reading around 63.59 shows stronger short-term momentum while remaining below the traditional 70 overbought threshold.
A sustained RSI above 60 would keep momentum supportive, while a move back below 50 would indicate increasing short-term weakness.
🎯 Key Levels
🔴 Major Resistance:
$81,262.52 → $82,070.90 → $82,919.00 → $89,282.29 → $95,645.59
🟢 Major Support:
$79,168.48 → $77,936.12 → $77,447.85 → $77,298.86 → $77,111.13 → $75,982.16 → $75,045.77
📉 Dynamic EMA Support:
$77,936.12 — 20 EMA | $74,506.24 — 50 EMA | $73,355.02 — 200 EMA | $72,016.82 — 100 EMA
🚀 Upside References:
$82,919 → $89,282 → $95,645 → $104,705 → $112,053 → $116,245
📌 Final Outlook
BTC's broader structure has strengthened after the recent recovery, with price now holding around $81K and above the major $75K–$79K support structure.
The $77K–$79K area is now an important short-term support region, while $81.26K–$82.92K remains the immediate major resistance zone.
A confirmed move above $82,919 could open the path toward $89,282, followed by $95,645 and $104,705.
However, rejection from the upper resistance area followed by a sustained loss of $75,045 would weaken the current recovery structure and bring the lower support zones back into focus.
Bias: 🟢 Recovery structure intact above $75,045. A sustained move above $82,919 could open the path toward $89,282, with $95,645 as the next major Fibonacci reference.
$BTC
{future}(BTCUSDT)
BTC Technical Outlook: Bitcoin Reclaims $81K as Recovery Structure Strengthens
BTC is currently trading around $81,058, holding above the $79K–$80K region after the recent recovery from the $72K–$75K support area.
The broader structure has improved, with price reclaiming the $80K area and moving back toward the major $81.26K–$82.92K resistance zone. A sustained move through this area would put the higher Fibonacci levels back into focus.
📈 EMA Structure
20 EMA: $77,936.12
50 EMA: $74,506.24
100 EMA: $72,016.82
200 EMA: $73,355.02
BTC is currently trading well above the 20 EMA at $77,936.
The recovery above the 50 EMA at $74,506, 100 EMA at $72,016, and 200 EMA at $73,355 keeps the broader recovery structure constructive.
The 20 EMA remains above the longer-term EMA levels, showing improving short-term structure.
The $77.9K area remains an important dynamic support during any short-term pullback.
📐 Fibonacci Levels
Key Fibonacci levels:
0.236: $75,045.77
0.382: $82,919.00
0.5: $89,282.29
0.618: $95,645.59
0.786: $104,705.19
1.0: $116,245.41
BTC is currently trading above the 0.236 Fibonacci level at $75,045.77.
The next major Fibonacci reference is $82,919 — 0.382 Fib.
A sustained move above the $81K–$82.9K resistance area could bring $89,282 into focus, followed by $95,645.
🟢 Bullish Scenario
BTC has recovered strongly from the lower support structure and is now consolidating around $80K–$81K.
Immediate resistance:
$81,262.52
$82,070.90
$82,919.00 — 0.382 Fibonacci
$89,282.29 — 0.5 Fibonacci
$95,645.59 — 0.618 Fibonacci
A clean breakout and sustained close above $82K–$82.92K would provide stronger confirmation of continued recovery.
🎯 Target 1: $82,070.90
🎯 Target 2: $82,919.00 — 0.382 Fibonacci
🎯 Target 3: $89,282.29 — 0.5 Fibonacci
🎯 Target 4: $95,645.59 — 0.618 Fibonacci
🎯 Target 5: $104,705.19 — 0.786 Fibonacci
🎯 Target 6: $112,053.30
🎯 Target 7: $116,245.41 — 1.0 Fibonacci
A confirmed move through the $82.92K zone could strengthen the medium-term recovery structure and bring the $89K–$95K region into focus.
🔴 Pullback Scenario
After the recent expansion from the $75K region toward $81K, a retest of the breakout area would be normal.
Key supports:
$79,168.48
$77,936.12 — 20 EMA
$77,447.85
$77,298.86
$77,111.13
$75,982.16
$75,045.77 — 0.236 Fibonacci
$74,506.24 — 50 EMA
$73,355.02 — 200 EMA
$72,016.82 — 100 EMA
The $77K–$79K zone is particularly important.
If BTC continues to hold this area during a pullback, the current recovery structure remains active.
A sustained loss of $75,045 would weaken the current structure and bring the lower EMA support region back into focus.
🧠 Market Structure & Liquidity
BTC has formed a recovery structure after sweeping liquidity around the $72K–$75K region.
The recent move produced a strong recovery through $75K, followed by a breakout toward $80K–$81K.
BTC is now moving through an important:
Liquidity Sweep → Accumulation → Higher Lows → Breakout → Expansion → Retest → Consolidation → Continuation
structure.
The major upside liquidity and resistance are concentrated around the $81.26K–$82.92K region.
A decisive move through this area would place $89,282 as the next major Fibonacci reference.
📊 RSI Momentum
RSI (14): 63.59
RSI MA: 56.92
RSI has moved above the neutral 50 level and remains firmly in positive territory after the recent expansion.
The current reading around 63.59 shows stronger short-term momentum while remaining below the traditional 70 overbought threshold.
A sustained RSI above 60 would keep momentum supportive, while a move back below 50 would indicate increasing short-term weakness.
🎯 Key Levels
🔴 Major Resistance:
$81,262.52 → $82,070.90 → $82,919.00 → $89,282.29 → $95,645.59
🟢 Major Support:
$79,168.48 → $77,936.12 → $77,447.85 → $77,298.86 → $77,111.13 → $75,982.16 → $75,045.77
📉 Dynamic EMA Support:
$77,936.12 — 20 EMA | $74,506.24 — 50 EMA | $73,355.02 — 200 EMA | $72,016.82 — 100 EMA
🚀 Upside References:
$82,919 → $89,282 → $95,645 → $104,705 → $112,053 → $116,245
📌 Final Outlook
BTC's broader structure has strengthened after the recent recovery, with price now holding around $81K and above the major $75K–$79K support structure.
The $77K–$79K area is now an important short-term support region, while $81.26K–$82.92K remains the immediate major resistance zone.
A confirmed move above $82,919 could open the path toward $89,282, followed by $95,645 and $104,705.
However, rejection from the upper resistance area followed by a sustained loss of $75,045 would weaken the current recovery structure and bring the lower support zones back into focus.
Bias: 🟢 Recovery structure intact above $75,045. A sustained move above $82,919 could open the path toward $89,282, with $95,645 as the next major Fibonacci reference.
$BTC
The broader structure has improved, with price reclaiming the $80K area and moving back toward the major $81.26K–$82.92K resistance zone. A sustained move through this area would put the higher Fibonacci levels back into focus.
📈 EMA Structure
20 EMA: $77,936.12
50 EMA: $74,506.24
100 EMA: $72,016.82
200 EMA: $73,355.02
BTC is currently trading well above the 20 EMA at $77,936.
The recovery above the 50 EMA at $74,506, 100 EMA at $72,016, and 200 EMA at $73,355 keeps the broader recovery structure constructive.
The 20 EMA remains above the longer-term EMA levels, showing improving short-term structure.
The $77.9K area remains an important dynamic support during any short-term pullback.
📐 Fibonacci Levels
Key Fibonacci levels:
0.236: $75,045.77
0.382: $82,919.00
0.5: $89,282.29
0.618: $95,645.59
0.786: $104,705.19
1.0: $116,245.41
BTC is currently trading above the 0.236 Fibonacci level at $75,045.77.
The next major Fibonacci reference is $82,919 — 0.382 Fib.
A sustained move above the $81K–$82.9K resistance area could bring $89,282 into focus, followed by $95,645.
🟢 Bullish Scenario
BTC has recovered strongly from the lower support structure and is now consolidating around $80K–$81K.
Immediate resistance:
$81,262.52
$82,070.90
$82,919.00 — 0.382 Fibonacci
$89,282.29 — 0.5 Fibonacci
$95,645.59 — 0.618 Fibonacci
A clean breakout and sustained close above $82K–$82.92K would provide stronger confirmation of continued recovery.
🎯 Target 1: $82,070.90
🎯 Target 2: $82,919.00 — 0.382 Fibonacci
🎯 Target 3: $89,282.29 — 0.5 Fibonacci
🎯 Target 4: $95,645.59 — 0.618 Fibonacci
🎯 Target 5: $104,705.19 — 0.786 Fibonacci
🎯 Target 6: $112,053.30
🎯 Target 7: $116,245.41 — 1.0 Fibonacci
A confirmed move through the $82.92K zone could strengthen the medium-term recovery structure and bring the $89K–$95K region into focus.
🔴 Pullback Scenario
After the recent expansion from the $75K region toward $81K, a retest of the breakout area would be normal.
Key supports:
$79,168.48
$77,936.12 — 20 EMA
$77,447.85
$77,298.86
$77,111.13
$75,982.16
$75,045.77 — 0.236 Fibonacci
$74,506.24 — 50 EMA
$73,355.02 — 200 EMA
$72,016.82 — 100 EMA
The $77K–$79K zone is particularly important.
If BTC continues to hold this area during a pullback, the current recovery structure remains active.
A sustained loss of $75,045 would weaken the current structure and bring the lower EMA support region back into focus.
🧠 Market Structure & Liquidity
BTC has formed a recovery structure after sweeping liquidity around the $72K–$75K region.
The recent move produced a strong recovery through $75K, followed by a breakout toward $80K–$81K.
BTC is now moving through an important:
Liquidity Sweep → Accumulation → Higher Lows → Breakout → Expansion → Retest → Consolidation → Continuation
structure.
The major upside liquidity and resistance are concentrated around the $81.26K–$82.92K region.
A decisive move through this area would place $89,282 as the next major Fibonacci reference.
📊 RSI Momentum
RSI (14): 63.59
RSI MA: 56.92
RSI has moved above the neutral 50 level and remains firmly in positive territory after the recent expansion.
The current reading around 63.59 shows stronger short-term momentum while remaining below the traditional 70 overbought threshold.
A sustained RSI above 60 would keep momentum supportive, while a move back below 50 would indicate increasing short-term weakness.
🎯 Key Levels
🔴 Major Resistance:
$81,262.52 → $82,070.90 → $82,919.00 → $89,282.29 → $95,645.59
🟢 Major Support:
$79,168.48 → $77,936.12 → $77,447.85 → $77,298.86 → $77,111.13 → $75,982.16 → $75,045.77
📉 Dynamic EMA Support:
$77,936.12 — 20 EMA | $74,506.24 — 50 EMA | $73,355.02 — 200 EMA | $72,016.82 — 100 EMA
🚀 Upside References:
$82,919 → $89,282 → $95,645 → $104,705 → $112,053 → $116,245
📌 Final Outlook
BTC's broader structure has strengthened after the recent recovery, with price now holding around $81K and above the major $75K–$79K support structure.
The $77K–$79K area is now an important short-term support region, while $81.26K–$82.92K remains the immediate major resistance zone.
A confirmed move above $82,919 could open the path toward $89,282, followed by $95,645 and $104,705.
However, rejection from the upper resistance area followed by a sustained loss of $75,045 would weaken the current recovery structure and bring the lower support zones back into focus.
Bias: 🟢 Recovery structure intact above $75,045. A sustained move above $82,919 could open the path toward $89,282, with $95,645 as the next major Fibonacci reference.
$BTC
43
·
--
記事
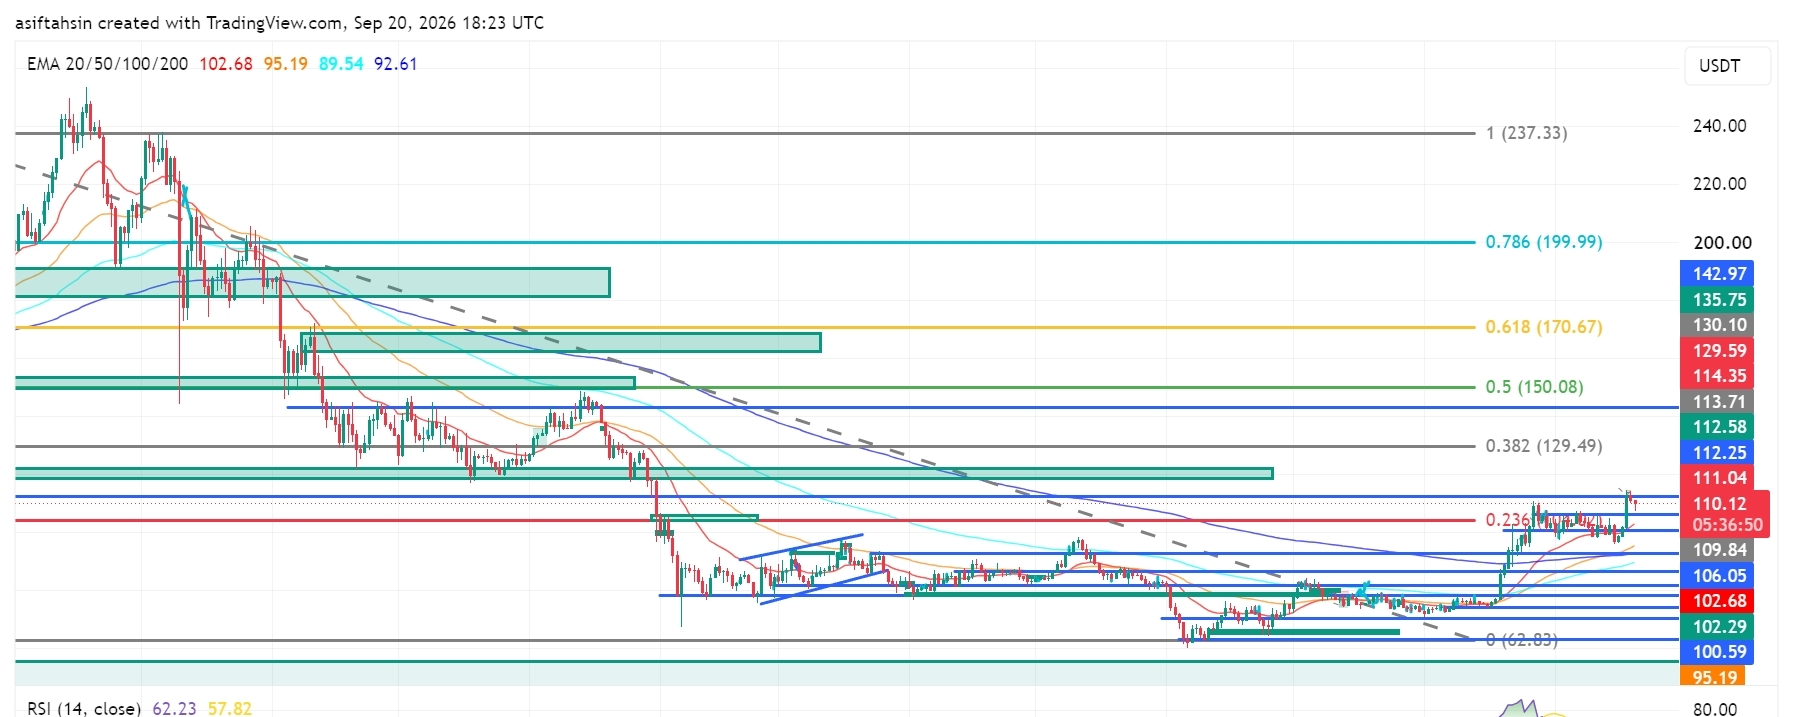
SOLテクニカル見通し:ソラナが$110を奪還、回復の構造が強まるSOLは現在約$110.1で推移しており、直近で$92〜$100のサポート領域から回復した後、$106〜$109の範囲を上回った状態を維持しています。
全体的な構造は改善しており、価格が$100の水準を取り戻してから主要な$111〜$114のレジスタンス帯へと戻ってきています。このゾーンを持続的に上抜けできれば、より高いフィボナッチ水準が再び注目されます。
📈 EMA構造
20 EMA: $102.68
50 EMA: $95.19
100 EMA: $89.54
200 EMA: $92.61
SOLは現在、$102.68の20 EMAを大きく上回る水準で取引されています。
$95.19の50 EMA、$89.54の100 EMA、$92.61の200 EMAを上回って回復していることにより、より広い回復の構図は前向きに保たれています。
SOLテクニカル見通し:ソラナが$110を奪還、回復の構造が強まる
SOLは現在約$110.1で推移しており、直近で$92〜$100のサポート領域から回復した後、$106〜$109の範囲を上回った状態を維持しています。
全体的な構造は改善しており、価格が$100の水準を取り戻してから主要な$111〜$114のレジスタンス帯へと戻ってきています。このゾーンを持続的に上抜けできれば、より高いフィボナッチ水準が再び注目されます。
📈 EMA構造
20 EMA: $102.68
50 EMA: $95.19
100 EMA: $89.54
200 EMA: $92.61
SOLは現在、$102.68の20 EMAを大きく上回る水準で取引されています。
$95.19の50 EMA、$89.54の100 EMA、$92.61の200 EMAを上回って回復していることにより、より広い回復の構図は前向きに保たれています。
全体的な構造は改善しており、価格が$100の水準を取り戻してから主要な$111〜$114のレジスタンス帯へと戻ってきています。このゾーンを持続的に上抜けできれば、より高いフィボナッチ水準が再び注目されます。
📈 EMA構造
20 EMA: $102.68
50 EMA: $95.19
100 EMA: $89.54
200 EMA: $92.61
SOLは現在、$102.68の20 EMAを大きく上回る水準で取引されています。
$95.19の50 EMA、$89.54の100 EMA、$92.61の200 EMAを上回って回復していることにより、より広い回復の構図は前向きに保たれています。
1k
·
--
記事
翻訳参照
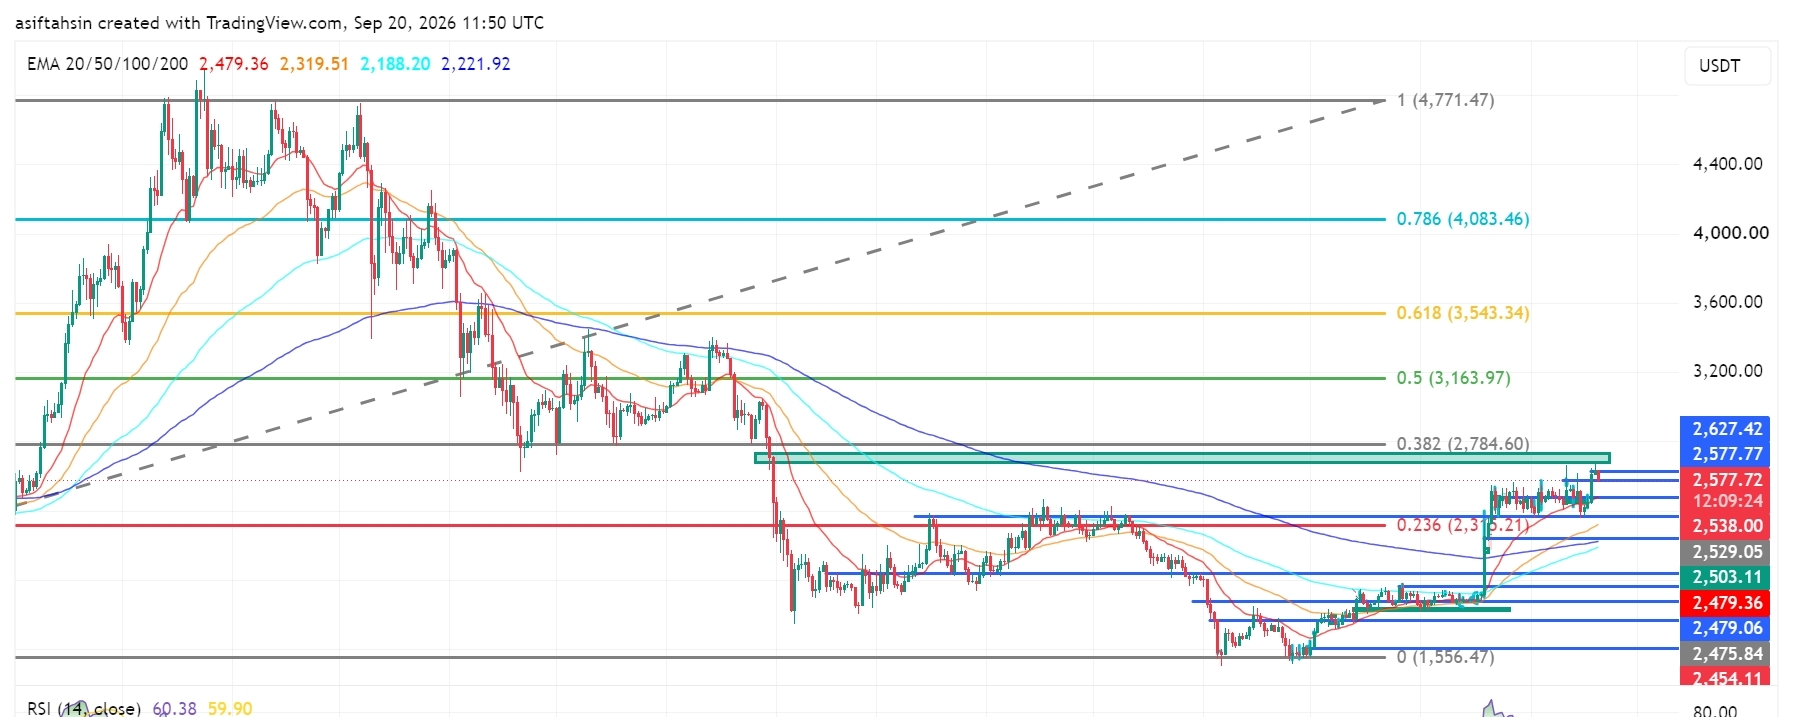
ETH Technical Outlook: Ethereum Holds Near $2.58K as Recovery ContinuesETH is currently trading around $2,577, holding above the $2,500–$2,540 support area after the recent recovery from the $2,280–$2,360 demand zone.
The broader recovery structure remains constructive, with price now approaching the important $2,627–$2,785 resistance zone. The $2,784.60 level is the major 0.382 Fibonacci reference on the chart.
📈 EMA Structure
20 EMA: $2,479.36
50 EMA: $2,319.51
100 EMA: $2,188.20
200 EMA: $2,221.92
ETH is currently trading well above the 20 EMA at $2,479.36.
The recovery above the 50 EMA at $2,319.51, 100 EMA at $2,188.20, and 200 EMA at $2,221.92 keeps the broader recovery structure constructive.
The 20 EMA is now acting as an important dynamic reference. A sustained hold above this level would keep the short-term structure supported.
📐 Fibonacci Levels
Key Fibonacci levels:
0.236: $2,315.21
0.382: $2,784.60
0.5: $3,163.97
0.618: $3,543.34
0.786: $4,083.46
1.0: $4,771.47
ETH has moved significantly above the 0.236 Fibonacci level at $2,315.21.
The next major Fibonacci resistance is $2,784.60 — 0.382 Fib.
A sustained move through the $2,627–$2,785 resistance structure would bring the higher Fibonacci levels into focus.
🟢 Upside Scenario
ETH is consolidating near $2,577 after the recent recovery and is now approaching the upper resistance structure.
Immediate resistance:
$2,577.77
$2,627.42
$2,784.60 — 0.382 Fibonacci
$3,163.97 — 0.5 Fibonacci
$3,543.34 — 0.618 Fibonacci
A clean breakout and sustained close above the $2,627–$2,785 zone would provide stronger confirmation of continued recovery.
🎯 Target 1: $2,627.42
🎯 Target 2: $2,784.60 — 0.382 Fibonacci
🎯 Target 3: $3,163.97 — 0.5 Fibonacci
🎯 Target 4: $3,543.34 — 0.618 Fibonacci
🎯 Target 5: $4,083.46 — 0.786 Fibonacci
🎯 Target 6: $4,771.47 — 1.0 Fibonacci
A sustained move above $2,784.60 could strengthen the medium-term recovery structure and bring the $3,164–$3,543 region into focus.
🔴 Pullback Scenario
After the recent expansion, a retest of the breakout area would be normal.
Key supports:
$2,538.00
$2,529.05
$2,503.11
$2,479.36 — 20 EMA
$2,479.06
$2,475.84
$2,454.11
$2,405.75
$2,319.51 — 50 EMA
The $2,475–$2,540 zone is particularly important.
If ETH continues to hold this area during a pullback, the current recovery structure remains active.
A sustained loss of the $2,475–$2,454 area would weaken the short-term structure and could expose the lower $2,405–$2,320 region.
🧠 Market Structure & Liquidity
ETH has formed a clear recovery structure after sweeping liquidity around the $2,280–$2,360 region.
The recent move produced a strong breakout from the previous consolidation and pushed price toward the $2,600 area.
ETH is now moving through an important:
Recovery → Breakout → Consolidation → Continuation
structure.
The major upside liquidity is concentrated around $2,627–$2,785. A decisive move through this zone would place $3,163.97 as the next major Fibonacci reference.
📊 RSI Momentum
RSI (14): 60.38
RSI remains above the neutral 50 level and is currently around 60, showing positive momentum.
The RSI signal line is around 59.90, keeping momentum relatively balanced near the 60 area.
A sustained RSI above 60 would support continued momentum, while a move back below 50 would indicate increasing short-term weakness.
🎯 Key Levels
🔴 Major Resistance: $2,627.42 → $2,784.60 → $3,163.97 → $3,543.34
🟢 Major Support: $2,538.00 → $2,529.05 → $2,503.11 → $2,479.36 → $2,454.11
📉 Dynamic EMA Support: $2,479.36 — 20 EMA | $2,319.51 — 50 EMA | $2,221.92 — 200 EMA | $2,188.20 — 100 EMA
🚀 Upside References: $2,784.60 → $3,163.97 → $3,543.34 → $4,083.46
📌 Final Outlook
ETH's broader structure remains constructive after the recent recovery, with price now holding around $2,577 and above the major $2,475–$2,540 support structure.
The $2,475–$2,540 area is now an important short-term support region, while $2,627–$2,785 remains the immediate major resistance zone.
A confirmed move above $2,784.60 could open the path toward $3,163.97, followed by $3,543.34 and potentially $4,083.46.
However, rejection from the upper resistance area followed by a sustained loss of $2,454.11 would weaken the current structure and bring the lower support zones back into focus.
Bias: 🟢 Recovery structure intact above $2,454.11. A sustained move above $2,784.60 could open the path toward $3,163.97, with $3,543.34 as the next major Fibonacci reference.
$ETH
{future}(ETHUSDT)
ETH Technical Outlook: Ethereum Holds Near $2.58K as Recovery Continues
ETH is currently trading around $2,577, holding above the $2,500–$2,540 support area after the recent recovery from the $2,280–$2,360 demand zone.
The broader recovery structure remains constructive, with price now approaching the important $2,627–$2,785 resistance zone. The $2,784.60 level is the major 0.382 Fibonacci reference on the chart.
📈 EMA Structure
20 EMA: $2,479.36
50 EMA: $2,319.51
100 EMA: $2,188.20
200 EMA: $2,221.92
ETH is currently trading well above the 20 EMA at $2,479.36.
The recovery above the 50 EMA at $2,319.51, 100 EMA at $2,188.20, and 200 EMA at $2,221.92 keeps the broader recovery structure constructive.
The 20 EMA is now acting as an important dynamic reference. A sustained hold above this level would keep the short-term structure supported.
📐 Fibonacci Levels
Key Fibonacci levels:
0.236: $2,315.21
0.382: $2,784.60
0.5: $3,163.97
0.618: $3,543.34
0.786: $4,083.46
1.0: $4,771.47
ETH has moved significantly above the 0.236 Fibonacci level at $2,315.21.
The next major Fibonacci resistance is $2,784.60 — 0.382 Fib.
A sustained move through the $2,627–$2,785 resistance structure would bring the higher Fibonacci levels into focus.
🟢 Upside Scenario
ETH is consolidating near $2,577 after the recent recovery and is now approaching the upper resistance structure.
Immediate resistance:
$2,577.77
$2,627.42
$2,784.60 — 0.382 Fibonacci
$3,163.97 — 0.5 Fibonacci
$3,543.34 — 0.618 Fibonacci
A clean breakout and sustained close above the $2,627–$2,785 zone would provide stronger confirmation of continued recovery.
🎯 Target 1: $2,627.42
🎯 Target 2: $2,784.60 — 0.382 Fibonacci
🎯 Target 3: $3,163.97 — 0.5 Fibonacci
🎯 Target 4: $3,543.34 — 0.618 Fibonacci
🎯 Target 5: $4,083.46 — 0.786 Fibonacci
🎯 Target 6: $4,771.47 — 1.0 Fibonacci
A sustained move above $2,784.60 could strengthen the medium-term recovery structure and bring the $3,164–$3,543 region into focus.
🔴 Pullback Scenario
After the recent expansion, a retest of the breakout area would be normal.
Key supports:
$2,538.00
$2,529.05
$2,503.11
$2,479.36 — 20 EMA
$2,479.06
$2,475.84
$2,454.11
$2,405.75
$2,319.51 — 50 EMA
The $2,475–$2,540 zone is particularly important.
If ETH continues to hold this area during a pullback, the current recovery structure remains active.
A sustained loss of the $2,475–$2,454 area would weaken the short-term structure and could expose the lower $2,405–$2,320 region.
🧠 Market Structure & Liquidity
ETH has formed a clear recovery structure after sweeping liquidity around the $2,280–$2,360 region.
The recent move produced a strong breakout from the previous consolidation and pushed price toward the $2,600 area.
ETH is now moving through an important:
Recovery → Breakout → Consolidation → Continuation
structure.
The major upside liquidity is concentrated around $2,627–$2,785. A decisive move through this zone would place $3,163.97 as the next major Fibonacci reference.
📊 RSI Momentum
RSI (14): 60.38
RSI remains above the neutral 50 level and is currently around 60, showing positive momentum.
The RSI signal line is around 59.90, keeping momentum relatively balanced near the 60 area.
A sustained RSI above 60 would support continued momentum, while a move back below 50 would indicate increasing short-term weakness.
🎯 Key Levels
🔴 Major Resistance: $2,627.42 → $2,784.60 → $3,163.97 → $3,543.34
🟢 Major Support: $2,538.00 → $2,529.05 → $2,503.11 → $2,479.36 → $2,454.11
📉 Dynamic EMA Support: $2,479.36 — 20 EMA | $2,319.51 — 50 EMA | $2,221.92 — 200 EMA | $2,188.20 — 100 EMA
🚀 Upside References: $2,784.60 → $3,163.97 → $3,543.34 → $4,083.46
📌 Final Outlook
ETH's broader structure remains constructive after the recent recovery, with price now holding around $2,577 and above the major $2,475–$2,540 support structure.
The $2,475–$2,540 area is now an important short-term support region, while $2,627–$2,785 remains the immediate major resistance zone.
A confirmed move above $2,784.60 could open the path toward $3,163.97, followed by $3,543.34 and potentially $4,083.46.
However, rejection from the upper resistance area followed by a sustained loss of $2,454.11 would weaken the current structure and bring the lower support zones back into focus.
Bias: 🟢 Recovery structure intact above $2,454.11. A sustained move above $2,784.60 could open the path toward $3,163.97, with $3,543.34 as the next major Fibonacci reference.
$ETH
The broader recovery structure remains constructive, with price now approaching the important $2,627–$2,785 resistance zone. The $2,784.60 level is the major 0.382 Fibonacci reference on the chart.
📈 EMA Structure
20 EMA: $2,479.36
50 EMA: $2,319.51
100 EMA: $2,188.20
200 EMA: $2,221.92
ETH is currently trading well above the 20 EMA at $2,479.36.
The recovery above the 50 EMA at $2,319.51, 100 EMA at $2,188.20, and 200 EMA at $2,221.92 keeps the broader recovery structure constructive.
The 20 EMA is now acting as an important dynamic reference. A sustained hold above this level would keep the short-term structure supported.
📐 Fibonacci Levels
Key Fibonacci levels:
0.236: $2,315.21
0.382: $2,784.60
0.5: $3,163.97
0.618: $3,543.34
0.786: $4,083.46
1.0: $4,771.47
ETH has moved significantly above the 0.236 Fibonacci level at $2,315.21.
The next major Fibonacci resistance is $2,784.60 — 0.382 Fib.
A sustained move through the $2,627–$2,785 resistance structure would bring the higher Fibonacci levels into focus.
🟢 Upside Scenario
ETH is consolidating near $2,577 after the recent recovery and is now approaching the upper resistance structure.
Immediate resistance:
$2,577.77
$2,627.42
$2,784.60 — 0.382 Fibonacci
$3,163.97 — 0.5 Fibonacci
$3,543.34 — 0.618 Fibonacci
A clean breakout and sustained close above the $2,627–$2,785 zone would provide stronger confirmation of continued recovery.
🎯 Target 1: $2,627.42
🎯 Target 2: $2,784.60 — 0.382 Fibonacci
🎯 Target 3: $3,163.97 — 0.5 Fibonacci
🎯 Target 4: $3,543.34 — 0.618 Fibonacci
🎯 Target 5: $4,083.46 — 0.786 Fibonacci
🎯 Target 6: $4,771.47 — 1.0 Fibonacci
A sustained move above $2,784.60 could strengthen the medium-term recovery structure and bring the $3,164–$3,543 region into focus.
🔴 Pullback Scenario
After the recent expansion, a retest of the breakout area would be normal.
Key supports:
$2,538.00
$2,529.05
$2,503.11
$2,479.36 — 20 EMA
$2,479.06
$2,475.84
$2,454.11
$2,405.75
$2,319.51 — 50 EMA
The $2,475–$2,540 zone is particularly important.
If ETH continues to hold this area during a pullback, the current recovery structure remains active.
A sustained loss of the $2,475–$2,454 area would weaken the short-term structure and could expose the lower $2,405–$2,320 region.
🧠 Market Structure & Liquidity
ETH has formed a clear recovery structure after sweeping liquidity around the $2,280–$2,360 region.
The recent move produced a strong breakout from the previous consolidation and pushed price toward the $2,600 area.
ETH is now moving through an important:
Recovery → Breakout → Consolidation → Continuation
structure.
The major upside liquidity is concentrated around $2,627–$2,785. A decisive move through this zone would place $3,163.97 as the next major Fibonacci reference.
📊 RSI Momentum
RSI (14): 60.38
RSI remains above the neutral 50 level and is currently around 60, showing positive momentum.
The RSI signal line is around 59.90, keeping momentum relatively balanced near the 60 area.
A sustained RSI above 60 would support continued momentum, while a move back below 50 would indicate increasing short-term weakness.
🎯 Key Levels
🔴 Major Resistance: $2,627.42 → $2,784.60 → $3,163.97 → $3,543.34
🟢 Major Support: $2,538.00 → $2,529.05 → $2,503.11 → $2,479.36 → $2,454.11
📉 Dynamic EMA Support: $2,479.36 — 20 EMA | $2,319.51 — 50 EMA | $2,221.92 — 200 EMA | $2,188.20 — 100 EMA
🚀 Upside References: $2,784.60 → $3,163.97 → $3,543.34 → $4,083.46
📌 Final Outlook
ETH's broader structure remains constructive after the recent recovery, with price now holding around $2,577 and above the major $2,475–$2,540 support structure.
The $2,475–$2,540 area is now an important short-term support region, while $2,627–$2,785 remains the immediate major resistance zone.
A confirmed move above $2,784.60 could open the path toward $3,163.97, followed by $3,543.34 and potentially $4,083.46.
However, rejection from the upper resistance area followed by a sustained loss of $2,454.11 would weaken the current structure and bring the lower support zones back into focus.
Bias: 🟢 Recovery structure intact above $2,454.11. A sustained move above $2,784.60 could open the path toward $3,163.97, with $3,543.34 as the next major Fibonacci reference.
$ETH
65
·
--
記事
翻訳参照
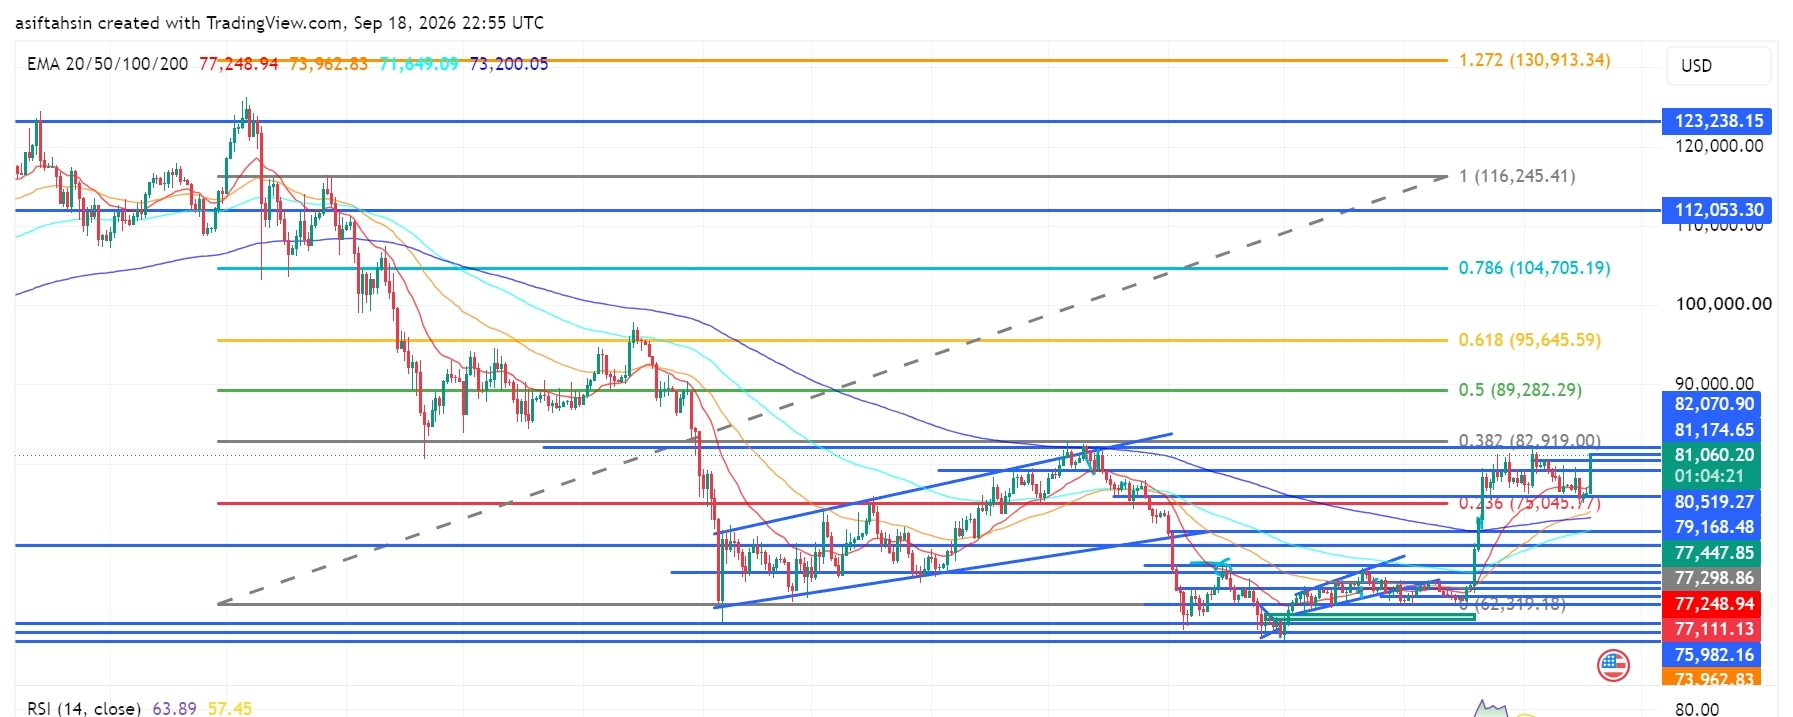
BTC Technical Outlook: Bitcoin Reclaims $81K as Recovery Structure StrengthensBTC is currently trading around $81,060, holding above the $79,000–$80,000 region after the recent recovery from the $73,000–$76,000 demand area.
The broader structure has improved, with price reclaiming the $80K area and moving back toward the major $82,070–$82,919 resistance zone. A sustained move through this area would put the higher Fibonacci levels back into focus.
📈 EMA Structure
20 EMA: $77,248.95
50 EMA: $73,962.83
100 EMA: $71,649.09
200 EMA: $73,200.05
BTC is currently trading well above the 20 EMA at $77,248.95.
The recovery above the 50 EMA at $73,962.83, 100 EMA at $71,649.09, and 200 EMA at $73,200.05 keeps the broader recovery structure constructive.
The 20 EMA has moved above the longer-term EMA levels, showing improving short-term structure.
📐 Fibonacci Levels
Key Fibonacci levels:
0.236: $75,045.77
0.382: $82,919.00
0.5: $89,282.29
0.618: $95,645.59
0.786: $104,705.19
1.0: $116,245.41
1.272: $130,913.34
BTC is currently trading between the 0.236 and 0.382 Fibonacci levels.
The next major Fibonacci reference is $82,919 — 0.382 Fib.
A sustained move above the $82,070–$82,919 zone could bring $89,282 into focus, followed by $95,645.
🟢 Bullish Scenario
BTC has recovered strongly from the lower support structure and is now consolidating around $80K–$81K.
Immediate resistance:
$81,174.65
$82,070.90
$82,919.00 — 0.382 Fibonacci
$89,282.29 — 0.5 Fibonacci
$95,645.59 — 0.618 Fibonacci
A clean breakout and sustained close above $82,070–$82,919 would provide stronger confirmation of continued recovery.
🎯 Target 1: $82,070
🎯 Target 2: $82,919 — 0.382 Fibonacci
🎯 Target 3: $89,282 — 0.5 Fibonacci
🎯 Target 4: $95,645 — 0.618 Fibonacci
🎯 Target 5: $104,705 — 0.786 Fibonacci
🎯 Target 6: $116,245 — 1.0 Fibonacci
A confirmed move through the $82K–$83K zone could strengthen the medium-term recovery structure and bring the $89K–$95K region into focus.
🔴 Pullback Scenario
After the recent expansion above $80K, a retest of the breakout area would be normal.
Key supports:
$80,519.27
$79,168.48
$77,447.85
$77,298.86
$77,248.95 — 20 EMA
$77,111.13
$75,982.16
$75,045.77 — 0.236 Fibonacci
$73,962.83 — 50 EMA
$73,200.05 — 200 EMA
The $77K–$80K zone is particularly important.
If BTC continues to hold this area during a pullback, the current recovery structure remains active.
A sustained loss of $75,045 would weaken the current recovery structure and bring the lower EMA region back into focus.
🧠 Market Structure & Liquidity
BTC has formed a recovery structure after sweeping liquidity around the $73K–$76K region.
The recent move produced a strong recovery through $77K, followed by a breakout above $80K.
BTC is now moving through an important:
Recovery → Breakout → Retest → Consolidation → Continuation
structure.
The major upside liquidity is concentrated around $81K–$83K. A decisive move through this area would place $89,282 as the next major Fibonacci reference.
📊 RSI Momentum
RSI (14): 63.89
RSI has moved above the neutral 50 level and remains in positive territory after the recent expansion.
The current reading shows stronger short-term momentum, while still remaining below the traditional 70 overbought threshold.
A sustained RSI above 60 would keep momentum supportive, while a move back below 50 would indicate increasing short-term weakness.
🎯 Key Levels
🔴 Major Resistance: $81,174.65 → $82,070.90 → $82,919 → $89,282 → $95,645
🟢 Major Support: $80,519 → $79,168 → $77,447 → $77,249 → $75,982 → $75,045
📉 Dynamic EMA Support: $77,248.95 — 20 EMA | $73,962.83 — 50 EMA | $73,200.05 — 200 EMA | $71,649.09 — 100 EMA
🚀 Upside References: $82,919 → $89,282 → $95,645 → $104,705 → $116,245
📌 Final Outlook
BTC's broader structure has strengthened after the recent recovery, with price now holding around $81K and above the major $77K–$80K support structure.
The $77K–$80K area is now an important short-term support region, while $82K–$83K remains the immediate major resistance zone.
A confirmed move above $82,919 could open the path toward $89,282, followed by $95,645 and $104,705.
However, rejection from the upper resistance area followed by a sustained loss of $75,045 would weaken the current recovery structure and bring the lower support zones back into focus.
Bias: 🟢 Recovery structure intact above $75,045. A sustained move above $82,919 could open the path toward $89,282, with $95,645 as the next major Fibonacci reference.
$BTC
{future}(BTCUSDT)
BTC Technical Outlook: Bitcoin Reclaims $81K as Recovery Structure Strengthens
BTC is currently trading around $81,060, holding above the $79,000–$80,000 region after the recent recovery from the $73,000–$76,000 demand area.
The broader structure has improved, with price reclaiming the $80K area and moving back toward the major $82,070–$82,919 resistance zone. A sustained move through this area would put the higher Fibonacci levels back into focus.
📈 EMA Structure
20 EMA: $77,248.95
50 EMA: $73,962.83
100 EMA: $71,649.09
200 EMA: $73,200.05
BTC is currently trading well above the 20 EMA at $77,248.95.
The recovery above the 50 EMA at $73,962.83, 100 EMA at $71,649.09, and 200 EMA at $73,200.05 keeps the broader recovery structure constructive.
The 20 EMA has moved above the longer-term EMA levels, showing improving short-term structure.
📐 Fibonacci Levels
Key Fibonacci levels:
0.236: $75,045.77
0.382: $82,919.00
0.5: $89,282.29
0.618: $95,645.59
0.786: $104,705.19
1.0: $116,245.41
1.272: $130,913.34
BTC is currently trading between the 0.236 and 0.382 Fibonacci levels.
The next major Fibonacci reference is $82,919 — 0.382 Fib.
A sustained move above the $82,070–$82,919 zone could bring $89,282 into focus, followed by $95,645.
🟢 Bullish Scenario
BTC has recovered strongly from the lower support structure and is now consolidating around $80K–$81K.
Immediate resistance:
$81,174.65
$82,070.90
$82,919.00 — 0.382 Fibonacci
$89,282.29 — 0.5 Fibonacci
$95,645.59 — 0.618 Fibonacci
A clean breakout and sustained close above $82,070–$82,919 would provide stronger confirmation of continued recovery.
🎯 Target 1: $82,070
🎯 Target 2: $82,919 — 0.382 Fibonacci
🎯 Target 3: $89,282 — 0.5 Fibonacci
🎯 Target 4: $95,645 — 0.618 Fibonacci
🎯 Target 5: $104,705 — 0.786 Fibonacci
🎯 Target 6: $116,245 — 1.0 Fibonacci
A confirmed move through the $82K–$83K zone could strengthen the medium-term recovery structure and bring the $89K–$95K region into focus.
🔴 Pullback Scenario
After the recent expansion above $80K, a retest of the breakout area would be normal.
Key supports:
$80,519.27
$79,168.48
$77,447.85
$77,298.86
$77,248.95 — 20 EMA
$77,111.13
$75,982.16
$75,045.77 — 0.236 Fibonacci
$73,962.83 — 50 EMA
$73,200.05 — 200 EMA
The $77K–$80K zone is particularly important.
If BTC continues to hold this area during a pullback, the current recovery structure remains active.
A sustained loss of $75,045 would weaken the current recovery structure and bring the lower EMA region back into focus.
🧠 Market Structure & Liquidity
BTC has formed a recovery structure after sweeping liquidity around the $73K–$76K region.
The recent move produced a strong recovery through $77K, followed by a breakout above $80K.
BTC is now moving through an important:
Recovery → Breakout → Retest → Consolidation → Continuation
structure.
The major upside liquidity is concentrated around $81K–$83K. A decisive move through this area would place $89,282 as the next major Fibonacci reference.
📊 RSI Momentum
RSI (14): 63.89
RSI has moved above the neutral 50 level and remains in positive territory after the recent expansion.
The current reading shows stronger short-term momentum, while still remaining below the traditional 70 overbought threshold.
A sustained RSI above 60 would keep momentum supportive, while a move back below 50 would indicate increasing short-term weakness.
🎯 Key Levels
🔴 Major Resistance: $81,174.65 → $82,070.90 → $82,919 → $89,282 → $95,645
🟢 Major Support: $80,519 → $79,168 → $77,447 → $77,249 → $75,982 → $75,045
📉 Dynamic EMA Support: $77,248.95 — 20 EMA | $73,962.83 — 50 EMA | $73,200.05 — 200 EMA | $71,649.09 — 100 EMA
🚀 Upside References: $82,919 → $89,282 → $95,645 → $104,705 → $116,245
📌 Final Outlook
BTC's broader structure has strengthened after the recent recovery, with price now holding around $81K and above the major $77K–$80K support structure.
The $77K–$80K area is now an important short-term support region, while $82K–$83K remains the immediate major resistance zone.
A confirmed move above $82,919 could open the path toward $89,282, followed by $95,645 and $104,705.
However, rejection from the upper resistance area followed by a sustained loss of $75,045 would weaken the current recovery structure and bring the lower support zones back into focus.
Bias: 🟢 Recovery structure intact above $75,045. A sustained move above $82,919 could open the path toward $89,282, with $95,645 as the next major Fibonacci reference.
$BTC
The broader structure has improved, with price reclaiming the $80K area and moving back toward the major $82,070–$82,919 resistance zone. A sustained move through this area would put the higher Fibonacci levels back into focus.
📈 EMA Structure
20 EMA: $77,248.95
50 EMA: $73,962.83
100 EMA: $71,649.09
200 EMA: $73,200.05
BTC is currently trading well above the 20 EMA at $77,248.95.
The recovery above the 50 EMA at $73,962.83, 100 EMA at $71,649.09, and 200 EMA at $73,200.05 keeps the broader recovery structure constructive.
The 20 EMA has moved above the longer-term EMA levels, showing improving short-term structure.
📐 Fibonacci Levels
Key Fibonacci levels:
0.236: $75,045.77
0.382: $82,919.00
0.5: $89,282.29
0.618: $95,645.59
0.786: $104,705.19
1.0: $116,245.41
1.272: $130,913.34
BTC is currently trading between the 0.236 and 0.382 Fibonacci levels.
The next major Fibonacci reference is $82,919 — 0.382 Fib.
A sustained move above the $82,070–$82,919 zone could bring $89,282 into focus, followed by $95,645.
🟢 Bullish Scenario
BTC has recovered strongly from the lower support structure and is now consolidating around $80K–$81K.
Immediate resistance:
$81,174.65
$82,070.90
$82,919.00 — 0.382 Fibonacci
$89,282.29 — 0.5 Fibonacci
$95,645.59 — 0.618 Fibonacci
A clean breakout and sustained close above $82,070–$82,919 would provide stronger confirmation of continued recovery.
🎯 Target 1: $82,070
🎯 Target 2: $82,919 — 0.382 Fibonacci
🎯 Target 3: $89,282 — 0.5 Fibonacci
🎯 Target 4: $95,645 — 0.618 Fibonacci
🎯 Target 5: $104,705 — 0.786 Fibonacci
🎯 Target 6: $116,245 — 1.0 Fibonacci
A confirmed move through the $82K–$83K zone could strengthen the medium-term recovery structure and bring the $89K–$95K region into focus.
🔴 Pullback Scenario
After the recent expansion above $80K, a retest of the breakout area would be normal.
Key supports:
$80,519.27
$79,168.48
$77,447.85
$77,298.86
$77,248.95 — 20 EMA
$77,111.13
$75,982.16
$75,045.77 — 0.236 Fibonacci
$73,962.83 — 50 EMA
$73,200.05 — 200 EMA
The $77K–$80K zone is particularly important.
If BTC continues to hold this area during a pullback, the current recovery structure remains active.
A sustained loss of $75,045 would weaken the current recovery structure and bring the lower EMA region back into focus.
🧠 Market Structure & Liquidity
BTC has formed a recovery structure after sweeping liquidity around the $73K–$76K region.
The recent move produced a strong recovery through $77K, followed by a breakout above $80K.
BTC is now moving through an important:
Recovery → Breakout → Retest → Consolidation → Continuation
structure.
The major upside liquidity is concentrated around $81K–$83K. A decisive move through this area would place $89,282 as the next major Fibonacci reference.
📊 RSI Momentum
RSI (14): 63.89
RSI has moved above the neutral 50 level and remains in positive territory after the recent expansion.
The current reading shows stronger short-term momentum, while still remaining below the traditional 70 overbought threshold.
A sustained RSI above 60 would keep momentum supportive, while a move back below 50 would indicate increasing short-term weakness.
🎯 Key Levels
🔴 Major Resistance: $81,174.65 → $82,070.90 → $82,919 → $89,282 → $95,645
🟢 Major Support: $80,519 → $79,168 → $77,447 → $77,249 → $75,982 → $75,045
📉 Dynamic EMA Support: $77,248.95 — 20 EMA | $73,962.83 — 50 EMA | $73,200.05 — 200 EMA | $71,649.09 — 100 EMA
🚀 Upside References: $82,919 → $89,282 → $95,645 → $104,705 → $116,245
📌 Final Outlook
BTC's broader structure has strengthened after the recent recovery, with price now holding around $81K and above the major $77K–$80K support structure.
The $77K–$80K area is now an important short-term support region, while $82K–$83K remains the immediate major resistance zone.
A confirmed move above $82,919 could open the path toward $89,282, followed by $95,645 and $104,705.
However, rejection from the upper resistance area followed by a sustained loss of $75,045 would weaken the current recovery structure and bring the lower support zones back into focus.
Bias: 🟢 Recovery structure intact above $75,045. A sustained move above $82,919 could open the path toward $89,282, with $95,645 as the next major Fibonacci reference.
$BTC
12
·
--
記事
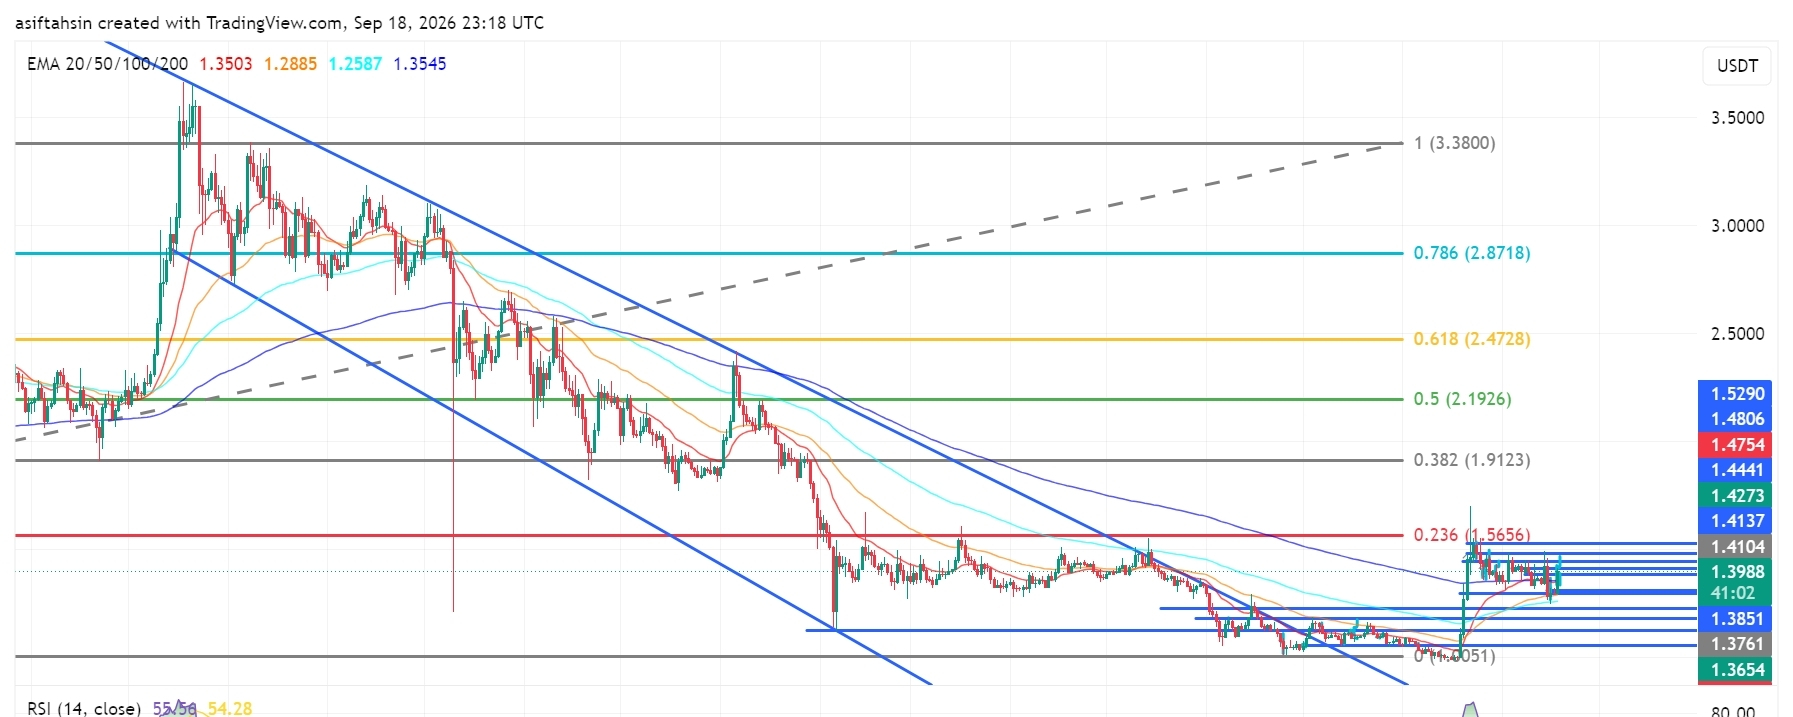
XRPテクニカル見通し:XRPは$1.40付近を維持、ブルはブレイクアウトを守るXRPは現在、$1.40前後で推移しており、8月の安値からの強い回復と、直前の下降トレンド構造からの急激なブレイクアウトの後、値固めしています。
より広い構造は大幅に改善しており、XRPは現在、20・50・100の各EMAの上で取引されています。とはいえ、価格は現在、$1.41〜$1.43あたりの重要なレジスタンスの群に直面しています。ブルは、このゾーンを明確に上抜けして、さらなる上昇拡大を確認する必要があります。
📈 EMA構造
20 EMA: $1.3503
50 EMA: $1.2885
100 EMA: $1.2586
200 EMA: $1.3545
XRPは現在、4つの主要なEMAすべての上で推移しており、回復の構造は建設的です。
XRPテクニカル見通し:XRPは$1.40付近を維持、ブルはブレイクアウトを守る
XRPは現在、$1.40前後で推移しており、8月の安値からの強い回復と、直前の下降トレンド構造からの急激なブレイクアウトの後、値固めしています。
より広い構造は大幅に改善しており、XRPは現在、20・50・100の各EMAの上で取引されています。とはいえ、価格は現在、$1.41〜$1.43あたりの重要なレジスタンスの群に直面しています。ブルは、このゾーンを明確に上抜けして、さらなる上昇拡大を確認する必要があります。
📈 EMA構造
20 EMA: $1.3503
50 EMA: $1.2885
100 EMA: $1.2586
200 EMA: $1.3545
XRPは現在、4つの主要なEMAすべての上で推移しており、回復の構造は建設的です。
より広い構造は大幅に改善しており、XRPは現在、20・50・100の各EMAの上で取引されています。とはいえ、価格は現在、$1.41〜$1.43あたりの重要なレジスタンスの群に直面しています。ブルは、このゾーンを明確に上抜けして、さらなる上昇拡大を確認する必要があります。
📈 EMA構造
20 EMA: $1.3503
50 EMA: $1.2885
100 EMA: $1.2586
200 EMA: $1.3545
XRPは現在、4つの主要なEMAすべての上で推移しており、回復の構造は建設的です。
276
·
--
記事
翻訳参照
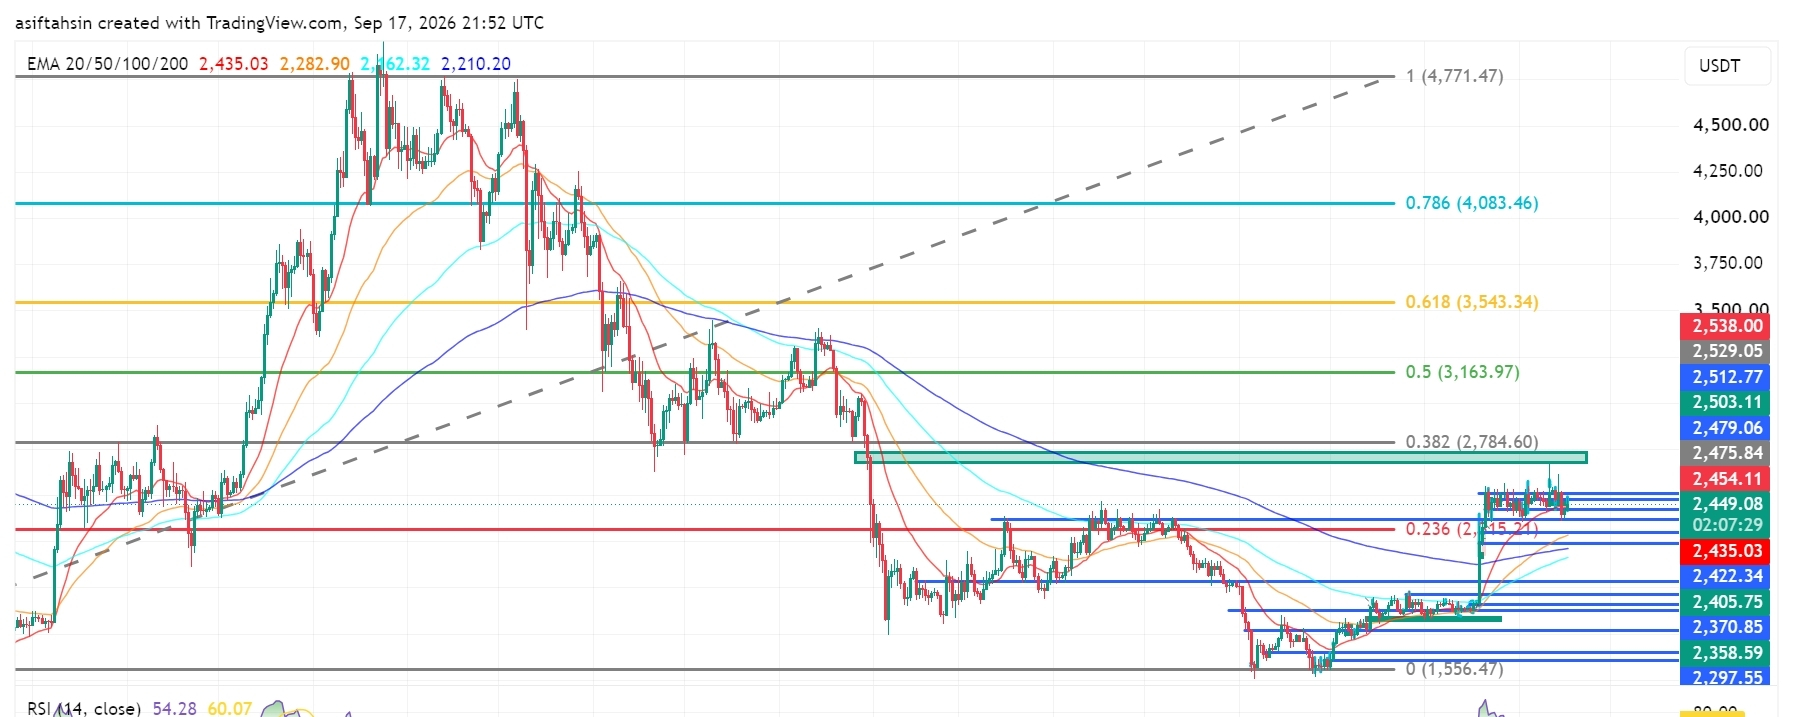
ETH Technical Outlook: Ethereum Holds Above $2.4K as Recovery Structure BuildsETH is currently trading around $2,450, holding above the $2,405–$2,435 support area after the recent recovery from the $2,300–$2,360 demand zone.
The broader structure is improving, but ETH is now consolidating below the $2,475–$2,538 resistance cluster. The next major chart area is around $2,784.60, which aligns with the 0.382 Fibonacci level.
📈 EMA Structure
20 EMA: $2,435.06
50 EMA: $2,282.92
100 EMA: $2,162.32
200 EMA: $2,210.20
ETH is currently trading above the 20 EMA at $2,435.06.
The recovery above the 50 EMA at $2,282.92, 100 EMA at $2,162.32, and 200 EMA at $2,210.20 keeps the broader recovery structure constructive.
A sustained hold above the 20 EMA would support short-term momentum, while losing the $2,210–$2,283 area would weaken the current structure.
📐 Fibonacci Levels
Key Fibonacci levels:
0.236: $2,315.21
0.382: $2,784.60
0.5: $3,163.97
0.618: $3,543.34
0.786: $4,083.46
1.0: $4,771.47
ETH is currently holding well above the 0.236 Fibonacci level at $2,315.21.
The next major Fibonacci resistance is $2,784.60 — 0.382 Fib.
A sustained move through the $2,475–$2,538 resistance structure could place the $2,784.60 region into focus.
🟢 Bullish Scenario
ETH is consolidating after the recent recovery and is currently holding above the $2,435 area.
Immediate resistance:
$2,454.11
$2,475.84
$2,479.06
$2,503.11
$2,512.77
$2,529.05
$2,538.00
$2,784.60 — 0.382 Fibonacci
A clean breakout and sustained close above the $2,529–$2,538 zone would provide stronger confirmation of continued recovery.
🎯 Target 1: $2,475.84
🎯 Target 2: $2,503.11
🎯 Target 3: $2,529.05
🎯 Target 4: $2,538.00
🎯 Target 5: $2,784.60 — 0.382 Fibonacci
🎯 Target 6: $3,163.97 — 0.5 Fibonacci
A confirmed move above $2,538 could strengthen the medium-term recovery structure and bring the $2,784–$3,164 region into focus.
🔴 Pullback Scenario
After the recent recovery, a retest of the breakout area would be normal.
Key supports:
$2,449.37
$2,435.06 — 20 EMA
$2,422.34
$2,405.75
$2,370.85
$2,358.59
$2,297.55
$2,282.92 — 50 EMA
$2,210.20 — 200 EMA
The $2,405–$2,435 zone is particularly important.
If ETH continues to hold this area during a pullback, the current recovery structure remains active.
A sustained loss of $2,282.92 would weaken the broader structure and could expose the $2,210–$2,162 area.
🧠 Market Structure & Liquidity
ETH has formed a clear recovery structure after sweeping liquidity around the $2,280–$2,360 region.
The recent move produced a strong recovery followed by a breakout above the previous consolidation area.
ETH is now moving through an important:
Recovery → Breakout → Retest → Consolidation
structure.
The major upside liquidity is concentrated around $2,475–$2,538. A decisive move through this zone would place $2,784.60 as the next major Fibonacci reference.
📊 RSI Momentum
RSI (14): 54.28
RSI remains above the neutral 50 level after the recent recovery.
The current reading shows moderately positive momentum, while the RSI signal line is around 60.07.
A sustained RSI move above 55–60 would indicate improving momentum toward the upper resistance area.
A move back below 50 would indicate increasing short-term momentum weakness.
🎯 Key Levels
🔴 Major Resistance: $2,454.11 → $2,475.84 → $2,503.11 → $2,529.05 → $2,538.00
🟢 Major Support: $2,435.06 → $2,422.34 → $2,405.75 → $2,370.85 → $2,358.59
📉 Dynamic EMA Support: $2,435.06 — 20 EMA | $2,282.92 — 50 EMA | $2,210.20 — 200 EMA | $2,162.32 — 100 EMA
🚀 Upside References: $2,538 → $2,784.60 → $3,163.97 → $3,543.34
📌 Final Outlook
ETH's broader structure remains constructive after the recent recovery, with price holding above the $2,405–$2,435 area.
The $2,405–$2,435 zone is now an important short-term support region. As long as ETH maintains this area, the current recovery structure remains active.
The immediate battle is around $2,475–$2,538. A confirmed move above $2,538 could open the path toward $2,784.60, followed by $3,163.97.
However, rejection from resistance followed by a sustained loss of $2,282.92 would weaken the broader structure and increase the possibility of a deeper retracement toward the $2,210–$2,162 area.
Bias: 🟢 Recovery structure intact above $2,282.92. A breakout above $2,538 could open the path toward $2,784.60, with $3,163.97 as the next major Fibonacci reference.
$ETH
{future}(ETHUSDT)
ETH Technical Outlook: Ethereum Holds Above $2.4K as Recovery Structure Builds
ETH is currently trading around $2,450, holding above the $2,405–$2,435 support area after the recent recovery from the $2,300–$2,360 demand zone.
The broader structure is improving, but ETH is now consolidating below the $2,475–$2,538 resistance cluster. The next major chart area is around $2,784.60, which aligns with the 0.382 Fibonacci level.
📈 EMA Structure
20 EMA: $2,435.06
50 EMA: $2,282.92
100 EMA: $2,162.32
200 EMA: $2,210.20
ETH is currently trading above the 20 EMA at $2,435.06.
The recovery above the 50 EMA at $2,282.92, 100 EMA at $2,162.32, and 200 EMA at $2,210.20 keeps the broader recovery structure constructive.
A sustained hold above the 20 EMA would support short-term momentum, while losing the $2,210–$2,283 area would weaken the current structure.
📐 Fibonacci Levels
Key Fibonacci levels:
0.236: $2,315.21
0.382: $2,784.60
0.5: $3,163.97
0.618: $3,543.34
0.786: $4,083.46
1.0: $4,771.47
ETH is currently holding well above the 0.236 Fibonacci level at $2,315.21.
The next major Fibonacci resistance is $2,784.60 — 0.382 Fib.
A sustained move through the $2,475–$2,538 resistance structure could place the $2,784.60 region into focus.
🟢 Bullish Scenario
ETH is consolidating after the recent recovery and is currently holding above the $2,435 area.
Immediate resistance:
$2,454.11
$2,475.84
$2,479.06
$2,503.11
$2,512.77
$2,529.05
$2,538.00
$2,784.60 — 0.382 Fibonacci
A clean breakout and sustained close above the $2,529–$2,538 zone would provide stronger confirmation of continued recovery.
🎯 Target 1: $2,475.84
🎯 Target 2: $2,503.11
🎯 Target 3: $2,529.05
🎯 Target 4: $2,538.00
🎯 Target 5: $2,784.60 — 0.382 Fibonacci
🎯 Target 6: $3,163.97 — 0.5 Fibonacci
A confirmed move above $2,538 could strengthen the medium-term recovery structure and bring the $2,784–$3,164 region into focus.
🔴 Pullback Scenario
After the recent recovery, a retest of the breakout area would be normal.
Key supports:
$2,449.37
$2,435.06 — 20 EMA
$2,422.34
$2,405.75
$2,370.85
$2,358.59
$2,297.55
$2,282.92 — 50 EMA
$2,210.20 — 200 EMA
The $2,405–$2,435 zone is particularly important.
If ETH continues to hold this area during a pullback, the current recovery structure remains active.
A sustained loss of $2,282.92 would weaken the broader structure and could expose the $2,210–$2,162 area.
🧠 Market Structure & Liquidity
ETH has formed a clear recovery structure after sweeping liquidity around the $2,280–$2,360 region.
The recent move produced a strong recovery followed by a breakout above the previous consolidation area.
ETH is now moving through an important:
Recovery → Breakout → Retest → Consolidation
structure.
The major upside liquidity is concentrated around $2,475–$2,538. A decisive move through this zone would place $2,784.60 as the next major Fibonacci reference.
📊 RSI Momentum
RSI (14): 54.28
RSI remains above the neutral 50 level after the recent recovery.
The current reading shows moderately positive momentum, while the RSI signal line is around 60.07.
A sustained RSI move above 55–60 would indicate improving momentum toward the upper resistance area.
A move back below 50 would indicate increasing short-term momentum weakness.
🎯 Key Levels
🔴 Major Resistance: $2,454.11 → $2,475.84 → $2,503.11 → $2,529.05 → $2,538.00
🟢 Major Support: $2,435.06 → $2,422.34 → $2,405.75 → $2,370.85 → $2,358.59
📉 Dynamic EMA Support: $2,435.06 — 20 EMA | $2,282.92 — 50 EMA | $2,210.20 — 200 EMA | $2,162.32 — 100 EMA
🚀 Upside References: $2,538 → $2,784.60 → $3,163.97 → $3,543.34
📌 Final Outlook
ETH's broader structure remains constructive after the recent recovery, with price holding above the $2,405–$2,435 area.
The $2,405–$2,435 zone is now an important short-term support region. As long as ETH maintains this area, the current recovery structure remains active.
The immediate battle is around $2,475–$2,538. A confirmed move above $2,538 could open the path toward $2,784.60, followed by $3,163.97.
However, rejection from resistance followed by a sustained loss of $2,282.92 would weaken the broader structure and increase the possibility of a deeper retracement toward the $2,210–$2,162 area.
Bias: 🟢 Recovery structure intact above $2,282.92. A breakout above $2,538 could open the path toward $2,784.60, with $3,163.97 as the next major Fibonacci reference.
$ETH
The broader structure is improving, but ETH is now consolidating below the $2,475–$2,538 resistance cluster. The next major chart area is around $2,784.60, which aligns with the 0.382 Fibonacci level.
📈 EMA Structure
20 EMA: $2,435.06
50 EMA: $2,282.92
100 EMA: $2,162.32
200 EMA: $2,210.20
ETH is currently trading above the 20 EMA at $2,435.06.
The recovery above the 50 EMA at $2,282.92, 100 EMA at $2,162.32, and 200 EMA at $2,210.20 keeps the broader recovery structure constructive.
A sustained hold above the 20 EMA would support short-term momentum, while losing the $2,210–$2,283 area would weaken the current structure.
📐 Fibonacci Levels
Key Fibonacci levels:
0.236: $2,315.21
0.382: $2,784.60
0.5: $3,163.97
0.618: $3,543.34
0.786: $4,083.46
1.0: $4,771.47
ETH is currently holding well above the 0.236 Fibonacci level at $2,315.21.
The next major Fibonacci resistance is $2,784.60 — 0.382 Fib.
A sustained move through the $2,475–$2,538 resistance structure could place the $2,784.60 region into focus.
🟢 Bullish Scenario
ETH is consolidating after the recent recovery and is currently holding above the $2,435 area.
Immediate resistance:
$2,454.11
$2,475.84
$2,479.06
$2,503.11
$2,512.77
$2,529.05
$2,538.00
$2,784.60 — 0.382 Fibonacci
A clean breakout and sustained close above the $2,529–$2,538 zone would provide stronger confirmation of continued recovery.
🎯 Target 1: $2,475.84
🎯 Target 2: $2,503.11
🎯 Target 3: $2,529.05
🎯 Target 4: $2,538.00
🎯 Target 5: $2,784.60 — 0.382 Fibonacci
🎯 Target 6: $3,163.97 — 0.5 Fibonacci
A confirmed move above $2,538 could strengthen the medium-term recovery structure and bring the $2,784–$3,164 region into focus.
🔴 Pullback Scenario
After the recent recovery, a retest of the breakout area would be normal.
Key supports:
$2,449.37
$2,435.06 — 20 EMA
$2,422.34
$2,405.75
$2,370.85
$2,358.59
$2,297.55
$2,282.92 — 50 EMA
$2,210.20 — 200 EMA
The $2,405–$2,435 zone is particularly important.
If ETH continues to hold this area during a pullback, the current recovery structure remains active.
A sustained loss of $2,282.92 would weaken the broader structure and could expose the $2,210–$2,162 area.
🧠 Market Structure & Liquidity
ETH has formed a clear recovery structure after sweeping liquidity around the $2,280–$2,360 region.
The recent move produced a strong recovery followed by a breakout above the previous consolidation area.
ETH is now moving through an important:
Recovery → Breakout → Retest → Consolidation
structure.
The major upside liquidity is concentrated around $2,475–$2,538. A decisive move through this zone would place $2,784.60 as the next major Fibonacci reference.
📊 RSI Momentum
RSI (14): 54.28
RSI remains above the neutral 50 level after the recent recovery.
The current reading shows moderately positive momentum, while the RSI signal line is around 60.07.
A sustained RSI move above 55–60 would indicate improving momentum toward the upper resistance area.
A move back below 50 would indicate increasing short-term momentum weakness.
🎯 Key Levels
🔴 Major Resistance: $2,454.11 → $2,475.84 → $2,503.11 → $2,529.05 → $2,538.00
🟢 Major Support: $2,435.06 → $2,422.34 → $2,405.75 → $2,370.85 → $2,358.59
📉 Dynamic EMA Support: $2,435.06 — 20 EMA | $2,282.92 — 50 EMA | $2,210.20 — 200 EMA | $2,162.32 — 100 EMA
🚀 Upside References: $2,538 → $2,784.60 → $3,163.97 → $3,543.34
📌 Final Outlook
ETH's broader structure remains constructive after the recent recovery, with price holding above the $2,405–$2,435 area.
The $2,405–$2,435 zone is now an important short-term support region. As long as ETH maintains this area, the current recovery structure remains active.
The immediate battle is around $2,475–$2,538. A confirmed move above $2,538 could open the path toward $2,784.60, followed by $3,163.97.
However, rejection from resistance followed by a sustained loss of $2,282.92 would weaken the broader structure and increase the possibility of a deeper retracement toward the $2,210–$2,162 area.
Bias: 🟢 Recovery structure intact above $2,282.92. A breakout above $2,538 could open the path toward $2,784.60, with $3,163.97 as the next major Fibonacci reference.
$ETH
75
·
--
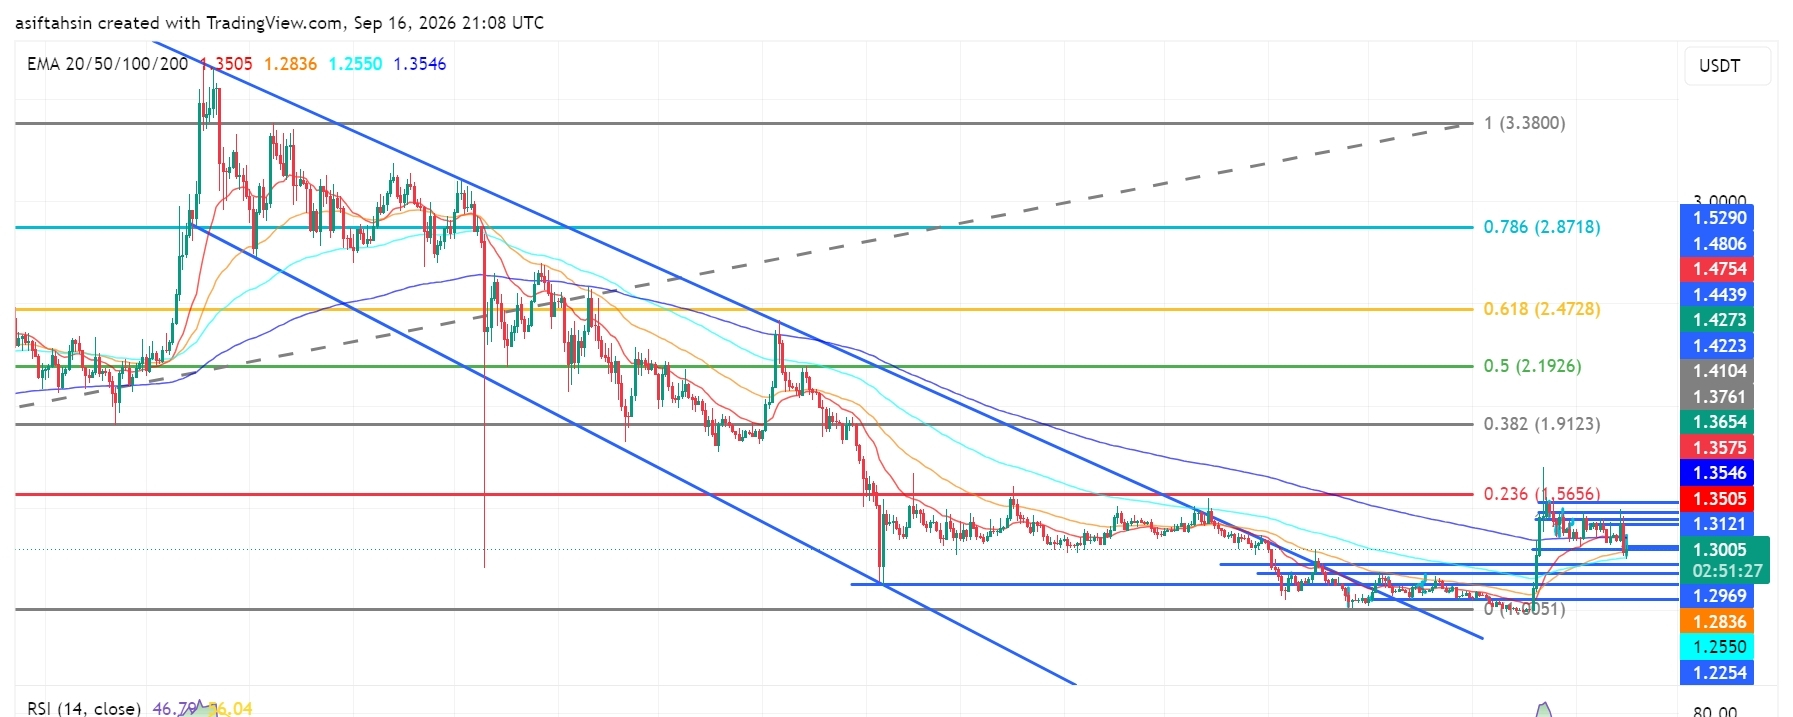
記事
XRPのテクニカル見通し:急な下落の後、XRPは$1.30付近でレンジ調整XRPは、$1.35〜$1.43のゾーンから急反発した後、チャート上でおよそ$1.30付近で推移しています。価格はブレイクアウト領域に向けて戻している一方で、より広いチャートは$1.20〜$1.25のゾーンからの回復局面が続いています。現在のモメンタムは中立で、RSIは50を下回っています。
📈 EMA構造
20 EMA: $1.3505
50 EMA: $1.2836
100 EMA: $1.2550
200 EMA: $1.3546
XRPは現在、20 EMAおよび200 EMAより下にあります。50 EMAと100 EMAは依然として価格の下側に位置しています。$1.35の水準を取り戻せれば、短期的な構造は改善します。
XRPのテクニカル見通し:急な下落の後、XRPは$1.30付近でレンジ調整
XRPは、$1.35〜$1.43のゾーンから急反発した後、チャート上でおよそ$1.30付近で推移しています。価格はブレイクアウト領域に向けて戻している一方で、より広いチャートは$1.20〜$1.25のゾーンからの回復局面が続いています。現在のモメンタムは中立で、RSIは50を下回っています。
📈 EMA構造
20 EMA: $1.3505
50 EMA: $1.2836
100 EMA: $1.2550
200 EMA: $1.3546
XRPは現在、20 EMAおよび200 EMAより下にあります。50 EMAと100 EMAは依然として価格の下側に位置しています。$1.35の水準を取り戻せれば、短期的な構造は改善します。
📈 EMA構造
20 EMA: $1.3505
50 EMA: $1.2836
100 EMA: $1.2550
200 EMA: $1.3546
XRPは現在、20 EMAおよび200 EMAより下にあります。50 EMAと100 EMAは依然として価格の下側に位置しています。$1.35の水準を取り戻せれば、短期的な構造は改善します。
1
3
787
·
--
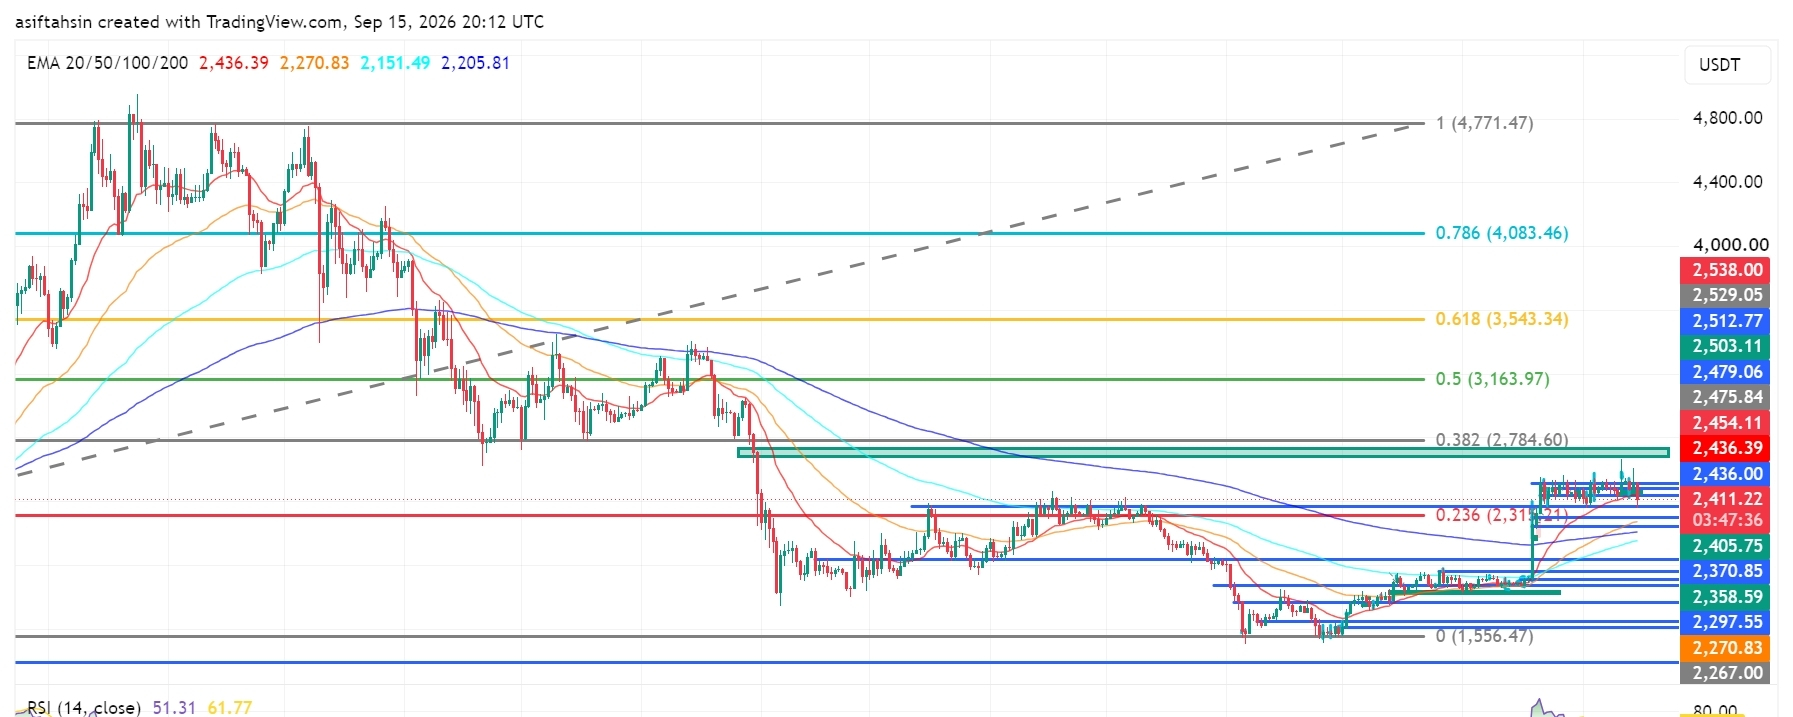
記事
翻訳参照
SOL Technical Outlook: Solana Holds Near $100 as Bulls Defend the BreakoutSOL is currently trading around $99.6, holding near the $99–$100 breakout zone after the recent bullish expansion from the $92–$94 demand area.
The broader recovery structure remains constructive, but SOL is now consolidating below the $100.59–$104.64 resistance cluster. Bulls need to reclaim this area and break the $107.07–$109.91 zone for the next major upside expansion.
📈 EMA Structure
20 EMA: $99.62
50 EMA: $92.58
100 EMA: $87.71
200 EMA: $91.88
SOL is currently testing the 20 EMA at $99.62.
The recovery above the 50 EMA at $92.58 and 200 EMA at $91.88 keeps the broader recovery structure intact.
A sustained hold above the 20 EMA would strengthen short-term momentum, while losing the $92.58–$91.88 area would weaken the current structure.
📐 Fibonacci Levels
Key Fibonacci levels:
0.236: $100.02
0.382: $129.49
0.5: $150.08
0.618: $170.67
0.786: $199.99
1.0: $237.33
SOL is currently testing the 0.236 Fibonacci region around $100.02.
The next major Fibonacci resistance is $129.49 — 0.382 Fib.
A sustained breakout above the $100–$107 resistance structure could open the path toward the $129.49 region.
🟢 Bullish Scenario
SOL is consolidating after the recent recovery and is currently building acceptance around the $99–$100 area.
Immediate resistance:
$100.02 — 0.236 Fibonacci
$100.59
$102.00
$102.29
$104.64
$107.07
$109.91
$111.04
A clean breakout and sustained close above $109.91–$111.04 would provide stronger confirmation of bullish continuation.
🎯 Target 1: $100.59
🎯 Target 2: $104.64
🎯 Target 3: $107.07
🎯 Target 4: $111.04
🎯 Target 5: $129.49 — 0.382 Fibonacci
🎯 Target 6: $150.08 — 0.5 Fibonacci
A confirmed breakout above the $109.91–$111.04 zone could strengthen the medium-term recovery structure and potentially accelerate SOL toward the $129–$150 region.
🔴 Pullback Scenario
After the recent bullish expansion, a retest of the breakout area would be normal.
Key supports:
$97.42
$96.33
$92.94
$92.58 — 50 EMA
$91.88 — 200 EMA
$87.71 — 100 EMA
The $92–$97 zone is particularly important.
If SOL continues to hold this area during a pullback, the current recovery structure remains valid.
A sustained loss of $91.88 would weaken the bullish setup and could expose the $87.71 support zone.
🧠 Market Structure & Liquidity
SOL has formed a clear recovery structure after sweeping liquidity around the $92–$94 demand region.
The recent move produced a market-structure shift followed by a breakout and higher-low formation.
SOL is now moving through an important:
Breakout → Retest → Consolidation → Continuation
structure.
The major upside liquidity is concentrated around $100–$111. A decisive breakout above this zone would place $129.49 as the next major Fibonacci target.
📊 RSI Momentum
RSI (14): 49.30
RSI has cooled back toward the neutral 50 level after the recent bullish expansion.
The current reading shows that short-term momentum is balanced rather than strongly overbought.
A sustained RSI move back above 50–55 would favor another bullish attempt toward the resistance zone.
A breakdown below 50 would indicate increasing short-term momentum weakness.
🎯 Key Levels
🔴 Major Resistance: $100.02 → $100.59 → $104.64 → $107.07 → $109.91 → $111.04
🟢 Major Support: $97.42 → $96.33 → $92.94 → $92.58 → $91.88
📉 Dynamic EMA Support: $92.58 — 50 EMA | $91.88 — 200 EMA | $87.71 — 100 EMA
🚀 Upside Targets: $111.04 → $129.49 → $150.08 → $170.67
📌 Final Outlook
SOL's broader structure remains constructive after the recent breakout, but price is currently consolidating around the $100 area and below the $100.59–$111 resistance zone.
The $92–$97 area is now the key short-term support region. As long as SOL holds above this zone, the current recovery structure remains active.
The immediate battle is around $100–$111. A confirmed breakout above $111.04 could open the path toward $129.49, followed by $150.08 and potentially $170.67.
However, rejection from resistance followed by a sustained loss of $91.88 would weaken the bullish structure and increase the risk of a deeper retracement toward the $87.71 area.
Bias: 🟢 Recovery structure intact above $91.88. A breakout above $111.04 could open the path toward $129.49, with $150.08 as the next major Fibonacci target.
$SOL
{future}(SOLUSDT)
SOL Technical Outlook: Solana Holds Near $100 as Bulls Defend the Breakout
SOL is currently trading around $99.6, holding near the $99–$100 breakout zone after the recent bullish expansion from the $92–$94 demand area.
The broader recovery structure remains constructive, but SOL is now consolidating below the $100.59–$104.64 resistance cluster. Bulls need to reclaim this area and break the $107.07–$109.91 zone for the next major upside expansion.
📈 EMA Structure
20 EMA: $99.62
50 EMA: $92.58
100 EMA: $87.71
200 EMA: $91.88
SOL is currently testing the 20 EMA at $99.62.
The recovery above the 50 EMA at $92.58 and 200 EMA at $91.88 keeps the broader recovery structure intact.
A sustained hold above the 20 EMA would strengthen short-term momentum, while losing the $92.58–$91.88 area would weaken the current structure.
📐 Fibonacci Levels
Key Fibonacci levels:
0.236: $100.02
0.382: $129.49
0.5: $150.08
0.618: $170.67
0.786: $199.99
1.0: $237.33
SOL is currently testing the 0.236 Fibonacci region around $100.02.
The next major Fibonacci resistance is $129.49 — 0.382 Fib.
A sustained breakout above the $100–$107 resistance structure could open the path toward the $129.49 region.
🟢 Bullish Scenario
SOL is consolidating after the recent recovery and is currently building acceptance around the $99–$100 area.
Immediate resistance:
$100.02 — 0.236 Fibonacci
$100.59
$102.00
$102.29
$104.64
$107.07
$109.91
$111.04
A clean breakout and sustained close above $109.91–$111.04 would provide stronger confirmation of bullish continuation.
🎯 Target 1: $100.59
🎯 Target 2: $104.64
🎯 Target 3: $107.07
🎯 Target 4: $111.04
🎯 Target 5: $129.49 — 0.382 Fibonacci
🎯 Target 6: $150.08 — 0.5 Fibonacci
A confirmed breakout above the $109.91–$111.04 zone could strengthen the medium-term recovery structure and potentially accelerate SOL toward the $129–$150 region.
🔴 Pullback Scenario
After the recent bullish expansion, a retest of the breakout area would be normal.
Key supports:
$97.42
$96.33
$92.94
$92.58 — 50 EMA
$91.88 — 200 EMA
$87.71 — 100 EMA
The $92–$97 zone is particularly important.
If SOL continues to hold this area during a pullback, the current recovery structure remains valid.
A sustained loss of $91.88 would weaken the bullish setup and could expose the $87.71 support zone.
🧠 Market Structure & Liquidity
SOL has formed a clear recovery structure after sweeping liquidity around the $92–$94 demand region.
The recent move produced a market-structure shift followed by a breakout and higher-low formation.
SOL is now moving through an important:
Breakout → Retest → Consolidation → Continuation
structure.
The major upside liquidity is concentrated around $100–$111. A decisive breakout above this zone would place $129.49 as the next major Fibonacci target.
📊 RSI Momentum
RSI (14): 49.30
RSI has cooled back toward the neutral 50 level after the recent bullish expansion.
The current reading shows that short-term momentum is balanced rather than strongly overbought.
A sustained RSI move back above 50–55 would favor another bullish attempt toward the resistance zone.
A breakdown below 50 would indicate increasing short-term momentum weakness.
🎯 Key Levels
🔴 Major Resistance: $100.02 → $100.59 → $104.64 → $107.07 → $109.91 → $111.04
🟢 Major Support: $97.42 → $96.33 → $92.94 → $92.58 → $91.88
📉 Dynamic EMA Support: $92.58 — 50 EMA | $91.88 — 200 EMA | $87.71 — 100 EMA
🚀 Upside Targets: $111.04 → $129.49 → $150.08 → $170.67
📌 Final Outlook
SOL's broader structure remains constructive after the recent breakout, but price is currently consolidating around the $100 area and below the $100.59–$111 resistance zone.
The $92–$97 area is now the key short-term support region. As long as SOL holds above this zone, the current recovery structure remains active.
The immediate battle is around $100–$111. A confirmed breakout above $111.04 could open the path toward $129.49, followed by $150.08 and potentially $170.67.
However, rejection from resistance followed by a sustained loss of $91.88 would weaken the bullish structure and increase the risk of a deeper retracement toward the $87.71 area.
Bias: 🟢 Recovery structure intact above $91.88. A breakout above $111.04 could open the path toward $129.49, with $150.08 as the next major Fibonacci target.
$SOL
The broader recovery structure remains constructive, but SOL is now consolidating below the $100.59–$104.64 resistance cluster. Bulls need to reclaim this area and break the $107.07–$109.91 zone for the next major upside expansion.
📈 EMA Structure
20 EMA: $99.62
50 EMA: $92.58
100 EMA: $87.71
200 EMA: $91.88
SOL is currently testing the 20 EMA at $99.62.
The recovery above the 50 EMA at $92.58 and 200 EMA at $91.88 keeps the broader recovery structure intact.
A sustained hold above the 20 EMA would strengthen short-term momentum, while losing the $92.58–$91.88 area would weaken the current structure.
📐 Fibonacci Levels
Key Fibonacci levels:
0.236: $100.02
0.382: $129.49
0.5: $150.08
0.618: $170.67
0.786: $199.99
1.0: $237.33
SOL is currently testing the 0.236 Fibonacci region around $100.02.
The next major Fibonacci resistance is $129.49 — 0.382 Fib.
A sustained breakout above the $100–$107 resistance structure could open the path toward the $129.49 region.
🟢 Bullish Scenario
SOL is consolidating after the recent recovery and is currently building acceptance around the $99–$100 area.
Immediate resistance:
$100.02 — 0.236 Fibonacci
$100.59
$102.00
$102.29
$104.64
$107.07
$109.91
$111.04
A clean breakout and sustained close above $109.91–$111.04 would provide stronger confirmation of bullish continuation.
🎯 Target 1: $100.59
🎯 Target 2: $104.64
🎯 Target 3: $107.07
🎯 Target 4: $111.04
🎯 Target 5: $129.49 — 0.382 Fibonacci
🎯 Target 6: $150.08 — 0.5 Fibonacci
A confirmed breakout above the $109.91–$111.04 zone could strengthen the medium-term recovery structure and potentially accelerate SOL toward the $129–$150 region.
🔴 Pullback Scenario
After the recent bullish expansion, a retest of the breakout area would be normal.
Key supports:
$97.42
$96.33
$92.94
$92.58 — 50 EMA
$91.88 — 200 EMA
$87.71 — 100 EMA
The $92–$97 zone is particularly important.
If SOL continues to hold this area during a pullback, the current recovery structure remains valid.
A sustained loss of $91.88 would weaken the bullish setup and could expose the $87.71 support zone.
🧠 Market Structure & Liquidity
SOL has formed a clear recovery structure after sweeping liquidity around the $92–$94 demand region.
The recent move produced a market-structure shift followed by a breakout and higher-low formation.
SOL is now moving through an important:
Breakout → Retest → Consolidation → Continuation
structure.
The major upside liquidity is concentrated around $100–$111. A decisive breakout above this zone would place $129.49 as the next major Fibonacci target.
📊 RSI Momentum
RSI (14): 49.30
RSI has cooled back toward the neutral 50 level after the recent bullish expansion.
The current reading shows that short-term momentum is balanced rather than strongly overbought.
A sustained RSI move back above 50–55 would favor another bullish attempt toward the resistance zone.
A breakdown below 50 would indicate increasing short-term momentum weakness.
🎯 Key Levels
🔴 Major Resistance: $100.02 → $100.59 → $104.64 → $107.07 → $109.91 → $111.04
🟢 Major Support: $97.42 → $96.33 → $92.94 → $92.58 → $91.88
📉 Dynamic EMA Support: $92.58 — 50 EMA | $91.88 — 200 EMA | $87.71 — 100 EMA
🚀 Upside Targets: $111.04 → $129.49 → $150.08 → $170.67
📌 Final Outlook
SOL's broader structure remains constructive after the recent breakout, but price is currently consolidating around the $100 area and below the $100.59–$111 resistance zone.
The $92–$97 area is now the key short-term support region. As long as SOL holds above this zone, the current recovery structure remains active.
The immediate battle is around $100–$111. A confirmed breakout above $111.04 could open the path toward $129.49, followed by $150.08 and potentially $170.67.
However, rejection from resistance followed by a sustained loss of $91.88 would weaken the bullish structure and increase the risk of a deeper retracement toward the $87.71 area.
Bias: 🟢 Recovery structure intact above $91.88. A breakout above $111.04 could open the path toward $129.49, with $150.08 as the next major Fibonacci target.
$SOL
62
·
--
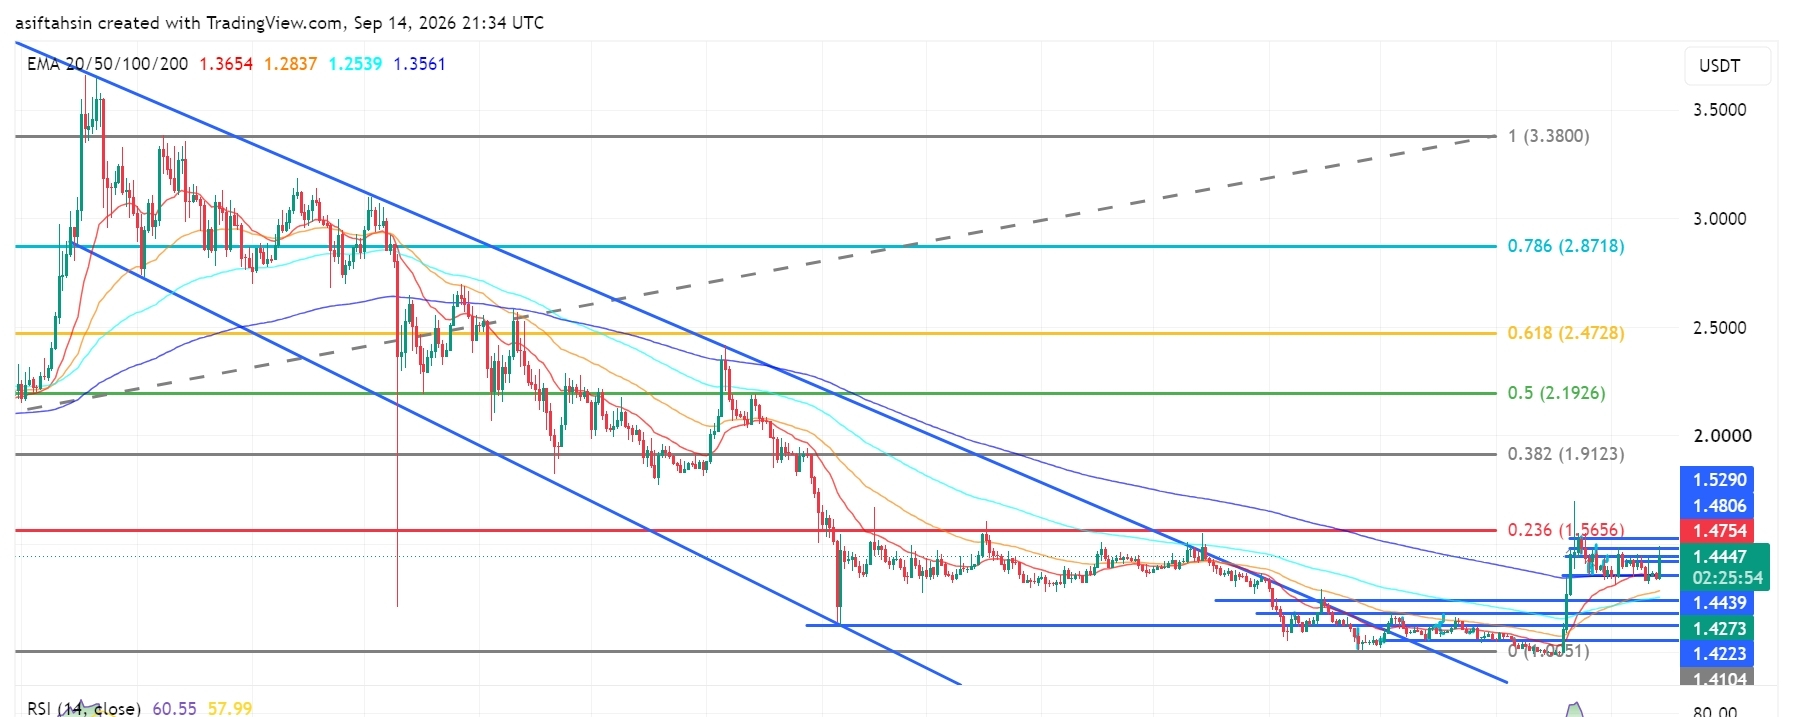
記事
XRPテクニカル見通し:強気派は1.56ドルを目指し、XRPは1.40ドル超を維持XRPは現在約1.44ドルで取引されており、6月〜7月の安値からの強い回復を受けて重要な1.40ドルの心理的水準を上回る形で推移しています。
より広い構造は大幅に改善しており、XRPは現在、4つの主要なEMAすべての上で取引されています。ただし、価格は1.475〜1.53ドル付近の重要なレジスタンス・クラスターに接近しています。強気派はこのエリアを明確に上抜けする必要があり、そのことで1.5656ドルのフィボナッチ・レジスタンスへ向かう道が開かれます。
📈 EMAの構造
20 EMA:1.3653ドル
50 EMA:1.2837ドル
100 EMA:1.2539ドル
200 EMA:1.3561ドル
XRPテクニカル見通し:強気派は1.56ドルを目指し、XRPは1.40ドル超を維持
XRPは現在約1.44ドルで取引されており、6月〜7月の安値からの強い回復を受けて重要な1.40ドルの心理的水準を上回る形で推移しています。
より広い構造は大幅に改善しており、XRPは現在、4つの主要なEMAすべての上で取引されています。ただし、価格は1.475〜1.53ドル付近の重要なレジスタンス・クラスターに接近しています。強気派はこのエリアを明確に上抜けする必要があり、そのことで1.5656ドルのフィボナッチ・レジスタンスへ向かう道が開かれます。
📈 EMAの構造
20 EMA:1.3653ドル
50 EMA:1.2837ドル
100 EMA:1.2539ドル
200 EMA:1.3561ドル
より広い構造は大幅に改善しており、XRPは現在、4つの主要なEMAすべての上で取引されています。ただし、価格は1.475〜1.53ドル付近の重要なレジスタンス・クラスターに接近しています。強気派はこのエリアを明確に上抜けする必要があり、そのことで1.5656ドルのフィボナッチ・レジスタンスへ向かう道が開かれます。
📈 EMAの構造
20 EMA:1.3653ドル
50 EMA:1.2837ドル
100 EMA:1.2539ドル
200 EMA:1.3561ドル
2
1
1.2k
·
--
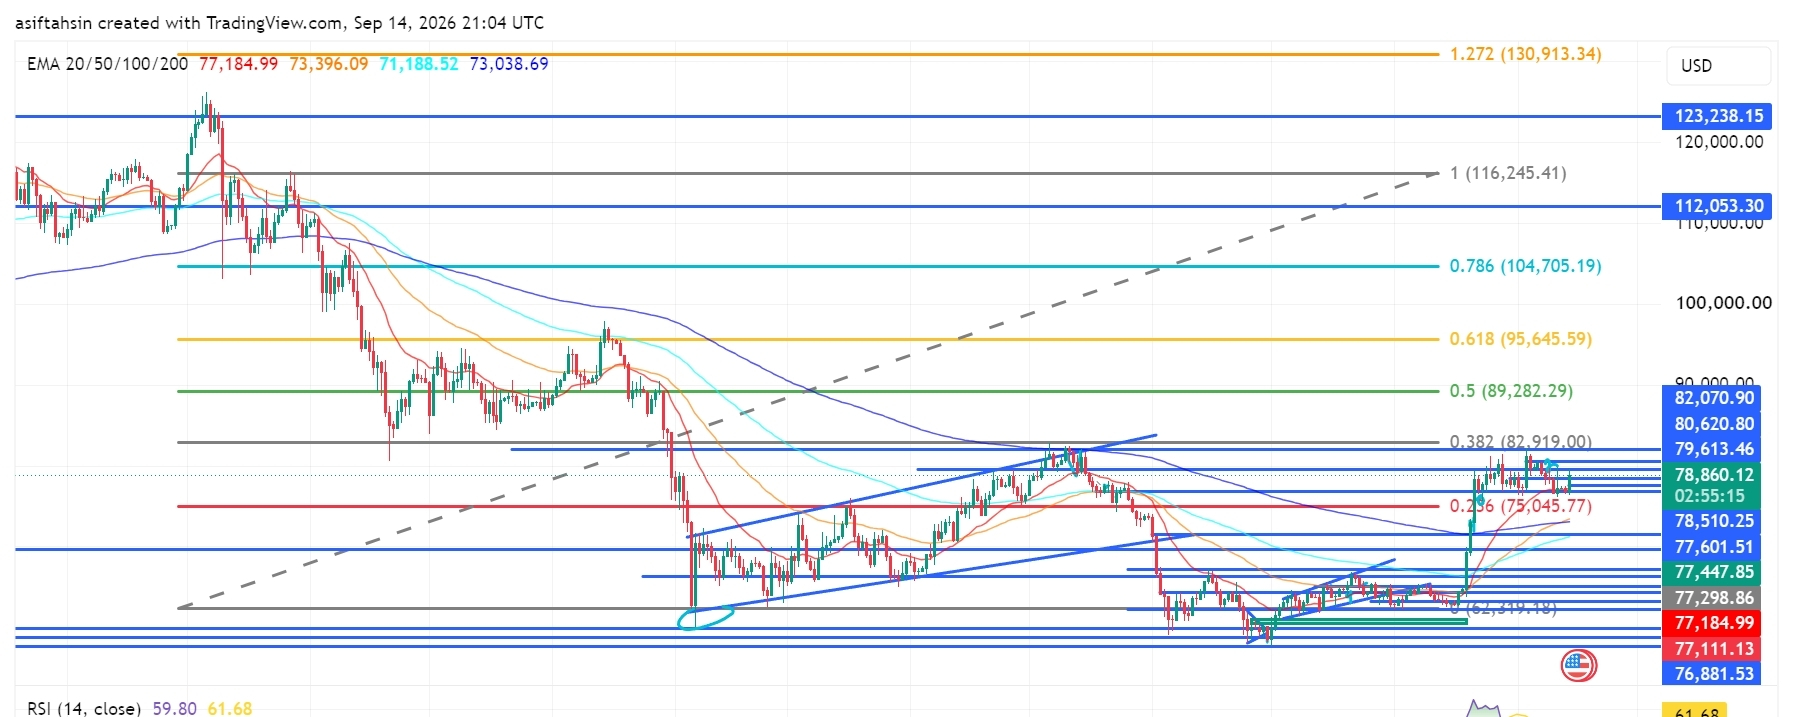
記事
翻訳参照
Bitcoin (BTC) Technical Outlook: BTC Holds Above $78K as Bulls Target $80K–$83K ResistanceBTC is currently trading around $78,860, consolidating above the $78K level after a strong recovery from the June lows.
The broader structure remains constructive, with BTC trading above all four major EMAs. However, price is now approaching a significant resistance cluster around $79,613–$82,070. Bulls need a clean breakout above this zone to open the path toward the $82,919 Fibonacci resistance and potentially higher levels.
📈 EMA Structure
20 EMA: $77,182.98
50 EMA: $73,395.26
100 EMA: $71,188.10
200 EMA: $73,038.48
BTC remains above all four major EMAs, keeping the medium-term recovery structure bullish.
The $77,182.98 20 EMA is now the key dynamic support. As long as BTC remains above this level, buyers maintain control of the current recovery.
📐 Fibonacci Levels
0.236: $75,045.77
0.382: $82,919.00
0.5: $89,282.29
0.618: $95,645.59
0.786: $104,705.19
1.0: $116,245.41
1.272: $130,913.34
The $82,919 0.382 Fibonacci level is the next major upside objective after the current resistance cluster.
🟢 Bullish Scenario
BTC is consolidating just below the $79,613–$82,070 resistance area.
A clean breakout and sustained close above $82,070 could trigger another bullish expansion.
🎯 Target 1: $82,070
🎯 Target 2: $82,919
🎯 Target 3: $89,282
🎯 Target 4: $95,645
🎯 Target 5: $104,705
🎯 Target 6: $116,245
A decisive reclaim of $82,919 would be an important confirmation that BTC is transitioning into a stronger medium-term recovery phase.
🔴 Pullback Scenario
If BTC fails to break the $79,613–$82,070 resistance cluster, a short-term pullback could develop.
Key supports:
$78,510.25
$77,601.51
$77,447.85
$77,298.86
$77,182.98 — 20 EMA
$77,111.13
$76,881.53
$75,045.77 — 0.236 Fib
The $77,600–$77,180 region is particularly important. A successful retest here could provide a base for another attempt at the $80K+ resistance zone.
A sustained break below the 20 EMA at $77,182.98 would weaken the short-term bullish structure.
🧠 Market Structure & Liquidity
BTC's recent structure can be viewed as:
Liquidity Sweep → Accumulation → Higher Lows → Breakout → Reclaim → Consolidation → Potential Continuation
The June low created a major liquidity event, followed by accumulation and a gradual recovery.
BTC subsequently broke higher from the July–August consolidation structure and reclaimed the $75K area. Price is now consolidating near $79K, with the next major structural test sitting between $79,613 and $82,070.
A breakout above this region would put the $82,919 Fibonacci level into focus.
📊 RSI Momentum
RSI: 59.80
RSI MA: 61.68
RSI remains above 50, confirming that bullish momentum is still present.
However, RSI is currently slightly below its moving average, suggesting that momentum has cooled from the recent upside move. A renewed move above 62–65 would strengthen the continuation setup.
🎯 Key Levels
Resistance:
$79,613.46 → $80,620.80 → $82,070.90 → $82,919 → $89,282.29 → $95,645.59
Support:
$78,510.25 → $77,601.51 → $77,447.85 → $77,298.86 → $77,182.98 → $77,111.13 → $76,881.53 → $75,045.77
📌 Final Outlook
BTC remains in a constructive recovery structure while holding above the $77K area and all four major EMAs.
The immediate battle is $79,613–$82,070. A decisive breakout above this zone could push BTC toward $82,919 → $89,282 → $95,645, while a sustained reclaim of $82,919 could open the path toward the higher Fibonacci levels.
On the downside, $77,182.98 is the key dynamic support. As long as BTC holds above this level, the broader bullish recovery remains intact.
Bias: 🟢 Bullish above $77,183 | Stronger above $82,070
$BTC
{future}(BTCUSDT)
Bitcoin (BTC) Technical Outlook: BTC Holds Above $78K as Bulls Target $80K–$83K Resistance
BTC is currently trading around $78,860, consolidating above the $78K level after a strong recovery from the June lows.
The broader structure remains constructive, with BTC trading above all four major EMAs. However, price is now approaching a significant resistance cluster around $79,613–$82,070. Bulls need a clean breakout above this zone to open the path toward the $82,919 Fibonacci resistance and potentially higher levels.
📈 EMA Structure
20 EMA: $77,182.98
50 EMA: $73,395.26
100 EMA: $71,188.10
200 EMA: $73,038.48
BTC remains above all four major EMAs, keeping the medium-term recovery structure bullish.
The $77,182.98 20 EMA is now the key dynamic support. As long as BTC remains above this level, buyers maintain control of the current recovery.
📐 Fibonacci Levels
0.236: $75,045.77
0.382: $82,919.00
0.5: $89,282.29
0.618: $95,645.59
0.786: $104,705.19
1.0: $116,245.41
1.272: $130,913.34
The $82,919 0.382 Fibonacci level is the next major upside objective after the current resistance cluster.
🟢 Bullish Scenario
BTC is consolidating just below the $79,613–$82,070 resistance area.
A clean breakout and sustained close above $82,070 could trigger another bullish expansion.
🎯 Target 1: $82,070
🎯 Target 2: $82,919
🎯 Target 3: $89,282
🎯 Target 4: $95,645
🎯 Target 5: $104,705
🎯 Target 6: $116,245
A decisive reclaim of $82,919 would be an important confirmation that BTC is transitioning into a stronger medium-term recovery phase.
🔴 Pullback Scenario
If BTC fails to break the $79,613–$82,070 resistance cluster, a short-term pullback could develop.
Key supports:
$78,510.25
$77,601.51
$77,447.85
$77,298.86
$77,182.98 — 20 EMA
$77,111.13
$76,881.53
$75,045.77 — 0.236 Fib
The $77,600–$77,180 region is particularly important. A successful retest here could provide a base for another attempt at the $80K+ resistance zone.
A sustained break below the 20 EMA at $77,182.98 would weaken the short-term bullish structure.
🧠 Market Structure & Liquidity
BTC's recent structure can be viewed as:
Liquidity Sweep → Accumulation → Higher Lows → Breakout → Reclaim → Consolidation → Potential Continuation
The June low created a major liquidity event, followed by accumulation and a gradual recovery.
BTC subsequently broke higher from the July–August consolidation structure and reclaimed the $75K area. Price is now consolidating near $79K, with the next major structural test sitting between $79,613 and $82,070.
A breakout above this region would put the $82,919 Fibonacci level into focus.
📊 RSI Momentum
RSI: 59.80
RSI MA: 61.68
RSI remains above 50, confirming that bullish momentum is still present.
However, RSI is currently slightly below its moving average, suggesting that momentum has cooled from the recent upside move. A renewed move above 62–65 would strengthen the continuation setup.
🎯 Key Levels
Resistance:
$79,613.46 → $80,620.80 → $82,070.90 → $82,919 → $89,282.29 → $95,645.59
Support:
$78,510.25 → $77,601.51 → $77,447.85 → $77,298.86 → $77,182.98 → $77,111.13 → $76,881.53 → $75,045.77
📌 Final Outlook
BTC remains in a constructive recovery structure while holding above the $77K area and all four major EMAs.
The immediate battle is $79,613–$82,070. A decisive breakout above this zone could push BTC toward $82,919 → $89,282 → $95,645, while a sustained reclaim of $82,919 could open the path toward the higher Fibonacci levels.
On the downside, $77,182.98 is the key dynamic support. As long as BTC holds above this level, the broader bullish recovery remains intact.
Bias: 🟢 Bullish above $77,183 | Stronger above $82,070
$BTC
The broader structure remains constructive, with BTC trading above all four major EMAs. However, price is now approaching a significant resistance cluster around $79,613–$82,070. Bulls need a clean breakout above this zone to open the path toward the $82,919 Fibonacci resistance and potentially higher levels.
📈 EMA Structure
20 EMA: $77,182.98
50 EMA: $73,395.26
100 EMA: $71,188.10
200 EMA: $73,038.48
BTC remains above all four major EMAs, keeping the medium-term recovery structure bullish.
The $77,182.98 20 EMA is now the key dynamic support. As long as BTC remains above this level, buyers maintain control of the current recovery.
📐 Fibonacci Levels
0.236: $75,045.77
0.382: $82,919.00
0.5: $89,282.29
0.618: $95,645.59
0.786: $104,705.19
1.0: $116,245.41
1.272: $130,913.34
The $82,919 0.382 Fibonacci level is the next major upside objective after the current resistance cluster.
🟢 Bullish Scenario
BTC is consolidating just below the $79,613–$82,070 resistance area.
A clean breakout and sustained close above $82,070 could trigger another bullish expansion.
🎯 Target 1: $82,070
🎯 Target 2: $82,919
🎯 Target 3: $89,282
🎯 Target 4: $95,645
🎯 Target 5: $104,705
🎯 Target 6: $116,245
A decisive reclaim of $82,919 would be an important confirmation that BTC is transitioning into a stronger medium-term recovery phase.
🔴 Pullback Scenario
If BTC fails to break the $79,613–$82,070 resistance cluster, a short-term pullback could develop.
Key supports:
$78,510.25
$77,601.51
$77,447.85
$77,298.86
$77,182.98 — 20 EMA
$77,111.13
$76,881.53
$75,045.77 — 0.236 Fib
The $77,600–$77,180 region is particularly important. A successful retest here could provide a base for another attempt at the $80K+ resistance zone.
A sustained break below the 20 EMA at $77,182.98 would weaken the short-term bullish structure.
🧠 Market Structure & Liquidity
BTC's recent structure can be viewed as:
Liquidity Sweep → Accumulation → Higher Lows → Breakout → Reclaim → Consolidation → Potential Continuation
The June low created a major liquidity event, followed by accumulation and a gradual recovery.
BTC subsequently broke higher from the July–August consolidation structure and reclaimed the $75K area. Price is now consolidating near $79K, with the next major structural test sitting between $79,613 and $82,070.
A breakout above this region would put the $82,919 Fibonacci level into focus.
📊 RSI Momentum
RSI: 59.80
RSI MA: 61.68
RSI remains above 50, confirming that bullish momentum is still present.
However, RSI is currently slightly below its moving average, suggesting that momentum has cooled from the recent upside move. A renewed move above 62–65 would strengthen the continuation setup.
🎯 Key Levels
Resistance:
$79,613.46 → $80,620.80 → $82,070.90 → $82,919 → $89,282.29 → $95,645.59
Support:
$78,510.25 → $77,601.51 → $77,447.85 → $77,298.86 → $77,182.98 → $77,111.13 → $76,881.53 → $75,045.77
📌 Final Outlook
BTC remains in a constructive recovery structure while holding above the $77K area and all four major EMAs.
The immediate battle is $79,613–$82,070. A decisive breakout above this zone could push BTC toward $82,919 → $89,282 → $95,645, while a sustained reclaim of $82,919 could open the path toward the higher Fibonacci levels.
On the downside, $77,182.98 is the key dynamic support. As long as BTC holds above this level, the broader bullish recovery remains intact.
Bias: 🟢 Bullish above $77,183 | Stronger above $82,070
$BTC
69
·
--
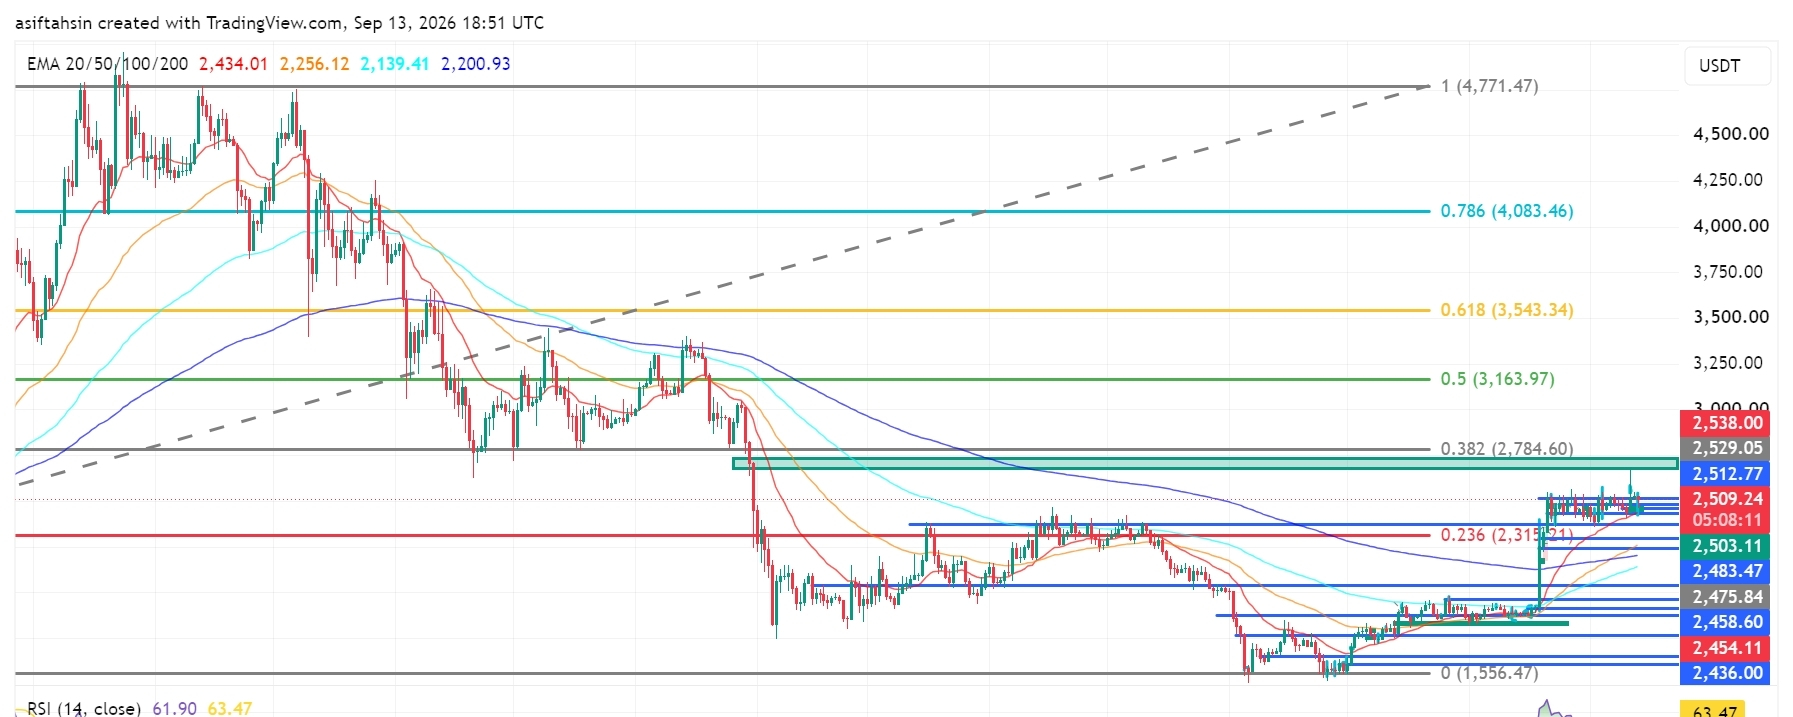
記事
翻訳参照
Solana (SOL) Technical Outlook: SOL Holds Above $100 as Bulls Target Higher ResistanceSOL is currently trading around $101.25, consolidating above the psychological $100 level after a strong recovery from the June lows.
The broader structure is showing signs of improvement, with SOL now trading above all four major EMAs. However, price is facing a significant resistance cluster around $102.29–$104.64. Bulls need a clean breakout above this zone to open the path toward the $107–$109 area and the $129.49 Fibonacci resistance.
📈 EMA Structure
20 EMA: $99.76
50 EMA: $92.04
100 EMA: $87.25
200 EMA: $91.74
SOL is currently trading above all four major EMAs, supporting the ongoing recovery structure.
The $99.76 20 EMA is the key dynamic support. As long as SOL remains above this level, buyers maintain control of the current short-term structure.
📐 Fibonacci Levels
0.236: $104.00
0.382: $129.49
0.5: $150.08
0.618: $170.67
0.786: $199.99
1.0: $237.33
The $104.00 0.236 Fibonacci level is the immediate major resistance. A successful reclaim could strengthen the path toward $129.49.
🟢 Bullish Scenario
SOL is consolidating around the $100–$102 region after recovering from the recent lows.
A clean breakout and sustained close above $104.64 could trigger another bullish expansion.
🎯 Target 1: $107.07
🎯 Target 2: $109.84
🎯 Target 3: $112.00
🎯 Target 4: $129.49
🎯 Target 5: $150.08
🎯 Target 6: $170.67
A decisive reclaim of $129.49 would be an important confirmation that SOL is transitioning into a stronger medium-term recovery phase.
🔴 Pullback Scenario
If SOL fails to break the $102.29–$104.64 resistance cluster, a short-term pullback could develop.
Key supports:
$100.59
$99.76
$96.33
$92.94
$92.04
$91.74 — 200 EMA
$87.25 — 100 EMA
$86.69
The $100.59–$99.76 region is particularly important. A successful retest here could provide a base for another attempt at the $104 resistance.
A sustained break below the 20 EMA at $99.76 would weaken the short-term bullish structure.
🧠 Market Structure & Liquidity
SOL's recent structure can be viewed as:
Liquidity Sweep → Accumulation → Higher Lows → MSS/BOS → Breakout → Reclaim → Consolidation → Potential Continuation
The June low created a major liquidity event, followed by a prolonged accumulation phase and gradual recovery.
SOL has now reclaimed the $100 psychological level and is holding above the major EMA cluster.
The next major structural test is $102.29–$104.64, followed by the $107–$112 resistance area.
📊 RSI Momentum
RSI: 56.24
RSI MA: 61.94
RSI remains above 50, indicating that bullish momentum is still present.
However, RSI is currently below its moving average, suggesting that momentum has cooled from the recent upside move. A renewed push above 60–62 would strengthen the continuation setup.
🎯 Key Levels
Resistance:
$102.29 → $104.00 → $104.64 → $107.07 → $109.84 → $112.00 → $129.49
Support:
$100.59 → $99.76 → $96.33 → $92.94 → $92.04 → $91.74 → $87.25 → $86.69
📌 Final Outlook
SOL remains in a constructive recovery structure while holding above the $100 area and all major EMAs.
The immediate battle is $102.29–$104.64. A decisive breakout above this zone could push SOL toward $107 → $109.84 → $112, while a sustained move beyond these levels could open the path toward $129.49.
On the downside, $99.76 is the key dynamic support. As long as SOL holds above this level, the broader recovery structure remains intact.
Bias: 🟢 Bullish above $99.76 | Stronger above $104.64
$SOL
{future}(SOLUSDT)
Solana (SOL) Technical Outlook: SOL Holds Above $100 as Bulls Target Higher Resistance
SOL is currently trading around $101.25, consolidating above the psychological $100 level after a strong recovery from the June lows.
The broader structure is showing signs of improvement, with SOL now trading above all four major EMAs. However, price is facing a significant resistance cluster around $102.29–$104.64. Bulls need a clean breakout above this zone to open the path toward the $107–$109 area and the $129.49 Fibonacci resistance.
📈 EMA Structure
20 EMA: $99.76
50 EMA: $92.04
100 EMA: $87.25
200 EMA: $91.74
SOL is currently trading above all four major EMAs, supporting the ongoing recovery structure.
The $99.76 20 EMA is the key dynamic support. As long as SOL remains above this level, buyers maintain control of the current short-term structure.
📐 Fibonacci Levels
0.236: $104.00
0.382: $129.49
0.5: $150.08
0.618: $170.67
0.786: $199.99
1.0: $237.33
The $104.00 0.236 Fibonacci level is the immediate major resistance. A successful reclaim could strengthen the path toward $129.49.
🟢 Bullish Scenario
SOL is consolidating around the $100–$102 region after recovering from the recent lows.
A clean breakout and sustained close above $104.64 could trigger another bullish expansion.
🎯 Target 1: $107.07
🎯 Target 2: $109.84
🎯 Target 3: $112.00
🎯 Target 4: $129.49
🎯 Target 5: $150.08
🎯 Target 6: $170.67
A decisive reclaim of $129.49 would be an important confirmation that SOL is transitioning into a stronger medium-term recovery phase.
🔴 Pullback Scenario
If SOL fails to break the $102.29–$104.64 resistance cluster, a short-term pullback could develop.
Key supports:
$100.59
$99.76
$96.33
$92.94
$92.04
$91.74 — 200 EMA
$87.25 — 100 EMA
$86.69
The $100.59–$99.76 region is particularly important. A successful retest here could provide a base for another attempt at the $104 resistance.
A sustained break below the 20 EMA at $99.76 would weaken the short-term bullish structure.
🧠 Market Structure & Liquidity
SOL's recent structure can be viewed as:
Liquidity Sweep → Accumulation → Higher Lows → MSS/BOS → Breakout → Reclaim → Consolidation → Potential Continuation
The June low created a major liquidity event, followed by a prolonged accumulation phase and gradual recovery.
SOL has now reclaimed the $100 psychological level and is holding above the major EMA cluster.
The next major structural test is $102.29–$104.64, followed by the $107–$112 resistance area.
📊 RSI Momentum
RSI: 56.24
RSI MA: 61.94
RSI remains above 50, indicating that bullish momentum is still present.
However, RSI is currently below its moving average, suggesting that momentum has cooled from the recent upside move. A renewed push above 60–62 would strengthen the continuation setup.
🎯 Key Levels
Resistance:
$102.29 → $104.00 → $104.64 → $107.07 → $109.84 → $112.00 → $129.49
Support:
$100.59 → $99.76 → $96.33 → $92.94 → $92.04 → $91.74 → $87.25 → $86.69
📌 Final Outlook
SOL remains in a constructive recovery structure while holding above the $100 area and all major EMAs.
The immediate battle is $102.29–$104.64. A decisive breakout above this zone could push SOL toward $107 → $109.84 → $112, while a sustained move beyond these levels could open the path toward $129.49.
On the downside, $99.76 is the key dynamic support. As long as SOL holds above this level, the broader recovery structure remains intact.
Bias: 🟢 Bullish above $99.76 | Stronger above $104.64
$SOL
The broader structure is showing signs of improvement, with SOL now trading above all four major EMAs. However, price is facing a significant resistance cluster around $102.29–$104.64. Bulls need a clean breakout above this zone to open the path toward the $107–$109 area and the $129.49 Fibonacci resistance.
📈 EMA Structure
20 EMA: $99.76
50 EMA: $92.04
100 EMA: $87.25
200 EMA: $91.74
SOL is currently trading above all four major EMAs, supporting the ongoing recovery structure.
The $99.76 20 EMA is the key dynamic support. As long as SOL remains above this level, buyers maintain control of the current short-term structure.
📐 Fibonacci Levels
0.236: $104.00
0.382: $129.49
0.5: $150.08
0.618: $170.67
0.786: $199.99
1.0: $237.33
The $104.00 0.236 Fibonacci level is the immediate major resistance. A successful reclaim could strengthen the path toward $129.49.
🟢 Bullish Scenario
SOL is consolidating around the $100–$102 region after recovering from the recent lows.
A clean breakout and sustained close above $104.64 could trigger another bullish expansion.
🎯 Target 1: $107.07
🎯 Target 2: $109.84
🎯 Target 3: $112.00
🎯 Target 4: $129.49
🎯 Target 5: $150.08
🎯 Target 6: $170.67
A decisive reclaim of $129.49 would be an important confirmation that SOL is transitioning into a stronger medium-term recovery phase.
🔴 Pullback Scenario
If SOL fails to break the $102.29–$104.64 resistance cluster, a short-term pullback could develop.
Key supports:
$100.59
$99.76
$96.33
$92.94
$92.04
$91.74 — 200 EMA
$87.25 — 100 EMA
$86.69
The $100.59–$99.76 region is particularly important. A successful retest here could provide a base for another attempt at the $104 resistance.
A sustained break below the 20 EMA at $99.76 would weaken the short-term bullish structure.
🧠 Market Structure & Liquidity
SOL's recent structure can be viewed as:
Liquidity Sweep → Accumulation → Higher Lows → MSS/BOS → Breakout → Reclaim → Consolidation → Potential Continuation
The June low created a major liquidity event, followed by a prolonged accumulation phase and gradual recovery.
SOL has now reclaimed the $100 psychological level and is holding above the major EMA cluster.
The next major structural test is $102.29–$104.64, followed by the $107–$112 resistance area.
📊 RSI Momentum
RSI: 56.24
RSI MA: 61.94
RSI remains above 50, indicating that bullish momentum is still present.
However, RSI is currently below its moving average, suggesting that momentum has cooled from the recent upside move. A renewed push above 60–62 would strengthen the continuation setup.
🎯 Key Levels
Resistance:
$102.29 → $104.00 → $104.64 → $107.07 → $109.84 → $112.00 → $129.49
Support:
$100.59 → $99.76 → $96.33 → $92.94 → $92.04 → $91.74 → $87.25 → $86.69
📌 Final Outlook
SOL remains in a constructive recovery structure while holding above the $100 area and all major EMAs.
The immediate battle is $102.29–$104.64. A decisive breakout above this zone could push SOL toward $107 → $109.84 → $112, while a sustained move beyond these levels could open the path toward $129.49.
On the downside, $99.76 is the key dynamic support. As long as SOL holds above this level, the broader recovery structure remains intact.
Bias: 🟢 Bullish above $99.76 | Stronger above $104.64
$SOL
61
·
--
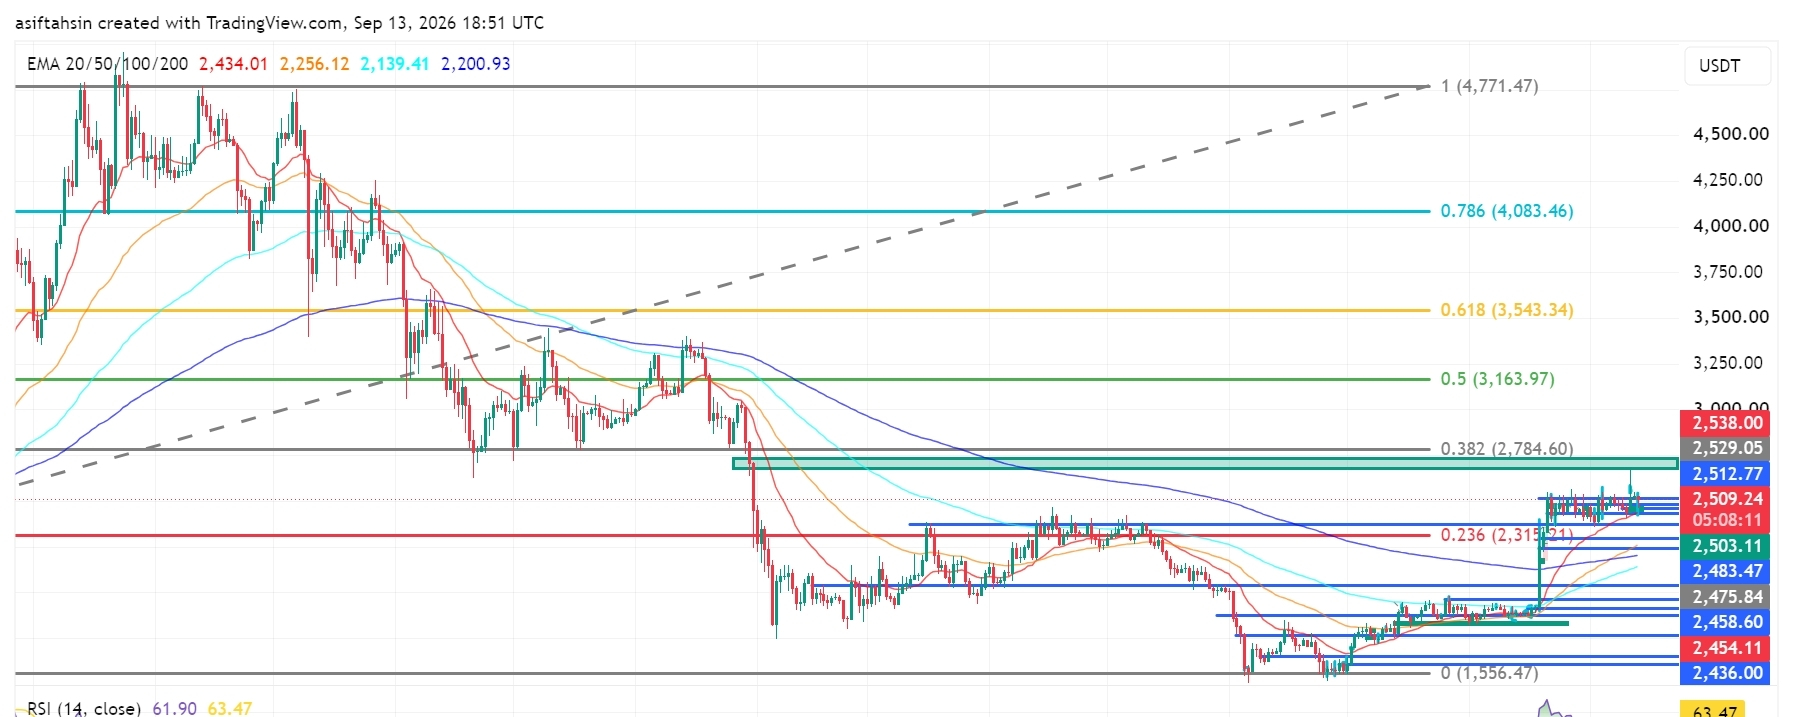
記事
翻訳参照
ETH Technical Outlook: Ethereum Holds Above $2.5K as Bulls Target Higher ResistanceETH is currently trading around $2,509, consolidating above the psychological $2,500 level after a strong recovery from the June lows.
The broader structure remains constructive, with ETH trading well above all four major EMAs. However, price is now approaching a significant resistance cluster around $2,512–$2,538. Bulls need a clean breakout above this zone to open the path toward the $2,784 Fibonacci resistance.
📈 EMA Structure
20 EMA: $2,434.01
50 EMA: $2,256.12
100 EMA: $2,139.41
200 EMA: $2,200.93
ETH remains comfortably above all four major EMAs, keeping the medium-term recovery structure bullish.
The $2,434 20 EMA is now the key dynamic support. As long as ETH remains above this level, buyers maintain control of the current recovery.
📐 Fibonacci Levels
0.236: $2,315.21
0.382: $2,784.60
0.5: $3,163.97
0.618: $3,543.34
0.786: $4,083.46
1.0: $4,771.47
The $2,784.60 0.382 Fibonacci level is the next major upside objective after the current resistance cluster.
🟢 Bullish Scenario
ETH is consolidating just below the $2,512–$2,538 resistance zone.
A clean breakout and sustained close above $2,538 could trigger another bullish expansion.
🎯 Target 1: $2,550
🎯 Target 2: $2,600
🎯 Target 3: $2,700
🎯 Target 4: $2,784.60
🎯 Target 5: $3,163.97
🎯 Target 6: $3,543.34
A decisive reclaim of $2,784.60 would be an important confirmation that ETH is transitioning into a stronger medium-term recovery phase.
🔴 Pullback Scenario
If ETH fails to break the $2,512–$2,538 resistance cluster, a short-term pullback could develop.
Key supports:
$2,503.11
$2,483.47
$2,475.84
$2,458.60
$2,454.11
$2,434.01 — 20 EMA
$2,315.21 — 0.236 Fib
The $2,454–$2,434 region is particularly important. A successful retest here could provide a base for another attempt at the $2,538 resistance.
A sustained break below the 20 EMA would weaken the short-term bullish structure.
🧠 Market Structure & Liquidity
ETH's recent structure can be viewed as:
Liquidity Sweep → Accumulation → Higher Lows → Breakout → Reclaim → Consolidation → Potential Continuation
The June low around $1,556 created a major liquidity sweep, followed by a strong recovery and a series of higher lows.
ETH has now reclaimed the $2,500 psychological level and is consolidating near the recent highs.
The next major structural test is $2,538, followed by the $2,784.60 Fibonacci resistance.
📊 RSI Momentum
RSI: 61.90
RSI MA: 63.47
RSI remains above 60, confirming that bullish momentum is still present.
However, RSI is slightly below its moving average, suggesting momentum has cooled from the recent spike. A renewed move above 63–65 would strengthen the continuation setup.
🎯 Key Levels
Resistance:
$2,512.77 → $2,529.05 → $2,538 → $2,784.60 → $3,163.97 → $3,543.34
Support:
$2,503.11 → $2,483.47 → $2,475.84 → $2,458.60 → $2,454.11 → $2,434.01 → $2,315.21
📌 Final Outlook
ETH remains in a constructive recovery structure while holding above the $2,500 area and all major EMAs.
The immediate battle is $2,512–$2,538. A decisive breakout above this zone could push ETH toward $2,600 → $2,700 → $2,784.60, while a confirmed break above $2,784 could open the path toward $3,163.97.
On the downside, $2,434 is the key dynamic support. As long as ETH holds above this level, the broader bullish recovery remains intact.
Bias: 🟢 Bullish above $2,434 | Stronger above $2,538
$ETH
{future}(ETHUSDT)
ETH Technical Outlook: Ethereum Holds Above $2.5K as Bulls Target Higher Resistance
ETH is currently trading around $2,509, consolidating above the psychological $2,500 level after a strong recovery from the June lows.
The broader structure remains constructive, with ETH trading well above all four major EMAs. However, price is now approaching a significant resistance cluster around $2,512–$2,538. Bulls need a clean breakout above this zone to open the path toward the $2,784 Fibonacci resistance.
📈 EMA Structure
20 EMA: $2,434.01
50 EMA: $2,256.12
100 EMA: $2,139.41
200 EMA: $2,200.93
ETH remains comfortably above all four major EMAs, keeping the medium-term recovery structure bullish.
The $2,434 20 EMA is now the key dynamic support. As long as ETH remains above this level, buyers maintain control of the current recovery.
📐 Fibonacci Levels
0.236: $2,315.21
0.382: $2,784.60
0.5: $3,163.97
0.618: $3,543.34
0.786: $4,083.46
1.0: $4,771.47
The $2,784.60 0.382 Fibonacci level is the next major upside objective after the current resistance cluster.
🟢 Bullish Scenario
ETH is consolidating just below the $2,512–$2,538 resistance zone.
A clean breakout and sustained close above $2,538 could trigger another bullish expansion.
🎯 Target 1: $2,550
🎯 Target 2: $2,600
🎯 Target 3: $2,700
🎯 Target 4: $2,784.60
🎯 Target 5: $3,163.97
🎯 Target 6: $3,543.34
A decisive reclaim of $2,784.60 would be an important confirmation that ETH is transitioning into a stronger medium-term recovery phase.
🔴 Pullback Scenario
If ETH fails to break the $2,512–$2,538 resistance cluster, a short-term pullback could develop.
Key supports:
$2,503.11
$2,483.47
$2,475.84
$2,458.60
$2,454.11
$2,434.01 — 20 EMA
$2,315.21 — 0.236 Fib
The $2,454–$2,434 region is particularly important. A successful retest here could provide a base for another attempt at the $2,538 resistance.
A sustained break below the 20 EMA would weaken the short-term bullish structure.
🧠 Market Structure & Liquidity
ETH's recent structure can be viewed as:
Liquidity Sweep → Accumulation → Higher Lows → Breakout → Reclaim → Consolidation → Potential Continuation
The June low around $1,556 created a major liquidity sweep, followed by a strong recovery and a series of higher lows.
ETH has now reclaimed the $2,500 psychological level and is consolidating near the recent highs.
The next major structural test is $2,538, followed by the $2,784.60 Fibonacci resistance.
📊 RSI Momentum
RSI: 61.90
RSI MA: 63.47
RSI remains above 60, confirming that bullish momentum is still present.
However, RSI is slightly below its moving average, suggesting momentum has cooled from the recent spike. A renewed move above 63–65 would strengthen the continuation setup.
🎯 Key Levels
Resistance:
$2,512.77 → $2,529.05 → $2,538 → $2,784.60 → $3,163.97 → $3,543.34
Support:
$2,503.11 → $2,483.47 → $2,475.84 → $2,458.60 → $2,454.11 → $2,434.01 → $2,315.21
📌 Final Outlook
ETH remains in a constructive recovery structure while holding above the $2,500 area and all major EMAs.
The immediate battle is $2,512–$2,538. A decisive breakout above this zone could push ETH toward $2,600 → $2,700 → $2,784.60, while a confirmed break above $2,784 could open the path toward $3,163.97.
On the downside, $2,434 is the key dynamic support. As long as ETH holds above this level, the broader bullish recovery remains intact.
Bias: 🟢 Bullish above $2,434 | Stronger above $2,538
$ETH
The broader structure remains constructive, with ETH trading well above all four major EMAs. However, price is now approaching a significant resistance cluster around $2,512–$2,538. Bulls need a clean breakout above this zone to open the path toward the $2,784 Fibonacci resistance.
📈 EMA Structure
20 EMA: $2,434.01
50 EMA: $2,256.12
100 EMA: $2,139.41
200 EMA: $2,200.93
ETH remains comfortably above all four major EMAs, keeping the medium-term recovery structure bullish.
The $2,434 20 EMA is now the key dynamic support. As long as ETH remains above this level, buyers maintain control of the current recovery.
📐 Fibonacci Levels
0.236: $2,315.21
0.382: $2,784.60
0.5: $3,163.97
0.618: $3,543.34
0.786: $4,083.46
1.0: $4,771.47
The $2,784.60 0.382 Fibonacci level is the next major upside objective after the current resistance cluster.
🟢 Bullish Scenario
ETH is consolidating just below the $2,512–$2,538 resistance zone.
A clean breakout and sustained close above $2,538 could trigger another bullish expansion.
🎯 Target 1: $2,550
🎯 Target 2: $2,600
🎯 Target 3: $2,700
🎯 Target 4: $2,784.60
🎯 Target 5: $3,163.97
🎯 Target 6: $3,543.34
A decisive reclaim of $2,784.60 would be an important confirmation that ETH is transitioning into a stronger medium-term recovery phase.
🔴 Pullback Scenario
If ETH fails to break the $2,512–$2,538 resistance cluster, a short-term pullback could develop.
Key supports:
$2,503.11
$2,483.47
$2,475.84
$2,458.60
$2,454.11
$2,434.01 — 20 EMA
$2,315.21 — 0.236 Fib
The $2,454–$2,434 region is particularly important. A successful retest here could provide a base for another attempt at the $2,538 resistance.
A sustained break below the 20 EMA would weaken the short-term bullish structure.
🧠 Market Structure & Liquidity
ETH's recent structure can be viewed as:
Liquidity Sweep → Accumulation → Higher Lows → Breakout → Reclaim → Consolidation → Potential Continuation
The June low around $1,556 created a major liquidity sweep, followed by a strong recovery and a series of higher lows.
ETH has now reclaimed the $2,500 psychological level and is consolidating near the recent highs.
The next major structural test is $2,538, followed by the $2,784.60 Fibonacci resistance.
📊 RSI Momentum
RSI: 61.90
RSI MA: 63.47
RSI remains above 60, confirming that bullish momentum is still present.
However, RSI is slightly below its moving average, suggesting momentum has cooled from the recent spike. A renewed move above 63–65 would strengthen the continuation setup.
🎯 Key Levels
Resistance:
$2,512.77 → $2,529.05 → $2,538 → $2,784.60 → $3,163.97 → $3,543.34
Support:
$2,503.11 → $2,483.47 → $2,475.84 → $2,458.60 → $2,454.11 → $2,434.01 → $2,315.21
📌 Final Outlook
ETH remains in a constructive recovery structure while holding above the $2,500 area and all major EMAs.
The immediate battle is $2,512–$2,538. A decisive breakout above this zone could push ETH toward $2,600 → $2,700 → $2,784.60, while a confirmed break above $2,784 could open the path toward $3,163.97.
On the downside, $2,434 is the key dynamic support. As long as ETH holds above this level, the broader bullish recovery remains intact.
Bias: 🟢 Bullish above $2,434 | Stronger above $2,538
$ETH
83
·
--
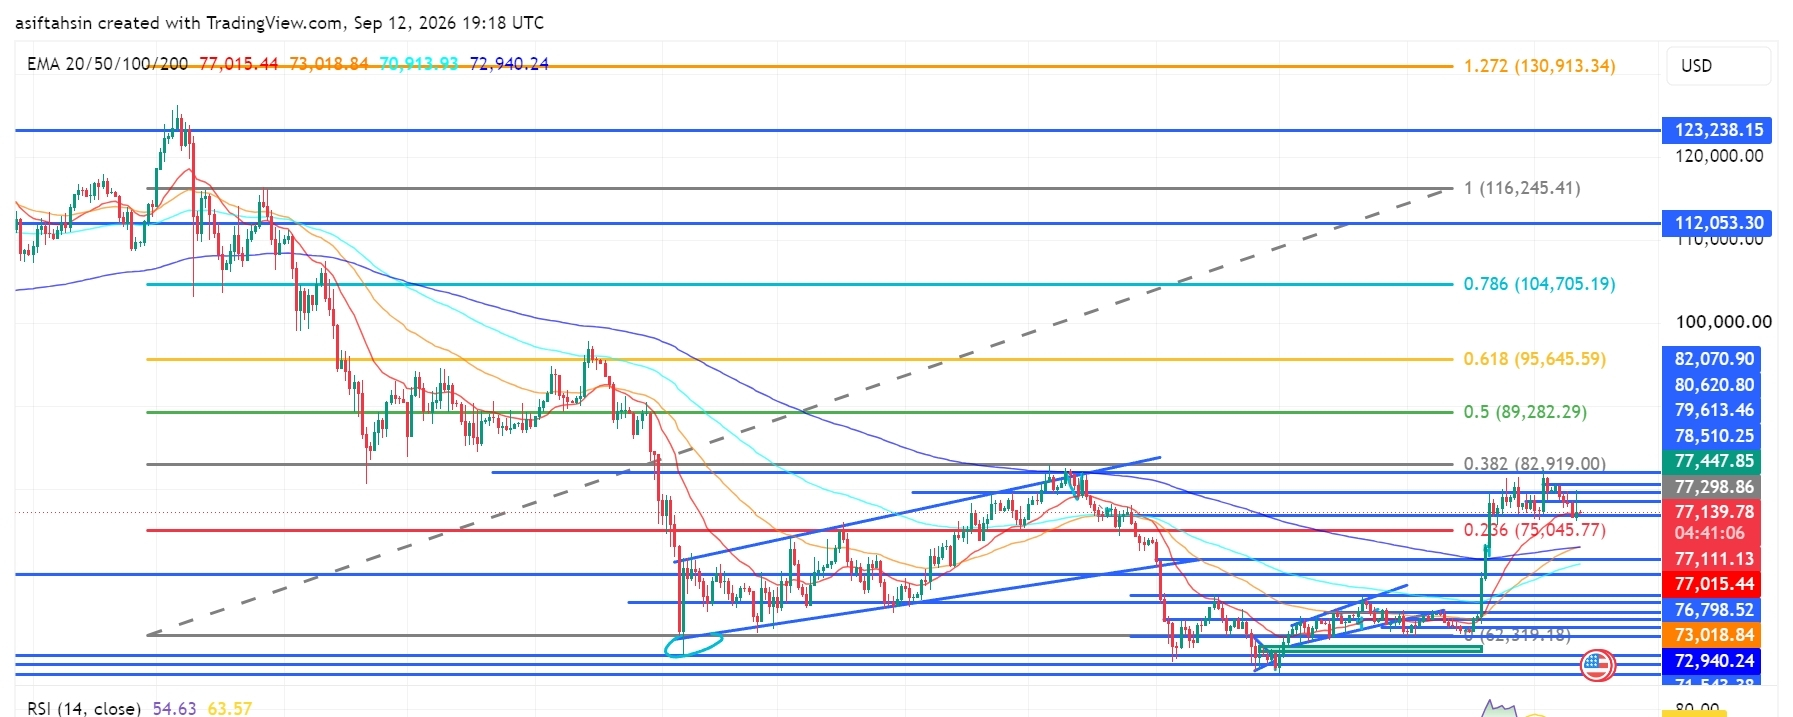
記事
翻訳参照
BTC Technical Outlook: Bitcoin Holds Above $77K as Bulls Defend the BreakoutBTC is currently trading around $77.1K, consolidating above the $75K–$77K breakout zone after the recent bullish recovery.
The broader structure remains constructive, but BTC is facing strong resistance around $77.4K–$82.9K. Bulls need to reclaim this resistance cluster and break the $82,919 Fibonacci level to unlock the next major upside expansion.
📈 EMA Structure
20 EMA: $77,015.44
50 EMA: $73,018.84
100 EMA: $70,913.93
200 EMA: $72,940.24
BTC is currently holding just above the 20 EMA, while remaining above the 50, 100 and 200 EMAs.
The $77,015 20 EMA is now an important short-term pivot. Holding above it keeps the recent recovery structure intact.
📐 Fibonacci Levels
0.236: $75,045.77
0.382: $82,919.00
0.5: $89,282.29
0.618: $95,645.59
0.786: $104,705.19
1.0: $116,245.41
1.272: $130,913.34
The $82,919 0.382 Fibonacci level is the key breakout point. A sustained move above it would significantly strengthen the medium-term bullish structure.
🟢 Bullish Scenario
BTC is currently consolidating below the $77.4K–$80.6K resistance cluster.
A clean breakout above $78,510–$79,614 could bring the next resistance levels into play.
🎯 Target 1: $80,620
🎯 Target 2: $82,070
🎯 Target 3: $82,919
🎯 Target 4: $89,282
🎯 Target 5: $95,645
🎯 Target 6: $104,705
If BTC successfully reclaims $82,919, the broader recovery could accelerate toward $89K and $95.6K.
🔴 Pullback Scenario
If BTC fails to break the current resistance zone, sellers could push price back toward the EMA and Fibonacci support structure.
Key supports:
$77,015 — 20 EMA
$76,798
$75,045 — 0.236 Fib
$73,018 — 50 EMA
$72,940 — 200 EMA
$71,543
$70,913 — 100 EMA
The $75,045–$77,015 region is particularly important. A successful retest here could provide the foundation for another attempt at $80K+.
However, losing $72,940–$70,913 would significantly weaken the current recovery structure.
🧠 Market Structure & Liquidity
BTC's recent structure can be viewed as:
Liquidity Sweep → Accumulation → Higher Highs/Higher Lows → Breakout → Retest → Consolidation → Potential Continuation
The June/July lows created a major liquidity area, followed by a strong recovery and breakout through the previous consolidation range.
BTC is now attempting to establish acceptance above $77K. The next major structural test is the $82K–$82.9K region, where previous price action and the 0.382 Fibonacci level converge.
📊 RSI Momentum
RSI: 54.63
RSI MA: 63.57
RSI remains above the neutral 50 level, indicating that bullish momentum is still present.
However, RSI is below its moving average, showing that momentum has cooled from the recent spike. A move back above 60–63 would strengthen the continuation setup.
🎯 Key Levels
Resistance:
$77,447 → $78,510 → $79,614 → $80,620 → $82,070 → $82,919 → $89,282 → $95,645
Support:
$77,015 → $76,798 → $75,045 → $73,018 → $72,940 → $71,543 → $70,913
📌 Final Outlook
BTC remains in a constructive recovery structure while holding above the $75K–$77K zone and the major EMA support cluster.
The immediate battle is $77.4K–$80.6K. A decisive breakout above this region could send BTC toward $82K–$82.9K, while a confirmed break above $82,919 would open the path toward $89.2K → $95.6K → $104.7K.
On the downside, $75,045 is the key Fibonacci support, while $72.9K–$70.9K is the major structural defense.
Bias: 🟢 Bullish above $75,045 | Stronger above $82,919
$BTC
{future}(BTCUSDT)
BTC Technical Outlook: Bitcoin Holds Above $77K as Bulls Defend the Breakout
BTC is currently trading around $77.1K, consolidating above the $75K–$77K breakout zone after the recent bullish recovery.
The broader structure remains constructive, but BTC is facing strong resistance around $77.4K–$82.9K. Bulls need to reclaim this resistance cluster and break the $82,919 Fibonacci level to unlock the next major upside expansion.
📈 EMA Structure
20 EMA: $77,015.44
50 EMA: $73,018.84
100 EMA: $70,913.93
200 EMA: $72,940.24
BTC is currently holding just above the 20 EMA, while remaining above the 50, 100 and 200 EMAs.
The $77,015 20 EMA is now an important short-term pivot. Holding above it keeps the recent recovery structure intact.
📐 Fibonacci Levels
0.236: $75,045.77
0.382: $82,919.00
0.5: $89,282.29
0.618: $95,645.59
0.786: $104,705.19
1.0: $116,245.41
1.272: $130,913.34
The $82,919 0.382 Fibonacci level is the key breakout point. A sustained move above it would significantly strengthen the medium-term bullish structure.
🟢 Bullish Scenario
BTC is currently consolidating below the $77.4K–$80.6K resistance cluster.
A clean breakout above $78,510–$79,614 could bring the next resistance levels into play.
🎯 Target 1: $80,620
🎯 Target 2: $82,070
🎯 Target 3: $82,919
🎯 Target 4: $89,282
🎯 Target 5: $95,645
🎯 Target 6: $104,705
If BTC successfully reclaims $82,919, the broader recovery could accelerate toward $89K and $95.6K.
🔴 Pullback Scenario
If BTC fails to break the current resistance zone, sellers could push price back toward the EMA and Fibonacci support structure.
Key supports:
$77,015 — 20 EMA
$76,798
$75,045 — 0.236 Fib
$73,018 — 50 EMA
$72,940 — 200 EMA
$71,543
$70,913 — 100 EMA
The $75,045–$77,015 region is particularly important. A successful retest here could provide the foundation for another attempt at $80K+.
However, losing $72,940–$70,913 would significantly weaken the current recovery structure.
🧠 Market Structure & Liquidity
BTC's recent structure can be viewed as:
Liquidity Sweep → Accumulation → Higher Highs/Higher Lows → Breakout → Retest → Consolidation → Potential Continuation
The June/July lows created a major liquidity area, followed by a strong recovery and breakout through the previous consolidation range.
BTC is now attempting to establish acceptance above $77K. The next major structural test is the $82K–$82.9K region, where previous price action and the 0.382 Fibonacci level converge.
📊 RSI Momentum
RSI: 54.63
RSI MA: 63.57
RSI remains above the neutral 50 level, indicating that bullish momentum is still present.
However, RSI is below its moving average, showing that momentum has cooled from the recent spike. A move back above 60–63 would strengthen the continuation setup.
🎯 Key Levels
Resistance:
$77,447 → $78,510 → $79,614 → $80,620 → $82,070 → $82,919 → $89,282 → $95,645
Support:
$77,015 → $76,798 → $75,045 → $73,018 → $72,940 → $71,543 → $70,913
📌 Final Outlook
BTC remains in a constructive recovery structure while holding above the $75K–$77K zone and the major EMA support cluster.
The immediate battle is $77.4K–$80.6K. A decisive breakout above this region could send BTC toward $82K–$82.9K, while a confirmed break above $82,919 would open the path toward $89.2K → $95.6K → $104.7K.
On the downside, $75,045 is the key Fibonacci support, while $72.9K–$70.9K is the major structural defense.
Bias: 🟢 Bullish above $75,045 | Stronger above $82,919
$BTC
The broader structure remains constructive, but BTC is facing strong resistance around $77.4K–$82.9K. Bulls need to reclaim this resistance cluster and break the $82,919 Fibonacci level to unlock the next major upside expansion.
📈 EMA Structure
20 EMA: $77,015.44
50 EMA: $73,018.84
100 EMA: $70,913.93
200 EMA: $72,940.24
BTC is currently holding just above the 20 EMA, while remaining above the 50, 100 and 200 EMAs.
The $77,015 20 EMA is now an important short-term pivot. Holding above it keeps the recent recovery structure intact.
📐 Fibonacci Levels
0.236: $75,045.77
0.382: $82,919.00
0.5: $89,282.29
0.618: $95,645.59
0.786: $104,705.19
1.0: $116,245.41
1.272: $130,913.34
The $82,919 0.382 Fibonacci level is the key breakout point. A sustained move above it would significantly strengthen the medium-term bullish structure.
🟢 Bullish Scenario
BTC is currently consolidating below the $77.4K–$80.6K resistance cluster.
A clean breakout above $78,510–$79,614 could bring the next resistance levels into play.
🎯 Target 1: $80,620
🎯 Target 2: $82,070
🎯 Target 3: $82,919
🎯 Target 4: $89,282
🎯 Target 5: $95,645
🎯 Target 6: $104,705
If BTC successfully reclaims $82,919, the broader recovery could accelerate toward $89K and $95.6K.
🔴 Pullback Scenario
If BTC fails to break the current resistance zone, sellers could push price back toward the EMA and Fibonacci support structure.
Key supports:
$77,015 — 20 EMA
$76,798
$75,045 — 0.236 Fib
$73,018 — 50 EMA
$72,940 — 200 EMA
$71,543
$70,913 — 100 EMA
The $75,045–$77,015 region is particularly important. A successful retest here could provide the foundation for another attempt at $80K+.
However, losing $72,940–$70,913 would significantly weaken the current recovery structure.
🧠 Market Structure & Liquidity
BTC's recent structure can be viewed as:
Liquidity Sweep → Accumulation → Higher Highs/Higher Lows → Breakout → Retest → Consolidation → Potential Continuation
The June/July lows created a major liquidity area, followed by a strong recovery and breakout through the previous consolidation range.
BTC is now attempting to establish acceptance above $77K. The next major structural test is the $82K–$82.9K region, where previous price action and the 0.382 Fibonacci level converge.
📊 RSI Momentum
RSI: 54.63
RSI MA: 63.57
RSI remains above the neutral 50 level, indicating that bullish momentum is still present.
However, RSI is below its moving average, showing that momentum has cooled from the recent spike. A move back above 60–63 would strengthen the continuation setup.
🎯 Key Levels
Resistance:
$77,447 → $78,510 → $79,614 → $80,620 → $82,070 → $82,919 → $89,282 → $95,645
Support:
$77,015 → $76,798 → $75,045 → $73,018 → $72,940 → $71,543 → $70,913
📌 Final Outlook
BTC remains in a constructive recovery structure while holding above the $75K–$77K zone and the major EMA support cluster.
The immediate battle is $77.4K–$80.6K. A decisive breakout above this region could send BTC toward $82K–$82.9K, while a confirmed break above $82,919 would open the path toward $89.2K → $95.6K → $104.7K.
On the downside, $75,045 is the key Fibonacci support, while $72.9K–$70.9K is the major structural defense.
Bias: 🟢 Bullish above $75,045 | Stronger above $82,919
$BTC
37
·
--
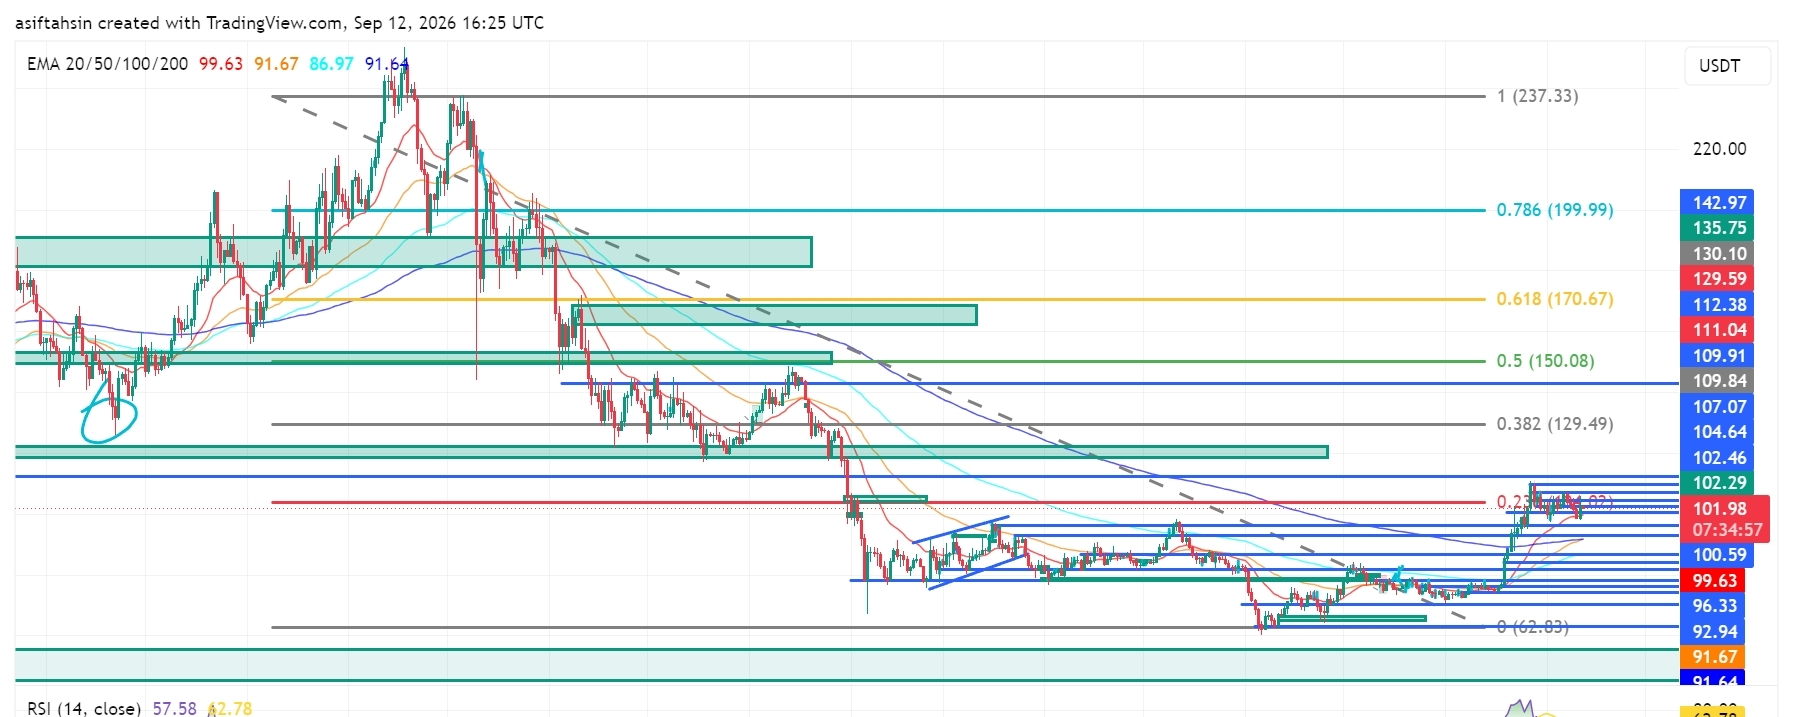
記事
SOL テクニカル見通し:ソラナは$100を上回り、強気派がブレイクアウトを防衛SOLは現在$101.98前後で推移しており、長いもみ合い(コンソリデーション)構造からブレイクアウトした後、心理的節目である$100を上回っています。
より広い市場構造は改善しており、現在SOLは4つの主要EMAすべてを上回る水準で取引されています。ただし、価格は$102.29〜$104.64付近の強いレジスタンス・クラスターに直面しています。強気派は、このエリアを明確に上抜ける必要があり、それによって高いフィボナッチ・レベルへの道が開かれます。
📈 EMA 構造
20 EMA: $99.63
50 EMA: $91.67
100 EMA: $86.97
200 EMA: $91.64
SOLは依然として4つの主要EMAすべてを上回っており、短期〜中期の構造は前向きな状態を保っています。
SOL テクニカル見通し:ソラナは$100を上回り、強気派がブレイクアウトを防衛
SOLは現在$101.98前後で推移しており、長いもみ合い(コンソリデーション)構造からブレイクアウトした後、心理的節目である$100を上回っています。
より広い市場構造は改善しており、現在SOLは4つの主要EMAすべてを上回る水準で取引されています。ただし、価格は$102.29〜$104.64付近の強いレジスタンス・クラスターに直面しています。強気派は、このエリアを明確に上抜ける必要があり、それによって高いフィボナッチ・レベルへの道が開かれます。
📈 EMA 構造
20 EMA: $99.63
50 EMA: $91.67
100 EMA: $86.97
200 EMA: $91.64
SOLは依然として4つの主要EMAすべてを上回っており、短期〜中期の構造は前向きな状態を保っています。
より広い市場構造は改善しており、現在SOLは4つの主要EMAすべてを上回る水準で取引されています。ただし、価格は$102.29〜$104.64付近の強いレジスタンス・クラスターに直面しています。強気派は、このエリアを明確に上抜ける必要があり、それによって高いフィボナッチ・レベルへの道が開かれます。
📈 EMA 構造
20 EMA: $99.63
50 EMA: $91.67
100 EMA: $86.97
200 EMA: $91.64
SOLは依然として4つの主要EMAすべてを上回っており、短期〜中期の構造は前向きな状態を保っています。
94
·
--
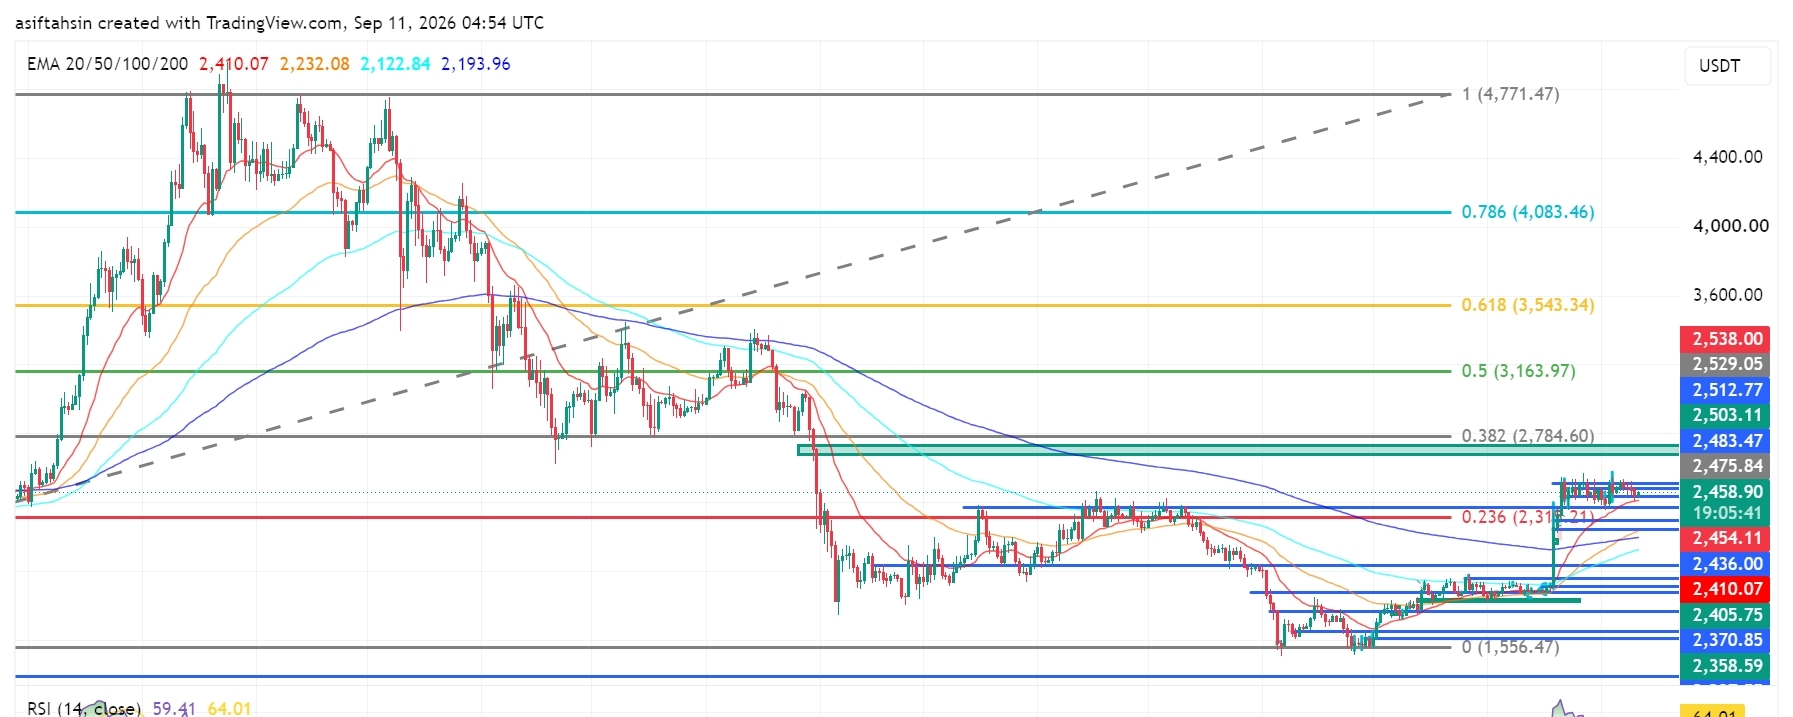
記事
翻訳参照
ETH Technical Outlook: ETH Holds Above $2.4K as Bulls Defend the BreakoutETH is showing a constructive bullish recovery after breaking out from the prolonged consolidation structure. Price is currently around $2,459 and continues to hold above the reclaimed $2,400–$2,450 area.
The market structure remains bullish, but ETH is now consolidating below the $2,475–$2,538 resistance cluster. Bulls need to reclaim this zone for the next major upside expansion.
📈 EMA Structure
20 EMA: $2,410.07
50 EMA: $2,232.08
100 EMA: $2,122.84
200 EMA: $2,193.96
ETH is currently trading above all four major EMAs.
The strongest development is the recovery above the 200 EMA at $2,193.96, followed by the breakout above the short-term EMA structure.
The 20 EMA at $2,410.07 is now an important dynamic support level. As long as ETH holds above this area, the short-term bullish structure remains intact.
📐 Fibonacci Levels
Key Fibonacci levels:
0.236: $2,315.21
0.382: $2,784.60
0.5: $3,163.97
0.618: $3,543.34
0.786: $4,083.46
1.0: $4,771.47
ETH has reclaimed the 0.236 Fibonacci area, while the next major higher-timeframe Fibonacci resistance is positioned at $2,784.60.
A sustained breakout above the current resistance cluster could therefore open the path toward the 0.382 Fibonacci level at $2,784.60.
🟢 Bullish Scenario
ETH is consolidating after the recent bullish expansion and continues to hold above the $2,450 breakout area.
Immediate resistance:
$2,475.84
$2,483.47
$2,503.11
$2,512.77
$2,529.05
$2,538.00
$2,784.60 — 0.382 Fibonacci
A clean breakout and sustained close above $2,538 would strengthen the bullish continuation setup.
🎯 Target 1: $2,538
🎯 Target 2: $2,784.60 — 0.382 Fibonacci
🎯 Target 3: $3,163.97 — 0.5 Fibonacci
🎯 Target 4: $3,543.34 — 0.618 Fibonacci
A confirmed breakout above $2,784.60 would significantly improve the medium-term structure and potentially open the way toward the $3,164 region.
🔴 Pullback Scenario
After the recent bullish expansion, a retest of the reclaimed breakout area would be normal.
Key supports:
$2,454.11
$2,436.00
$2,410.07 — 20 EMA
$2,405.75
$2,370.85
$2,358.59
$2,297.55
$2,193.96 — 200 EMA
The $2,405–$2,454 zone is particularly important.
If ETH holds this area during a pullback, the current breakout structure remains intact.
A sustained loss of $2,405 would weaken the immediate bullish setup and could expose the $2,370–$2,358 support zone.
🧠 Market Structure & Liquidity
ETH has formed a strong recovery structure after sweeping liquidity around the $2,300–$2,400 demand region.
The recent move produced a clear market-structure shift, followed by a breakout above the previous consolidation resistance.
ETH is now forming an important:
Breakout → Retest → Consolidation → Continuation
structure.
The main upside liquidity is concentrated around $2,475–$2,538. Above this zone, the next major target aligns with the $2,784.60 Fibonacci level.
Recent market analysis also describes ETH's post-rally consolidation as a potential bull flag, with the broader bullish scenario remaining constructive while the $2,350–$2,360 region holds.
📊 RSI Momentum
RSI (14): 59.41
RSI remains above the neutral 50 level, confirming that bullish momentum is still present.
However, RSI has cooled from the recent higher readings, indicating that ETH is currently experiencing healthy consolidation rather than immediate momentum expansion.
A sustained RSI hold above 50–55 would favor another bullish attempt toward the resistance zone.
A breakdown below 50 would indicate weakening short-term momentum.
🎯 Key Levels
🔴 Major Resistance: $2,475.84 → $2,503.11 → $2,529.05 → $2,538
🟢 Major Support: $2,454.11 → $2,436 → $2,410.07 → $2,405.75 → $2,370.85
📉 Dynamic EMA Support: $2,410.07 — 20 EMA | $2,193.96 — 200 EMA
🚀 Upside Targets: $2,538 → $2,784.60 → $3,163.97 → $3,543.34
📌 Final Outlook
ETH's structure remains constructive after the recent breakout, but price is currently consolidating below the $2,475–$2,538 resistance zone.
The $2,405–$2,454 area is now the key short-term support region. As long as ETH holds above this zone, the bullish structure remains valid.
The immediate battle is around $2,475–$2,538. A confirmed breakout above $2,538 could accelerate the move toward $2,784.60, followed by $3,163.97 and potentially $3,543.34.
However, rejection from resistance followed by a sustained loss of $2,405 would weaken the immediate bullish momentum and increase the probability of a deeper retracement toward the $2,370–$2,358 area.
Bias: 🟢 Bullish above $2,405. A breakout above $2,538 could open the path toward $2,784.60, with $3,163.97 as the next major Fibonacci target.
$ETH
{future}(ETHUSDT)
ETH Technical Outlook: ETH Holds Above $2.4K as Bulls Defend the Breakout
ETH is showing a constructive bullish recovery after breaking out from the prolonged consolidation structure. Price is currently around $2,459 and continues to hold above the reclaimed $2,400–$2,450 area.
The market structure remains bullish, but ETH is now consolidating below the $2,475–$2,538 resistance cluster. Bulls need to reclaim this zone for the next major upside expansion.
📈 EMA Structure
20 EMA: $2,410.07
50 EMA: $2,232.08
100 EMA: $2,122.84
200 EMA: $2,193.96
ETH is currently trading above all four major EMAs.
The strongest development is the recovery above the 200 EMA at $2,193.96, followed by the breakout above the short-term EMA structure.
The 20 EMA at $2,410.07 is now an important dynamic support level. As long as ETH holds above this area, the short-term bullish structure remains intact.
📐 Fibonacci Levels
Key Fibonacci levels:
0.236: $2,315.21
0.382: $2,784.60
0.5: $3,163.97
0.618: $3,543.34
0.786: $4,083.46
1.0: $4,771.47
ETH has reclaimed the 0.236 Fibonacci area, while the next major higher-timeframe Fibonacci resistance is positioned at $2,784.60.
A sustained breakout above the current resistance cluster could therefore open the path toward the 0.382 Fibonacci level at $2,784.60.
🟢 Bullish Scenario
ETH is consolidating after the recent bullish expansion and continues to hold above the $2,450 breakout area.
Immediate resistance:
$2,475.84
$2,483.47
$2,503.11
$2,512.77
$2,529.05
$2,538.00
$2,784.60 — 0.382 Fibonacci
A clean breakout and sustained close above $2,538 would strengthen the bullish continuation setup.
🎯 Target 1: $2,538
🎯 Target 2: $2,784.60 — 0.382 Fibonacci
🎯 Target 3: $3,163.97 — 0.5 Fibonacci
🎯 Target 4: $3,543.34 — 0.618 Fibonacci
A confirmed breakout above $2,784.60 would significantly improve the medium-term structure and potentially open the way toward the $3,164 region.
🔴 Pullback Scenario
After the recent bullish expansion, a retest of the reclaimed breakout area would be normal.
Key supports:
$2,454.11
$2,436.00
$2,410.07 — 20 EMA
$2,405.75
$2,370.85
$2,358.59
$2,297.55
$2,193.96 — 200 EMA
The $2,405–$2,454 zone is particularly important.
If ETH holds this area during a pullback, the current breakout structure remains intact.
A sustained loss of $2,405 would weaken the immediate bullish setup and could expose the $2,370–$2,358 support zone.
🧠 Market Structure & Liquidity
ETH has formed a strong recovery structure after sweeping liquidity around the $2,300–$2,400 demand region.
The recent move produced a clear market-structure shift, followed by a breakout above the previous consolidation resistance.
ETH is now forming an important:
Breakout → Retest → Consolidation → Continuation
structure.
The main upside liquidity is concentrated around $2,475–$2,538. Above this zone, the next major target aligns with the $2,784.60 Fibonacci level.
Recent market analysis also describes ETH's post-rally consolidation as a potential bull flag, with the broader bullish scenario remaining constructive while the $2,350–$2,360 region holds.
📊 RSI Momentum
RSI (14): 59.41
RSI remains above the neutral 50 level, confirming that bullish momentum is still present.
However, RSI has cooled from the recent higher readings, indicating that ETH is currently experiencing healthy consolidation rather than immediate momentum expansion.
A sustained RSI hold above 50–55 would favor another bullish attempt toward the resistance zone.
A breakdown below 50 would indicate weakening short-term momentum.
🎯 Key Levels
🔴 Major Resistance: $2,475.84 → $2,503.11 → $2,529.05 → $2,538
🟢 Major Support: $2,454.11 → $2,436 → $2,410.07 → $2,405.75 → $2,370.85
📉 Dynamic EMA Support: $2,410.07 — 20 EMA | $2,193.96 — 200 EMA
🚀 Upside Targets: $2,538 → $2,784.60 → $3,163.97 → $3,543.34
📌 Final Outlook
ETH's structure remains constructive after the recent breakout, but price is currently consolidating below the $2,475–$2,538 resistance zone.
The $2,405–$2,454 area is now the key short-term support region. As long as ETH holds above this zone, the bullish structure remains valid.
The immediate battle is around $2,475–$2,538. A confirmed breakout above $2,538 could accelerate the move toward $2,784.60, followed by $3,163.97 and potentially $3,543.34.
However, rejection from resistance followed by a sustained loss of $2,405 would weaken the immediate bullish momentum and increase the probability of a deeper retracement toward the $2,370–$2,358 area.
Bias: 🟢 Bullish above $2,405. A breakout above $2,538 could open the path toward $2,784.60, with $3,163.97 as the next major Fibonacci target.
$ETH
The market structure remains bullish, but ETH is now consolidating below the $2,475–$2,538 resistance cluster. Bulls need to reclaim this zone for the next major upside expansion.
📈 EMA Structure
20 EMA: $2,410.07
50 EMA: $2,232.08
100 EMA: $2,122.84
200 EMA: $2,193.96
ETH is currently trading above all four major EMAs.
The strongest development is the recovery above the 200 EMA at $2,193.96, followed by the breakout above the short-term EMA structure.
The 20 EMA at $2,410.07 is now an important dynamic support level. As long as ETH holds above this area, the short-term bullish structure remains intact.
📐 Fibonacci Levels
Key Fibonacci levels:
0.236: $2,315.21
0.382: $2,784.60
0.5: $3,163.97
0.618: $3,543.34
0.786: $4,083.46
1.0: $4,771.47
ETH has reclaimed the 0.236 Fibonacci area, while the next major higher-timeframe Fibonacci resistance is positioned at $2,784.60.
A sustained breakout above the current resistance cluster could therefore open the path toward the 0.382 Fibonacci level at $2,784.60.
🟢 Bullish Scenario
ETH is consolidating after the recent bullish expansion and continues to hold above the $2,450 breakout area.
Immediate resistance:
$2,475.84
$2,483.47
$2,503.11
$2,512.77
$2,529.05
$2,538.00
$2,784.60 — 0.382 Fibonacci
A clean breakout and sustained close above $2,538 would strengthen the bullish continuation setup.
🎯 Target 1: $2,538
🎯 Target 2: $2,784.60 — 0.382 Fibonacci
🎯 Target 3: $3,163.97 — 0.5 Fibonacci
🎯 Target 4: $3,543.34 — 0.618 Fibonacci
A confirmed breakout above $2,784.60 would significantly improve the medium-term structure and potentially open the way toward the $3,164 region.
🔴 Pullback Scenario
After the recent bullish expansion, a retest of the reclaimed breakout area would be normal.
Key supports:
$2,454.11
$2,436.00
$2,410.07 — 20 EMA
$2,405.75
$2,370.85
$2,358.59
$2,297.55
$2,193.96 — 200 EMA
The $2,405–$2,454 zone is particularly important.
If ETH holds this area during a pullback, the current breakout structure remains intact.
A sustained loss of $2,405 would weaken the immediate bullish setup and could expose the $2,370–$2,358 support zone.
🧠 Market Structure & Liquidity
ETH has formed a strong recovery structure after sweeping liquidity around the $2,300–$2,400 demand region.
The recent move produced a clear market-structure shift, followed by a breakout above the previous consolidation resistance.
ETH is now forming an important:
Breakout → Retest → Consolidation → Continuation
structure.
The main upside liquidity is concentrated around $2,475–$2,538. Above this zone, the next major target aligns with the $2,784.60 Fibonacci level.
Recent market analysis also describes ETH's post-rally consolidation as a potential bull flag, with the broader bullish scenario remaining constructive while the $2,350–$2,360 region holds.
📊 RSI Momentum
RSI (14): 59.41
RSI remains above the neutral 50 level, confirming that bullish momentum is still present.
However, RSI has cooled from the recent higher readings, indicating that ETH is currently experiencing healthy consolidation rather than immediate momentum expansion.
A sustained RSI hold above 50–55 would favor another bullish attempt toward the resistance zone.
A breakdown below 50 would indicate weakening short-term momentum.
🎯 Key Levels
🔴 Major Resistance: $2,475.84 → $2,503.11 → $2,529.05 → $2,538
🟢 Major Support: $2,454.11 → $2,436 → $2,410.07 → $2,405.75 → $2,370.85
📉 Dynamic EMA Support: $2,410.07 — 20 EMA | $2,193.96 — 200 EMA
🚀 Upside Targets: $2,538 → $2,784.60 → $3,163.97 → $3,543.34
📌 Final Outlook
ETH's structure remains constructive after the recent breakout, but price is currently consolidating below the $2,475–$2,538 resistance zone.
The $2,405–$2,454 area is now the key short-term support region. As long as ETH holds above this zone, the bullish structure remains valid.
The immediate battle is around $2,475–$2,538. A confirmed breakout above $2,538 could accelerate the move toward $2,784.60, followed by $3,163.97 and potentially $3,543.34.
However, rejection from resistance followed by a sustained loss of $2,405 would weaken the immediate bullish momentum and increase the probability of a deeper retracement toward the $2,370–$2,358 area.
Bias: 🟢 Bullish above $2,405. A breakout above $2,538 could open the path toward $2,784.60, with $3,163.97 as the next major Fibonacci target.
$ETH
66
·
--
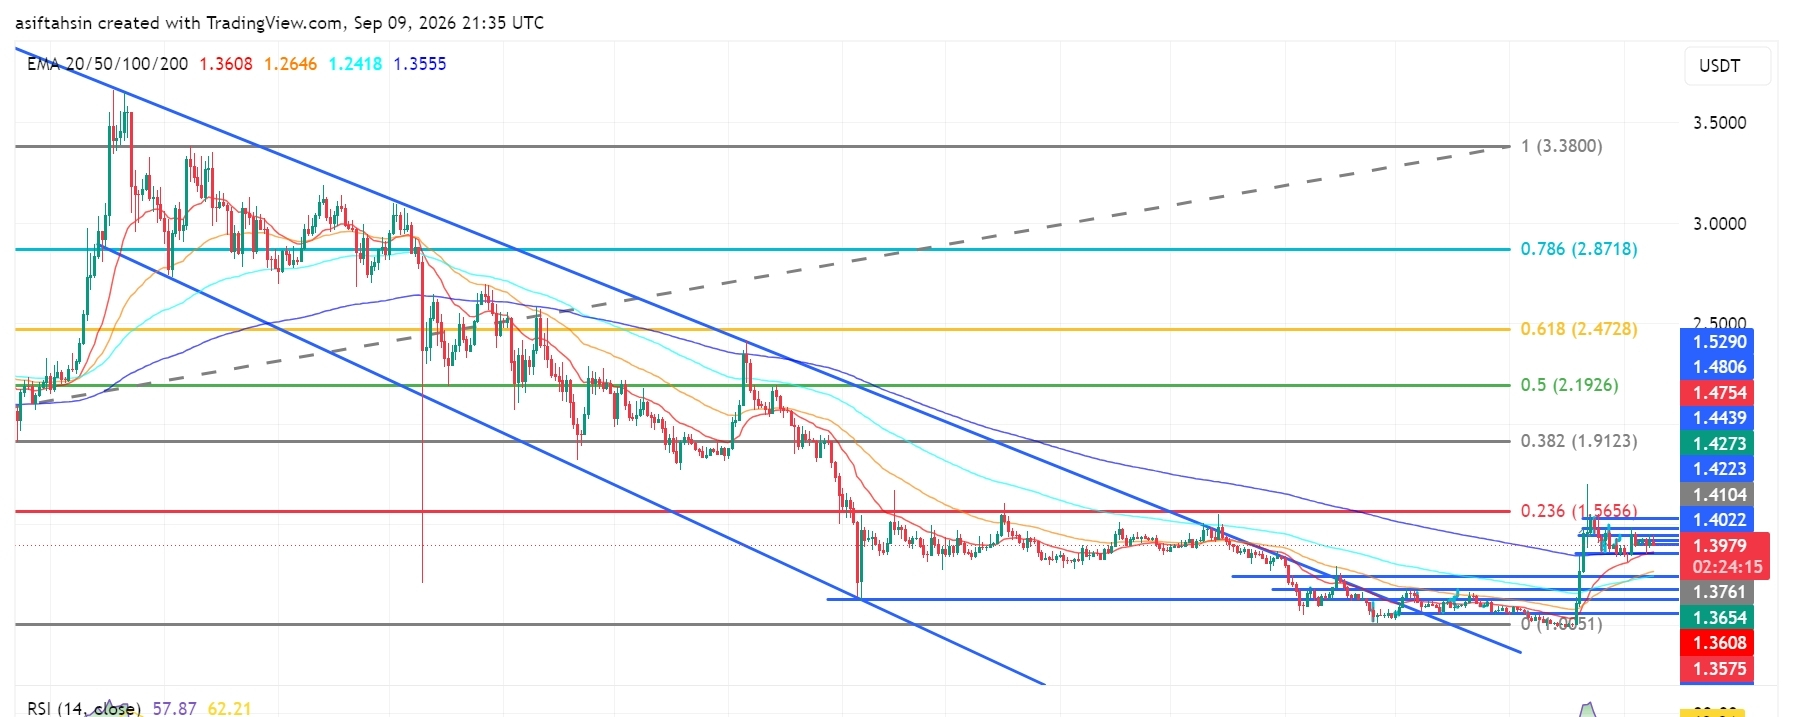
記事
翻訳参照
XRP Technical Outlook: XRP Holds Above $1.36 as Bulls Defend the RecoveryXRP is currently trading around $1.40, holding above the recently reclaimed $1.36–$1.38 support zone after a strong recovery from the June lows.
The broader market structure is showing signs of improvement, but XRP is now consolidating below the $1.40–$1.48 resistance cluster. Bulls need to reclaim this area and eventually break the $1.5656 Fibonacci resistance for the next major upside expansion.
📈 EMA Structure
20 EMA: $1.3608
50 EMA: $1.2646
100 EMA: $1.2419
200 EMA: $1.3555
XRP is currently trading above all four major EMAs.
The strongest development is the recovery above the 200 EMA at $1.3555, followed by the reclaim of the short-term EMA structure.
The 20 EMA at $1.3608 is now an important dynamic support level. As long as XRP holds above this area, the short-term recovery structure remains constructive.
📐 Fibonacci Levels
Key Fibonacci levels:
0.236: $1.5656
0.382: $1.9123
0.5: $2.1926
0.618: $2.4728
0.786: $2.8718
1.0: $3.3800
XRP has recovered strongly from the lower support region, but the major Fibonacci resistance remains at $1.5656.
A sustained breakout above $1.5656 would provide a stronger confirmation of the medium-term recovery and could open the path toward the $1.91 region.
🟢 Bullish Scenario
XRP has formed a strong recovery from the $1.35–$1.36 demand region and recently pushed above the previous consolidation structure.
Immediate resistance:
$1.4022
$1.4104
$1.4223
$1.4439
$1.4754
$1.4806
$1.5290
$1.5656 — 0.236 Fibonacci
A clean breakout and sustained close above $1.5656 would provide stronger confirmation of bullish continuation.
🎯 Target 1: $1.4439
🎯 Target 2: $1.4806
🎯 Target 3: $1.5656 — 0.236 Fibonacci
🎯 Target 4: $1.9123 — 0.382 Fibonacci
🎯 Target 5: $2.1926 — 0.5 Fibonacci
A confirmed breakout above $1.5656 could significantly strengthen the medium-term structure and potentially accelerate XRP toward the $1.91–$2.19 region.
🔴 Pullback Scenario
After the recent sharp recovery, a consolidation or retest of the breakout area would be normal.
Key supports:
$1.3761
$1.3654
$1.3608 — 20 EMA
$1.3575
$1.3555 — 200 EMA
$1.3573
The $1.35–$1.38 zone is particularly important.
If XRP continues to hold this area during a pullback, the current recovery structure remains valid.
A sustained loss of $1.3555–$1.3575 would weaken the bullish setup and could expose XRP to a deeper retracement toward the previous consolidation and demand areas.
🧠 Market Structure & Liquidity
XRP spent several months consolidating near the $1.35–$1.40 region after the prolonged downtrend.
The recent move produced a clear market-structure shift, followed by a strong breakout from the lower consolidation range.
XRP is now moving through an important:
Accumulation → Breakout → Retest → Continuation
structure.
The immediate upside liquidity is concentrated around $1.40–$1.48, while the larger technical resistance sits at the $1.5656 Fibonacci level.
A decisive breakout above $1.5656 would shift attention toward $1.9123, followed by $2.1926.
📊 RSI Momentum
RSI (14): 57.87
RSI remains above the neutral 50 level, confirming that bullish momentum is still present.
However, RSI has cooled from the recent higher readings, suggesting that XRP is currently undergoing consolidation after its strong recovery.
A sustained RSI hold above 50–55 would favor another bullish attempt toward the resistance zone.
A breakdown below 50 would indicate weakening short-term momentum.
🎯 Key Levels
🔴 Major Resistance: $1.4022 → $1.4104 → $1.4223 → $1.4439 → $1.4754 → $1.4806 → $1.5656
🟢 Major Support: $1.3761 → $1.3654 → $1.3608 → $1.3575
📉 Dynamic EMA Support: $1.3608 — 20 EMA | $1.3555 — 200 EMA
🚀 Upside Targets: $1.5656 → $1.9123 → $2.1926 → $2.4728 → $2.8718
📌 Final Outlook
XRP's broader structure is showing a meaningful recovery after the extended downtrend and long consolidation around the $1.35–$1.40 region.
The $1.35–$1.38 area is now the key short-term support zone. As long as XRP holds above this region and remains above the 20 EMA and 200 EMA, bulls retain control of the current recovery structure.
The immediate battle is around $1.40–$1.48. A confirmed breakout above $1.5656 would provide stronger bullish confirmation and could accelerate the move toward $1.9123, followed by $2.1926 and potentially higher Fibonacci levels.
However, rejection from resistance followed by a sustained loss of $1.3555–$1.3575 would weaken the recovery structure and increase the probability of a deeper retracement.
Bias: 🟢 Bullish above $1.3555. A breakout above $1.5656 could open the path toward $1.9123, with $2.1926 as the next major Fibonacci target.
$XRP
{future}(XRPUSDT)
XRP Technical Outlook: XRP Holds Above $1.36 as Bulls Defend the Recovery
XRP is currently trading around $1.40, holding above the recently reclaimed $1.36–$1.38 support zone after a strong recovery from the June lows.
The broader market structure is showing signs of improvement, but XRP is now consolidating below the $1.40–$1.48 resistance cluster. Bulls need to reclaim this area and eventually break the $1.5656 Fibonacci resistance for the next major upside expansion.
📈 EMA Structure
20 EMA: $1.3608
50 EMA: $1.2646
100 EMA: $1.2419
200 EMA: $1.3555
XRP is currently trading above all four major EMAs.
The strongest development is the recovery above the 200 EMA at $1.3555, followed by the reclaim of the short-term EMA structure.
The 20 EMA at $1.3608 is now an important dynamic support level. As long as XRP holds above this area, the short-term recovery structure remains constructive.
📐 Fibonacci Levels
Key Fibonacci levels:
0.236: $1.5656
0.382: $1.9123
0.5: $2.1926
0.618: $2.4728
0.786: $2.8718
1.0: $3.3800
XRP has recovered strongly from the lower support region, but the major Fibonacci resistance remains at $1.5656.
A sustained breakout above $1.5656 would provide a stronger confirmation of the medium-term recovery and could open the path toward the $1.91 region.
🟢 Bullish Scenario
XRP has formed a strong recovery from the $1.35–$1.36 demand region and recently pushed above the previous consolidation structure.
Immediate resistance:
$1.4022
$1.4104
$1.4223
$1.4439
$1.4754
$1.4806
$1.5290
$1.5656 — 0.236 Fibonacci
A clean breakout and sustained close above $1.5656 would provide stronger confirmation of bullish continuation.
🎯 Target 1: $1.4439
🎯 Target 2: $1.4806
🎯 Target 3: $1.5656 — 0.236 Fibonacci
🎯 Target 4: $1.9123 — 0.382 Fibonacci
🎯 Target 5: $2.1926 — 0.5 Fibonacci
A confirmed breakout above $1.5656 could significantly strengthen the medium-term structure and potentially accelerate XRP toward the $1.91–$2.19 region.
🔴 Pullback Scenario
After the recent sharp recovery, a consolidation or retest of the breakout area would be normal.
Key supports:
$1.3761
$1.3654
$1.3608 — 20 EMA
$1.3575
$1.3555 — 200 EMA
$1.3573
The $1.35–$1.38 zone is particularly important.
If XRP continues to hold this area during a pullback, the current recovery structure remains valid.
A sustained loss of $1.3555–$1.3575 would weaken the bullish setup and could expose XRP to a deeper retracement toward the previous consolidation and demand areas.
🧠 Market Structure & Liquidity
XRP spent several months consolidating near the $1.35–$1.40 region after the prolonged downtrend.
The recent move produced a clear market-structure shift, followed by a strong breakout from the lower consolidation range.
XRP is now moving through an important:
Accumulation → Breakout → Retest → Continuation
structure.
The immediate upside liquidity is concentrated around $1.40–$1.48, while the larger technical resistance sits at the $1.5656 Fibonacci level.
A decisive breakout above $1.5656 would shift attention toward $1.9123, followed by $2.1926.
📊 RSI Momentum
RSI (14): 57.87
RSI remains above the neutral 50 level, confirming that bullish momentum is still present.
However, RSI has cooled from the recent higher readings, suggesting that XRP is currently undergoing consolidation after its strong recovery.
A sustained RSI hold above 50–55 would favor another bullish attempt toward the resistance zone.
A breakdown below 50 would indicate weakening short-term momentum.
🎯 Key Levels
🔴 Major Resistance: $1.4022 → $1.4104 → $1.4223 → $1.4439 → $1.4754 → $1.4806 → $1.5656
🟢 Major Support: $1.3761 → $1.3654 → $1.3608 → $1.3575
📉 Dynamic EMA Support: $1.3608 — 20 EMA | $1.3555 — 200 EMA
🚀 Upside Targets: $1.5656 → $1.9123 → $2.1926 → $2.4728 → $2.8718
📌 Final Outlook
XRP's broader structure is showing a meaningful recovery after the extended downtrend and long consolidation around the $1.35–$1.40 region.
The $1.35–$1.38 area is now the key short-term support zone. As long as XRP holds above this region and remains above the 20 EMA and 200 EMA, bulls retain control of the current recovery structure.
The immediate battle is around $1.40–$1.48. A confirmed breakout above $1.5656 would provide stronger bullish confirmation and could accelerate the move toward $1.9123, followed by $2.1926 and potentially higher Fibonacci levels.
However, rejection from resistance followed by a sustained loss of $1.3555–$1.3575 would weaken the recovery structure and increase the probability of a deeper retracement.
Bias: 🟢 Bullish above $1.3555. A breakout above $1.5656 could open the path toward $1.9123, with $2.1926 as the next major Fibonacci target.
$XRP
The broader market structure is showing signs of improvement, but XRP is now consolidating below the $1.40–$1.48 resistance cluster. Bulls need to reclaim this area and eventually break the $1.5656 Fibonacci resistance for the next major upside expansion.
📈 EMA Structure
20 EMA: $1.3608
50 EMA: $1.2646
100 EMA: $1.2419
200 EMA: $1.3555
XRP is currently trading above all four major EMAs.
The strongest development is the recovery above the 200 EMA at $1.3555, followed by the reclaim of the short-term EMA structure.
The 20 EMA at $1.3608 is now an important dynamic support level. As long as XRP holds above this area, the short-term recovery structure remains constructive.
📐 Fibonacci Levels
Key Fibonacci levels:
0.236: $1.5656
0.382: $1.9123
0.5: $2.1926
0.618: $2.4728
0.786: $2.8718
1.0: $3.3800
XRP has recovered strongly from the lower support region, but the major Fibonacci resistance remains at $1.5656.
A sustained breakout above $1.5656 would provide a stronger confirmation of the medium-term recovery and could open the path toward the $1.91 region.
🟢 Bullish Scenario
XRP has formed a strong recovery from the $1.35–$1.36 demand region and recently pushed above the previous consolidation structure.
Immediate resistance:
$1.4022
$1.4104
$1.4223
$1.4439
$1.4754
$1.4806
$1.5290
$1.5656 — 0.236 Fibonacci
A clean breakout and sustained close above $1.5656 would provide stronger confirmation of bullish continuation.
🎯 Target 1: $1.4439
🎯 Target 2: $1.4806
🎯 Target 3: $1.5656 — 0.236 Fibonacci
🎯 Target 4: $1.9123 — 0.382 Fibonacci
🎯 Target 5: $2.1926 — 0.5 Fibonacci
A confirmed breakout above $1.5656 could significantly strengthen the medium-term structure and potentially accelerate XRP toward the $1.91–$2.19 region.
🔴 Pullback Scenario
After the recent sharp recovery, a consolidation or retest of the breakout area would be normal.
Key supports:
$1.3761
$1.3654
$1.3608 — 20 EMA
$1.3575
$1.3555 — 200 EMA
$1.3573
The $1.35–$1.38 zone is particularly important.
If XRP continues to hold this area during a pullback, the current recovery structure remains valid.
A sustained loss of $1.3555–$1.3575 would weaken the bullish setup and could expose XRP to a deeper retracement toward the previous consolidation and demand areas.
🧠 Market Structure & Liquidity
XRP spent several months consolidating near the $1.35–$1.40 region after the prolonged downtrend.
The recent move produced a clear market-structure shift, followed by a strong breakout from the lower consolidation range.
XRP is now moving through an important:
Accumulation → Breakout → Retest → Continuation
structure.
The immediate upside liquidity is concentrated around $1.40–$1.48, while the larger technical resistance sits at the $1.5656 Fibonacci level.
A decisive breakout above $1.5656 would shift attention toward $1.9123, followed by $2.1926.
📊 RSI Momentum
RSI (14): 57.87
RSI remains above the neutral 50 level, confirming that bullish momentum is still present.
However, RSI has cooled from the recent higher readings, suggesting that XRP is currently undergoing consolidation after its strong recovery.
A sustained RSI hold above 50–55 would favor another bullish attempt toward the resistance zone.
A breakdown below 50 would indicate weakening short-term momentum.
🎯 Key Levels
🔴 Major Resistance: $1.4022 → $1.4104 → $1.4223 → $1.4439 → $1.4754 → $1.4806 → $1.5656
🟢 Major Support: $1.3761 → $1.3654 → $1.3608 → $1.3575
📉 Dynamic EMA Support: $1.3608 — 20 EMA | $1.3555 — 200 EMA
🚀 Upside Targets: $1.5656 → $1.9123 → $2.1926 → $2.4728 → $2.8718
📌 Final Outlook
XRP's broader structure is showing a meaningful recovery after the extended downtrend and long consolidation around the $1.35–$1.40 region.
The $1.35–$1.38 area is now the key short-term support zone. As long as XRP holds above this region and remains above the 20 EMA and 200 EMA, bulls retain control of the current recovery structure.
The immediate battle is around $1.40–$1.48. A confirmed breakout above $1.5656 would provide stronger bullish confirmation and could accelerate the move toward $1.9123, followed by $2.1926 and potentially higher Fibonacci levels.
However, rejection from resistance followed by a sustained loss of $1.3555–$1.3575 would weaken the recovery structure and increase the probability of a deeper retracement.
Bias: 🟢 Bullish above $1.3555. A breakout above $1.5656 could open the path toward $1.9123, with $2.1926 as the next major Fibonacci target.
$XRP
50
ログインして、さらにコンテンツを読む
厳選トピックで世界の暗号資産トレーダーの仲間入り
⚡️ 暗号資産に関する最新かつ有益な情報が見つかります。
💬 世界最大の暗号資産取引所から信頼されています。
👍 認証を受けたクリエイターから、有益なインサイトを得られます。
メール / 電話番号
トレンドトピック
AIStocksWhatNext
閲覧回数 54,120
360人が討論中
注目ハッシュタグキャンペーンでトラフィック報酬を「シェア&ウィン」しよう
✨トピック:AI株が上昇し続ける中、ほかにどんな投資チャンスが残っている?
👉参加方法:
ハッシュタグ #AIStocksWhatNext を付けて短い投稿または記事を公開する
強気か弱気かを共有し、AI株の保有または取引を投稿してください—取引ウィジェットを使うと資格を得やすくなる可能性があります。
データやチャートを共有し、AI生成画像を避けることで、投稿をさらに強化できます。
✍️以下の切り口を参考にコンテンツを作成してください:
- Nvidiaは来年のチップ販売が倍増すると述べ、主要なAI企業は記録的な売上を更新し続けています。これを支える計算コストはそれだけでも驚異的です。本当にAI需要は伸びているのか? そして、それはどれくらい続くのでしょうか?AI株は全体的に上昇中。これは本物のブレイクアウトなのか、それとも短期的な戻りなのか?
- 産業のリーダーたちはAI開発のペースを落とすよう求めています。一方でトランプは「AIフォース」を構築する計画で、AIが将来的に米国のGDPの25%を占める可能性があると主張しています。あなたはどちら側ですか? AI株に対する州レベルの後押しは長期的な勝利になりますか?
- あなたはAI株を買っていますか? 取引/保有を、取引シェアリングウィジェットで共有してください。
⏰キャンペーン期間:
- 2026-09-22 7:00 - 2026-09-24 4:00(UTC)
🎁報酬:
- 上記のガイドラインを満たし、100語を超える適格投稿は審査され、ランダムなトラフィックブースト(500〜3,000ビュー)が付与される場合があります。投稿が選ばれた場合は、フィード担当者から通知が届きます。
- Binance Square Officialに記事が掲載されるチャンス
投稿のアイデアが必要ですか? トピックページ #AIStocksWhatNext または Square Guide on How to Post for Better Reach をご覧ください。
Binance Square Official
·いいね:160件
·閲覧回数 197.2k
MuseOvertakesChatGPTAsTopFreeIOSApp
閲覧回数 295
0人が討論中
TokenizedStockPlatformsCouldLaunchNextQuarter
閲覧回数 1,251
11人が討論中