
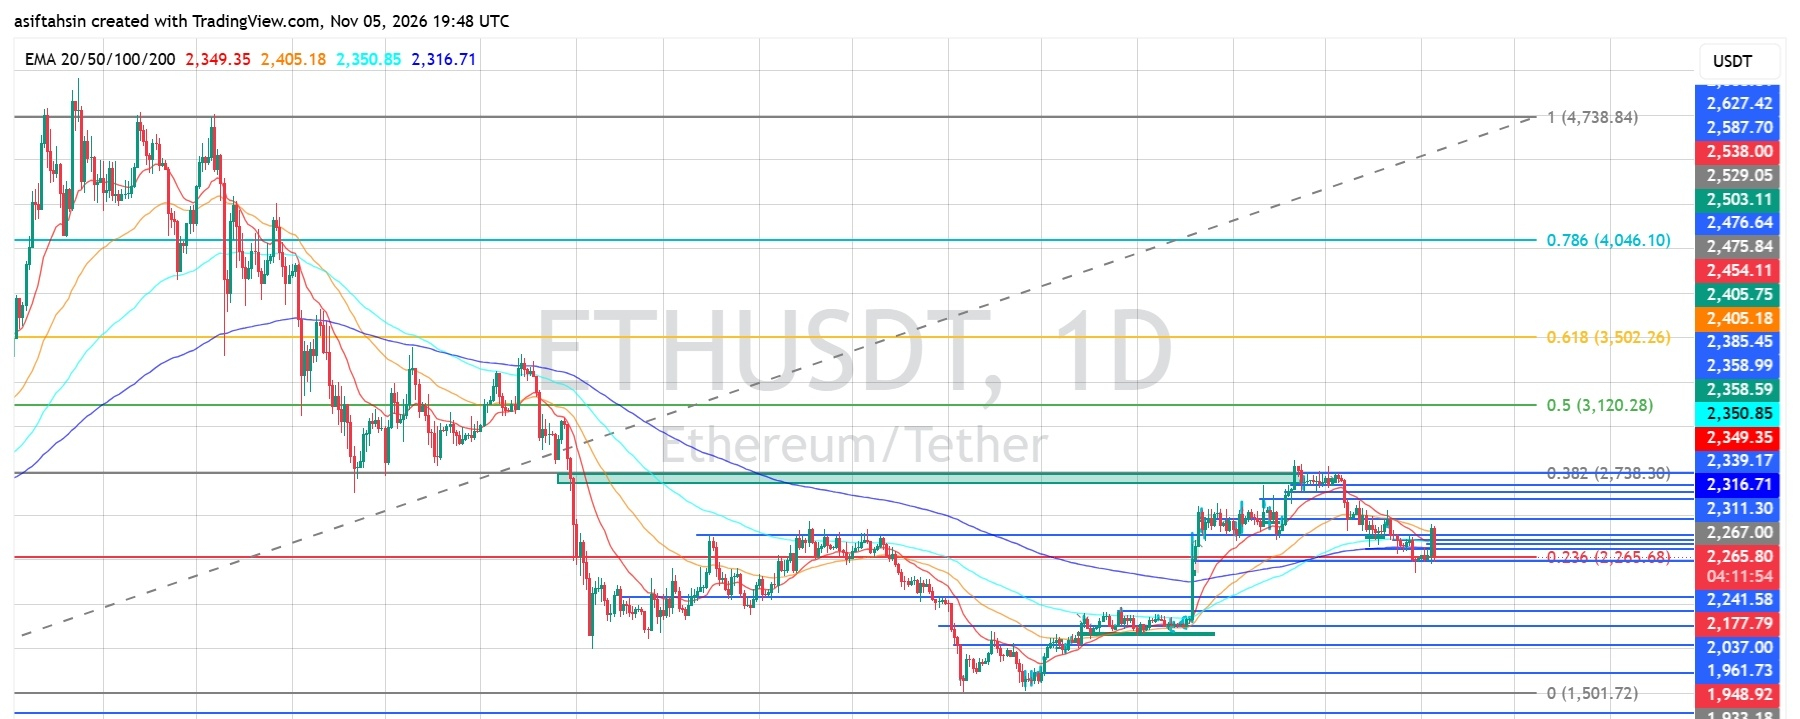

Ethereum is trading around $2,265–$2,267, testing the 0.236 Fibonacci level near $2,265.68 after pulling back from its recent recovery high around $2,358–$2,385.
The latest daily chart shows ETH trading below all four major EMAs. Although RSI has started to recover, the broader structure remains under pressure. Holding the $2,241–$2,265 support area is important for preventing another move lower.
EMA Structure
ETH is currently trading below all four major moving averages:
- 20 EMA: $2,349.35
- 50 EMA: $2,405.18
- 100 EMA: $2,350.85
- 200 EMA: $2,316.71
The 20 EMA is below the 50 EMA, while price remains below the entire EMA structure. This keeps the broader trend bearish and makes the $2,316–$2,405 region an important resistance area.
A sustained recovery above the 200 EMA near $2,316 would be an initial improvement, but reclaiming the $2,350–$2,405 zone would provide stronger bullish confirmation.
Fibonacci Levels
Based on the chart:
- 0.236: $2,265.68
- 0.382: $2,738.30
- 0.5: $3,120.28
- 0.618: $3,502.26
- 0.786: $4,046.10
ETH is currently testing the 0.236 Fibonacci level. A sustained move below this area could increase downside pressure, while holding it may help establish a short-term recovery.
Bullish Recovery Scenario
If ETH maintains support around $2,241–$2,265 and buyers regain momentum, the first challenge will be the $2,316–$2,350 resistance zone.
A successful breakout could open the way toward:
- $2,385
- $2,405
- $2,454–$2,476
- $2,503–$2,538
A stronger recovery would require ETH to reclaim the major EMA resistance cluster and build acceptance above it.
Bearish Continuation Scenario
If ETH fails to hold the $2,241 support area and breaks below it with strong selling pressure, the next downside zones are:
- $2,177
- $2,037
- $1,961–$1,948
- $1,904–$1,888
A daily close below $2,177 would weaken the recovery structure further and increase the possibility of a deeper correction toward the $2,037 demand area.
RSI Momentum
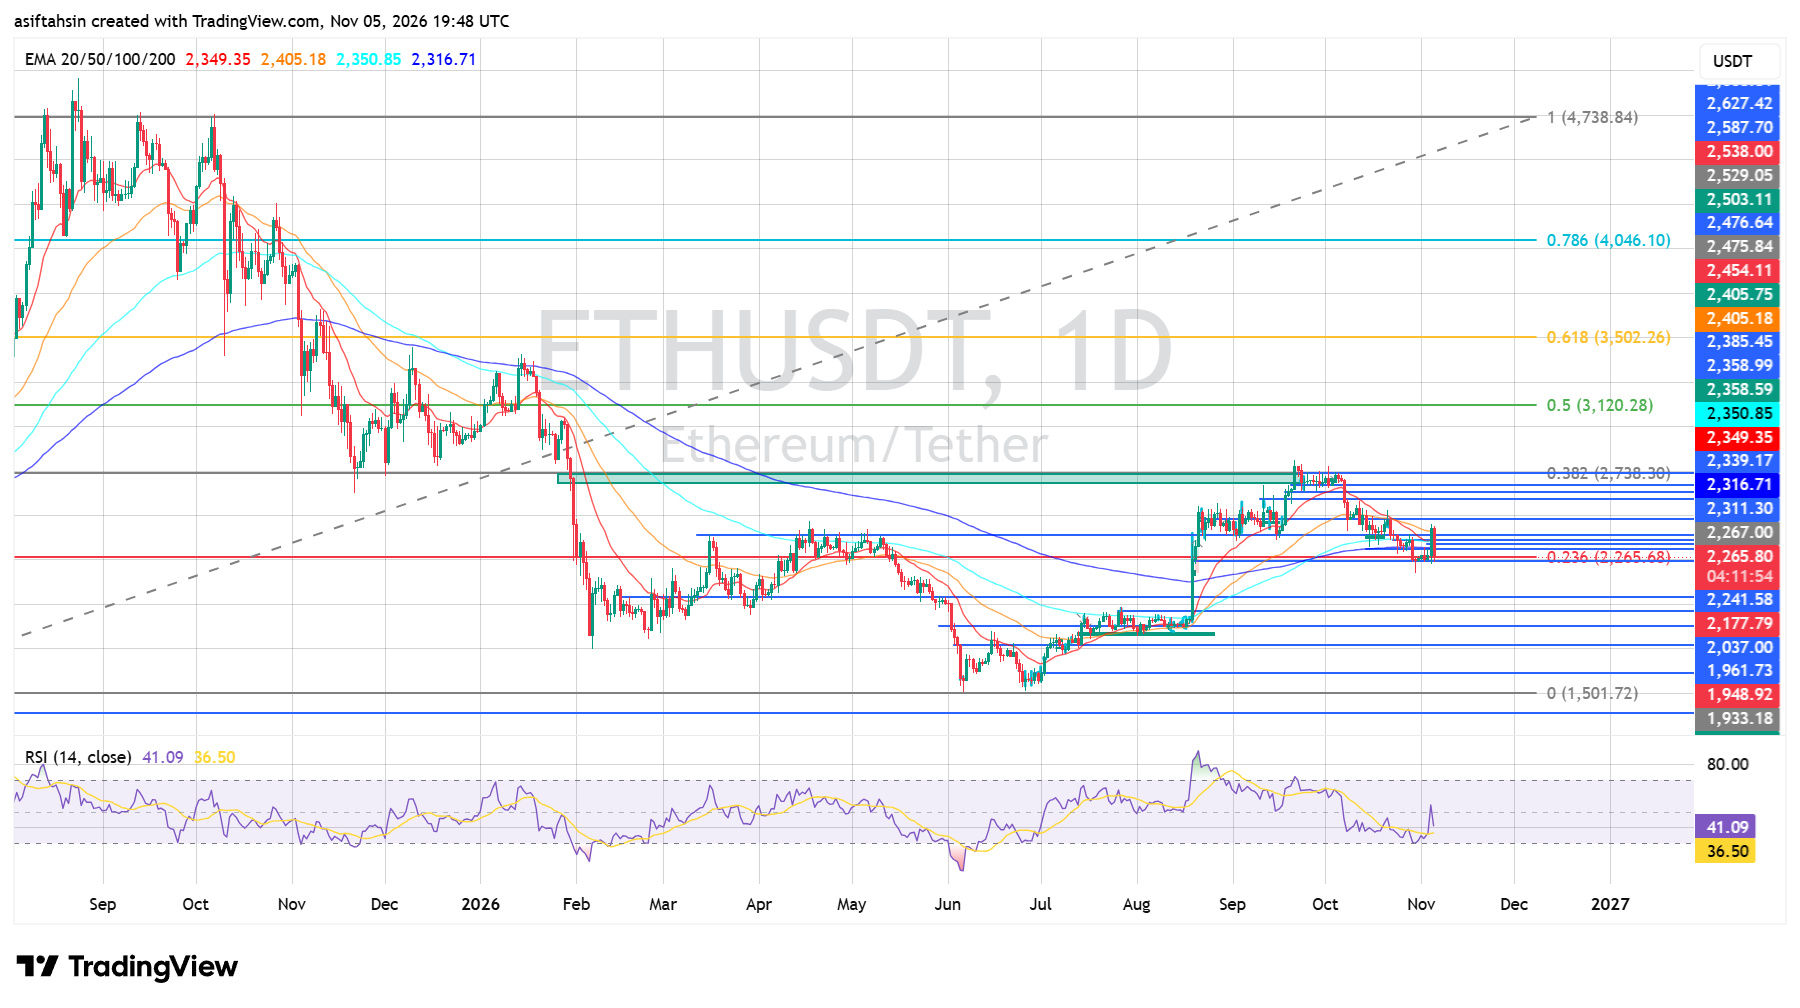
The daily RSI is around 41.09, with its signal line near 36.50.
RSI remains below the neutral 50 level, indicating that bullish momentum is still limited. However, the RSI moving above its signal line suggests some improvement in short-term momentum.
A sustained move above 50 would provide stronger evidence of a bullish momentum shift.
Market Structure & Liquidity
ETH recovered strongly from its June–July lows and advanced toward the $2,385 region. However, the recent rejection has brought price back toward the $2,265 support zone.
The market is now attempting to stabilize around the 0.236 Fibonacci level. The immediate direction will likely depend on whether buyers can defend $2,241–$2,265 or sellers force a breakdown.
Key Levels
Resistance:
- $2,316–$2,350
- $2,385–$2,405
- $2,454–$2,476
- $2,503–$2,538
Support:
- $2,265–$2,241
- $2,177
- $2,037
- $1,961–$1,948
- $1,904–$1,888
Final Outlook
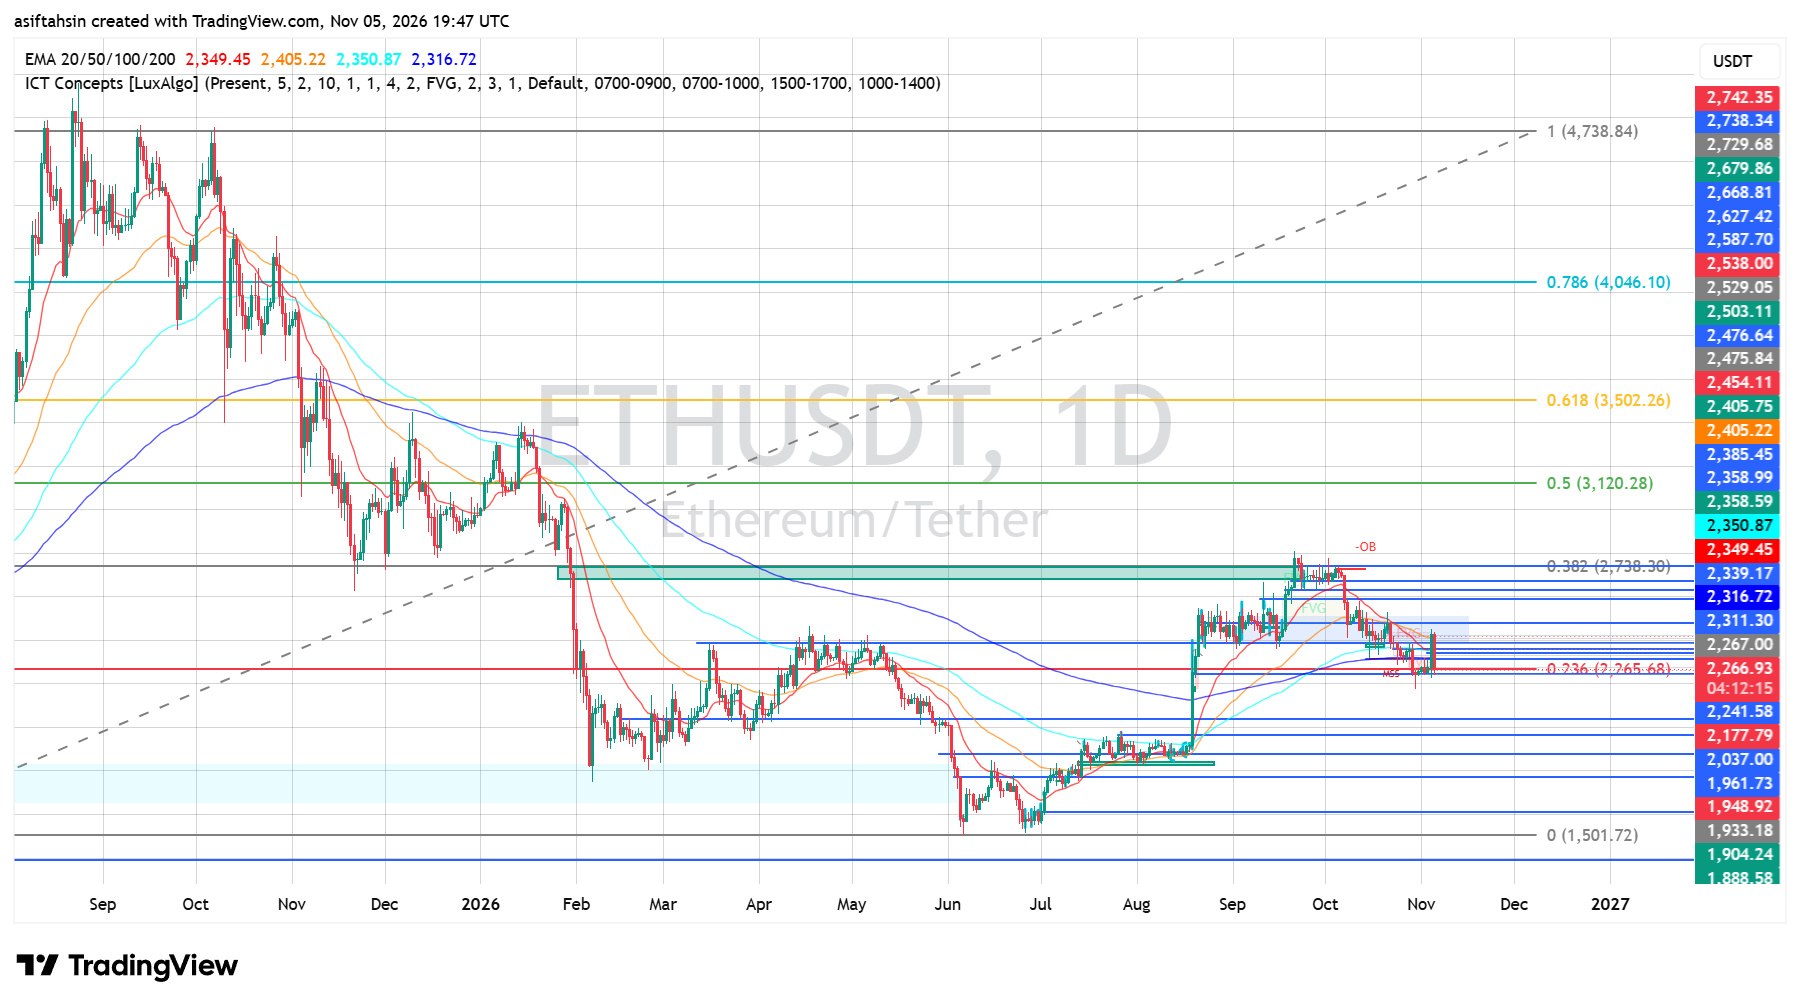
ETH remains under bearish pressure while trading below its major EMAs. The $2,241–$2,265 region is the immediate support zone to watch.
Holding this area could support a recovery toward $2,316–$2,350 and potentially $2,405. However, a confirmed breakdown below $2,241 could expose $2,177 and $2,037.
Current Bias: Bearish-to-Neutral
A sustained reclaim of $2,405 would improve the bullish outlook, while losing $2,241 would increase downside risk.
