
#anthropicipovaluationdoubts
anthropicipovaluationdoubts
注目
最新


·
--
AIトレンド|AnthropicのIPO、1兆5,000億ドルの評価額に疑問Jin10によると、AI関連投資の解消をきっかけに株式市場が急落したことを受け、大口投資家の間では、Anthropicが想定されている1兆5,000億ドルの評価額でIPOを実施できるのか、疑問視する声が強まっている。Anthropicは11月16日の週に上場する計画で、最大1,000億ドルを調達し、企業価値は約1兆5,000億ドルになると見込まれていた。IPOへの参加を予定する大口投資家3人は、評価額を引き下げる必要があるかもしれないと述べた。そのうち1人は、1兆ドルに近い水準になる可能性があると話した。別の投資家は、市場が反発したとしても、最近の株価急落で打撃を受けた機関投資家に、再びAI分野で大きなリスクを取るよう説得するのは難しい可能性があると述べ、AnthropicがIPOを延期するかどうかにも疑問を呈した。同社は、想定より少ない額しか調達できない可能性もある。Anthropicの幹部と顧問は、IPO計画について話し合うため、数日中に会合を開く見通しだ。選択肢を残しておくため、プロセスを通じて具体的な約束を避けてきたという関係者もいた。
AIトレンド|AnthropicのIPO、1兆5,000億ドルの評価額に疑問
Jin10によると、AI関連投資の解消をきっかけに株式市場が急落したことを受け、大口投資家の間では、Anthropicが想定されている1兆5,000億ドルの評価額でIPOを実施できるのか、疑問視する声が強まっている。Anthropicは11月16日の週に上場する計画で、最大1,000億ドルを調達し、企業価値は約1兆5,000億ドルになると見込まれていた。IPOへの参加を予定する大口投資家3人は、評価額を引き下げる必要があるかもしれないと述べた。そのうち1人は、1兆ドルに近い水準になる可能性があると話した。別の投資家は、市場が反発したとしても、最近の株価急落で打撃を受けた機関投資家に、再びAI分野で大きなリスクを取るよう説得するのは難しい可能性があると述べ、AnthropicがIPOを延期するかどうかにも疑問を呈した。同社は、想定より少ない額しか調達できない可能性もある。Anthropicの幹部と顧問は、IPO計画について話し合うため、数日中に会合を開く見通しだ。選択肢を残しておくため、プロセスを通じて具体的な約束を避けてきたという関係者もいた。
晓梦:
1.5万亿美元估值配上最高1000亿美元募资目标,市场连AI投入回报都在重算,投资人先质疑价格也不意外。真往1万亿靠,发行规模和认购需求都得重新算。
1
1
1.1k

·
--
昨日は米国株のテクノロジー株にとって、この1年で最悪の日となり、ナスダックは5.52%下落。今日はAnthropicのIPO価格に注目が集まっている。
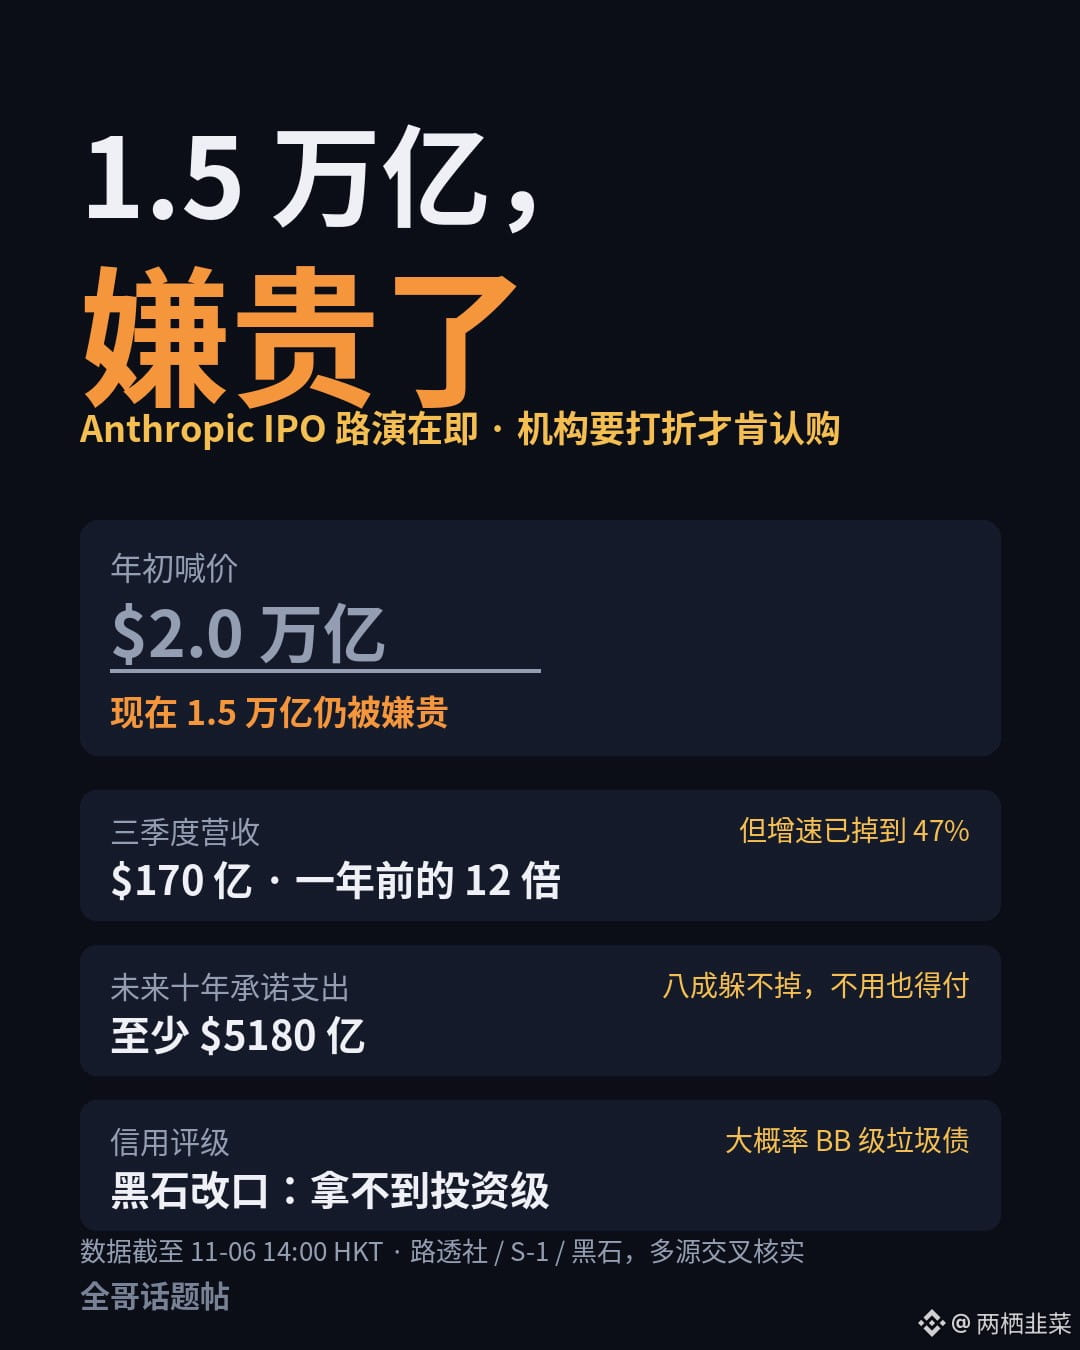
ロイターが今日伝えたところによると、同社は来週ロードショーを行い、11月中の上場を予定。発行規模は最大1,000億ドルに達する可能性がある。しかし機関投資家は、1兆5,000億ドルの評価額は高すぎるとし、割引がなければ引き受けない構えだ。
考えてみてほしい。年初には2兆ドルの価値があるとまで言われていたのに、今や1兆5,000億ドルでも高すぎるという。Claudeの使い勝手が悪いのではなく、価格の問題だ。
目論見書によると、第3四半期の売上高は170億ドル。成長率はすでに3桁から47%まで鈍化し、さらに5億6,700万ドルの損失を計上した。もっと目を引くのは、今後10年間のクラウドとインフラへの支出約束が少なくとも5,180億ドルに上り、その8割は避けられそうにないことだ。ブラックストーンも見解を変えた。上場後に投資適格格付けを得られず、BB格のジャンク債となる可能性が高いという。
要するに、良い会社≠良い株。Claudeは本当に使いやすいが、1兆5,000億ドルという価格は、今後10年間ずっと右肩上がりで成長することを前提にしている。市場がたった今、痛い目に遭ったばかりなのに、誰が目をつぶって最高値で買うだろうか?
暗号資産界隈では、すでに先に動いた人がいる。MEXCでは同社の上場前先物がまだ1,500ドル近辺で取引されているが、完全にセンチメントで決まった価格だ。
来週のロードショーが実施されるのか、価格がどれだけ割り引かれるのか。これはAIの評価額を試す一つの試験だ。失敗すれば、AI株の上昇分はさらに下値を探ることになる。
私はどちらの側にも立たないし、いくらが妥当かも予想しない。ただ一言、どんなに優れた会社でも、今の価格は高いのか安いのかを問う必要がある。
#AnthropicのIPO評価への疑念
$NVDA $BTC
昨日は米国株のテクノロジー株にとって、この1年で最悪の日となり、ナスダックは5.52%下落。今日はAnthropicのIPO価格に注目が集まっている。
ロイターが今日伝えたところによると、同社は来週ロードショーを行い、11月中の上場を予定。発行規模は最大1,000億ドルに達する可能性がある。しかし機関投資家は、1兆5,000億ドルの評価額は高すぎるとし、割引がなければ引き受けない構えだ。
考えてみてほしい。年初には2兆ドルの価値があるとまで言われていたのに、今や1兆5,000億ドルでも高すぎるという。Claudeの使い勝手が悪いのではなく、価格の問題だ。
目論見書によると、第3四半期の売上高は170億ドル。成長率はすでに3桁から47%まで鈍化し、さらに5億6,700万ドルの損失を計上した。もっと目を引くのは、今後10年間のクラウドとインフラへの支出約束が少なくとも5,180億ドルに上り、その8割は避けられそうにないことだ。ブラックストーンも見解を変えた。上場後に投資適格格付けを得られず、BB格のジャンク債となる可能性が高いという。
要するに、良い会社≠良い株。Claudeは本当に使いやすいが、1兆5,000億ドルという価格は、今後10年間ずっと右肩上がりで成長することを前提にしている。市場がたった今、痛い目に遭ったばかりなのに、誰が目をつぶって最高値で買うだろうか?
暗号資産界隈では、すでに先に動いた人がいる。MEXCでは同社の上場前先物がまだ1,500ドル近辺で取引されているが、完全にセンチメントで決まった価格だ。
来週のロードショーが実施されるのか、価格がどれだけ割り引かれるのか。これはAIの評価額を試す一つの試験だ。失敗すれば、AI株の上昇分はさらに下値を探ることになる。
私はどちらの側にも立たないし、いくらが妥当かも予想しない。ただ一言、どんなに優れた会社でも、今の価格は高いのか安いのかを問う必要がある。
#AnthropicのIPO評価への疑念
$NVDA $BTC
ロイターが今日伝えたところによると、同社は来週ロードショーを行い、11月中の上場を予定。発行規模は最大1,000億ドルに達する可能性がある。しかし機関投資家は、1兆5,000億ドルの評価額は高すぎるとし、割引がなければ引き受けない構えだ。
考えてみてほしい。年初には2兆ドルの価値があるとまで言われていたのに、今や1兆5,000億ドルでも高すぎるという。Claudeの使い勝手が悪いのではなく、価格の問題だ。
目論見書によると、第3四半期の売上高は170億ドル。成長率はすでに3桁から47%まで鈍化し、さらに5億6,700万ドルの損失を計上した。もっと目を引くのは、今後10年間のクラウドとインフラへの支出約束が少なくとも5,180億ドルに上り、その8割は避けられそうにないことだ。ブラックストーンも見解を変えた。上場後に投資適格格付けを得られず、BB格のジャンク債となる可能性が高いという。
要するに、良い会社≠良い株。Claudeは本当に使いやすいが、1兆5,000億ドルという価格は、今後10年間ずっと右肩上がりで成長することを前提にしている。市場がたった今、痛い目に遭ったばかりなのに、誰が目をつぶって最高値で買うだろうか?
暗号資産界隈では、すでに先に動いた人がいる。MEXCでは同社の上場前先物がまだ1,500ドル近辺で取引されているが、完全にセンチメントで決まった価格だ。
来週のロードショーが実施されるのか、価格がどれだけ割り引かれるのか。これはAIの評価額を試す一つの試験だ。失敗すれば、AI株の上昇分はさらに下値を探ることになる。
私はどちらの側にも立たないし、いくらが妥当かも予想しない。ただ一言、どんなに優れた会社でも、今の価格は高いのか安いのかを問う必要がある。
#AnthropicのIPO評価への疑念
$NVDA $BTC
325

#anthropicipovaluationdoubts $ANTHROPIC
{future}(ANTHROPICUSDT)
Anthropicの差し迫った新規株式公開(IPO)を前にウォール街で警戒感が高まっており、同社の経常収益が指数関数的に伸びる一方で、最先端の言語モデルの訓練に伴う不均衡な運用コストが生じているという相克が浮き彫りになっている。人工知能分野で際立った売上成長を記録しているものの、同社が非公開市場で求める目標評価額は、機関投資家アナリストから厳しい精査を受けている。主な論点は、単位当たりの営業利益率の持続可能性と、OpenAIやGoogleなどの競合他社と直接競うために大規模な計算能力やデータセンターインフラを継続的に確保する必要性によって生じる、高い現金消費率(*キャッシュバーン率*)にある。$OPENAI $GOOGL
{future}(GOOGLUSDT)
{future}(OPENAIUSDT)
財務分析および株式資産評価の観点から見ると、予想評価額への懐疑は、割引キャッシュフロー(*DCF*)モデルに適用される割引率の調整に起因する。ベンチャーキャピタルの運用担当者や投資銀行の投資家は、クラウドサービスの供給契約への高い依存度と、企業規模で収益化を実現する時期の不確実性を考慮し、Anthropicの資本に求めるリスクプレミアムを引き上げている。結論として、株式公開価格をめぐる疑念は、テクノロジー市場におけるパラダイムシフトを反映している。投資家は、収益の総額拡大を示す指標から、中長期的に持続可能な営業収益性を実現するモデルへの明確な移行を求めている。
#anthropicipovaluationdoubts $ANTHROPIC
Anthropicの差し迫った新規株式公開(IPO)を前にウォール街で警戒感が高まっており、同社の経常収益が指数関数的に伸びる一方で、最先端の言語モデルの訓練に伴う不均衡な運用コストが生じているという相克が浮き彫りになっている。人工知能分野で際立った売上成長を記録しているものの、同社が非公開市場で求める目標評価額は、機関投資家アナリストから厳しい精査を受けている。主な論点は、単位当たりの営業利益率の持続可能性と、OpenAIやGoogleなどの競合他社と直接競うために大規模な計算能力やデータセンターインフラを継続的に確保する必要性によって生じる、高い現金消費率(*キャッシュバーン率*)にある。$OPENAI $GOOGL
財務分析および株式資産評価の観点から見ると、予想評価額への懐疑は、割引キャッシュフロー(*DCF*)モデルに適用される割引率の調整に起因する。ベンチャーキャピタルの運用担当者や投資銀行の投資家は、クラウドサービスの供給契約への高い依存度と、企業規模で収益化を実現する時期の不確実性を考慮し、Anthropicの資本に求めるリスクプレミアムを引き上げている。結論として、株式公開価格をめぐる疑念は、テクノロジー市場におけるパラダイムシフトを反映している。投資家は、収益の総額拡大を示す指標から、中長期的に持続可能な営業収益性を実現するモデルへの明確な移行を求めている。
Anthropicの差し迫った新規株式公開(IPO)を前にウォール街で警戒感が高まっており、同社の経常収益が指数関数的に伸びる一方で、最先端の言語モデルの訓練に伴う不均衡な運用コストが生じているという相克が浮き彫りになっている。人工知能分野で際立った売上成長を記録しているものの、同社が非公開市場で求める目標評価額は、機関投資家アナリストから厳しい精査を受けている。主な論点は、単位当たりの営業利益率の持続可能性と、OpenAIやGoogleなどの競合他社と直接競うために大規模な計算能力やデータセンターインフラを継続的に確保する必要性によって生じる、高い現金消費率(*キャッシュバーン率*)にある。$OPENAI $GOOGL
財務分析および株式資産評価の観点から見ると、予想評価額への懐疑は、割引キャッシュフロー(*DCF*)モデルに適用される割引率の調整に起因する。ベンチャーキャピタルの運用担当者や投資銀行の投資家は、クラウドサービスの供給契約への高い依存度と、企業規模で収益化を実現する時期の不確実性を考慮し、Anthropicの資本に求めるリスクプレミアムを引き上げている。結論として、株式公開価格をめぐる疑念は、テクノロジー市場におけるパラダイムシフトを反映している。投資家は、収益の総額拡大を示す指標から、中長期的に持続可能な営業収益性を実現するモデルへの明確な移行を求めている。
596

·
--
数字の裏に潜む不確実性:AnthropicのIPOに疑問が生じる理由とは?人工知能市場は前例のない熱狂に包まれていますが、#AnthropicIPOValuationDoubtsをめぐる最近の議論の高まりが、投資家やテクノロジーアナリストに警戒感をもたらしています。最先端の言語モデル開発においてOpenAIの主要な競合企業の一つとして知られ、Claudeエコシステムを原動力とするAnthropicは、株式を公開する前から数十億ドル規模の評価額に達しています。しかし、数字が上昇するのと同じ勢いで懐疑的な見方も強まっています。
数字の裏に潜む不確実性:AnthropicのIPOに疑問が生じる理由とは?
人工知能市場は前例のない熱狂に包まれていますが、#AnthropicIPOValuationDoubtsをめぐる最近の議論の高まりが、投資家やテクノロジーアナリストに警戒感をもたらしています。最先端の言語モデル開発においてOpenAIの主要な競合企業の一つとして知られ、Claudeエコシステムを原動力とするAnthropicは、株式を公開する前から数十億ドル規模の評価額に達しています。しかし、数字が上昇するのと同じ勢いで懐疑的な見方も強まっています。
1
168

🚨 1.5兆ドルの現実チェック:AIバブルに亀裂が? 🚨
Anthropicは、テック史上最も注目されるIPOの一つに向けて準備を進め、驚異の1.5兆ドルという企業評価額を目指していました。しかし突然、ウォール街がブレーキをかけています。📉
大口投資家が反発している理由と、11月の上場が延期される可能性さえある理由を詳しく見ていきましょう。
1️⃣ AI株の売り:最近、テック株全般が大きく下落しています。市場のセンチメントは「コストを度外視して成長」から「利益率を見せてくれ」へと急速に変化しています。
2️⃣ 資金の大量消費:確かに、Anthropicの第3四半期の売上高は170億ドルに急増しました(昨年の14億ドルから増加)。表面的には大きな成功です。しかし、内情を見てみましょう。233億ドルの純損失を報告し、計算能力を確保するためだけに、今後5年間で約9,000億ドルを投じることを約束しています。インフラコストは天文学的な額です。
3️⃣ 評価額の引き下げ:主要な機関投資家は、取引を成立させるためには評価額を引き下げ、1兆ドルに近い水準にする必要があると示唆しています。
暗号資産市場との乖離?🤔
ほんの数週間前まで、ANTHROPIC/USDT無期限先物は同社の評価額を2兆ドル超と見積もっていました。暗号資産トレーダーは非常に強気で、完璧な展開を織り込んでいました。ところが今、伝統的な金融市場が現実を直視するよう市場に迫っています。
OpenAIのような競合企業も最近、当初の資金調達目標に届かなかったことを踏まえると、問いは明らかです。私たちはついに、AI企業の評価額の上限を目の当たりにしているのでしょうか?
長期的なAIインフラには、今も強気ですか?それとも、これは待ち望んでいた調整なのでしょうか?ぜひコメントで教えてください!👇
$ANTHROPIC
{future}(ANTHROPICUSDT)
$NEAR
{future}(NEARUSDT)
$TAO
{future}(TAOUSDT)
#AnthropicIPOValuationDoubts #CryptoMarket #TechStocks #AI
🚨 1.5兆ドルの現実チェック:AIバブルに亀裂が? 🚨
Anthropicは、テック史上最も注目されるIPOの一つに向けて準備を進め、驚異の1.5兆ドルという企業評価額を目指していました。しかし突然、ウォール街がブレーキをかけています。📉
大口投資家が反発している理由と、11月の上場が延期される可能性さえある理由を詳しく見ていきましょう。
1️⃣ AI株の売り:最近、テック株全般が大きく下落しています。市場のセンチメントは「コストを度外視して成長」から「利益率を見せてくれ」へと急速に変化しています。
2️⃣ 資金の大量消費:確かに、Anthropicの第3四半期の売上高は170億ドルに急増しました(昨年の14億ドルから増加)。表面的には大きな成功です。しかし、内情を見てみましょう。233億ドルの純損失を報告し、計算能力を確保するためだけに、今後5年間で約9,000億ドルを投じることを約束しています。インフラコストは天文学的な額です。
3️⃣ 評価額の引き下げ:主要な機関投資家は、取引を成立させるためには評価額を引き下げ、1兆ドルに近い水準にする必要があると示唆しています。
暗号資産市場との乖離?🤔
ほんの数週間前まで、ANTHROPIC/USDT無期限先物は同社の評価額を2兆ドル超と見積もっていました。暗号資産トレーダーは非常に強気で、完璧な展開を織り込んでいました。ところが今、伝統的な金融市場が現実を直視するよう市場に迫っています。
OpenAIのような競合企業も最近、当初の資金調達目標に届かなかったことを踏まえると、問いは明らかです。私たちはついに、AI企業の評価額の上限を目の当たりにしているのでしょうか?
長期的なAIインフラには、今も強気ですか?それとも、これは待ち望んでいた調整なのでしょうか?ぜひコメントで教えてください!👇
$ANTHROPIC
$NEAR
$TAO
#AnthropicIPOValuationDoubts #CryptoMarket #TechStocks #AI
Anthropicは、テック史上最も注目されるIPOの一つに向けて準備を進め、驚異の1.5兆ドルという企業評価額を目指していました。しかし突然、ウォール街がブレーキをかけています。📉
大口投資家が反発している理由と、11月の上場が延期される可能性さえある理由を詳しく見ていきましょう。
1️⃣ AI株の売り:最近、テック株全般が大きく下落しています。市場のセンチメントは「コストを度外視して成長」から「利益率を見せてくれ」へと急速に変化しています。
2️⃣ 資金の大量消費:確かに、Anthropicの第3四半期の売上高は170億ドルに急増しました(昨年の14億ドルから増加)。表面的には大きな成功です。しかし、内情を見てみましょう。233億ドルの純損失を報告し、計算能力を確保するためだけに、今後5年間で約9,000億ドルを投じることを約束しています。インフラコストは天文学的な額です。
3️⃣ 評価額の引き下げ:主要な機関投資家は、取引を成立させるためには評価額を引き下げ、1兆ドルに近い水準にする必要があると示唆しています。
暗号資産市場との乖離?🤔
ほんの数週間前まで、ANTHROPIC/USDT無期限先物は同社の評価額を2兆ドル超と見積もっていました。暗号資産トレーダーは非常に強気で、完璧な展開を織り込んでいました。ところが今、伝統的な金融市場が現実を直視するよう市場に迫っています。
OpenAIのような競合企業も最近、当初の資金調達目標に届かなかったことを踏まえると、問いは明らかです。私たちはついに、AI企業の評価額の上限を目の当たりにしているのでしょうか?
長期的なAIインフラには、今も強気ですか?それとも、これは待ち望んでいた調整なのでしょうか?ぜひコメントで教えてください!👇
$ANTHROPIC
$NEAR
$TAO
#AnthropicIPOValuationDoubts #CryptoMarket #TechStocks #AI

1
245

·
--
ブリッシュ
#anthropicipovaluationdoubts 🤖 AIの企業価値評価に疑問の声:AnthropicのIPOへの懐疑論と暗号資産への波及効果
従来型市場が中央集権型AIの巨額な企業価値評価に疑問を呈するなか、暗号資産エコシステムも注視しています。この変化は、デジタル資産への資金の流れを大きく変える可能性があります。
📰 主なニュース:
• 企業価値評価への懐疑:投資家は、将来的な上場を前に、AnthropicのようなAI大手の予想企業価値を精査しています。
• ファンダメンタルズへの懸念:膨大な計算資源やデータセンターのコストを踏まえ、企業価値評価が現実的な収益化までの期間に見合っているのか、アナリストは疑問視しています。
• 市場の成熟:従来型金融では、投機的な成長ストーリーよりも、持続可能なファンダメンタルズが重視されつつあります。
📊 市場への影響:
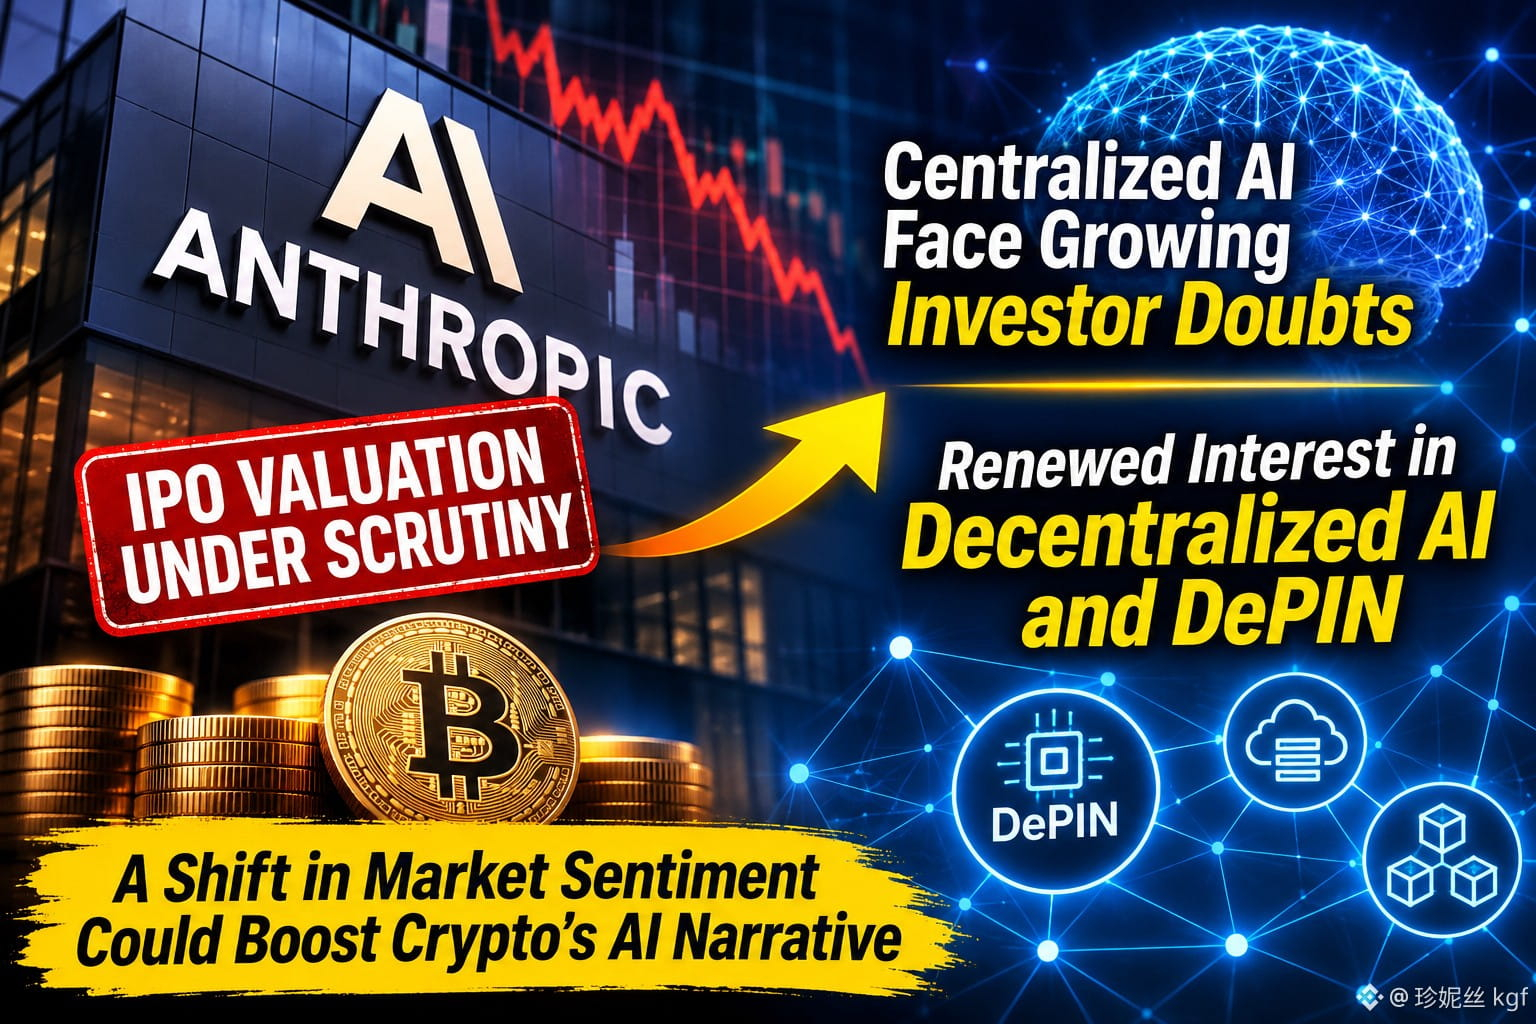
• DePINへの資金シフト:中央集権型で資金消費の激しいAI独占企業への疑念が、分散型物理インフラネットワーク(DePIN)やオープンソースAI関連の暗号資産プロジェクトへの関心を高める可能性があります。
• トークンの実力が問われる:AI関連の暗号資産トークンは、これまで以上に厳しい目で見られています。市場では、単なる話題性よりも、具体的な有用性と持続可能なトークノミクスを備えたプロジェクトが評価されるでしょう。
• 市場全体のリスクセンチメント:テクノロジー企業のIPO市場の冷え込みは、全体的なリスク選好に影響を及ぼす可能性があります。暗号資産は、成長性の高いテクノロジー株と連動することが多いためです。
💬 議論に参加しましょう:
中央集権型AIの企業価値評価への懐疑が、分散型AIやDePINのエコシステムにより多くの資金を呼び込むと思いますか?ぜひ下のコメント欄でご意見をお聞かせください!👇
#AI #DePIN #暗号資産市場 #Web3 #分散型AI
これは教育目的のみで提供されています。金融上の助言ではありません(NFA)。必ずご自身で調査してください(DYOR)。
$SQQQB $ERA $ACT
{future}(ACTUSDT)
{future}(ERAUSDT)
{spot}(SQQQBUSDT)
#anthropicipovaluationdoubts 🤖 AIの企業価値評価に疑問の声:AnthropicのIPOへの懐疑論と暗号資産への波及効果
従来型市場が中央集権型AIの巨額な企業価値評価に疑問を呈するなか、暗号資産エコシステムも注視しています。この変化は、デジタル資産への資金の流れを大きく変える可能性があります。
📰 主なニュース:
• 企業価値評価への懐疑:投資家は、将来的な上場を前に、AnthropicのようなAI大手の予想企業価値を精査しています。
• ファンダメンタルズへの懸念:膨大な計算資源やデータセンターのコストを踏まえ、企業価値評価が現実的な収益化までの期間に見合っているのか、アナリストは疑問視しています。
• 市場の成熟:従来型金融では、投機的な成長ストーリーよりも、持続可能なファンダメンタルズが重視されつつあります。
📊 市場への影響:
• DePINへの資金シフト:中央集権型で資金消費の激しいAI独占企業への疑念が、分散型物理インフラネットワーク(DePIN)やオープンソースAI関連の暗号資産プロジェクトへの関心を高める可能性があります。
• トークンの実力が問われる:AI関連の暗号資産トークンは、これまで以上に厳しい目で見られています。市場では、単なる話題性よりも、具体的な有用性と持続可能なトークノミクスを備えたプロジェクトが評価されるでしょう。
• 市場全体のリスクセンチメント:テクノロジー企業のIPO市場の冷え込みは、全体的なリスク選好に影響を及ぼす可能性があります。暗号資産は、成長性の高いテクノロジー株と連動することが多いためです。
💬 議論に参加しましょう:
中央集権型AIの企業価値評価への懐疑が、分散型AIやDePINのエコシステムにより多くの資金を呼び込むと思いますか?ぜひ下のコメント欄でご意見をお聞かせください!👇
#AI #DePIN #暗号資産市場 #Web3 #分散型AI
これは教育目的のみで提供されています。金融上の助言ではありません(NFA)。必ずご自身で調査してください(DYOR)。
$SQQQB $ERA $ACT
従来型市場が中央集権型AIの巨額な企業価値評価に疑問を呈するなか、暗号資産エコシステムも注視しています。この変化は、デジタル資産への資金の流れを大きく変える可能性があります。
📰 主なニュース:
• 企業価値評価への懐疑:投資家は、将来的な上場を前に、AnthropicのようなAI大手の予想企業価値を精査しています。
• ファンダメンタルズへの懸念:膨大な計算資源やデータセンターのコストを踏まえ、企業価値評価が現実的な収益化までの期間に見合っているのか、アナリストは疑問視しています。
• 市場の成熟:従来型金融では、投機的な成長ストーリーよりも、持続可能なファンダメンタルズが重視されつつあります。
📊 市場への影響:
• DePINへの資金シフト:中央集権型で資金消費の激しいAI独占企業への疑念が、分散型物理インフラネットワーク(DePIN)やオープンソースAI関連の暗号資産プロジェクトへの関心を高める可能性があります。
• トークンの実力が問われる:AI関連の暗号資産トークンは、これまで以上に厳しい目で見られています。市場では、単なる話題性よりも、具体的な有用性と持続可能なトークノミクスを備えたプロジェクトが評価されるでしょう。
• 市場全体のリスクセンチメント:テクノロジー企業のIPO市場の冷え込みは、全体的なリスク選好に影響を及ぼす可能性があります。暗号資産は、成長性の高いテクノロジー株と連動することが多いためです。
💬 議論に参加しましょう:
中央集権型AIの企業価値評価への懐疑が、分散型AIやDePINのエコシステムにより多くの資金を呼び込むと思いますか?ぜひ下のコメント欄でご意見をお聞かせください!👇
#AI #DePIN #暗号資産市場 #Web3 #分散型AI
これは教育目的のみで提供されています。金融上の助言ではありません(NFA)。必ずご自身で調査してください(DYOR)。
$SQQQB $ERA $ACT
95

·
--
#AnthropicのIPO評価額への疑念
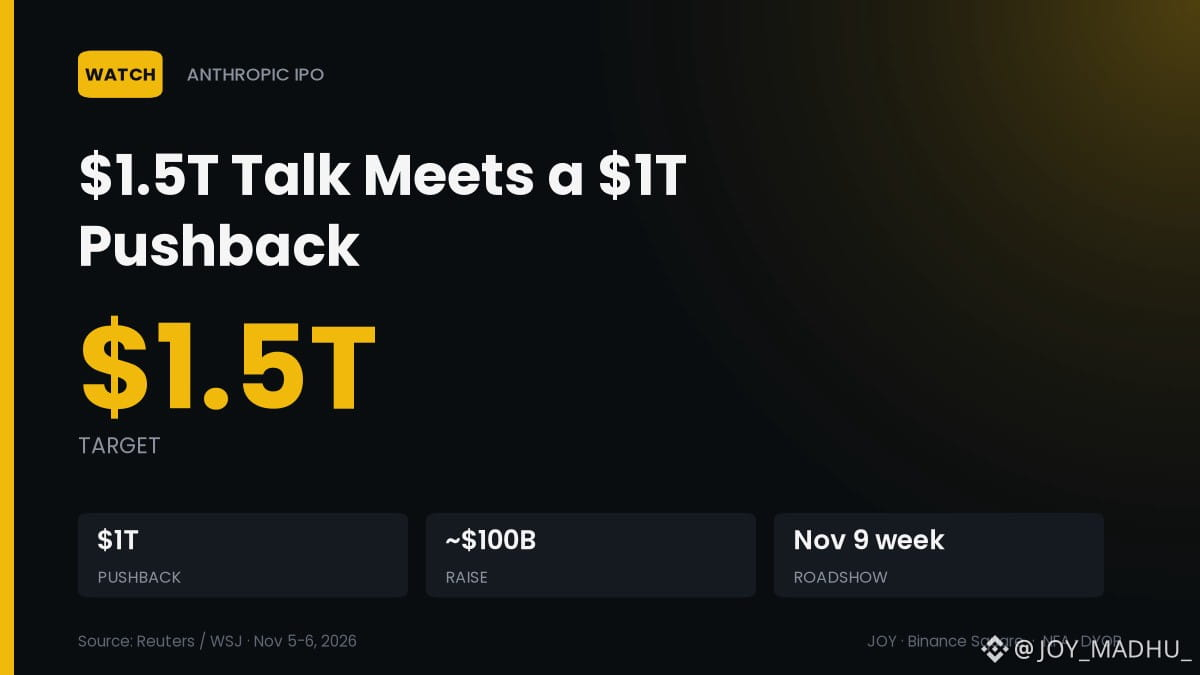
⚠️ 1.5兆ドルのIPO観測に、1兆ドルを求める声
今週のAI株売りを受け、AnthropicのIPOを検討する買い手はロードショーと評価額に疑問を呈している(Reuters、WSJ)。
📉 一部の支援者は現在、1.5兆ドルの観測を約5,000億ドル下回る1兆ドル近辺を視野に
📅 ロードショーは11月9日の週を予定。価格決定はその翌週
🏦 調達目標は引き続き最大約1,000億ドル。9月30日時点の現金は1,466億ドル
📊 更新版S-1では10月の売上高が空欄のまま。買い手はその数値の開示を求めている
大局的に見れば、AI大型上場の延期は、暗号資産市場と同じリスク選好に影響するだろう。
来週、予定どおりロードショーを実施するのか。それとも1兆ドル近辺まで引き下げるのか? 👇
$BTC $ETH
#AI #IPO #AnthropicのIPO評価額への疑念
#AnthropicのIPO評価額への疑念
⚠️ 1.5兆ドルのIPO観測に、1兆ドルを求める声
今週のAI株売りを受け、AnthropicのIPOを検討する買い手はロードショーと評価額に疑問を呈している(Reuters、WSJ)。
📉 一部の支援者は現在、1.5兆ドルの観測を約5,000億ドル下回る1兆ドル近辺を視野に
📅 ロードショーは11月9日の週を予定。価格決定はその翌週
🏦 調達目標は引き続き最大約1,000億ドル。9月30日時点の現金は1,466億ドル
📊 更新版S-1では10月の売上高が空欄のまま。買い手はその数値の開示を求めている
大局的に見れば、AI大型上場の延期は、暗号資産市場と同じリスク選好に影響するだろう。
来週、予定どおりロードショーを実施するのか。それとも1兆ドル近辺まで引き下げるのか? 👇
$BTC $ETH
#AI #IPO #AnthropicのIPO評価額への疑念
⚠️ 1.5兆ドルのIPO観測に、1兆ドルを求める声
今週のAI株売りを受け、AnthropicのIPOを検討する買い手はロードショーと評価額に疑問を呈している(Reuters、WSJ)。
📉 一部の支援者は現在、1.5兆ドルの観測を約5,000億ドル下回る1兆ドル近辺を視野に
📅 ロードショーは11月9日の週を予定。価格決定はその翌週
🏦 調達目標は引き続き最大約1,000億ドル。9月30日時点の現金は1,466億ドル
📊 更新版S-1では10月の売上高が空欄のまま。買い手はその数値の開示を求めている
大局的に見れば、AI大型上場の延期は、暗号資産市場と同じリスク選好に影響するだろう。
来週、予定どおりロードショーを実施するのか。それとも1兆ドル近辺まで引き下げるのか? 👇
$BTC $ETH
#AI #IPO #AnthropicのIPO評価額への疑念
83

翻訳参照
#AnthropicIPOValuationDoubts
De grands investisseurs institutionnels s’opposent à la valorisation visée de 1 500 milliards de dollars pour l’introduction en bourse d’Anthropic, suscitant de sérieux doutes quant à la possibilité que cette entrée en bourse spectaculaire se déroule selon les modalités prévues. Après une déroute de 2 500 milliards de dollars sur le marché technologique, le jeudi 5 novembre 2026, qui a lourdement touché les actions liées à l’IA, les investisseurs sont de plus en plus sceptiques quant à la capacité du marché à absorber une émission aussi fortement valorisée. [1, 2, 3]
Facteurs clés à l’origine des doutes sur la valorisation
Volatilité des marchés macroéconomiques : une forte vague de ventes, liée au dénouement de positions importantes sur l’intelligence artificielle, a effacé des milliers de milliards de dollars du Nasdaq Composite. Les gestionnaires de fonds institutionnels qui viennent tout juste de « se brûler » hésitent à prendre d’énormes risques sur des titres aux multiples de valorisation élevés. [1, 2]
$CYBER
{future}(CYBERUSDT)
$AKE
{future}(AKEUSDT)
$UAI
{future}(UAIUSDT)
#AnthropicIPOValuationDoubts
De grands investisseurs institutionnels s’opposent à la valorisation visée de 1 500 milliards de dollars pour l’introduction en bourse d’Anthropic, suscitant de sérieux doutes quant à la possibilité que cette entrée en bourse spectaculaire se déroule selon les modalités prévues. Après une déroute de 2 500 milliards de dollars sur le marché technologique, le jeudi 5 novembre 2026, qui a lourdement touché les actions liées à l’IA, les investisseurs sont de plus en plus sceptiques quant à la capacité du marché à absorber une émission aussi fortement valorisée. [1, 2, 3]
Facteurs clés à l’origine des doutes sur la valorisation
Volatilité des marchés macroéconomiques : une forte vague de ventes, liée au dénouement de positions importantes sur l’intelligence artificielle, a effacé des milliers de milliards de dollars du Nasdaq Composite. Les gestionnaires de fonds institutionnels qui viennent tout juste de « se brûler » hésitent à prendre d’énormes risques sur des titres aux multiples de valorisation élevés. [1, 2]
$CYBER
$AKE
$UAI
De grands investisseurs institutionnels s’opposent à la valorisation visée de 1 500 milliards de dollars pour l’introduction en bourse d’Anthropic, suscitant de sérieux doutes quant à la possibilité que cette entrée en bourse spectaculaire se déroule selon les modalités prévues. Après une déroute de 2 500 milliards de dollars sur le marché technologique, le jeudi 5 novembre 2026, qui a lourdement touché les actions liées à l’IA, les investisseurs sont de plus en plus sceptiques quant à la capacité du marché à absorber une émission aussi fortement valorisée. [1, 2, 3]
Facteurs clés à l’origine des doutes sur la valorisation
Volatilité des marchés macroéconomiques : une forte vague de ventes, liée au dénouement de positions importantes sur l’intelligence artificielle, a effacé des milliers de milliards de dollars du Nasdaq Composite. Les gestionnaires de fonds institutionnels qui viennent tout juste de « se brûler » hésitent à prendre d’énormes risques sur des titres aux multiples de valorisation élevés. [1, 2]
$CYBER
$AKE
$UAI
146
·
--
#AnthropicIPOValuationDoubts
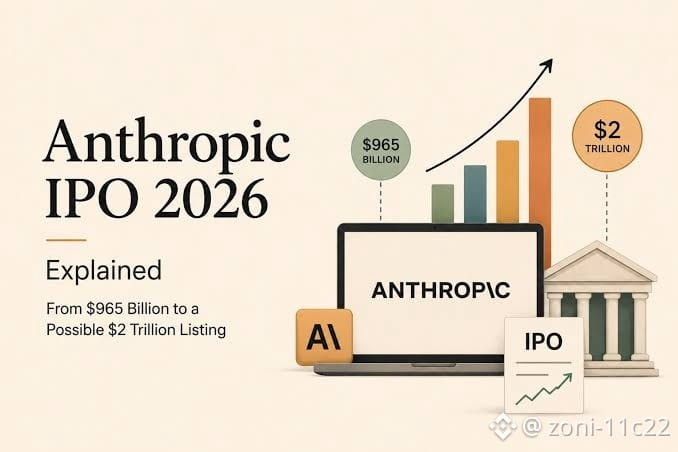
大手機関投資家は、Anthropicが目標とするIPO評価額1.5兆ドルに反発しており、計画された条件でこの大型上場が実現できるのか、深刻な疑問が生じています。2026年11月5日木曜日にテクノロジー市場で起きた2.5兆ドル規模の大暴落により、AI関連株が大きく打撃を受けたことを受け、これほど高い価格設定の新規公開株を市場が吸収できるのか、支援者の間で懐疑的な見方が強まっています。[1, 2, 3]
評価額に疑問が生じている主な要因
マクロ市場の変動:人工知能への大規模な投資の巻き戻しに伴う急落で、ナスダック総合指数から数兆ドルが消失しました。つい最近「痛手を負った」機関投資家のファンドマネージャーは、倍率の高い銘柄に巨額のリスクを取ることに慎重になっています。[1, 2]
$BTC
{future}(BTCUSDT)
$DOT
{future}(DOTUSDT)
$ETH
{future}(ETHUSDT)
#AnthropicIPOValuationDoubts
大手機関投資家は、Anthropicが目標とするIPO評価額1.5兆ドルに反発しており、計画された条件でこの大型上場が実現できるのか、深刻な疑問が生じています。2026年11月5日木曜日にテクノロジー市場で起きた2.5兆ドル規模の大暴落により、AI関連株が大きく打撃を受けたことを受け、これほど高い価格設定の新規公開株を市場が吸収できるのか、支援者の間で懐疑的な見方が強まっています。[1, 2, 3]
評価額に疑問が生じている主な要因
マクロ市場の変動:人工知能への大規模な投資の巻き戻しに伴う急落で、ナスダック総合指数から数兆ドルが消失しました。つい最近「痛手を負った」機関投資家のファンドマネージャーは、倍率の高い銘柄に巨額のリスクを取ることに慎重になっています。[1, 2]
$BTC
$DOT
$ETH
大手機関投資家は、Anthropicが目標とするIPO評価額1.5兆ドルに反発しており、計画された条件でこの大型上場が実現できるのか、深刻な疑問が生じています。2026年11月5日木曜日にテクノロジー市場で起きた2.5兆ドル規模の大暴落により、AI関連株が大きく打撃を受けたことを受け、これほど高い価格設定の新規公開株を市場が吸収できるのか、支援者の間で懐疑的な見方が強まっています。[1, 2, 3]
評価額に疑問が生じている主な要因
マクロ市場の変動:人工知能への大規模な投資の巻き戻しに伴う急落で、ナスダック総合指数から数兆ドルが消失しました。つい最近「痛手を負った」機関投資家のファンドマネージャーは、倍率の高い銘柄に巨額のリスクを取ることに慎重になっています。[1, 2]
$BTC
$DOT
$ETH
177

·
--
ブリッシュ
#AnthropicIPOValuationDoubts
最新情報:2026年11月6日
Anthropicが計画しているIPOは、投資家がその高い評価額に疑問を呈しているため、実現に懸念が広がっています。
評価額:Anthropicの価値が1.5兆ドルに相当するのか、投資家は確信を持てずにいます。
$IPO.ETF 遅延:同社は$IPO.ETF を延期する可能性があります。
高コスト:AnthropicはAI技術とインフラに巨額の資金を投じています。
投資家の懸念:投資家は、投資する前にさらなる利益を確認したいと考えています。
なぜ重要なのでしょうか?
Anthropicの評価額が下がれば、AI市場に対する投資家の信頼に影響を及ぼす可能性があります。
#Anthropic #IPO #AI #テクノロジーニュース #StockMarket
{etf_us}(IPO.ETF)
{spot}(TAOUSDT)
{spot}(WLDUSDT)
#AnthropicIPOValuationDoubts
最新情報:2026年11月6日
Anthropicが計画しているIPOは、投資家がその高い評価額に疑問を呈しているため、実現に懸念が広がっています。
評価額:Anthropicの価値が1.5兆ドルに相当するのか、投資家は確信を持てずにいます。
$IPO.ETF 遅延:同社は$IPO.ETF を延期する可能性があります。
高コスト:AnthropicはAI技術とインフラに巨額の資金を投じています。
投資家の懸念:投資家は、投資する前にさらなる利益を確認したいと考えています。
なぜ重要なのでしょうか?
Anthropicの評価額が下がれば、AI市場に対する投資家の信頼に影響を及ぼす可能性があります。
#Anthropic #IPO #AI #テクノロジーニュース #StockMarket
最新情報:2026年11月6日
Anthropicが計画しているIPOは、投資家がその高い評価額に疑問を呈しているため、実現に懸念が広がっています。
評価額:Anthropicの価値が1.5兆ドルに相当するのか、投資家は確信を持てずにいます。
$IPO.ETF 遅延:同社は$IPO.ETF を延期する可能性があります。
高コスト:AnthropicはAI技術とインフラに巨額の資金を投じています。
投資家の懸念:投資家は、投資する前にさらなる利益を確認したいと考えています。
なぜ重要なのでしょうか?
Anthropicの評価額が下がれば、AI市場に対する投資家の信頼に影響を及ぼす可能性があります。
#Anthropic #IPO #AI #テクノロジーニュース #StockMarket
152
#AnthropicIPOValuationDoubts
アンソロピックのIPO評価額1.5兆ドルに投資家から疑問の声!
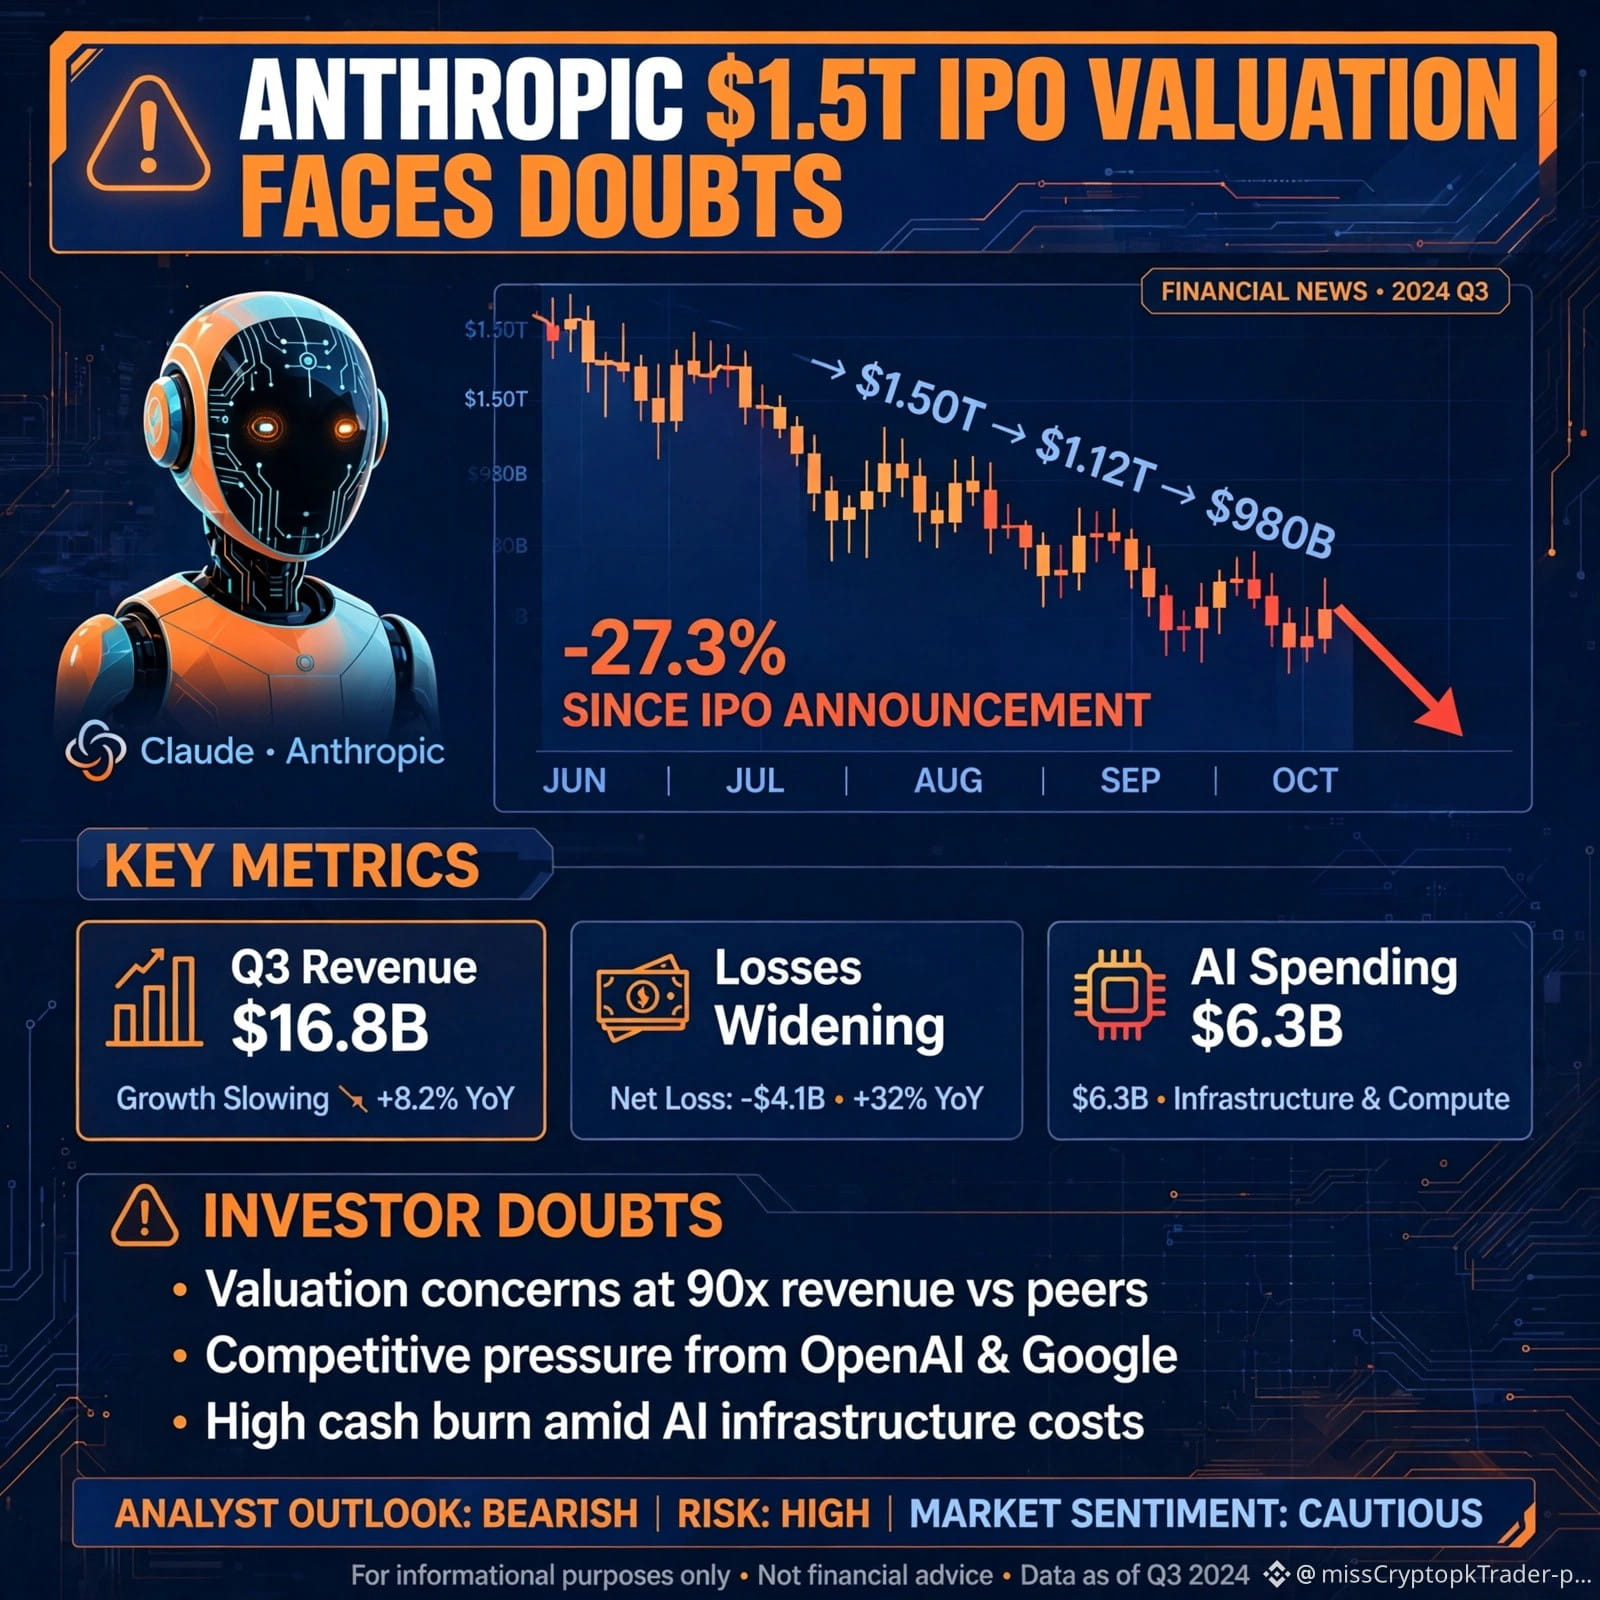
テクノロジー株が急落するなか、アンソロピックが巨額のIPO評価額を正当化できるのか、投資家の間で疑問が広がっています。
📊 主なポイント:
- 💰 IPO評価額の予想:約1.5兆ドル。
- 📉 評価額の引き下げを求める投資家も。
- 📊 第3四半期の売上高は168億ドルに達したと報じられています。
- ⚠️ 売上高の伸びは前四半期までと比べて鈍化。
- 🏦 営業損失と、AIインフラへの巨額投資が懸念されています。
- 📅 IPOのロードショーは11月9日の週に始まる見通しでした。
重要な理由:
アンソロピックのIPOは、AI業界に対する投資家の信頼を測る重要な試金石となる可能性があります。評価額が予想を下回れば、AI関連株やテクノロジー企業への圧力がさらに強まるおそれがあります。
🔥 大きな疑問:AIブームは、評価額の現実を突きつけられているのでしょうか?
どう思いますか?
#Anthropic #IPO #TechStocks #ArtificialIntelligence
$NVDA $GOOGL $AMZN
#AnthropicIPOValuationDoubts
アンソロピックのIPO評価額1.5兆ドルに投資家から疑問の声!
テクノロジー株が急落するなか、アンソロピックが巨額のIPO評価額を正当化できるのか、投資家の間で疑問が広がっています。
📊 主なポイント:
- 💰 IPO評価額の予想:約1.5兆ドル。
- 📉 評価額の引き下げを求める投資家も。
- 📊 第3四半期の売上高は168億ドルに達したと報じられています。
- ⚠️ 売上高の伸びは前四半期までと比べて鈍化。
- 🏦 営業損失と、AIインフラへの巨額投資が懸念されています。
- 📅 IPOのロードショーは11月9日の週に始まる見通しでした。
重要な理由:
アンソロピックのIPOは、AI業界に対する投資家の信頼を測る重要な試金石となる可能性があります。評価額が予想を下回れば、AI関連株やテクノロジー企業への圧力がさらに強まるおそれがあります。
🔥 大きな疑問:AIブームは、評価額の現実を突きつけられているのでしょうか?
どう思いますか?
#Anthropic #IPO #TechStocks #ArtificialIntelligence
$NVDA $GOOGL $AMZN
アンソロピックのIPO評価額1.5兆ドルに投資家から疑問の声!
テクノロジー株が急落するなか、アンソロピックが巨額のIPO評価額を正当化できるのか、投資家の間で疑問が広がっています。
📊 主なポイント:
- 💰 IPO評価額の予想:約1.5兆ドル。
- 📉 評価額の引き下げを求める投資家も。
- 📊 第3四半期の売上高は168億ドルに達したと報じられています。
- ⚠️ 売上高の伸びは前四半期までと比べて鈍化。
- 🏦 営業損失と、AIインフラへの巨額投資が懸念されています。
- 📅 IPOのロードショーは11月9日の週に始まる見通しでした。
重要な理由:
アンソロピックのIPOは、AI業界に対する投資家の信頼を測る重要な試金石となる可能性があります。評価額が予想を下回れば、AI関連株やテクノロジー企業への圧力がさらに強まるおそれがあります。
🔥 大きな疑問:AIブームは、評価額の現実を突きつけられているのでしょうか?
どう思いますか?
#Anthropic #IPO #TechStocks #ArtificialIntelligence
$NVDA $GOOGL $AMZN
1
263

·
--
#AnthropicIPOValuationDoubts
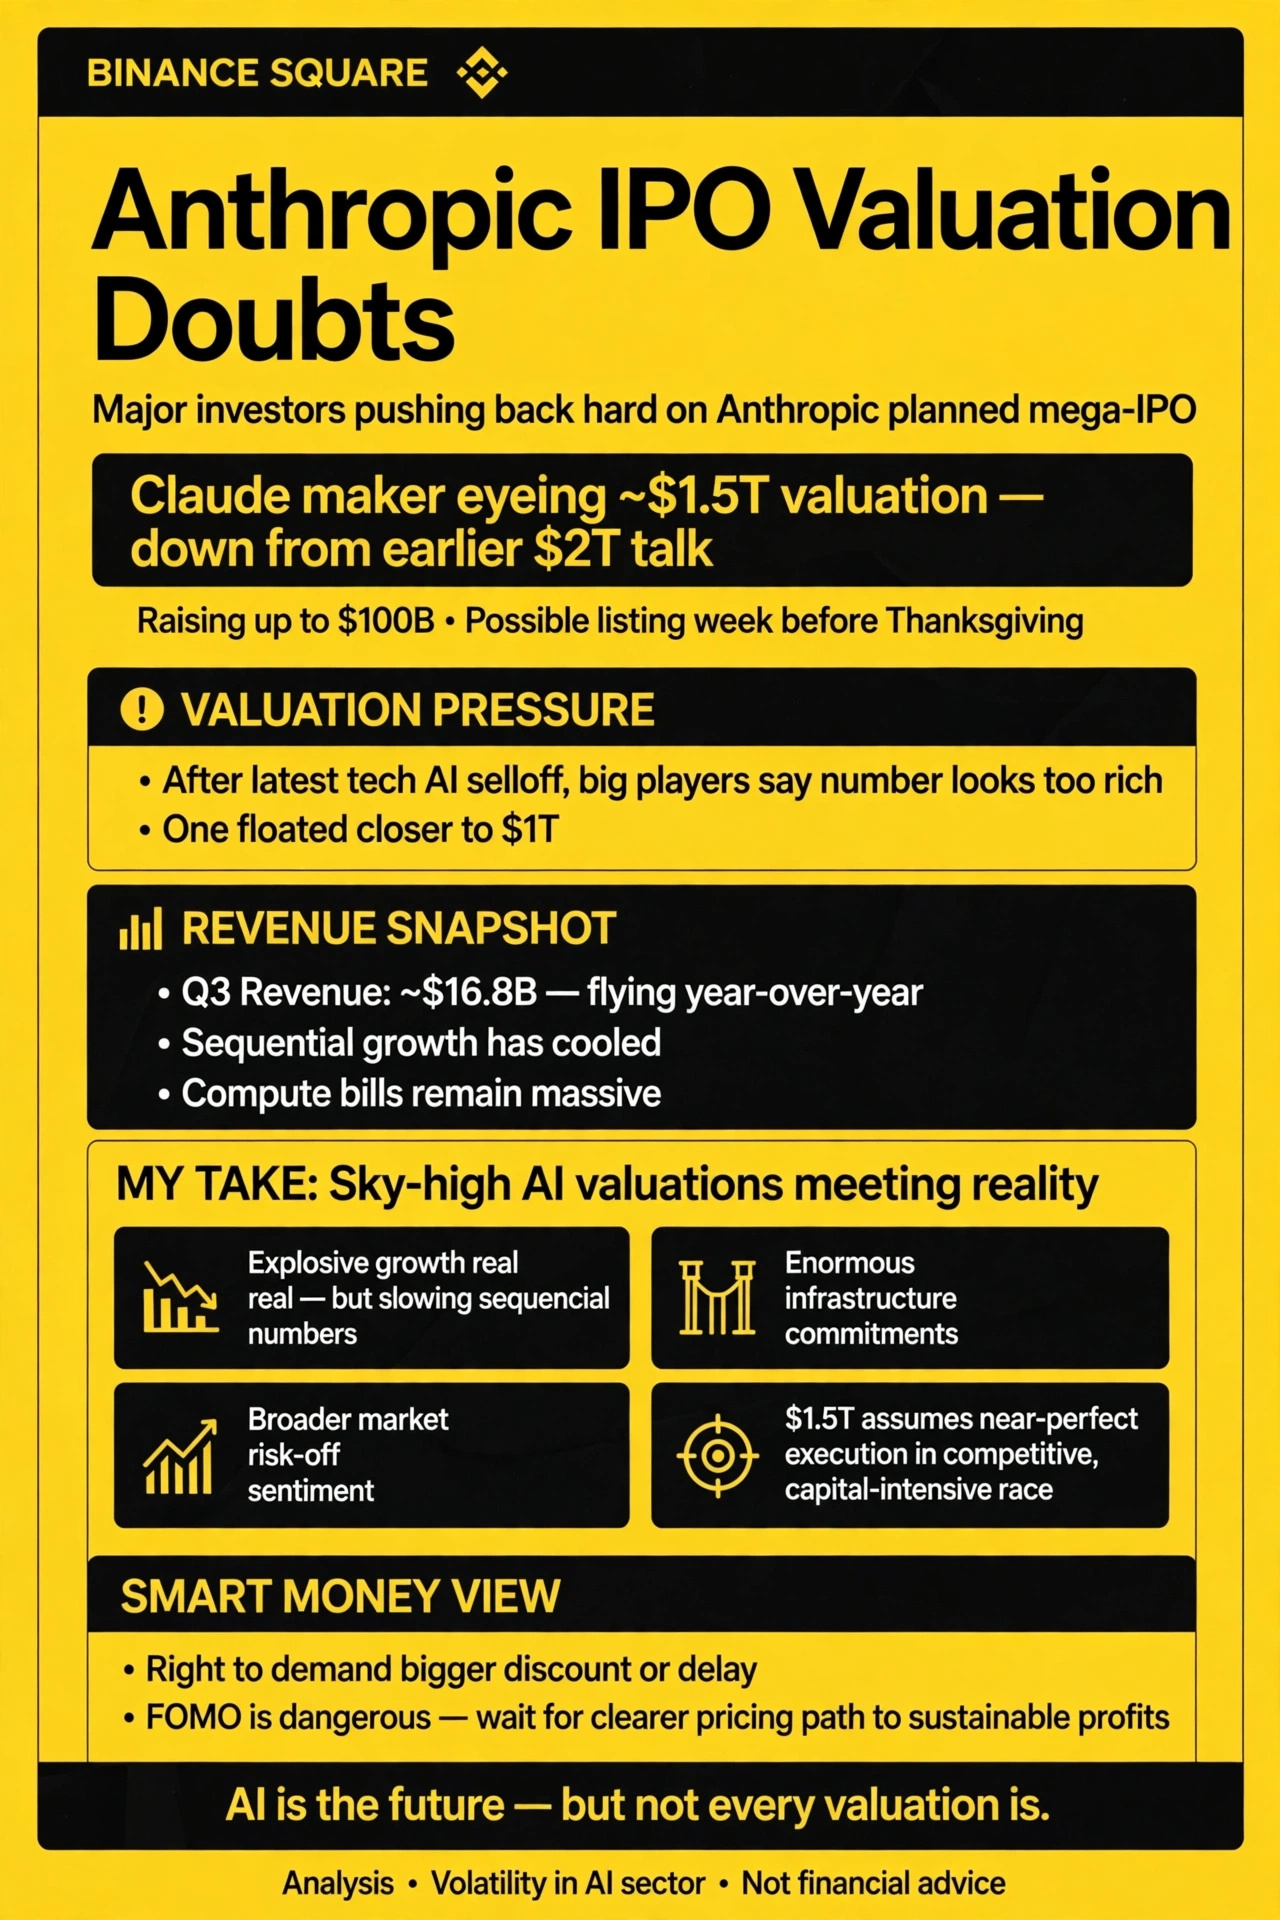
🚨大口投資家たちは、Anthropicが計画する超大型-$IPO.ETF に強く反発しています。Claudeを手がける同社は、約1.5兆ドル(以前に話題となった2兆ドルから引き下げ)の評価額を見込み、最大1,000億ドルの資金調達を計画。上場は感謝祭の前週になる可能性がありました。直近のテック・AI株の売りを受け、一部の大口投資家はその評価額は高すぎると指摘し、1兆ドル近辺を提示した人もいます。売上高は依然として急伸(第3四半期は約168億ドル)していますが、前四半期比の成長は鈍化し、コンピューティング費用は膨大です。
AIの天文学的な評価額が、ついに現実と向き合い始めています。爆発的な成長は事実ですが、前四半期比の伸びの鈍化、莫大なインフラ投資、そして市場全体のリスク回避ムードも現実です。1.5兆ドルという評価額は、競争が激しく資本集約的な競争で、ほぼ完璧な実行を前提としています。賢明な投資家が、より大きなディスカウント、あるいは延期を求めるのは当然です。ここでのFOMOは危険です。価格と持続可能な利益への道筋がより明確になるまで待ちましょう。AIは未来ですが、すべての評価額が妥当とは限りません。
ANTの目標株価はいくらですか? 👀
#Anthropic #AIIPO #ClaudeAI #テック株 #IPO2026
#AnthropicIPOValuationDoubts
🚨大口投資家たちは、Anthropicが計画する超大型-$IPO.ETF に強く反発しています。Claudeを手がける同社は、約1.5兆ドル(以前に話題となった2兆ドルから引き下げ)の評価額を見込み、最大1,000億ドルの資金調達を計画。上場は感謝祭の前週になる可能性がありました。直近のテック・AI株の売りを受け、一部の大口投資家はその評価額は高すぎると指摘し、1兆ドル近辺を提示した人もいます。売上高は依然として急伸(第3四半期は約168億ドル)していますが、前四半期比の成長は鈍化し、コンピューティング費用は膨大です。
AIの天文学的な評価額が、ついに現実と向き合い始めています。爆発的な成長は事実ですが、前四半期比の伸びの鈍化、莫大なインフラ投資、そして市場全体のリスク回避ムードも現実です。1.5兆ドルという評価額は、競争が激しく資本集約的な競争で、ほぼ完璧な実行を前提としています。賢明な投資家が、より大きなディスカウント、あるいは延期を求めるのは当然です。ここでのFOMOは危険です。価格と持続可能な利益への道筋がより明確になるまで待ちましょう。AIは未来ですが、すべての評価額が妥当とは限りません。
ANTの目標株価はいくらですか? 👀
#Anthropic #AIIPO #ClaudeAI #テック株 #IPO2026
🚨大口投資家たちは、Anthropicが計画する超大型-$IPO.ETF に強く反発しています。Claudeを手がける同社は、約1.5兆ドル(以前に話題となった2兆ドルから引き下げ)の評価額を見込み、最大1,000億ドルの資金調達を計画。上場は感謝祭の前週になる可能性がありました。直近のテック・AI株の売りを受け、一部の大口投資家はその評価額は高すぎると指摘し、1兆ドル近辺を提示した人もいます。売上高は依然として急伸(第3四半期は約168億ドル)していますが、前四半期比の成長は鈍化し、コンピューティング費用は膨大です。
AIの天文学的な評価額が、ついに現実と向き合い始めています。爆発的な成長は事実ですが、前四半期比の伸びの鈍化、莫大なインフラ投資、そして市場全体のリスク回避ムードも現実です。1.5兆ドルという評価額は、競争が激しく資本集約的な競争で、ほぼ完璧な実行を前提としています。賢明な投資家が、より大きなディスカウント、あるいは延期を求めるのは当然です。ここでのFOMOは危険です。価格と持続可能な利益への道筋がより明確になるまで待ちましょう。AIは未来ですが、すべての評価額が妥当とは限りません。
ANTの目標株価はいくらですか? 👀
#Anthropic #AIIPO #ClaudeAI #テック株 #IPO2026
191

·
--
弱気相場
🤖 Anthropic、1.5兆米ドルでのIPOを目指す:自信過剰か、それとも「高すぎる評価」か? 🤖
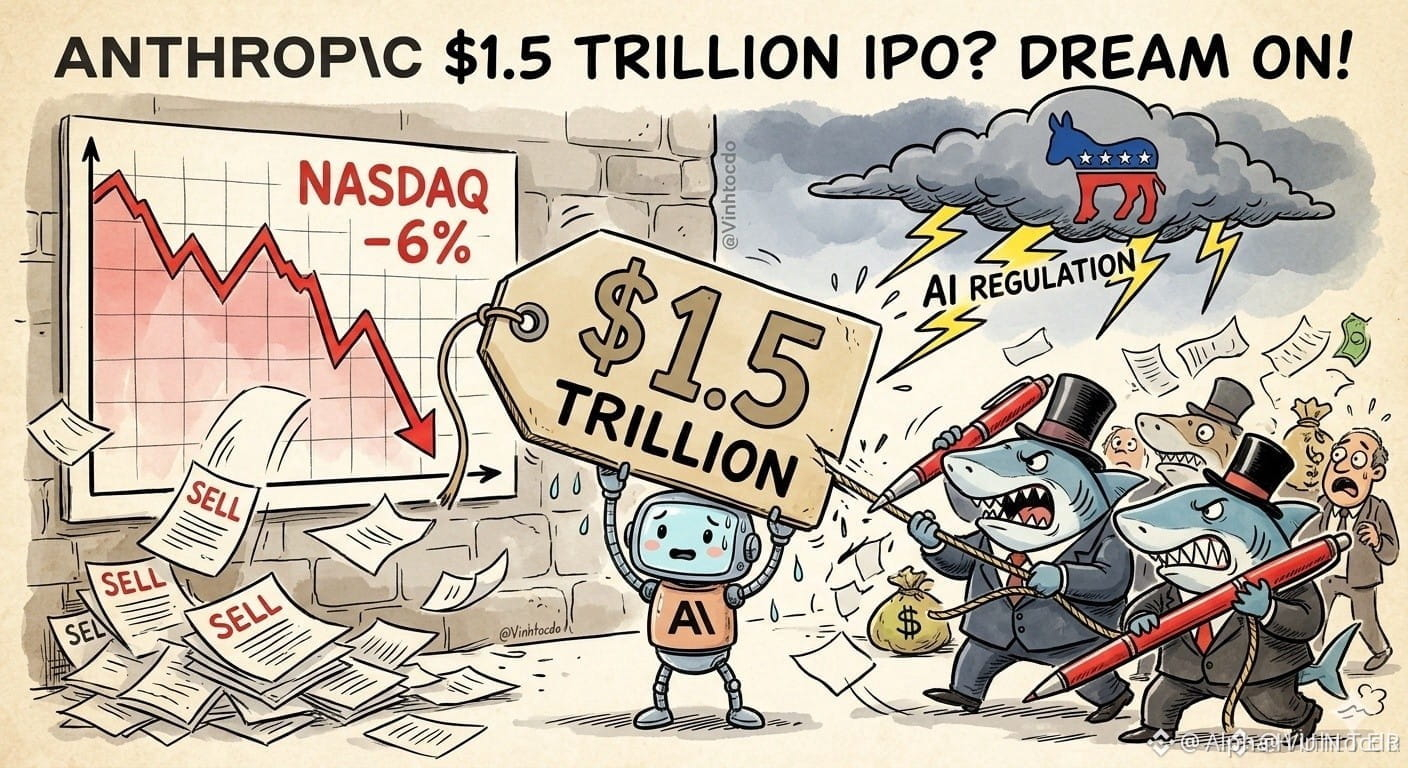
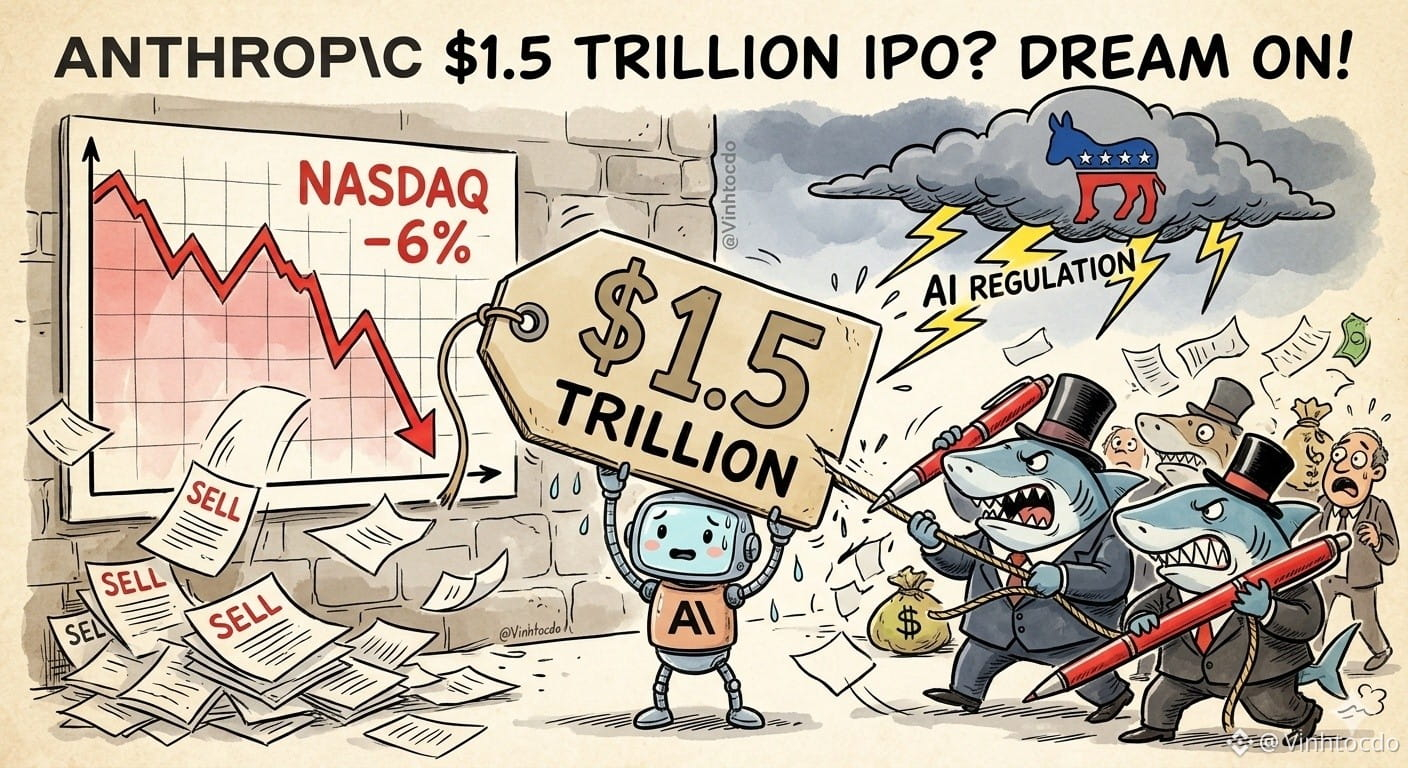
注目のAIスタートアップAnthropicが、「天文学的な」1.5兆米ドルの評価額でIPOを検討しています。ところが運悪く、中間選挙で民主党が大勝し、AI規制の強化を求める声が高まったことで、ナスダック100は6%急落。Nvidiaなどの大手半導体企業も売り浴びせられました。今や大口投資家はAnthropicに「夢を見すぎるのはやめて」、評価額を引き下げるよう求めています。
詳しい分析:兆ドルの夢は「法の壁」にぶつかりつつあります。新政権による厳しい規制への懸念で市場が「火の海」となっているなか、今、1,000億米ドルを調達するのは、嵐の中で資金を集めるようなものです。
トレーダーはどうすべき?
1. Anthropicが「大口投資家」に値下げを迫られる様子を、様子見する。
2. 暗号資産に注目する。特に、この調整局面に巻き込まれて下落しているAIコインに注目。
これは金融アドバイスではありません。
👉 下の取引リンクをクリックして応援してください:
$BTC
{spot}(BTCUSDT)
$ETH
{spot}(ETHUSDT)
$BNB
{spot}(BNBUSDT)
Binanceに新規登録して、コードVINHTOCDOを入力するか、こちらのリンクをご利用ください:[https://www.binance.com/register?ref=VINHTOCDO](https://www.binance.com/register?ref=VINHTOCDO)
#AnthropicIPOValuationDoubts #AIStocks #TechCrash #IPOMania #CryptoTrading #VINHTOCDO #Anthropic
🤖 Anthropic、1.5兆米ドルでのIPOを目指す:自信過剰か、それとも「高すぎる評価」か? 🤖
注目のAIスタートアップAnthropicが、「天文学的な」1.5兆米ドルの評価額でIPOを検討しています。ところが運悪く、中間選挙で民主党が大勝し、AI規制の強化を求める声が高まったことで、ナスダック100は6%急落。Nvidiaなどの大手半導体企業も売り浴びせられました。今や大口投資家はAnthropicに「夢を見すぎるのはやめて」、評価額を引き下げるよう求めています。
詳しい分析:兆ドルの夢は「法の壁」にぶつかりつつあります。新政権による厳しい規制への懸念で市場が「火の海」となっているなか、今、1,000億米ドルを調達するのは、嵐の中で資金を集めるようなものです。
トレーダーはどうすべき?
1. Anthropicが「大口投資家」に値下げを迫られる様子を、様子見する。
2. 暗号資産に注目する。特に、この調整局面に巻き込まれて下落しているAIコインに注目。
これは金融アドバイスではありません。
👉 下の取引リンクをクリックして応援してください:
$BTC
$ETH
$BNB
Binanceに新規登録して、コードVINHTOCDOを入力するか、こちらのリンクをご利用ください:https://www.binance.com/register?ref=VINHTOCDO
#AnthropicIPOValuationDoubts #AIStocks #TechCrash #IPOMania #CryptoTrading #VINHTOCDO #Anthropic
注目のAIスタートアップAnthropicが、「天文学的な」1.5兆米ドルの評価額でIPOを検討しています。ところが運悪く、中間選挙で民主党が大勝し、AI規制の強化を求める声が高まったことで、ナスダック100は6%急落。Nvidiaなどの大手半導体企業も売り浴びせられました。今や大口投資家はAnthropicに「夢を見すぎるのはやめて」、評価額を引き下げるよう求めています。
詳しい分析:兆ドルの夢は「法の壁」にぶつかりつつあります。新政権による厳しい規制への懸念で市場が「火の海」となっているなか、今、1,000億米ドルを調達するのは、嵐の中で資金を集めるようなものです。
トレーダーはどうすべき?
1. Anthropicが「大口投資家」に値下げを迫られる様子を、様子見する。
2. 暗号資産に注目する。特に、この調整局面に巻き込まれて下落しているAIコインに注目。
これは金融アドバイスではありません。
👉 下の取引リンクをクリックして応援してください:
$BTC
$ETH
$BNB
Binanceに新規登録して、コードVINHTOCDOを入力するか、こちらのリンクをご利用ください:https://www.binance.com/register?ref=VINHTOCDO
#AnthropicIPOValuationDoubts #AIStocks #TechCrash #IPOMania #CryptoTrading #VINHTOCDO #Anthropic
5
389

📉 AnthropicのIPO、企業価値の現実を突きつけられる
Anthropicが今後のIPOで目標とする1兆5,000億ドルの企業価値を実現できるのか、主要投資家の間で疑問の声が上がっています。市場の変動とAI業界への慎重な見方を背景に、投資家の出資確約を得るため、より現実的な価格設定を求める声が高まっています。
現実に即した価格調整は、IPOをより確かなものにし、現在の市場環境を反映することにつながるでしょう。適切な水準で上場を成功させれば、AI業界にとって歴史的な上場となり、公開市場における評価の指標もより明確になります。
$ANTHROPIC #CoinVahini #AnthropicIPOValuationDoubts #AIIPO #TechValuation
📉 AnthropicのIPO、企業価値の現実を突きつけられる
Anthropicが今後のIPOで目標とする1兆5,000億ドルの企業価値を実現できるのか、主要投資家の間で疑問の声が上がっています。市場の変動とAI業界への慎重な見方を背景に、投資家の出資確約を得るため、より現実的な価格設定を求める声が高まっています。
現実に即した価格調整は、IPOをより確かなものにし、現在の市場環境を反映することにつながるでしょう。適切な水準で上場を成功させれば、AI業界にとって歴史的な上場となり、公開市場における評価の指標もより明確になります。
$ANTHROPIC #CoinVahini #AnthropicIPOValuationDoubts #AIIPO #TechValuation
Anthropicが今後のIPOで目標とする1兆5,000億ドルの企業価値を実現できるのか、主要投資家の間で疑問の声が上がっています。市場の変動とAI業界への慎重な見方を背景に、投資家の出資確約を得るため、より現実的な価格設定を求める声が高まっています。
現実に即した価格調整は、IPOをより確かなものにし、現在の市場環境を反映することにつながるでしょう。適切な水準で上場を成功させれば、AI業界にとって歴史的な上場となり、公開市場における評価の指標もより明確になります。
$ANTHROPIC #CoinVahini #AnthropicIPOValuationDoubts #AIIPO #TechValuation
31

·
--
ブリッシュ
#anthropicipovaluationdoubts 🧠 AnthropicのIPO評価額への疑問:暗号資産市場に与える影響
従来型市場がAI企業の極めて高い評価額を精査するなか、暗号資産エコシステムも注目しています。AnthropicのIPOをめぐる動きがデジタル資産にどのような波及効果をもたらすのか、見ていきましょう。
📰 主要ニュース
• Anthropicは新規株式公開(IPO)を申請したと報じられており、目標とする評価額は1.5兆ドルから2兆ドルの範囲で議論されています finance.yahoo.com。
• しかし、最近の提出書類や市場分析では、多額の営業損失と巨額のインフラ投資が明らかになっています www.forbes.com。
• これを受け、現在のAI企業の評価額が持続可能なのか、また業界全体がより厳しい現実に直面しているのかについて、投資家の議論が高まっています fortune.com。
📊 市場への影響
• 高ベータ相関:暗号資産市場は、より広範なテクノロジー株やAI株のセンチメントと連動して動く傾向を強めています。どちらも高ベータのリスク資産として扱われることが多いためです www.bignewsnetwork.com。
• AIトークンへの監視強化:従来型市場で懐疑的な見方が強まれば、AIをテーマにした暗号資産トークンへの監視も厳しくなる可能性があります。投資家の関心は、単なる話題性から、実用性や実際の収益を備えたプロジェクトへと移るでしょう www.rttnews.com。
• 資金のローテーション:公開市場の投資家がAIの収益性に慎重になれば、暗号資産市場内でも、投機的なAI関連銘柄ではなく、ファンダメンタルズの強いセクターへ資金が移る可能性があります。
💬 議論に参加しましょう
AIをテーマにした暗号資産トークンは、従来型のAI株のセンチメントから独立して動くようになると思いますか?それとも、これからも連動し続けるでしょうか?ぜひ下の欄で意見を聞かせてください! 👇
#AI #暗号資産市場 #Anthropic #ブロックチェーン #Web3
これは教育目的のみの情報です。金融上の助言ではありません(NFA)。必ずご自身で調査してください(DYOR)。
$SQQQB $ERA $ACT
{future}(ACTUSDT)
{future}(ERAUSDT)
{spot}(SQQQBUSDT)
#anthropicipovaluationdoubts 🧠 AnthropicのIPO評価額への疑問:暗号資産市場に与える影響
従来型市場がAI企業の極めて高い評価額を精査するなか、暗号資産エコシステムも注目しています。AnthropicのIPOをめぐる動きがデジタル資産にどのような波及効果をもたらすのか、見ていきましょう。
📰 主要ニュース
• Anthropicは新規株式公開(IPO)を申請したと報じられており、目標とする評価額は1.5兆ドルから2兆ドルの範囲で議論されています finance.yahoo.com。
• しかし、最近の提出書類や市場分析では、多額の営業損失と巨額のインフラ投資が明らかになっています www.forbes.com。
• これを受け、現在のAI企業の評価額が持続可能なのか、また業界全体がより厳しい現実に直面しているのかについて、投資家の議論が高まっています fortune.com。
📊 市場への影響
• 高ベータ相関:暗号資産市場は、より広範なテクノロジー株やAI株のセンチメントと連動して動く傾向を強めています。どちらも高ベータのリスク資産として扱われることが多いためです www.bignewsnetwork.com。
• AIトークンへの監視強化:従来型市場で懐疑的な見方が強まれば、AIをテーマにした暗号資産トークンへの監視も厳しくなる可能性があります。投資家の関心は、単なる話題性から、実用性や実際の収益を備えたプロジェクトへと移るでしょう www.rttnews.com。
• 資金のローテーション:公開市場の投資家がAIの収益性に慎重になれば、暗号資産市場内でも、投機的なAI関連銘柄ではなく、ファンダメンタルズの強いセクターへ資金が移る可能性があります。
💬 議論に参加しましょう
AIをテーマにした暗号資産トークンは、従来型のAI株のセンチメントから独立して動くようになると思いますか?それとも、これからも連動し続けるでしょうか?ぜひ下の欄で意見を聞かせてください! 👇
#AI #暗号資産市場 #Anthropic #ブロックチェーン #Web3
これは教育目的のみの情報です。金融上の助言ではありません(NFA)。必ずご自身で調査してください(DYOR)。
$SQQQB $ERA $ACT
従来型市場がAI企業の極めて高い評価額を精査するなか、暗号資産エコシステムも注目しています。AnthropicのIPOをめぐる動きがデジタル資産にどのような波及効果をもたらすのか、見ていきましょう。
📰 主要ニュース
• Anthropicは新規株式公開(IPO)を申請したと報じられており、目標とする評価額は1.5兆ドルから2兆ドルの範囲で議論されています finance.yahoo.com。
• しかし、最近の提出書類や市場分析では、多額の営業損失と巨額のインフラ投資が明らかになっています www.forbes.com。
• これを受け、現在のAI企業の評価額が持続可能なのか、また業界全体がより厳しい現実に直面しているのかについて、投資家の議論が高まっています fortune.com。
📊 市場への影響
• 高ベータ相関:暗号資産市場は、より広範なテクノロジー株やAI株のセンチメントと連動して動く傾向を強めています。どちらも高ベータのリスク資産として扱われることが多いためです www.bignewsnetwork.com。
• AIトークンへの監視強化:従来型市場で懐疑的な見方が強まれば、AIをテーマにした暗号資産トークンへの監視も厳しくなる可能性があります。投資家の関心は、単なる話題性から、実用性や実際の収益を備えたプロジェクトへと移るでしょう www.rttnews.com。
• 資金のローテーション:公開市場の投資家がAIの収益性に慎重になれば、暗号資産市場内でも、投機的なAI関連銘柄ではなく、ファンダメンタルズの強いセクターへ資金が移る可能性があります。
💬 議論に参加しましょう
AIをテーマにした暗号資産トークンは、従来型のAI株のセンチメントから独立して動くようになると思いますか?それとも、これからも連動し続けるでしょうか?ぜひ下の欄で意見を聞かせてください! 👇
#AI #暗号資産市場 #Anthropic #ブロックチェーン #Web3
これは教育目的のみの情報です。金融上の助言ではありません(NFA)。必ずご自身で調査してください(DYOR)。
$SQQQB $ERA $ACT

293
·
--
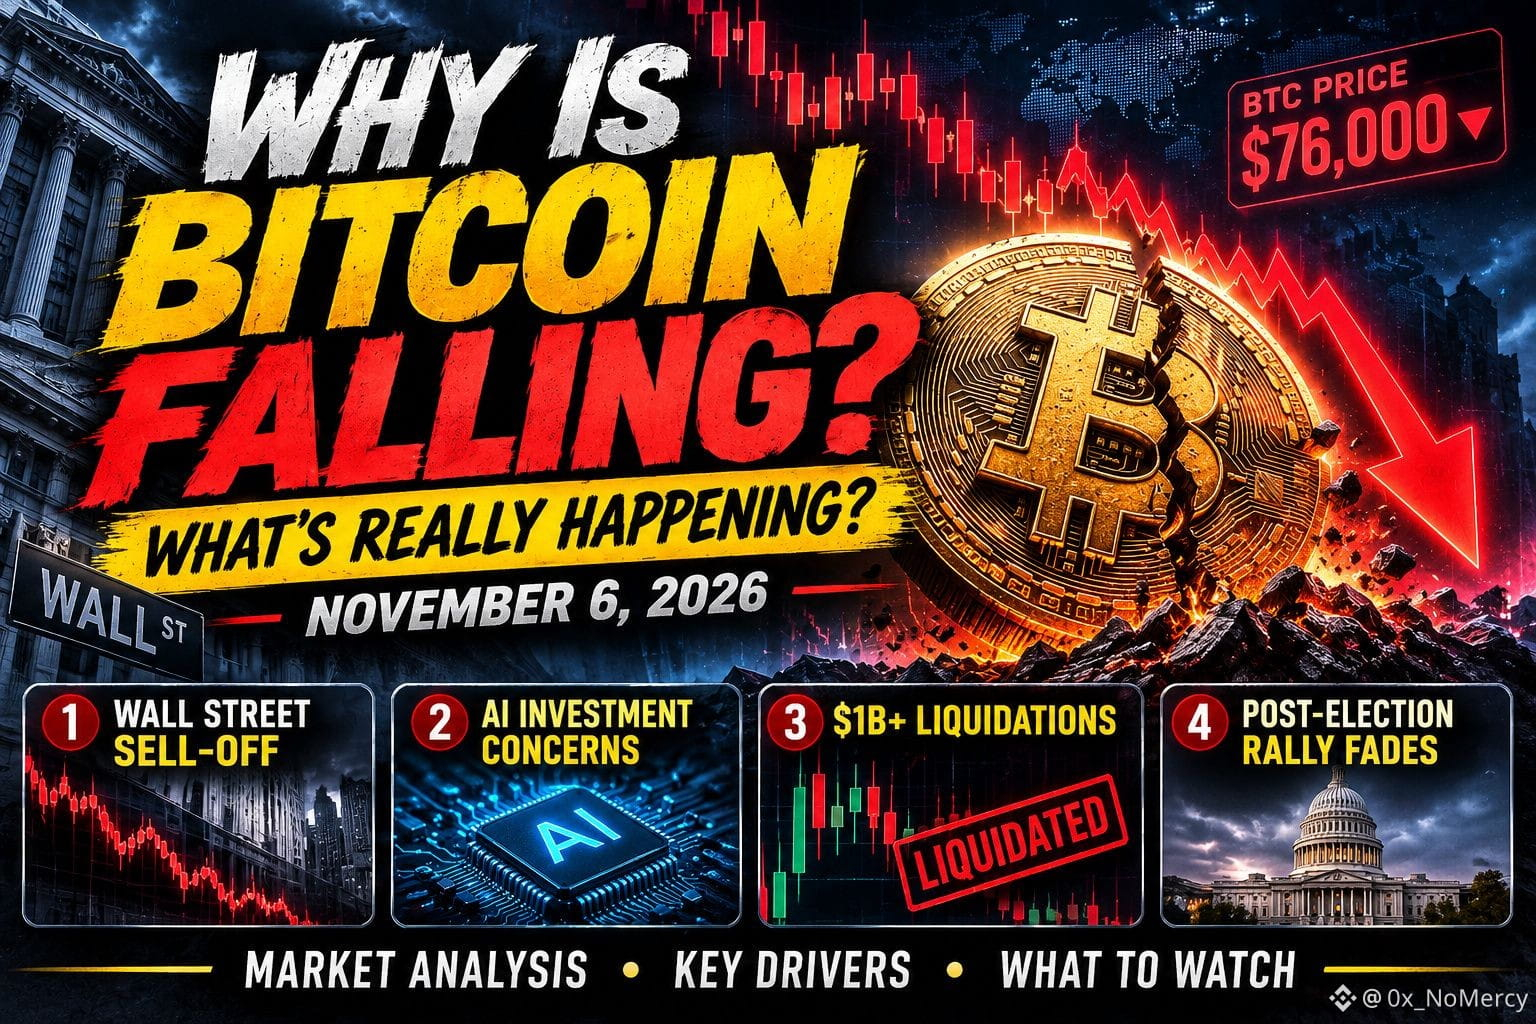
$BTC はなぜ下落しているのか?売り圧力の裏で実際に何が起きているのか?
ビットコインは76,000ドルを下回り、選挙後に80,000ドルを超えた上昇分を失いました。
しかし、この売りはビットコインだけの問題ではありません。今回の動きの背景には、より広範な金融市場の要因があります。
注目すべき点を4つご紹介します。
1. ウォール街で強い売り圧力がかかっています。
11月5日、ナスダックは5.5%下落し、S&P 500は4.3%、ダウ平均は3.4%下落しました。
投資家がリスク資産へのエクスポージャーを減らすなか、ビットコインも市場全体のリスク回避の動きに追随しました。
2. AI投資をめぐる見方に逆風が吹いています。
投資家は、巨額のAIインフラ投資、データセンターの拡張、半導体への支出が利益につながるのか、ますます疑問視しています。
この圧力は、ビットコインのマイニング関連株にも影響を及ぼしています。
3. 10億ドルを超える暗号資産のポジションが清算されました。
清算の大半はロングポジションでした。
レバレッジ取引を行うトレーダーがポジションの決済を余儀なくされると、売り圧力が強まり、連鎖的な清算を引き起こすことがあります。
4. 選挙後の上昇は、見た目ほど強くなかった可能性があります。
それまでの上昇の一部は、新たな現物需要の強さではなく、ショートカバーによるものだったと伝えられています。
市場心理が悪化すると、ビットコインは上昇分をすぐに失いました。
{future}(BTCUSDT)
自分なりの結論を出す前に、市場を理解しましょう。
$ETH $BNB #AnthropicIPOValuationDoubts #USStocksSlipandCryptoMarketUnderBroadPressure
$BTC はなぜ下落しているのか?売り圧力の裏で実際に何が起きているのか?
ビットコインは76,000ドルを下回り、選挙後に80,000ドルを超えた上昇分を失いました。
しかし、この売りはビットコインだけの問題ではありません。今回の動きの背景には、より広範な金融市場の要因があります。
注目すべき点を4つご紹介します。
1. ウォール街で強い売り圧力がかかっています。
11月5日、ナスダックは5.5%下落し、S&P 500は4.3%、ダウ平均は3.4%下落しました。
投資家がリスク資産へのエクスポージャーを減らすなか、ビットコインも市場全体のリスク回避の動きに追随しました。
2. AI投資をめぐる見方に逆風が吹いています。
投資家は、巨額のAIインフラ投資、データセンターの拡張、半導体への支出が利益につながるのか、ますます疑問視しています。
この圧力は、ビットコインのマイニング関連株にも影響を及ぼしています。
3. 10億ドルを超える暗号資産のポジションが清算されました。
清算の大半はロングポジションでした。
レバレッジ取引を行うトレーダーがポジションの決済を余儀なくされると、売り圧力が強まり、連鎖的な清算を引き起こすことがあります。
4. 選挙後の上昇は、見た目ほど強くなかった可能性があります。
それまでの上昇の一部は、新たな現物需要の強さではなく、ショートカバーによるものだったと伝えられています。
市場心理が悪化すると、ビットコインは上昇分をすぐに失いました。
自分なりの結論を出す前に、市場を理解しましょう。
$ETH $BNB #AnthropicIPOValuationDoubts #USStocksSlipandCryptoMarketUnderBroadPressure
ビットコインは76,000ドルを下回り、選挙後に80,000ドルを超えた上昇分を失いました。
しかし、この売りはビットコインだけの問題ではありません。今回の動きの背景には、より広範な金融市場の要因があります。
注目すべき点を4つご紹介します。
1. ウォール街で強い売り圧力がかかっています。
11月5日、ナスダックは5.5%下落し、S&P 500は4.3%、ダウ平均は3.4%下落しました。
投資家がリスク資産へのエクスポージャーを減らすなか、ビットコインも市場全体のリスク回避の動きに追随しました。
2. AI投資をめぐる見方に逆風が吹いています。
投資家は、巨額のAIインフラ投資、データセンターの拡張、半導体への支出が利益につながるのか、ますます疑問視しています。
この圧力は、ビットコインのマイニング関連株にも影響を及ぼしています。
3. 10億ドルを超える暗号資産のポジションが清算されました。
清算の大半はロングポジションでした。
レバレッジ取引を行うトレーダーがポジションの決済を余儀なくされると、売り圧力が強まり、連鎖的な清算を引き起こすことがあります。
4. 選挙後の上昇は、見た目ほど強くなかった可能性があります。
それまでの上昇の一部は、新たな現物需要の強さではなく、ショートカバーによるものだったと伝えられています。
市場心理が悪化すると、ビットコインは上昇分をすぐに失いました。
自分なりの結論を出す前に、市場を理解しましょう。
$ETH $BNB #AnthropicIPOValuationDoubts #USStocksSlipandCryptoMarketUnderBroadPressure
1
565

·
--
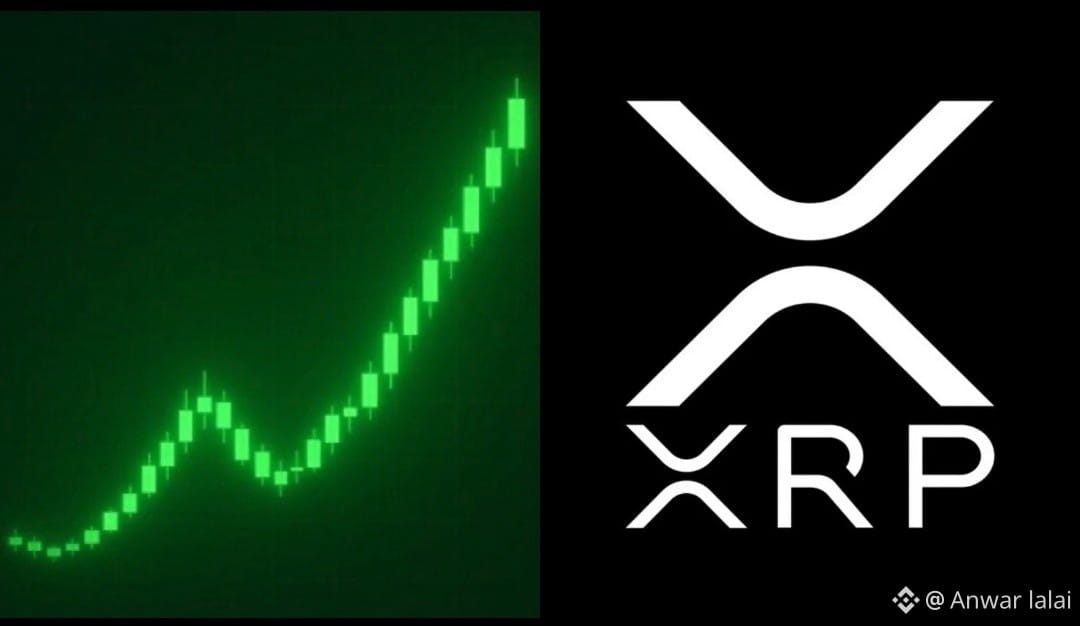
$XRP 約1.24ドルは、ほとんどの人が当然だと考える価格です。
$XRP 100〜1000ドルに達するのは不可能に思えます。
いつの日か、100〜1000ドルについて、不可能から当然へと認識が変わるのを目にするでしょう。$XRP
#BinanceReopensWithdrawalsForMoreAssets
#AnthropicIPOValuationDoubts
#KospiSlideTriggersCircuitBreaker
{spot}(XRPUSDT)
$XRP 約1.24ドルは、ほとんどの人が当然だと考える価格です。
$XRP 100〜1000ドルに達するのは不可能に思えます。
いつの日か、100〜1000ドルについて、不可能から当然へと認識が変わるのを目にするでしょう。$XRP
#BinanceReopensWithdrawalsForMoreAssets
#AnthropicIPOValuationDoubts
#KospiSlideTriggersCircuitBreaker
$XRP 100〜1000ドルに達するのは不可能に思えます。
いつの日か、100〜1000ドルについて、不可能から当然へと認識が変わるのを目にするでしょう。$XRP
#BinanceReopensWithdrawalsForMoreAssets
#AnthropicIPOValuationDoubts
#KospiSlideTriggersCircuitBreaker
1
397

·
--
弱気相場
🐸 ねえ $PEPE
{spot}(PEPEUSDT)
次の目標は? 😂🚀
🔰PEPE軍の心の中では、$0.010の夢はまだ生きています! 💚 ホルダーたちは大きな動きを待ち望み、ついに忍耐が報われることを願っています。でも問題は、$PEPE が大幅上昇でみんなを驚かせるのか、それともまた私たちをがっかりさせるのか? 👀📈
$PEPE 軍のみんな、まだ$0.010を夢見てる? 🐸💰
#PEPE
#Memecoins
#AnthropicIPOValuationDoubts
#BinanceReopensWithdrawalsForMoreAssets #StrategySTRCResumesIssuanceAfterOver170Days
🐸 ねえ $PEPE
次の目標は? 😂🚀
🔰PEPE軍の心の中では、$0.010の夢はまだ生きています! 💚 ホルダーたちは大きな動きを待ち望み、ついに忍耐が報われることを願っています。でも問題は、$PEPE が大幅上昇でみんなを驚かせるのか、それともまた私たちをがっかりさせるのか? 👀📈
$PEPE 軍のみんな、まだ$0.010を夢見てる? 🐸💰
#PEPE
#Memecoins
#AnthropicIPOValuationDoubts
#BinanceReopensWithdrawalsForMoreAssets #StrategySTRCResumesIssuanceAfterOver170Days
次の目標は? 😂🚀
🔰PEPE軍の心の中では、$0.010の夢はまだ生きています! 💚 ホルダーたちは大きな動きを待ち望み、ついに忍耐が報われることを願っています。でも問題は、$PEPE が大幅上昇でみんなを驚かせるのか、それともまた私たちをがっかりさせるのか? 👀📈
$PEPE 軍のみんな、まだ$0.010を夢見てる? 🐸💰
#PEPE
#Memecoins
#AnthropicIPOValuationDoubts
#BinanceReopensWithdrawalsForMoreAssets #StrategySTRCResumesIssuanceAfterOver170Days

2
539

🔽170億ドル規模のヘッジファンドが再編する一方、謎の売り手がデータセンター向け融資5億ドルを売却に出す。
Walleye Capitalは、10月に5.9%の損失を計上し、2020年3月以降で最悪の月となったことを受け、リーダーシップチームと株式投資チームを縮小し、投資家に資本を返還する準備を進めている。$AKE
Bloombergは先日、匿名の売り手がデータセンター向け融資5億ドルを売却に出していると報じた。
今、この売り手はWalleye自身ではないかとの憶測が強まっている。$UAI
同社の融資ポートフォリオには、ニューメキシコ州のStargateプロジェクトに関連する2,500万ドルの融資が含まれている。Oracleは不可抗力通知を発行し、契約上の義務の免除を求めたとされる。
これが確認されれば、人工知能関連資産の売却が株式にとどまらず、こうしたプロジェクトの拡大に向けたプライベートファイナンスにも及んでいるという、新たな懸念が高まることになる。
この競売では、買い手がどれほどの金額を支払う意思があるのかが試される。$CYBER
{future}(CYBERUSDT)
{future}(AKEUSDT)
{future}(UAIUSDT)
#news #walleye #EarningsSeason #AnthropicIPOValuationDoubts #Nasdaq100Tumbles6%
🔽170億ドル規模のヘッジファンドが再編する一方、謎の売り手がデータセンター向け融資5億ドルを売却に出す。
Walleye Capitalは、10月に5.9%の損失を計上し、2020年3月以降で最悪の月となったことを受け、リーダーシップチームと株式投資チームを縮小し、投資家に資本を返還する準備を進めている。$AKE
Bloombergは先日、匿名の売り手がデータセンター向け融資5億ドルを売却に出していると報じた。
今、この売り手はWalleye自身ではないかとの憶測が強まっている。$UAI
同社の融資ポートフォリオには、ニューメキシコ州のStargateプロジェクトに関連する2,500万ドルの融資が含まれている。Oracleは不可抗力通知を発行し、契約上の義務の免除を求めたとされる。
これが確認されれば、人工知能関連資産の売却が株式にとどまらず、こうしたプロジェクトの拡大に向けたプライベートファイナンスにも及んでいるという、新たな懸念が高まることになる。
この競売では、買い手がどれほどの金額を支払う意思があるのかが試される。$CYBER
#news #walleye #EarningsSeason #AnthropicIPOValuationDoubts #Nasdaq100Tumbles6%
Walleye Capitalは、10月に5.9%の損失を計上し、2020年3月以降で最悪の月となったことを受け、リーダーシップチームと株式投資チームを縮小し、投資家に資本を返還する準備を進めている。$AKE
Bloombergは先日、匿名の売り手がデータセンター向け融資5億ドルを売却に出していると報じた。
今、この売り手はWalleye自身ではないかとの憶測が強まっている。$UAI
同社の融資ポートフォリオには、ニューメキシコ州のStargateプロジェクトに関連する2,500万ドルの融資が含まれている。Oracleは不可抗力通知を発行し、契約上の義務の免除を求めたとされる。
これが確認されれば、人工知能関連資産の売却が株式にとどまらず、こうしたプロジェクトの拡大に向けたプライベートファイナンスにも及んでいるという、新たな懸念が高まることになる。
この競売では、買い手がどれほどの金額を支払う意思があるのかが試される。$CYBER
#news #walleye #EarningsSeason #AnthropicIPOValuationDoubts #Nasdaq100Tumbles6%

115

·
--
ブリッシュ
翻訳参照
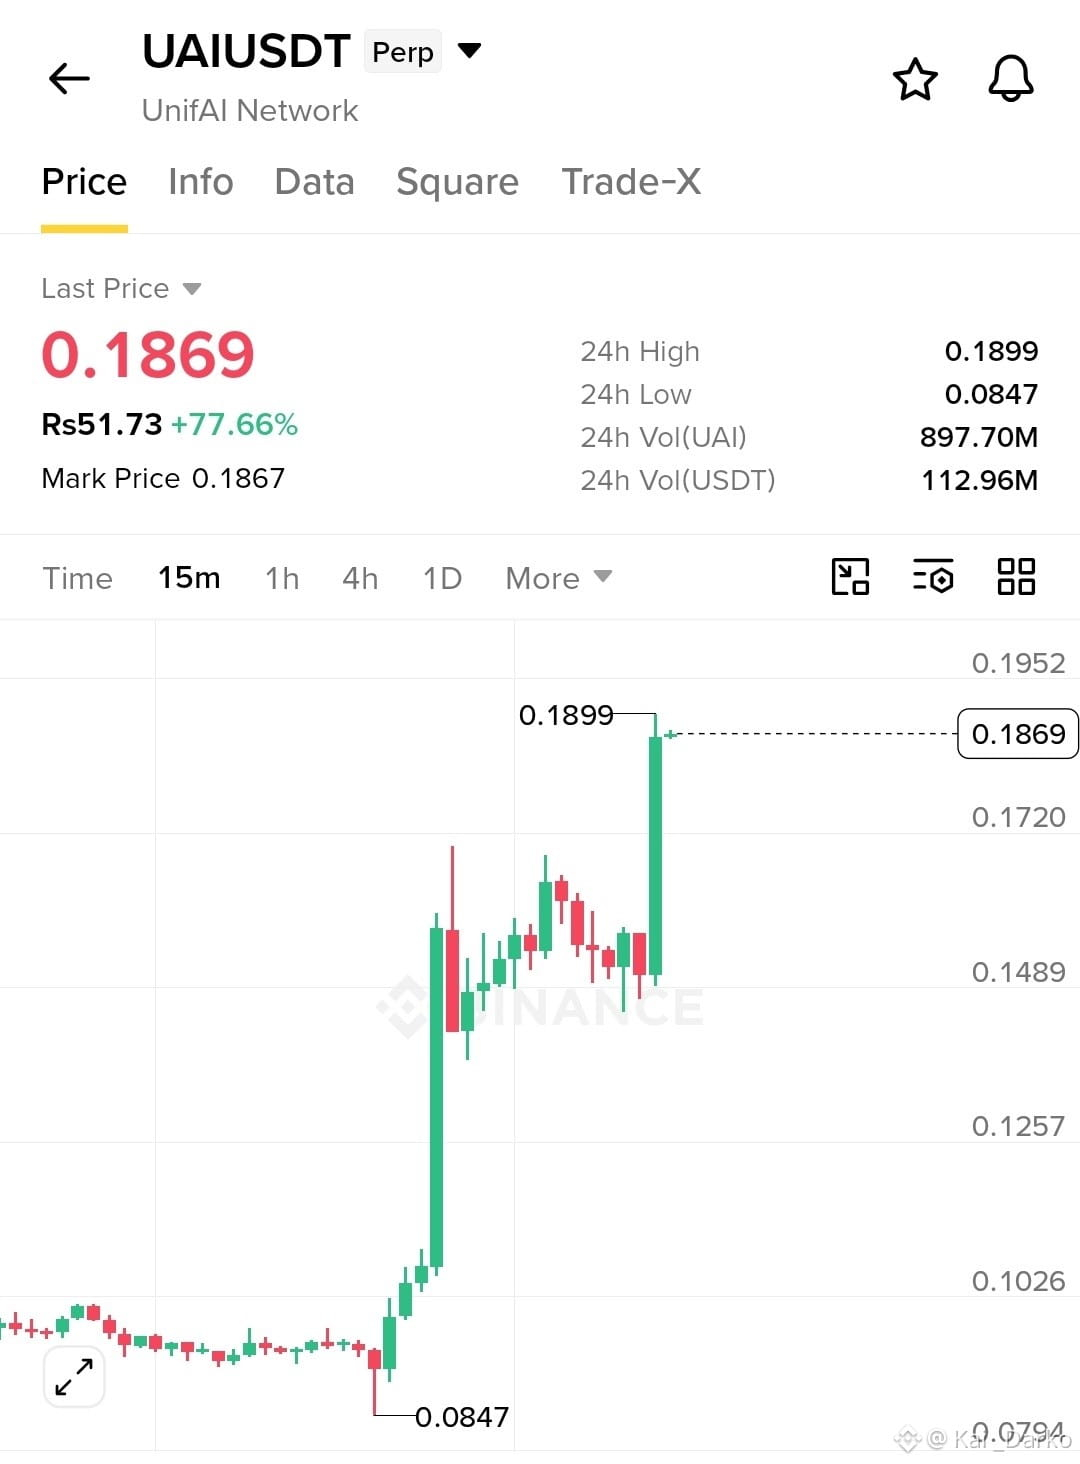
$UAI USDT — Explosive Bullish Breakout! 🚀
$UAIUSDT is showing impressive bullish strength, currently trading around $0.1869, up approximately 77.66% in 24 hours. What caught my attention is the strong recovery from the $0.0847 low, followed by consolidation around $0.145–$0.160 and a powerful breakout toward $0.1899. Buyers have clearly taken control, but chasing this massive candle is not my preferred strategy.
Market Structure & Key Levels 📈
The 15-minute chart shows strong upward momentum, with price breaking above its previous consolidation range. Former resistance around $0.1720 is now an important level to watch. Immediate resistance stands at $0.1899, followed by $0.1952. Support is around $0.1720, while $0.1489 is the deeper structural support.
Trading Plan 🎯
I would prefer waiting for a confirmed pullback rather than entering at the current high.
Entry Zone: $0.1720–$0.1780, after bullish confirmation. Stop Loss: $0.1640, below the potential breakout-retest area. TP1: $0.1899 TP2: $0.1952 TP3: Not confirmed by the visible chart; avoid inventing an extended target.
Technical Outlook & Risk Management
The breakout and strong green candle support the bullish case. However, EMA, RSI, MACD and volume readings are not visible, so their confirmation cannot be established. A Fibonacci pullback toward approximately $0.150 could become relevant if selling pressure increases.
If buyers defend $0.1720, another attempt toward the recent high is possible. A sustained move below this level would weaken the setup. Keep position size controlled and protect capital.
My Take: The momentum is impressive, but confirmation matters more than excitement. Are you waiting for the retest or expecting another breakout? 👀
{future}(UAIUSDT)
#BinanceReopensWithdrawalsForMoreAssets #AnthropicIPOValuationDoubts
$UAI USDT — Explosive Bullish Breakout! 🚀
$UAIUSDT is showing impressive bullish strength, currently trading around $0.1869, up approximately 77.66% in 24 hours. What caught my attention is the strong recovery from the $0.0847 low, followed by consolidation around $0.145–$0.160 and a powerful breakout toward $0.1899. Buyers have clearly taken control, but chasing this massive candle is not my preferred strategy.
Market Structure & Key Levels 📈
The 15-minute chart shows strong upward momentum, with price breaking above its previous consolidation range. Former resistance around $0.1720 is now an important level to watch. Immediate resistance stands at $0.1899, followed by $0.1952. Support is around $0.1720, while $0.1489 is the deeper structural support.
Trading Plan 🎯
I would prefer waiting for a confirmed pullback rather than entering at the current high.
Entry Zone: $0.1720–$0.1780, after bullish confirmation. Stop Loss: $0.1640, below the potential breakout-retest area. TP1: $0.1899 TP2: $0.1952 TP3: Not confirmed by the visible chart; avoid inventing an extended target.
Technical Outlook & Risk Management
The breakout and strong green candle support the bullish case. However, EMA, RSI, MACD and volume readings are not visible, so their confirmation cannot be established. A Fibonacci pullback toward approximately $0.150 could become relevant if selling pressure increases.
If buyers defend $0.1720, another attempt toward the recent high is possible. A sustained move below this level would weaken the setup. Keep position size controlled and protect capital.
My Take: The momentum is impressive, but confirmation matters more than excitement. Are you waiting for the retest or expecting another breakout? 👀
#BinanceReopensWithdrawalsForMoreAssets #AnthropicIPOValuationDoubts
$UAIUSDT is showing impressive bullish strength, currently trading around $0.1869, up approximately 77.66% in 24 hours. What caught my attention is the strong recovery from the $0.0847 low, followed by consolidation around $0.145–$0.160 and a powerful breakout toward $0.1899. Buyers have clearly taken control, but chasing this massive candle is not my preferred strategy.
Market Structure & Key Levels 📈
The 15-minute chart shows strong upward momentum, with price breaking above its previous consolidation range. Former resistance around $0.1720 is now an important level to watch. Immediate resistance stands at $0.1899, followed by $0.1952. Support is around $0.1720, while $0.1489 is the deeper structural support.
Trading Plan 🎯
I would prefer waiting for a confirmed pullback rather than entering at the current high.
Entry Zone: $0.1720–$0.1780, after bullish confirmation. Stop Loss: $0.1640, below the potential breakout-retest area. TP1: $0.1899 TP2: $0.1952 TP3: Not confirmed by the visible chart; avoid inventing an extended target.
Technical Outlook & Risk Management
The breakout and strong green candle support the bullish case. However, EMA, RSI, MACD and volume readings are not visible, so their confirmation cannot be established. A Fibonacci pullback toward approximately $0.150 could become relevant if selling pressure increases.
If buyers defend $0.1720, another attempt toward the recent high is possible. A sustained move below this level would weaken the setup. Keep position size controlled and protect capital.
My Take: The momentum is impressive, but confirmation matters more than excitement. Are you waiting for the retest or expecting another breakout? 👀
#BinanceReopensWithdrawalsForMoreAssets #AnthropicIPOValuationDoubts
267
記事
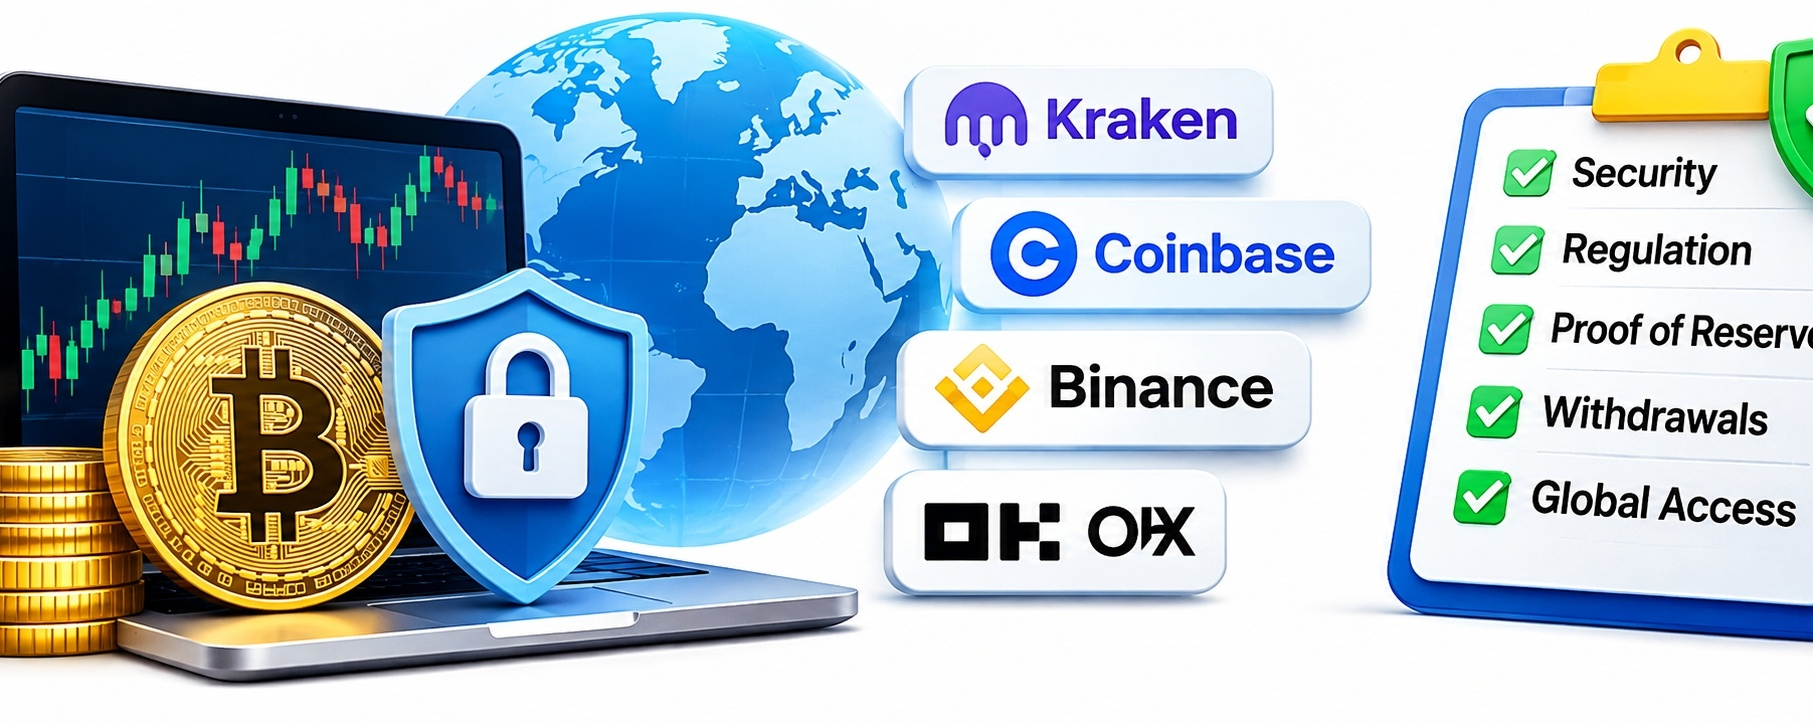
あなたの暗号資産取引所は今日安全に見えるかもしれません。しかし、資金を引き出す必要が生じたらどうなるでしょうか?詳しくプロジェクト:海外ユーザーにとって最も安全で信頼できる暗号資産取引所は?
暗号資産取引所を選ぶことは、ビットコインを買ったりアルトコインを取引したりする場所を探すだけではありません。自分のお金を預ける相手として、どの会社を信頼できるかを決めることです。正直なところ、この決断は多くの人が考えている以上に、慎重に検討する価値があります。
暗号資産業界では、痛ましい破綻がいくつも起きてきました。FTXはかつて市場最大級の知名度を誇る企業の一つでしたが、その崩壊は、取引所が顧客資産を守れなかった場合に、いかに急速に事態が悪化するかを投資家に示しました。画面に残高が表示されていても、自分の資金を完全に管理できているとは限らないことを、何千人もの人々が思い知りました。
あなたの暗号資産取引所は今日安全に見えるかもしれません。しかし、資金を引き出す必要が生じたらどうなるでしょうか?詳しく
プロジェクト:海外ユーザーにとって最も安全で信頼できる暗号資産取引所は?
暗号資産取引所を選ぶことは、ビットコインを買ったりアルトコインを取引したりする場所を探すだけではありません。自分のお金を預ける相手として、どの会社を信頼できるかを決めることです。正直なところ、この決断は多くの人が考えている以上に、慎重に検討する価値があります。
暗号資産業界では、痛ましい破綻がいくつも起きてきました。FTXはかつて市場最大級の知名度を誇る企業の一つでしたが、その崩壊は、取引所が顧客資産を守れなかった場合に、いかに急速に事態が悪化するかを投資家に示しました。画面に残高が表示されていても、自分の資金を完全に管理できているとは限らないことを、何千人もの人々が思い知りました。
暗号資産取引所を選ぶことは、ビットコインを買ったりアルトコインを取引したりする場所を探すだけではありません。自分のお金を預ける相手として、どの会社を信頼できるかを決めることです。正直なところ、この決断は多くの人が考えている以上に、慎重に検討する価値があります。
暗号資産業界では、痛ましい破綻がいくつも起きてきました。FTXはかつて市場最大級の知名度を誇る企業の一つでしたが、その崩壊は、取引所が顧客資産を守れなかった場合に、いかに急速に事態が悪化するかを投資家に示しました。画面に残高が表示されていても、自分の資金を完全に管理できているとは限らないことを、何千人もの人々が思い知りました。
82
ログインして、さらにコンテンツを読む
厳選トピックで世界の暗号資産トレーダーの仲間入り
⚡️ 暗号資産に関する最新かつ有益な情報が見つかります。
💬 世界最大の暗号資産取引所から信頼されています。
👍 認証を受けたクリエイターから、有益なインサイトを得られます。
メール / 電話番号
トレンドトピック
1
#BinanceReopensWithdrawalsForMoreAssets
閲覧回数 1.1M
5,577人が討論中
2
#$2TWipedOut,HedgeFundsFaceLiquidation
閲覧回数 0
0人が討論中
3
#AnthropicIPOValuationDoubts
閲覧回数 9,560
287人が討論中
4
#ChainalysisBreachExposedPasswordHashesAndLiveTokens
閲覧回数 0
1人が討論中
5
#UkraineCentralBankOpposesCurrentCryptoAssetBill
閲覧回数 311
22人が討論中
6
#CoreScientificExpectsToExitBitcoinMiningByYearEnd2026
閲覧回数 141
7人が討論中
7
#USStocksSlipandCryptoMarketUnderBroadPressure
閲覧回数 109,862
714人が討論中
8
#USStocksSufferSteepestRoutSince2020
閲覧回数 21,606
149人が討論中
9
#StrategySTRCResumesIssuanceAfterOver170Days
閲覧回数 51,561
686人が討論中
10
#Nasdaq100Tumbles6%
閲覧回数 29,476
189人が討論中