
#nvdausdt
nvdausdt
閲覧回数 8,039
166人が討論中
注目
最新

$NVDA.US 本日 — 2026年9月17日 — 最新:
1. 価格決定力のシグナル — ネビウスがGPUレンタル価格を引き上げ
ネオクラウド・ネビウス(NBIS)は本日、10月1日から $NVDA.US $ のH100、H200、B200、B300 のオンデマンド料金を17〜21%引き上げるほか、CPUは+25%、メモリは+41%とすると発表した——3か月で2度目の値上げ。競合のコアウィーブも、より高い価格での契約に署名していると述べている。市場では、これを「供給を上回るNvidia向け需要」と解釈している。特に、新世代が出ると旧世代の価格は通常下がるが、ここでは旧世代も新世代もともに43a719ea
*2. アンソスロピックIPOの錨 — 最大100億ドル*
ロイター通信 — Nvidiaは、時価総額2兆ドルの評価で、最大100億ドルを拠出してアンソスロピックのIPOを支える交渉を行っている。調達は1000億ドル規模に達する可能性もあり、これが史上最大のIPOとなる。これは、2025年11月にMicrosoft-Azureの300億ドル取引の一環として、Nvidiaがすでに拠出を約束していた100億ドルに加えての話。両社はいずれも現時点でまだ確認していない。
3. エンタープライズARの案件
Snapは昨日、提携を発表——Nvidiaが同社の新しい2,195ドルのSpecs ARグラスのためにAIを提供する。作業者の視覚環境を解釈し、Salesforce AgentforceやAWSと連携しながら企業データを取得する。
4. CEOが二段構え
ジェンセン・フアン氏は本日、「Nvidiaは来年、今年の2倍の数のチップを販売する」と述べ、AI安全性が最重要だと語った。Q2 FY27の大幅な決算(決算超え)を受けた内容:売上96.2Bドル(前年比+106%)、データセンター89Bドル(前年比+117%)、粗利益率75% 0a1c
株価の背景:
本日、213.90ドルで寄り付き、12か月高値である236.54ドルに近い。前四半期は決算が良好だったにもかかわらず、上昇は+1.5%にとどまった。UBSは「見積もりが誤っている」としており、投資回収はキャッシュフローの86%に相当すると見ている。買い評価で平均目標株価は324.34ドル。さらに、承認済みの自社株買いは800億ドル、直近の承認分として残っているのは990億ドル 4822
#NVDA股价大涨 #NVDA/SOL #NVDAUSDT
$NVDA.US 本日 — 2026年9月17日 — 最新:
1. 価格決定力のシグナル — ネビウスがGPUレンタル価格を引き上げ
ネオクラウド・ネビウス(NBIS)は本日、10月1日から $NVDA.US $ のH100、H200、B200、B300 のオンデマンド料金を17〜21%引き上げるほか、CPUは+25%、メモリは+41%とすると発表した——3か月で2度目の値上げ。競合のコアウィーブも、より高い価格での契約に署名していると述べている。市場では、これを「供給を上回るNvidia向け需要」と解釈している。特に、新世代が出ると旧世代の価格は通常下がるが、ここでは旧世代も新世代もともに43a719ea
*2. アンソスロピックIPOの錨 — 最大100億ドル*
ロイター通信 — Nvidiaは、時価総額2兆ドルの評価で、最大100億ドルを拠出してアンソスロピックのIPOを支える交渉を行っている。調達は1000億ドル規模に達する可能性もあり、これが史上最大のIPOとなる。これは、2025年11月にMicrosoft-Azureの300億ドル取引の一環として、Nvidiaがすでに拠出を約束していた100億ドルに加えての話。両社はいずれも現時点でまだ確認していない。
3. エンタープライズARの案件
Snapは昨日、提携を発表——Nvidiaが同社の新しい2,195ドルのSpecs ARグラスのためにAIを提供する。作業者の視覚環境を解釈し、Salesforce AgentforceやAWSと連携しながら企業データを取得する。
4. CEOが二段構え
ジェンセン・フアン氏は本日、「Nvidiaは来年、今年の2倍の数のチップを販売する」と述べ、AI安全性が最重要だと語った。Q2 FY27の大幅な決算(決算超え)を受けた内容:売上96.2Bドル(前年比+106%)、データセンター89Bドル(前年比+117%)、粗利益率75% 0a1c
株価の背景:
本日、213.90ドルで寄り付き、12か月高値である236.54ドルに近い。前四半期は決算が良好だったにもかかわらず、上昇は+1.5%にとどまった。UBSは「見積もりが誤っている」としており、投資回収はキャッシュフローの86%に相当すると見ている。買い評価で平均目標株価は324.34ドル。さらに、承認済みの自社株買いは800億ドル、直近の承認分として残っているのは990億ドル 4822
#NVDA股价大涨 #NVDA/SOL #NVDAUSDT
1. 価格決定力のシグナル — ネビウスがGPUレンタル価格を引き上げ
ネオクラウド・ネビウス(NBIS)は本日、10月1日から $NVDA.US $ のH100、H200、B200、B300 のオンデマンド料金を17〜21%引き上げるほか、CPUは+25%、メモリは+41%とすると発表した——3か月で2度目の値上げ。競合のコアウィーブも、より高い価格での契約に署名していると述べている。市場では、これを「供給を上回るNvidia向け需要」と解釈している。特に、新世代が出ると旧世代の価格は通常下がるが、ここでは旧世代も新世代もともに43a719ea
*2. アンソスロピックIPOの錨 — 最大100億ドル*
ロイター通信 — Nvidiaは、時価総額2兆ドルの評価で、最大100億ドルを拠出してアンソスロピックのIPOを支える交渉を行っている。調達は1000億ドル規模に達する可能性もあり、これが史上最大のIPOとなる。これは、2025年11月にMicrosoft-Azureの300億ドル取引の一環として、Nvidiaがすでに拠出を約束していた100億ドルに加えての話。両社はいずれも現時点でまだ確認していない。
3. エンタープライズARの案件
Snapは昨日、提携を発表——Nvidiaが同社の新しい2,195ドルのSpecs ARグラスのためにAIを提供する。作業者の視覚環境を解釈し、Salesforce AgentforceやAWSと連携しながら企業データを取得する。
4. CEOが二段構え
ジェンセン・フアン氏は本日、「Nvidiaは来年、今年の2倍の数のチップを販売する」と述べ、AI安全性が最重要だと語った。Q2 FY27の大幅な決算(決算超え)を受けた内容:売上96.2Bドル(前年比+106%)、データセンター89Bドル(前年比+117%)、粗利益率75% 0a1c
株価の背景:
本日、213.90ドルで寄り付き、12か月高値である236.54ドルに近い。前四半期は決算が良好だったにもかかわらず、上昇は+1.5%にとどまった。UBSは「見積もりが誤っている」としており、投資回収はキャッシュフローの86%に相当すると見ている。買い評価で平均目標株価は324.34ドル。さらに、承認済みの自社株買いは800億ドル、直近の承認分として残っているのは990億ドル 4822
#NVDA股价大涨 #NVDA/SOL #NVDAUSDT
161

·
--
$NVDA.US
{stock_us}(NVDA.US)
🌟 Nvidia(NVDA)で未来を切り拓こう:テック企業の投資ポテンシャル 🌟
Nvidia(NVDA)は単なる株ではありません。次のテクノロジー革新の波への入口です!AI革命や没入型ゲーム体験を支えるだけでなく、データセンターや自動運転車の進歩をも後押しするなど、NVDAの最先端GPUがすべての中心にあります。これにより、高成長分野への投資機会を探す投資家にとって魅力的な対象となっています。
NVDAが注目される理由:
AIの覇者:Nvidiaは、AI開発と導入に欠かせない必須ハードウェアを提供する分野で、揺るぎないリーダーです。
ゲームの強豪:世界中のゲーマー向けに、高度なグラフィックス技術で常に限界を押し広げています。
データセンターの成長:高性能チップは、現代のクラウドコンピューティングやデータ処理に不可欠です。
堅調な実績:NVDAは目覚ましい成長を見せており、大きな投資家の関心を集めています。
最新の決算発表や戦略的提携にも注目してみてください。未来は非常に明るいでしょう!
#NVDAUSDT #AI #futurestraders #investmentnews #GrowthStocks
$NVDA.US
🌟 Nvidia(NVDA)で未来を切り拓こう:テック企業の投資ポテンシャル 🌟
Nvidia(NVDA)は単なる株ではありません。次のテクノロジー革新の波への入口です!AI革命や没入型ゲーム体験を支えるだけでなく、データセンターや自動運転車の進歩をも後押しするなど、NVDAの最先端GPUがすべての中心にあります。これにより、高成長分野への投資機会を探す投資家にとって魅力的な対象となっています。
NVDAが注目される理由:
AIの覇者:Nvidiaは、AI開発と導入に欠かせない必須ハードウェアを提供する分野で、揺るぎないリーダーです。
ゲームの強豪:世界中のゲーマー向けに、高度なグラフィックス技術で常に限界を押し広げています。
データセンターの成長:高性能チップは、現代のクラウドコンピューティングやデータ処理に不可欠です。
堅調な実績:NVDAは目覚ましい成長を見せており、大きな投資家の関心を集めています。
最新の決算発表や戦略的提携にも注目してみてください。未来は非常に明るいでしょう!
#NVDAUSDT #AI #futurestraders #investmentnews #GrowthStocks
🌟 Nvidia(NVDA)で未来を切り拓こう:テック企業の投資ポテンシャル 🌟
Nvidia(NVDA)は単なる株ではありません。次のテクノロジー革新の波への入口です!AI革命や没入型ゲーム体験を支えるだけでなく、データセンターや自動運転車の進歩をも後押しするなど、NVDAの最先端GPUがすべての中心にあります。これにより、高成長分野への投資機会を探す投資家にとって魅力的な対象となっています。
NVDAが注目される理由:
AIの覇者:Nvidiaは、AI開発と導入に欠かせない必須ハードウェアを提供する分野で、揺るぎないリーダーです。
ゲームの強豪:世界中のゲーマー向けに、高度なグラフィックス技術で常に限界を押し広げています。
データセンターの成長:高性能チップは、現代のクラウドコンピューティングやデータ処理に不可欠です。
堅調な実績:NVDAは目覚ましい成長を見せており、大きな投資家の関心を集めています。
最新の決算発表や戦略的提携にも注目してみてください。未来は非常に明るいでしょう!
#NVDAUSDT #AI #futurestraders #investmentnews #GrowthStocks
121

翻訳参照
#NVDAUSDT
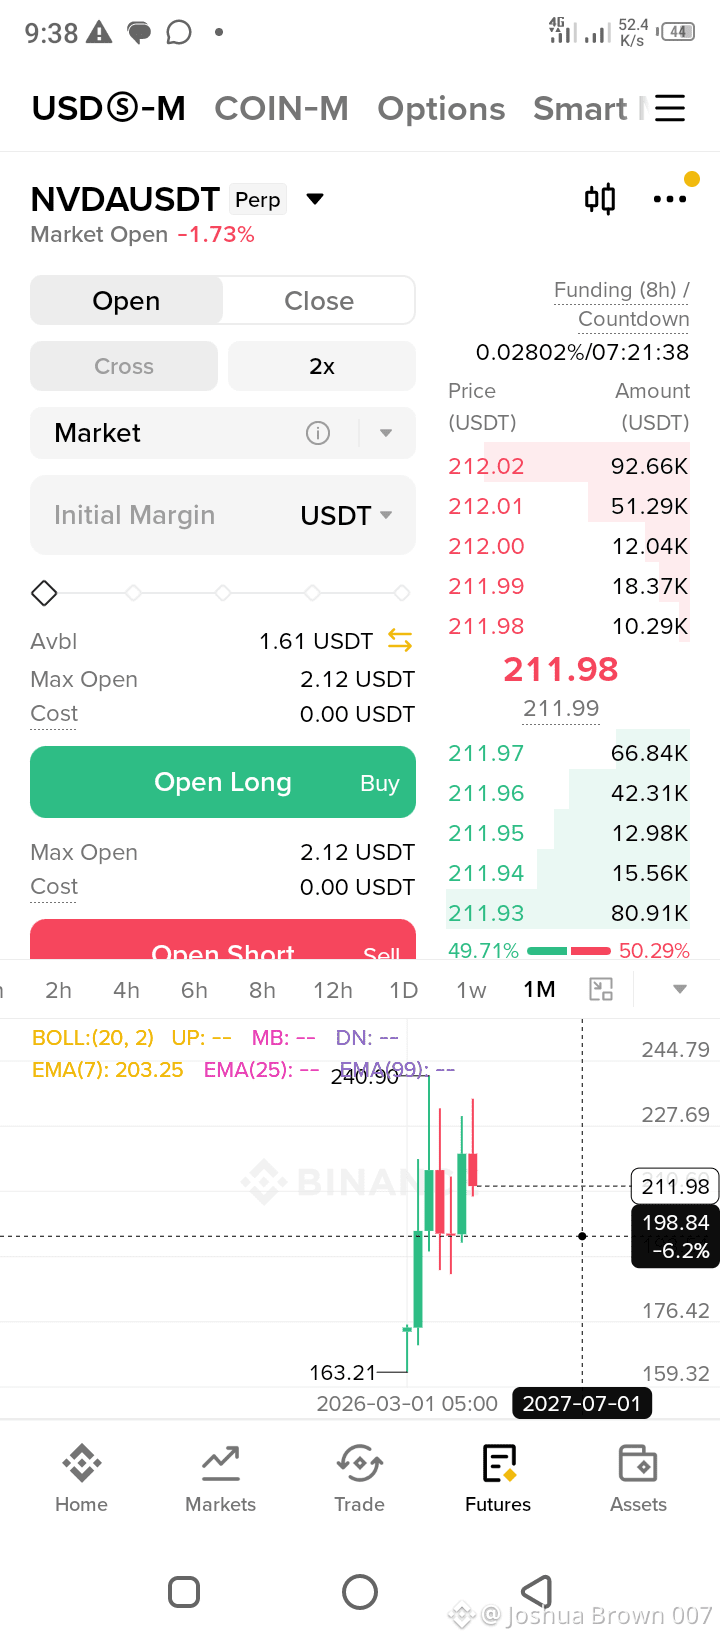
Hi Traders lets some discuss on monthly $NVDAB movement ,
Funding Rate (8h): 0.02802% (Positive, longs paying shorts)
Long/Short Ratio: 49.71% Long / 50.29% Short
The monthly chart shows a massive V shaped recovery from the 163.21 low, followed by a sharp rejection near the 240-244 level. The current price action represents a consolidation phase after the initial recovery impulse.
Order Flow👉 Watch the 212.00 level closely. A break with volume could trigger a short squeeze toward 220.
Risk Warning👉 Synthetic assets can have unique liquidity dynamics. Use strict stop losses.
$NVDA
{future}(NVDAUSDT)
#NVDAUSDT
Hi Traders lets some discuss on monthly $NVDAB movement ,
Funding Rate (8h): 0.02802% (Positive, longs paying shorts)
Long/Short Ratio: 49.71% Long / 50.29% Short
The monthly chart shows a massive V shaped recovery from the 163.21 low, followed by a sharp rejection near the 240-244 level. The current price action represents a consolidation phase after the initial recovery impulse.
Order Flow👉 Watch the 212.00 level closely. A break with volume could trigger a short squeeze toward 220.
Risk Warning👉 Synthetic assets can have unique liquidity dynamics. Use strict stop losses.
$NVDA
Hi Traders lets some discuss on monthly $NVDAB movement ,
Funding Rate (8h): 0.02802% (Positive, longs paying shorts)
Long/Short Ratio: 49.71% Long / 50.29% Short
The monthly chart shows a massive V shaped recovery from the 163.21 low, followed by a sharp rejection near the 240-244 level. The current price action represents a consolidation phase after the initial recovery impulse.
Order Flow👉 Watch the 212.00 level closely. A break with volume could trigger a short squeeze toward 220.
Risk Warning👉 Synthetic assets can have unique liquidity dynamics. Use strict stop losses.
$NVDA
53

·
--
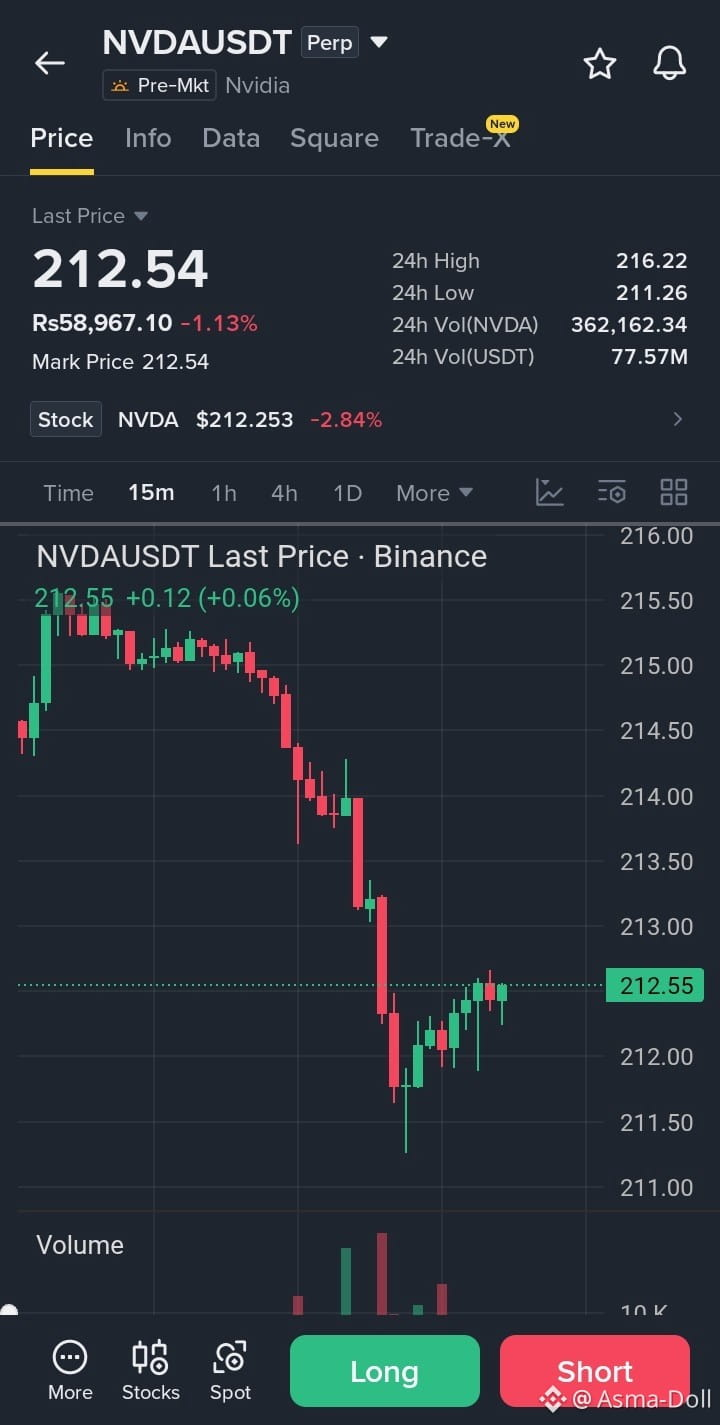
$NVDA /USDT — SHORT 📉
エントリー: $212.50 – $214.00
損切り(SL): $216.80
TP1: $210.50
TP2: $208.00
TP3: $205.50
ここで取引: $NVDA
{future}(NVDAUSDT)
分析:
NVDAの株価が約2〜3%下落している一方で、寄り付き前の強い弱さが見られます。さらに、Perpは$211のサポートゾーン付近で推移しています。
$211がブレイク → 下方向の勢いが加速し得ます。
レジスタンスは$214〜$216付近。そこからのリジェクトはショートのセットアップに有利です。
確認:
$211.00を明確に下抜け + リテストでのリジェクト = より強いショート確認。
⚠️ 低レバレッジを使用し、リスク管理を徹底してください。寄り付き前/Perpの価格は変動が大きい場合があります。
#NVDA #NVDAUSDT #NVIDIA #CryptoTrading #ShortSignal
$NVDA /USDT — SHORT 📉
エントリー: $212.50 – $214.00
損切り(SL): $216.80
TP1: $210.50
TP2: $208.00
TP3: $205.50
ここで取引: $NVDA
分析:
NVDAの株価が約2〜3%下落している一方で、寄り付き前の強い弱さが見られます。さらに、Perpは$211のサポートゾーン付近で推移しています。
$211がブレイク → 下方向の勢いが加速し得ます。
レジスタンスは$214〜$216付近。そこからのリジェクトはショートのセットアップに有利です。
確認:
$211.00を明確に下抜け + リテストでのリジェクト = より強いショート確認。
⚠️ 低レバレッジを使用し、リスク管理を徹底してください。寄り付き前/Perpの価格は変動が大きい場合があります。
#NVDA #NVDAUSDT #NVIDIA #CryptoTrading #ShortSignal
エントリー: $212.50 – $214.00
損切り(SL): $216.80
TP1: $210.50
TP2: $208.00
TP3: $205.50
ここで取引: $NVDA
分析:
NVDAの株価が約2〜3%下落している一方で、寄り付き前の強い弱さが見られます。さらに、Perpは$211のサポートゾーン付近で推移しています。
$211がブレイク → 下方向の勢いが加速し得ます。
レジスタンスは$214〜$216付近。そこからのリジェクトはショートのセットアップに有利です。
確認:
$211.00を明確に下抜け + リテストでのリジェクト = より強いショート確認。
⚠️ 低レバレッジを使用し、リスク管理を徹底してください。寄り付き前/Perpの価格は変動が大きい場合があります。
#NVDA #NVDAUSDT #NVIDIA #CryptoTrading #ShortSignal
24

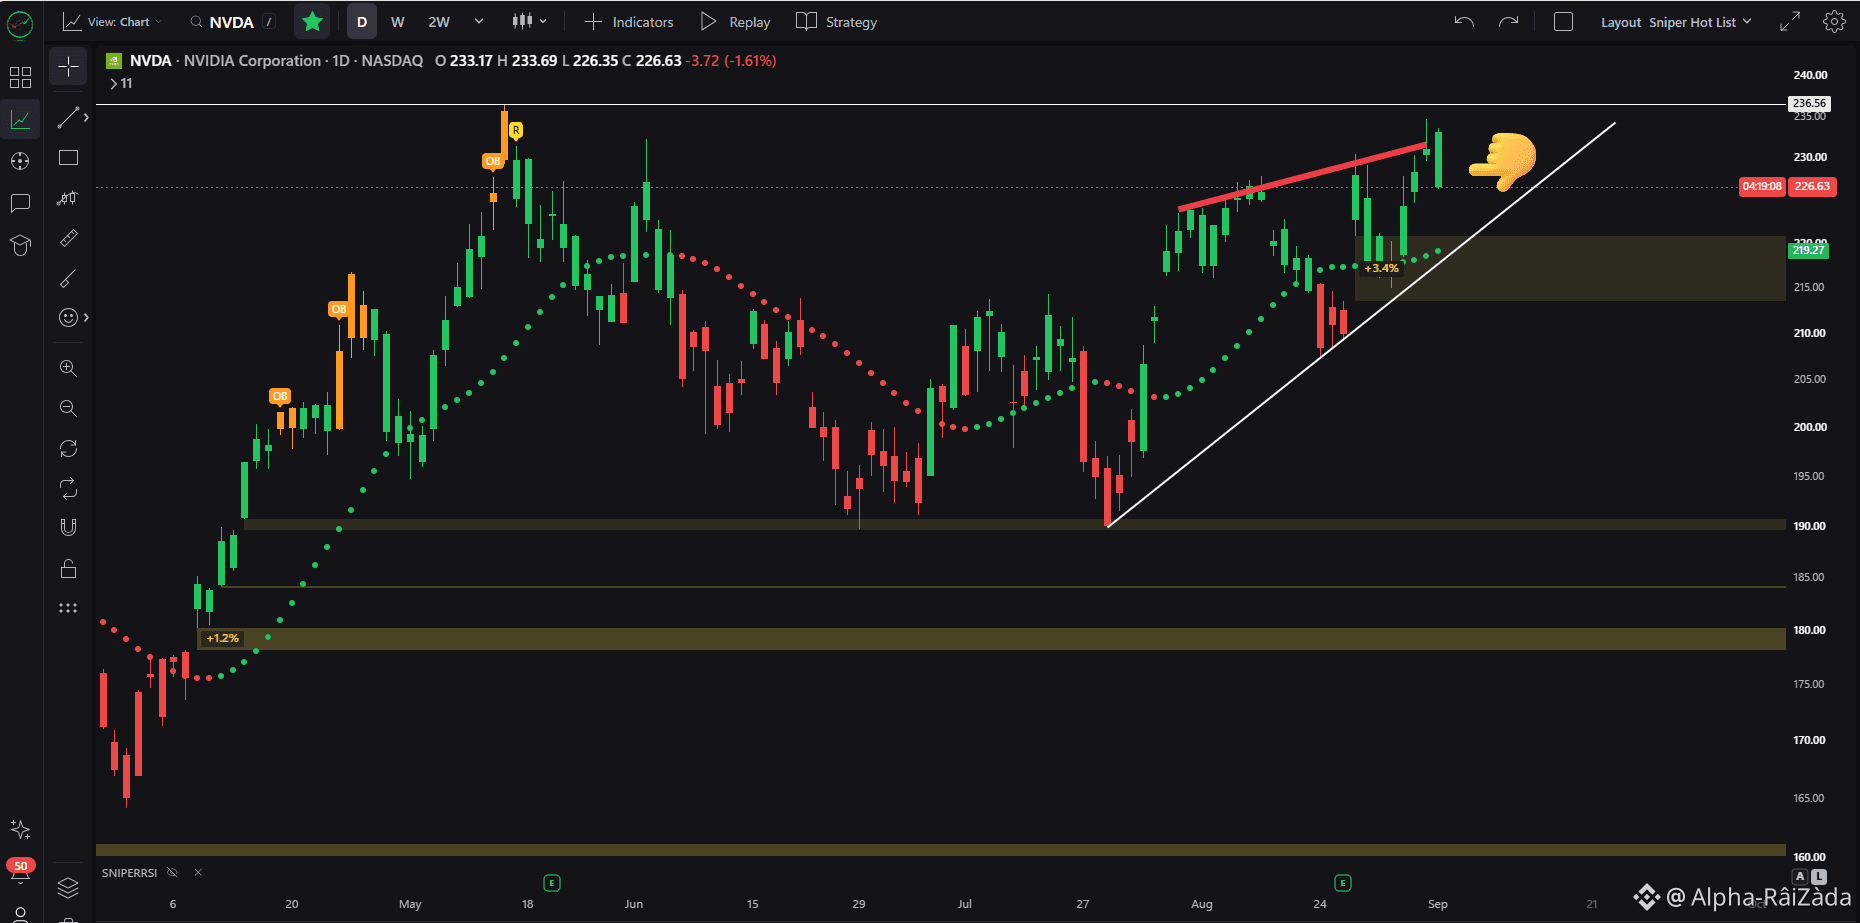
⚡ $NVDA
{future}(NVDAUSDT)
— 強気だが、警告サインに注意
日足のトレンドは依然として強気 📈 ─ しかし反転の兆しが出始めています:
• ❌ 新しいATH(過去最高値)を更新できず
• 📉 弱気のダイバージェンス
• 📐 上昇ウェッジ
• 🕯️ 弱気の包み足
⚠️ まだ反転は確定していません。重要なサポートが崩れるまでは、強気側に優位性があります。
👀 利益を確保するか、さらに上を狙って乗るか?
#NVDA #NVDAUSDT #CryptoTrading
⚡ $NVDA
— 強気だが、警告サインに注意
日足のトレンドは依然として強気 📈 ─ しかし反転の兆しが出始めています:
• ❌ 新しいATH(過去最高値)を更新できず
• 📉 弱気のダイバージェンス
• 📐 上昇ウェッジ
• 🕯️ 弱気の包み足
⚠️ まだ反転は確定していません。重要なサポートが崩れるまでは、強気側に優位性があります。
👀 利益を確保するか、さらに上を狙って乗るか?
#NVDA #NVDAUSDT #CryptoTrading
— 強気だが、警告サインに注意
日足のトレンドは依然として強気 📈 ─ しかし反転の兆しが出始めています:
• ❌ 新しいATH(過去最高値)を更新できず
• 📉 弱気のダイバージェンス
• 📐 上昇ウェッジ
• 🕯️ 弱気の包み足
⚠️ まだ反転は確定していません。重要なサポートが崩れるまでは、強気側に優位性があります。
👀 利益を確保するか、さらに上を狙って乗るか?
#NVDA #NVDAUSDT #CryptoTrading
57

·
--
弱気相場
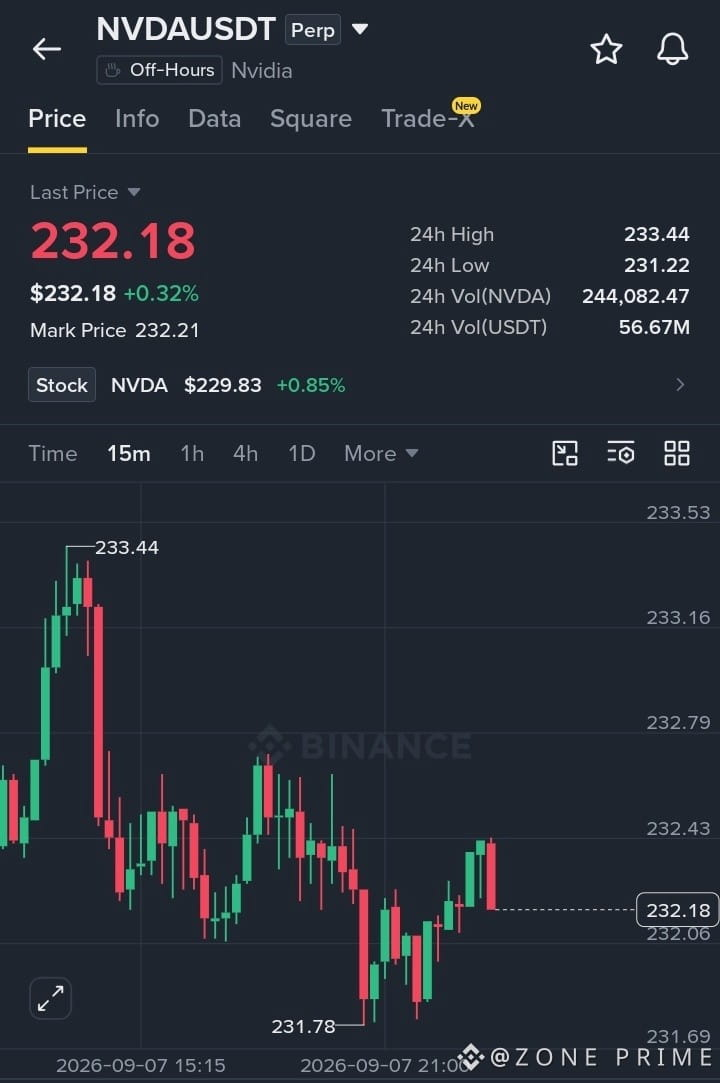
$NVDA /USDT — ショートのセットアップ 📉 💯 ✨
エントリー: 232.25–232.50
TP1: 232.05
TP2: 231.85
TP3: 231.70
ストップ: 232.80
直近の反発はレジスタンス上で維持できず、売り手にとって最近の231.78安値に向けて有利なセットアップとなりました。📉
#NVDA #NVDAUSDT #crypto #Write2Earn $NVDA
{future}(NVDAUSDT)
$NVDA /USDT — ショートのセットアップ 📉 💯 ✨
エントリー: 232.25–232.50
TP1: 232.05
TP2: 231.85
TP3: 231.70
ストップ: 232.80
直近の反発はレジスタンス上で維持できず、売り手にとって最近の231.78安値に向けて有利なセットアップとなりました。📉
#NVDA #NVDAUSDT #crypto #Write2Earn $NVDA
エントリー: 232.25–232.50
TP1: 232.05
TP2: 231.85
TP3: 231.70
ストップ: 232.80
直近の反発はレジスタンス上で維持できず、売り手にとって最近の231.78安値に向けて有利なセットアップとなりました。📉
#NVDA #NVDAUSDT #crypto #Write2Earn $NVDA
1
473

·
--
ブリッシュ
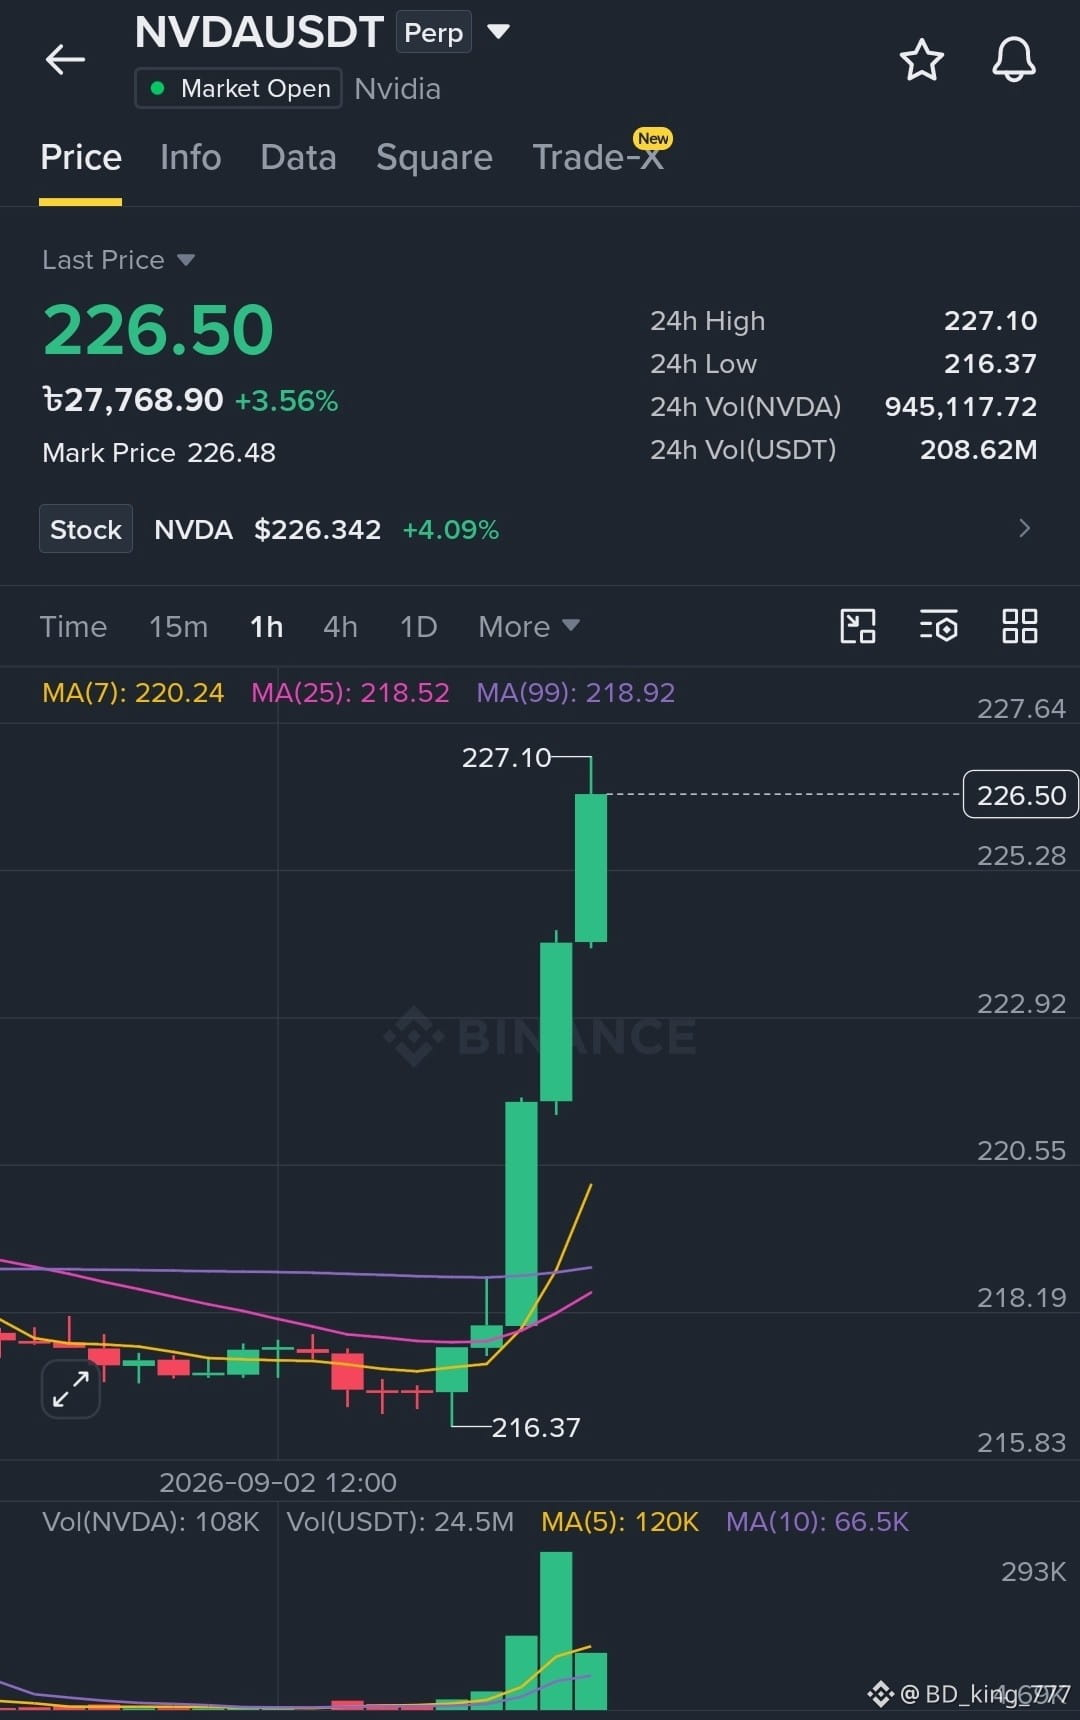
$NVDA - 強気
EP : $226.40 - $226.45
TP 1 : $226.70
TP 2 : $226.90
TP 3 : $227.10
SL : $226.20
今すぐここで取引..👇👇
{future}(NVDAUSDT)
$MAGMA $LA
#NVDAUSDT #Market_Update #Write2Earn #BinanceSquareFamily
$NVDA - 強気
EP : $226.40 - $226.45
TP 1 : $226.70
TP 2 : $226.90
TP 3 : $227.10
SL : $226.20
今すぐここで取引..👇👇
$MAGMA $LA
#NVDAUSDT #Market_Update #Write2Earn #BinanceSquareFamily
EP : $226.40 - $226.45
TP 1 : $226.70
TP 2 : $226.90
TP 3 : $227.10
SL : $226.20
今すぐここで取引..👇👇
$MAGMA $LA
#NVDAUSDT #Market_Update #Write2Earn #BinanceSquareFamily
2
129

·
--
ブリッシュ
NVDAは必ずしも見た目どおりではありません。
&NVIDIAの実株、#NVDA x/NVDAcのようなNVIDIAの株式トークン、そしてNVDAの名前を使った無関係な暗号トークンがあります。
購入前には、必ずコントラクト、流動性、保有者、そしてそのトークンを実際に裏付けているものを確認してください。
$NVDAB
#NVDAUSDT
#KuwaitAirDefensesRespondToIranianDroneAttacks
NVDAは必ずしも見た目どおりではありません。
&NVIDIAの実株、#NVDA x/NVDAcのようなNVIDIAの株式トークン、そしてNVDAの名前を使った無関係な暗号トークンがあります。
購入前には、必ずコントラクト、流動性、保有者、そしてそのトークンを実際に裏付けているものを確認してください。
$NVDAB
#NVDAUSDT
#KuwaitAirDefensesRespondToIranianDroneAttacks
&NVIDIAの実株、#NVDA x/NVDAcのようなNVIDIAの株式トークン、そしてNVDAの名前を使った無関係な暗号トークンがあります。
購入前には、必ずコントラクト、流動性、保有者、そしてそのトークンを実際に裏付けているものを確認してください。
$NVDAB
#NVDAUSDT
#KuwaitAirDefensesRespondToIranianDroneAttacks
121

記事
🔥 NVDAUSDTは意思決定ゾーンに位置している――「どんな価格でも買い」セットアップではない。⚡️🚀AIの物語性は依然として非常に強いが、チャートが今より重要な問いを投げかけている。サポートは維持されるのか、それとも後から入ってきた買い手が罠にかかるのか?
📊 私のNVDAUSDTの見立て:
NVIDIAはまた別の素晴らしい四半期を発表した。売上は962億ドル(前年比+106%)、データセンター売上は890億ドル(前年比+117%)。さらに、Q3の売上見通しは1080億ドル±2%とガイダンスした。
しかし、強固なファンダメンタルズでも短期のテクニカルリスクは消し去れない。
1️⃣ 重要な買いゾーン:$212–$215:
ここが、私はスポットの積み増し機会として最も注目したいエリアです。直近のテクニカル分析では、$214–$215あたりが重要なサポートで、50日SMAは約$213に位置しています。
🔥 NVDAUSDTは意思決定ゾーンに位置している――「どんな価格でも買い」セットアップではない。⚡️🚀
AIの物語性は依然として非常に強いが、チャートが今より重要な問いを投げかけている。サポートは維持されるのか、それとも後から入ってきた買い手が罠にかかるのか?
📊 私のNVDAUSDTの見立て:
NVIDIAはまた別の素晴らしい四半期を発表した。売上は962億ドル(前年比+106%)、データセンター売上は890億ドル(前年比+117%)。さらに、Q3の売上見通しは1080億ドル±2%とガイダンスした。
しかし、強固なファンダメンタルズでも短期のテクニカルリスクは消し去れない。
1️⃣ 重要な買いゾーン:$212–$215:
ここが、私はスポットの積み増し機会として最も注目したいエリアです。直近のテクニカル分析では、$214–$215あたりが重要なサポートで、50日SMAは約$213に位置しています。
📊 私のNVDAUSDTの見立て:
NVIDIAはまた別の素晴らしい四半期を発表した。売上は962億ドル(前年比+106%)、データセンター売上は890億ドル(前年比+117%)。さらに、Q3の売上見通しは1080億ドル±2%とガイダンスした。
しかし、強固なファンダメンタルズでも短期のテクニカルリスクは消し去れない。
1️⃣ 重要な買いゾーン:$212–$215:
ここが、私はスポットの積み増し機会として最も注目したいエリアです。直近のテクニカル分析では、$214–$215あたりが重要なサポートで、50日SMAは約$213に位置しています。
1
1
468

·
--
弱気相場
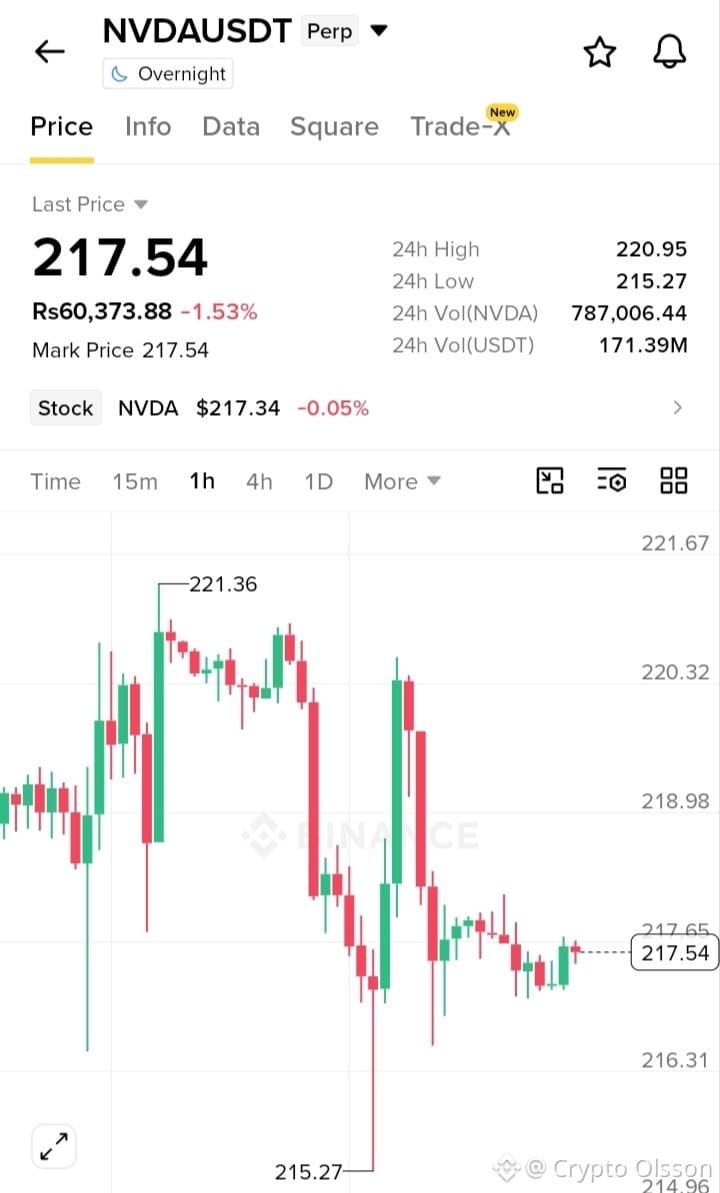
⚡ $NVDA /USDT — SHORT SETUP 📉
🔻 エントリーポイント: 217.50 – 218.50
TP1: 216.30
TP2: 215.30
TP3: 214.95
SL: 221.00
⚠️ 入る前に必ず確認してから行動してください。レバレッジは慎重に管理し、資金を守りましょう。
DYOR | NFA
#NVDA #NVDAUSDT #ShortSetup #BinanceSquare
$NVDA
{future}(NVDAUSDT)
⚡ $NVDA /USDT — SHORT SETUP 📉
🔻 エントリーポイント: 217.50 – 218.50
TP1: 216.30
TP2: 215.30
TP3: 214.95
SL: 221.00
⚠️ 入る前に必ず確認してから行動してください。レバレッジは慎重に管理し、資金を守りましょう。
DYOR | NFA
#NVDA #NVDAUSDT #ShortSetup #BinanceSquare
$NVDA
🔻 エントリーポイント: 217.50 – 218.50
TP1: 216.30
TP2: 215.30
TP3: 214.95
SL: 221.00
⚠️ 入る前に必ず確認してから行動してください。レバレッジは慎重に管理し、資金を守りましょう。
DYOR | NFA
#NVDA #NVDAUSDT #ShortSetup #BinanceSquare
$NVDA
1
83


·
--
弱気相場
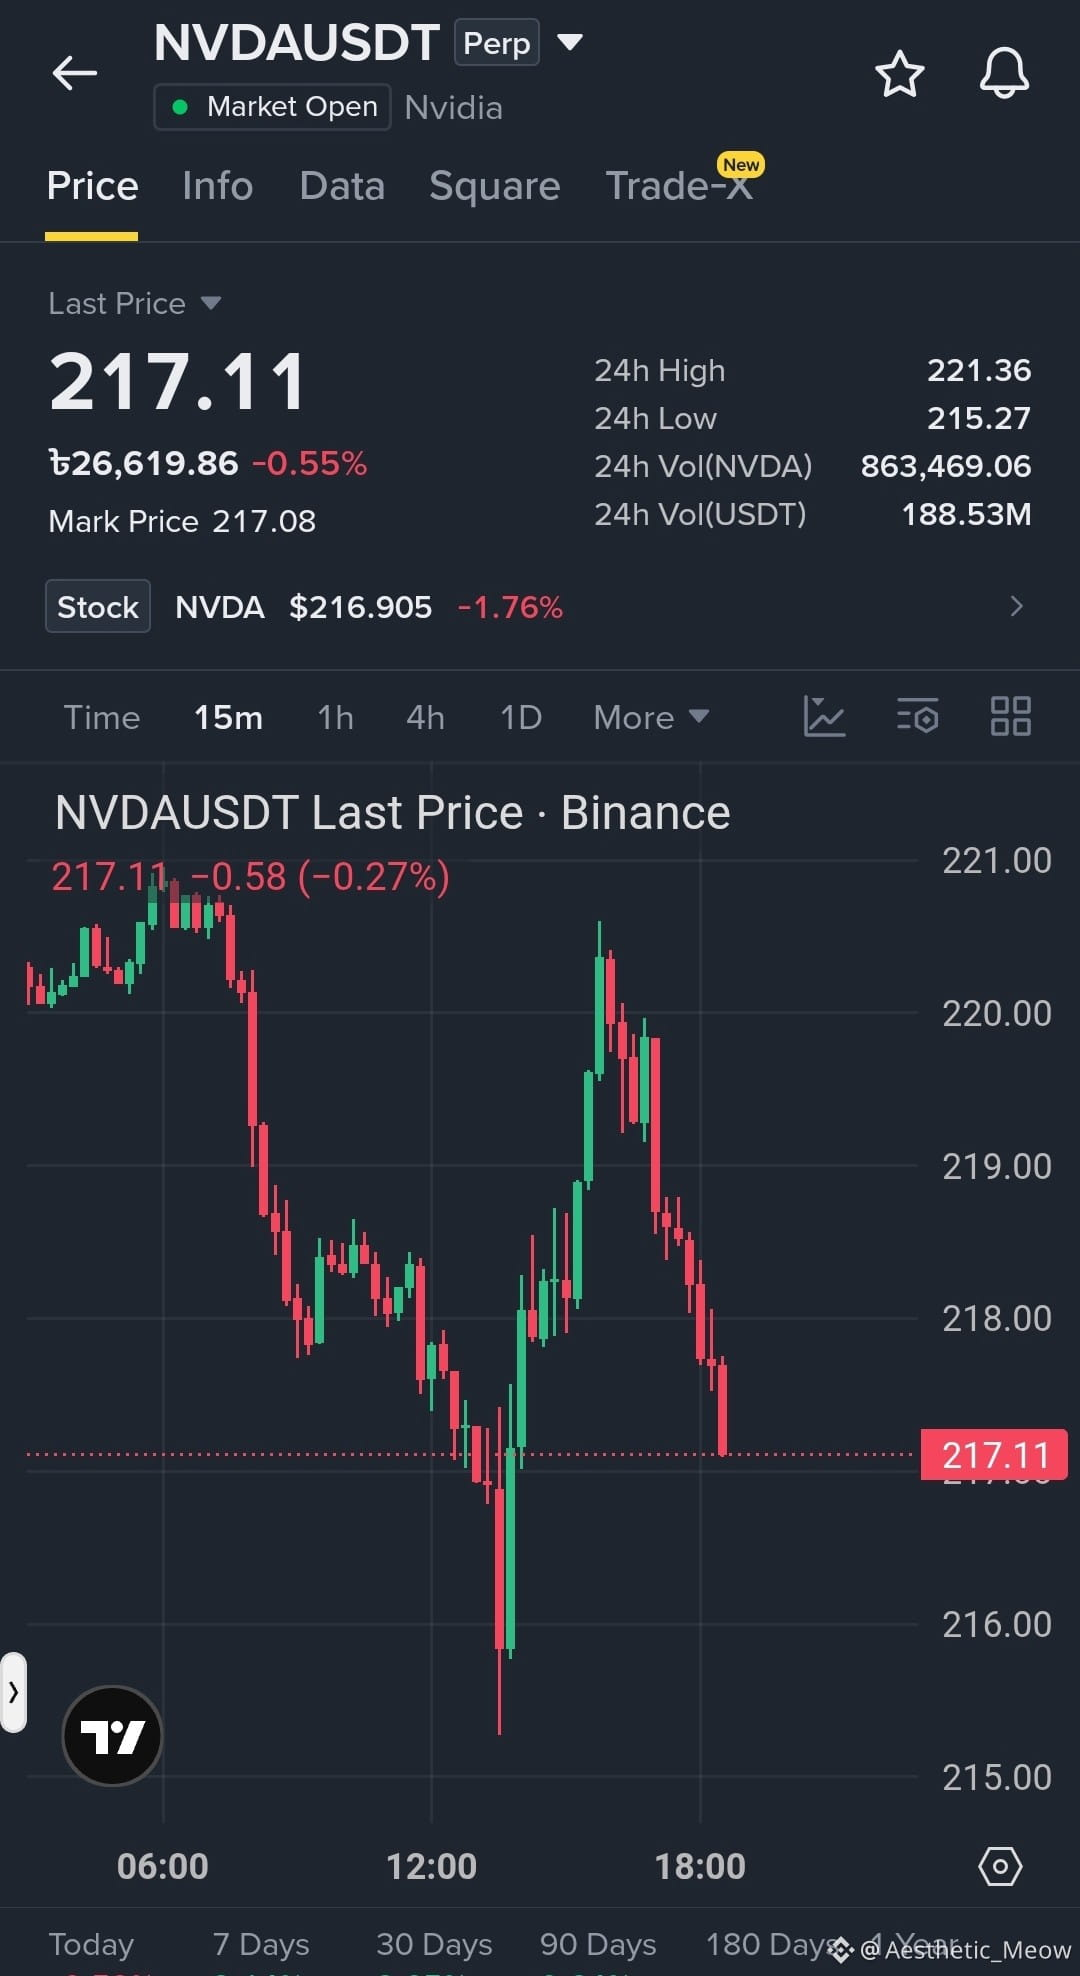
Habibies I Believe $NVDA 拒絶により上位レベルからの強さを失う
#NVDAUSDT ショート
エントリー: 217.00 – 217.50
TP1: 215.80 | TP2: 214.50 | TP3: 213.00
SL: 219.00
レバレッジ: 3×
DYOR/NFA
ここで取引👇
{future}(NVDAUSDT)
$HEMI
{future}(HEMIUSDT)
$USELESS
{future}(USELESSUSDT)
Habibies I Believe $NVDA 拒絶により上位レベルからの強さを失う
#NVDAUSDT ショート
エントリー: 217.00 – 217.50
TP1: 215.80 | TP2: 214.50 | TP3: 213.00
SL: 219.00
レバレッジ: 3×
DYOR/NFA
ここで取引👇
$HEMI
$USELESS
#NVDAUSDT ショート
エントリー: 217.00 – 217.50
TP1: 215.80 | TP2: 214.50 | TP3: 213.00
SL: 219.00
レバレッジ: 3×
DYOR/NFA
ここで取引👇
$HEMI
$USELESS
330

·
--
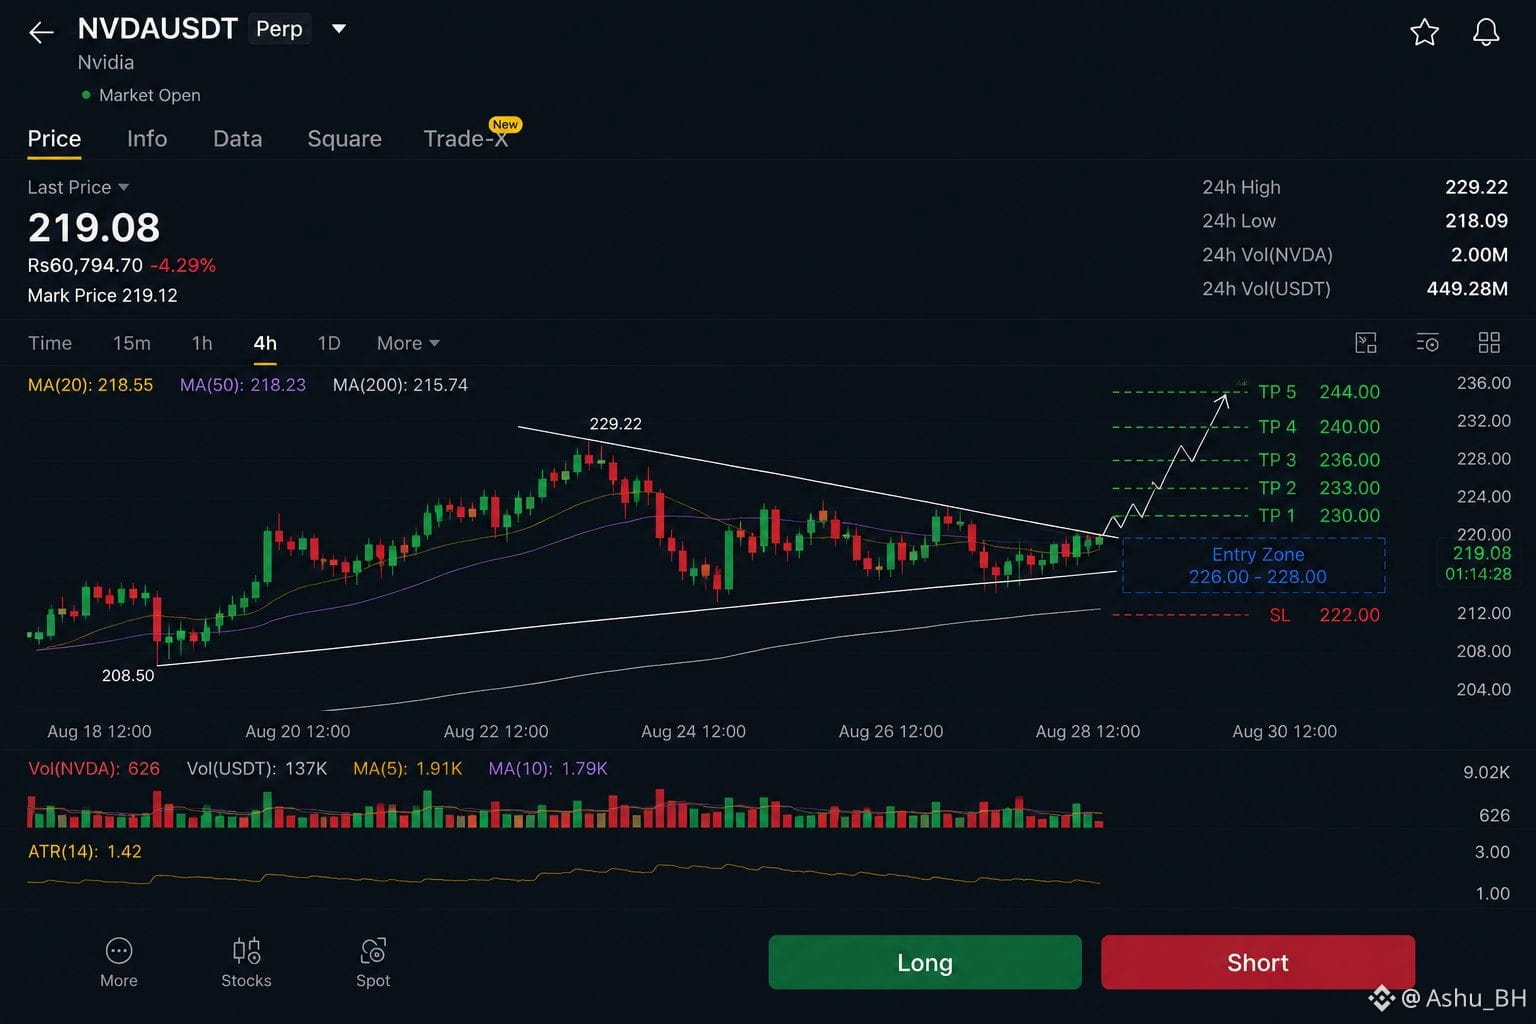
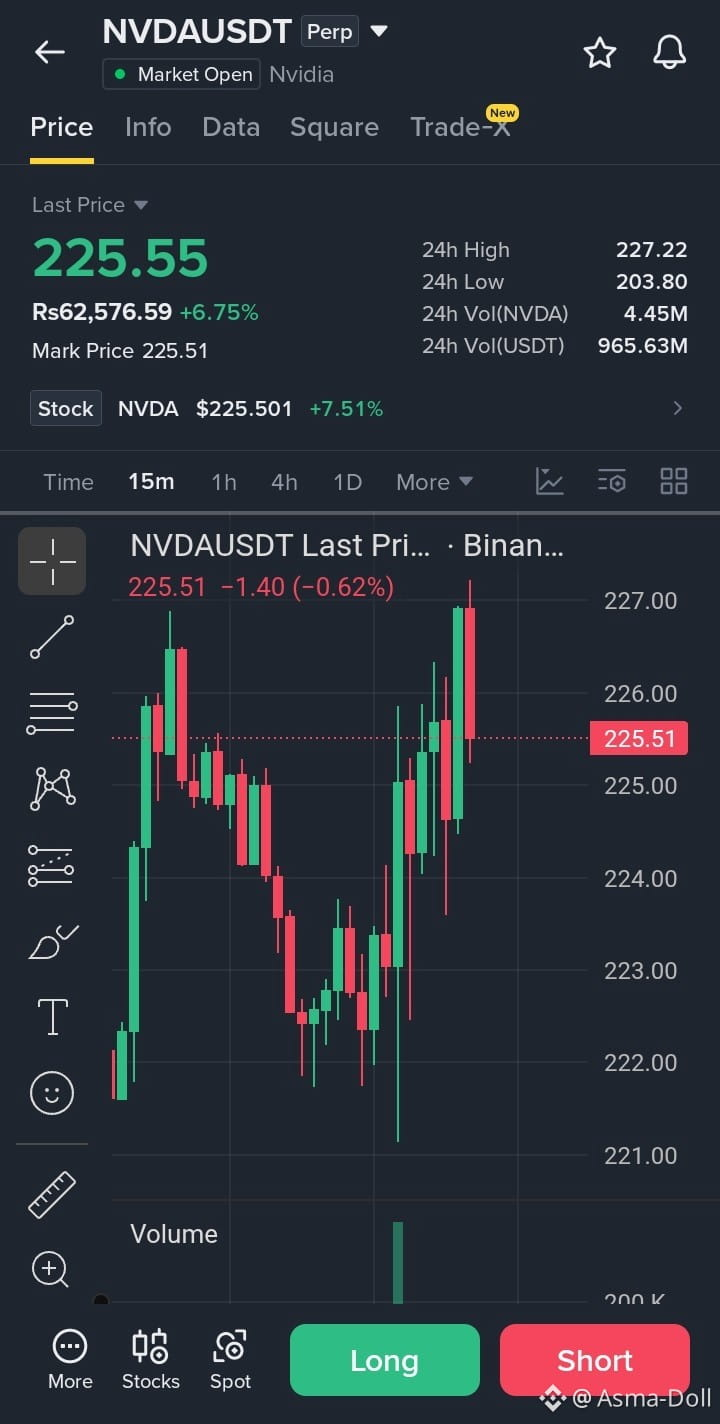
$NVDA /USDT無期限 — SHORTシグナル 📉
エントリー: $225.00 – $226.00
ストップロス: $228.20
TP1: $222.50
TP2: $219.50
TP3: $216.00
ここでトレード $NVDA
{future}(NVDAUSDT)
分析:
+6.75%の急騰の後、$227–228のレジスタンス帯付近で強い反発が見られました。価格は$225.50付近で弱さを示しており、下方向のサポートへの押し目が起こり得ます。
確認: $224.50を明確に下抜けるとショートの準備が強まります。価格が$228.20を取り返したら、ショートは無効です。
⚠️ 高ボラティリティの銘柄無期限 — リスク管理を慎重に行ってください。
#NVDA #NVDAUSDT #ShortSignal #CryptoTrading #Binance
$NVDA /USDT無期限 — SHORTシグナル 📉
エントリー: $225.00 – $226.00
ストップロス: $228.20
TP1: $222.50
TP2: $219.50
TP3: $216.00
ここでトレード $NVDA
分析:
+6.75%の急騰の後、$227–228のレジスタンス帯付近で強い反発が見られました。価格は$225.50付近で弱さを示しており、下方向のサポートへの押し目が起こり得ます。
確認: $224.50を明確に下抜けるとショートの準備が強まります。価格が$228.20を取り返したら、ショートは無効です。
⚠️ 高ボラティリティの銘柄無期限 — リスク管理を慎重に行ってください。
#NVDA #NVDAUSDT #ShortSignal #CryptoTrading #Binance
エントリー: $225.00 – $226.00
ストップロス: $228.20
TP1: $222.50
TP2: $219.50
TP3: $216.00
ここでトレード $NVDA
分析:
+6.75%の急騰の後、$227–228のレジスタンス帯付近で強い反発が見られました。価格は$225.50付近で弱さを示しており、下方向のサポートへの押し目が起こり得ます。
確認: $224.50を明確に下抜けるとショートの準備が強まります。価格が$228.20を取り返したら、ショートは無効です。
⚠️ 高ボラティリティの銘柄無期限 — リスク管理を慎重に行ってください。
#NVDA #NVDAUSDT #ShortSignal #CryptoTrading #Binance
15



·
--
NVDA トークン#NVDA/SOL #NVDAUSDT $NVDA.US $NVDA.US あなたがNVDAのトークン化された株/コインの話をしているなら、重要な点があります。NVDAは実際にはNVIDIAのティッカー(株式シンボル)であり、暗号市場にもそれをトークン化したバージョンが利用可能です。
10–12行のテキスト:
1. NVDAの将来は、AI技術によって強く見えています。
2. NVIDIAは、AIチップとデータセンター技術においてリーディング企業の一つです。
3. NVIDIAの2027年度第1四半期の売上高は816億ドルで、前年から85%増加しました。
4. データセンターの売上高も前年比で92%増加しました。
NVDA トークン
#NVDA/SOL #NVDAUSDT $NVDA.US $NVDA.US あなたがNVDAのトークン化された株/コインの話をしているなら、重要な点があります。NVDAは実際にはNVIDIAのティッカー(株式シンボル)であり、暗号市場にもそれをトークン化したバージョンが利用可能です。
10–12行のテキスト:
1. NVDAの将来は、AI技術によって強く見えています。
2. NVIDIAは、AIチップとデータセンター技術においてリーディング企業の一つです。
3. NVIDIAの2027年度第1四半期の売上高は816億ドルで、前年から85%増加しました。
4. データセンターの売上高も前年比で92%増加しました。
10–12行のテキスト:
1. NVDAの将来は、AI技術によって強く見えています。
2. NVIDIAは、AIチップとデータセンター技術においてリーディング企業の一つです。
3. NVIDIAの2027年度第1四半期の売上高は816億ドルで、前年から85%増加しました。
4. データセンターの売上高も前年比で92%増加しました。
76


数字の裏側は、どんな物語よりも雄弁に語ります。
2028年までに見込まれる約0.55兆ドルの利益予測——ほぼ1日あたり18億ドルに相当——は、この会社が従来型の企業というより、世界的な経済規模により近い位置づけであることを示唆しています。
フォワードPERが約30倍で、強固なバランスシート、低い負債、そして保有現金が少なくとも負債の複数倍に達する(と報じられている)ことを踏まえると、構造的に強力な成長ストーリーが見えてきます。
AIサイクルは「終わった」と言う人は、多くの場合短期の高値を見ています。一方で長期投資家は、その下でまだ構築中のインフラに注目しています。
最近の市場の下落が約7%ある中で、これを、2028年に向けて大きな業績拡大サイクルへとつながる前の、積み増しの好機だと見る向きもあります。
$NEX VDA #AI #NVDAUSDT
$NVDA
数字の裏側は、どんな物語よりも雄弁に語ります。
2028年までに見込まれる約0.55兆ドルの利益予測——ほぼ1日あたり18億ドルに相当——は、この会社が従来型の企業というより、世界的な経済規模により近い位置づけであることを示唆しています。
フォワードPERが約30倍で、強固なバランスシート、低い負債、そして保有現金が少なくとも負債の複数倍に達する(と報じられている)ことを踏まえると、構造的に強力な成長ストーリーが見えてきます。
AIサイクルは「終わった」と言う人は、多くの場合短期の高値を見ています。一方で長期投資家は、その下でまだ構築中のインフラに注目しています。
最近の市場の下落が約7%ある中で、これを、2028年に向けて大きな業績拡大サイクルへとつながる前の、積み増しの好機だと見る向きもあります。
$NEX VDA #AI #NVDAUSDT
$NVDA
2028年までに見込まれる約0.55兆ドルの利益予測——ほぼ1日あたり18億ドルに相当——は、この会社が従来型の企業というより、世界的な経済規模により近い位置づけであることを示唆しています。
フォワードPERが約30倍で、強固なバランスシート、低い負債、そして保有現金が少なくとも負債の複数倍に達する(と報じられている)ことを踏まえると、構造的に強力な成長ストーリーが見えてきます。
AIサイクルは「終わった」と言う人は、多くの場合短期の高値を見ています。一方で長期投資家は、その下でまだ構築中のインフラに注目しています。
最近の市場の下落が約7%ある中で、これを、2028年に向けて大きな業績拡大サイクルへとつながる前の、積み増しの好機だと見る向きもあります。
$NEX VDA #AI #NVDAUSDT
$NVDA
1
20

NVDAは市場構造からブレイクアウトしており、ボリュームもその方向を裏付けています。ロングにはかなり魅力的です。明確なオーダーブロックがあり、フェアバリューギャップとも良い重なりがあるため、堅実なトレード設定になっています
━━━━━━━━━━━━━━━━━━━━━
🟢 NVDA ロング 📈
━━━━━━━━━━━━━━━━━━━━━
📍 エントリー範囲: $205.3445 – $205.7555
🛑 ストップロス: $199.3835 (-3.0%)
🎯 TP1: $208.6333 (+1.5%)
🏆 TP2: $215.8275 (+5.0%)
⚡ R/R 比率: 1:1.7
📊 信頼度: 87%
━━━━━━━━━━━━━━━━━━━━━
CHoCHのシグナルがちょうど発火し、市場構造のブレイクを示しています。そしてCVDが、ボリュームがこちら側にあることを示しています。OBとPOIのコンフルエンスも揃っており、高信頼のセットアップです。構造はきれいで、ターゲットまでの道筋も明確です
ストップロスが3.0%なので、レバレッジは控えめに2〜3倍程度が適切で、リスクを管理します
TP1で一部利益確定をするのは理にかなっています。いくらかの利益を確定し、残りはよりタイトなストップで追いかけるためです
※金融アドバイスではありません — 必ずご自身でリスク管理をしてください 🙏
#NVDAUSDT $NVDA #SMC #Write2Earn #Binance
NVDAは市場構造からブレイクアウトしており、ボリュームもその方向を裏付けています。ロングにはかなり魅力的です。明確なオーダーブロックがあり、フェアバリューギャップとも良い重なりがあるため、堅実なトレード設定になっています
━━━━━━━━━━━━━━━━━━━━━
🟢 NVDA ロング 📈
━━━━━━━━━━━━━━━━━━━━━
📍 エントリー範囲: $205.3445 – $205.7555
🛑 ストップロス: $199.3835 (-3.0%)
🎯 TP1: $208.6333 (+1.5%)
🏆 TP2: $215.8275 (+5.0%)
⚡ R/R 比率: 1:1.7
📊 信頼度: 87%
━━━━━━━━━━━━━━━━━━━━━
CHoCHのシグナルがちょうど発火し、市場構造のブレイクを示しています。そしてCVDが、ボリュームがこちら側にあることを示しています。OBとPOIのコンフルエンスも揃っており、高信頼のセットアップです。構造はきれいで、ターゲットまでの道筋も明確です
ストップロスが3.0%なので、レバレッジは控えめに2〜3倍程度が適切で、リスクを管理します
TP1で一部利益確定をするのは理にかなっています。いくらかの利益を確定し、残りはよりタイトなストップで追いかけるためです
※金融アドバイスではありません — 必ずご自身でリスク管理をしてください 🙏
#NVDAUSDT $NVDA #SMC #Write2Earn #Binance
━━━━━━━━━━━━━━━━━━━━━
🟢 NVDA ロング 📈
━━━━━━━━━━━━━━━━━━━━━
📍 エントリー範囲: $205.3445 – $205.7555
🛑 ストップロス: $199.3835 (-3.0%)
🎯 TP1: $208.6333 (+1.5%)
🏆 TP2: $215.8275 (+5.0%)
⚡ R/R 比率: 1:1.7
📊 信頼度: 87%
━━━━━━━━━━━━━━━━━━━━━
CHoCHのシグナルがちょうど発火し、市場構造のブレイクを示しています。そしてCVDが、ボリュームがこちら側にあることを示しています。OBとPOIのコンフルエンスも揃っており、高信頼のセットアップです。構造はきれいで、ターゲットまでの道筋も明確です
ストップロスが3.0%なので、レバレッジは控えめに2〜3倍程度が適切で、リスクを管理します
TP1で一部利益確定をするのは理にかなっています。いくらかの利益を確定し、残りはよりタイトなストップで追いかけるためです
※金融アドバイスではありません — 必ずご自身でリスク管理をしてください 🙏
#NVDAUSDT $NVDA #SMC #Write2Earn #Binance
32
ログインして、さらにコンテンツを読む
厳選トピックで世界の暗号資産トレーダーの仲間入り
⚡️ 暗号資産に関する最新かつ有益な情報が見つかります。
💬 世界最大の暗号資産取引所から信頼されています。
👍 認証を受けたクリエイターから、有益なインサイトを得られます。
メール / 電話番号
トレンドトピック
1
#BTCBreaks80K
閲覧回数 151,785
2,413人が討論中
2
#比特币突破8万
閲覧回数 108,752
298人が討論中
3
#BitcoinMarketCapTopsTesla
閲覧回数 594
66人が討論中
4
#SOLJumpsAbout10%
閲覧回数 7,650
238人が討論中
5
#EthereumReclaims$2600
閲覧回数 713
32人が討論中
6
#SECReceivesAmendedInjectiveETFFiling
閲覧回数 6,376
241人が討論中
7
#SanDiskToJoinSP100OnSep21
閲覧回数 4,786
149人が討論中
8
#PolygonToDeployContractBurning100MPOL
閲覧回数 3,330
123人が討論中
9
#TRMReportsYouTubeScamStole274.6ETH
閲覧回数 1,591
44人が討論中
10
#YahooFinanceEndsPolymarketPartnership
閲覧回数 2,439
45人が討論中