
#bitcoinrainbow
bitcoinrainbow
閲覧回数 3,922
7人が討論中
注目
最新

翻訳参照
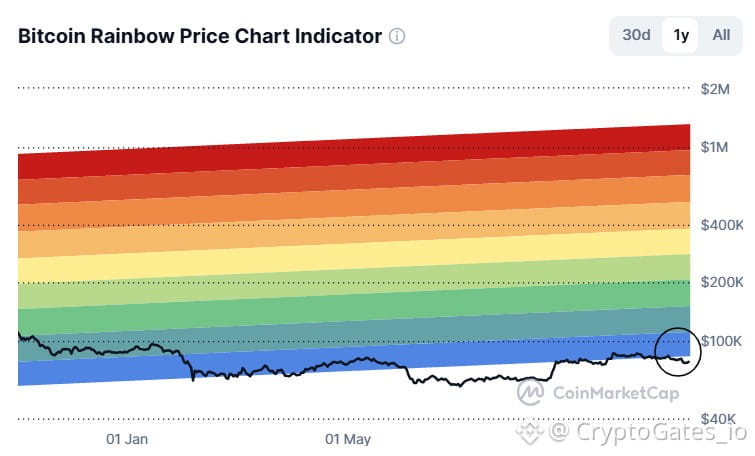
$BTC : Rainbow Chart shows price in the lower bands 📊
price is trading near the bottom of the log regression bands on the 1Y view.
Interpretation: relative to long term trend, BTC is in a cheaper zone of this model. The model has no timing component.
Lesson: lower bands have often come with long sideways phases. Staged entries and sized risk matter more than guessing the exact low.
If you run a DCA plan, test your interval and step size on historical data first.
#BTC #DCA #BitcoinRainbow
$BTC : Rainbow Chart shows price in the lower bands 📊
price is trading near the bottom of the log regression bands on the 1Y view.
Interpretation: relative to long term trend, BTC is in a cheaper zone of this model. The model has no timing component.
Lesson: lower bands have often come with long sideways phases. Staged entries and sized risk matter more than guessing the exact low.
If you run a DCA plan, test your interval and step size on historical data first.
#BTC #DCA #BitcoinRainbow
price is trading near the bottom of the log regression bands on the 1Y view.
Interpretation: relative to long term trend, BTC is in a cheaper zone of this model. The model has no timing component.
Lesson: lower bands have often come with long sideways phases. Staged entries and sized risk matter more than guessing the exact low.
If you run a DCA plan, test your interval and step size on historical data first.
#BTC #DCA #BitcoinRainbow
61

·
--
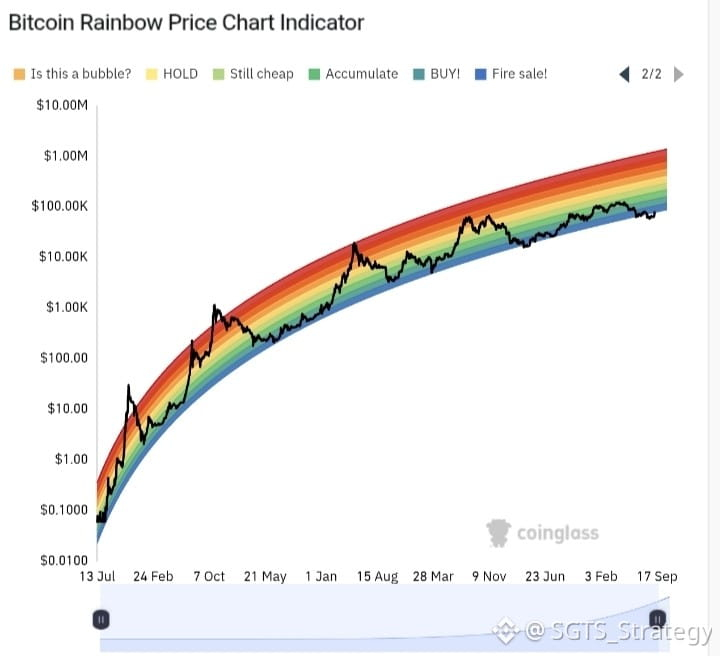
$BTC | ビットコインのレインボーチャートは、サイクルポジションを単一のカラーバンプで9つの対数回帰バンドに圧縮します。赤(最大バブル領域)は、歴史的に2013年12月、2017年12月、2021年4月、そして2025年後半のクラスターを捉えました。濃い青(買い/蓄積)は2015年1月、2018年12月、2022年11月を捉えました。
正直なところ、このフレーミングは、ビットコインパワーローと同じ対数-対数回帰の下にあり、異なる方法で視覚化されています。コンフルエンススタックのためのサイクルポジションを素早く読み取るために便利ですが、それ自体では負荷を支えるものではありません。
サトシマクロモデル内では、Tier 1バリュエーションカードのセカンダリービジュアルとして位置付けられています。
完全な歴史的チャート: https://satoshimacro.com/tools/crypto/cycle-indicators/bitcoin-rainbow-chart/
#SatoshiMacro #BitcoinRainbow #OnChain #ビットコイン
$BTC | ビットコインのレインボーチャートは、サイクルポジションを単一のカラーバンプで9つの対数回帰バンドに圧縮します。赤(最大バブル領域)は、歴史的に2013年12月、2017年12月、2021年4月、そして2025年後半のクラスターを捉えました。濃い青(買い/蓄積)は2015年1月、2018年12月、2022年11月を捉えました。
正直なところ、このフレーミングは、ビットコインパワーローと同じ対数-対数回帰の下にあり、異なる方法で視覚化されています。コンフルエンススタックのためのサイクルポジションを素早く読み取るために便利ですが、それ自体では負荷を支えるものではありません。
サトシマクロモデル内では、Tier 1バリュエーションカードのセカンダリービジュアルとして位置付けられています。
完全な歴史的チャート: https://satoshimacro.com/tools/crypto/cycle-indicators/bitcoin-rainbow-chart/
#SatoshiMacro #BitcoinRainbow #OnChain #ビットコイン
正直なところ、このフレーミングは、ビットコインパワーローと同じ対数-対数回帰の下にあり、異なる方法で視覚化されています。コンフルエンススタックのためのサイクルポジションを素早く読み取るために便利ですが、それ自体では負荷を支えるものではありません。
サトシマクロモデル内では、Tier 1バリュエーションカードのセカンダリービジュアルとして位置付けられています。
完全な歴史的チャート: https://satoshimacro.com/tools/crypto/cycle-indicators/bitcoin-rainbow-chart/
#SatoshiMacro #BitcoinRainbow #OnChain #ビットコイン
1
123

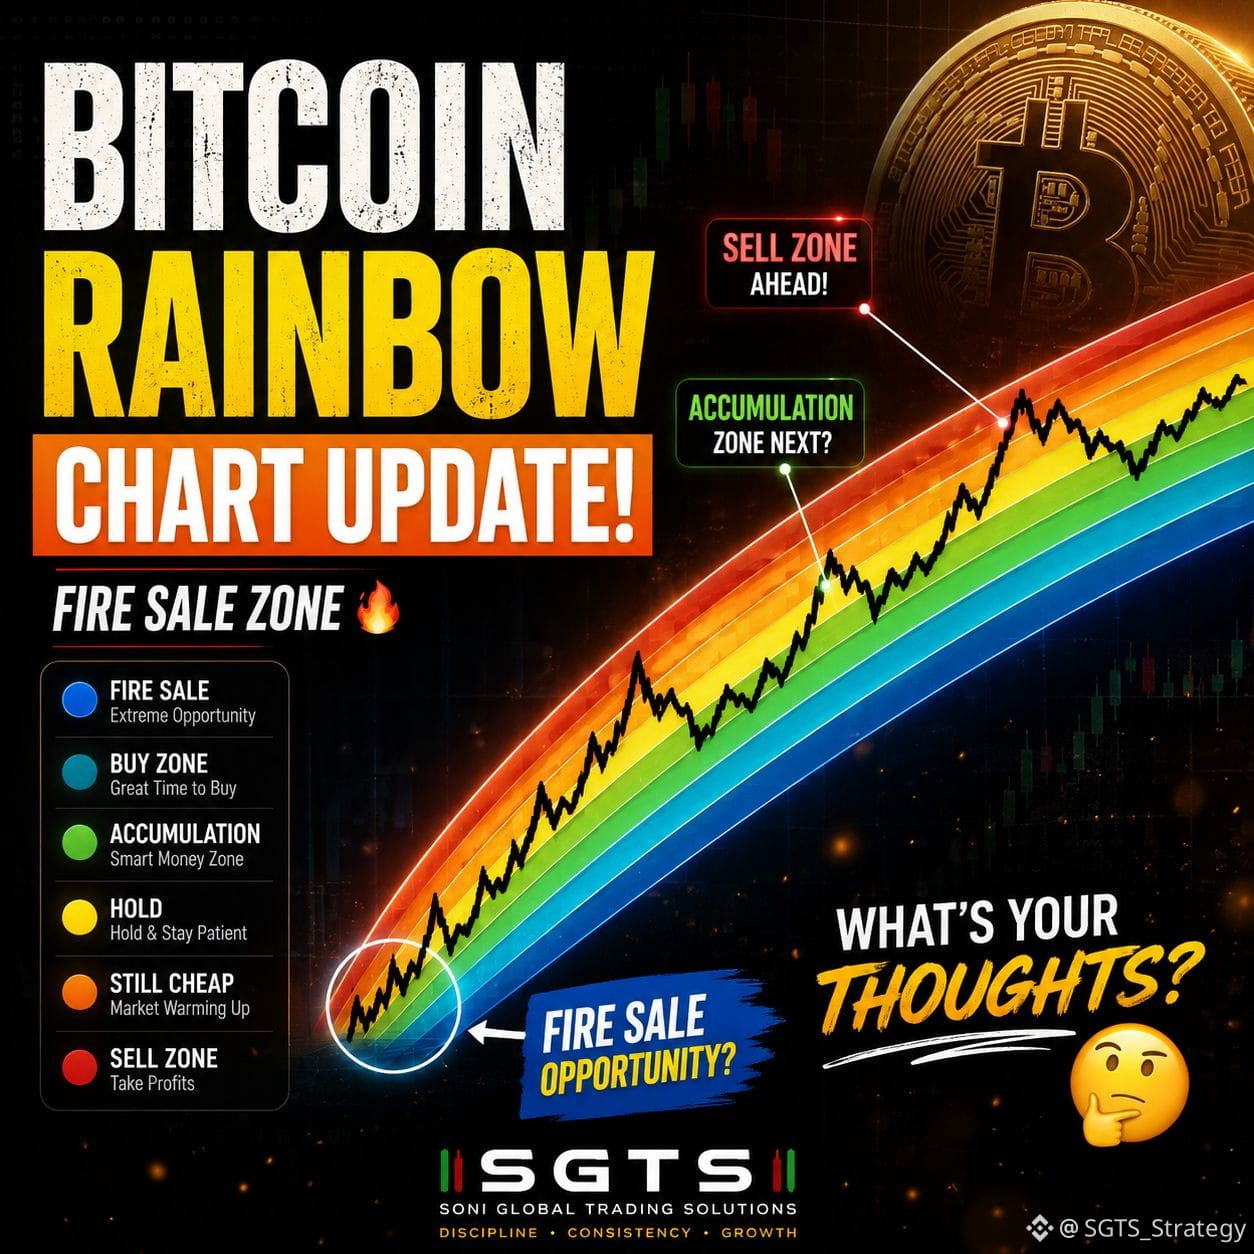
BTCはアキュムレーションゾーンに移行すると思いますか? 🌈₿
#BitcoinRainbow
{future}(BTCUSDT)
BTCはアキュムレーションゾーンに移行すると思いますか? 🌈₿
#BitcoinRainbow
#BitcoinRainbow
92
ログインして、さらにコンテンツを読む
厳選トピックで世界の暗号資産トレーダーの仲間入り
⚡️ 暗号資産に関する最新かつ有益な情報が見つかります。
💬 世界最大の暗号資産取引所から信頼されています。
👍 認証を受けたクリエイターから、有益なインサイトを得られます。
メール / 電話番号
トレンドトピック
1
#AMDBeatsExpectations-AINarrativeContinues
閲覧回数 0
2人が討論中
2
#USMidtermsAhead-WhereWillMarketGo
閲覧回数 66,216
83人が討論中
3
#BinanceIncidentReport
閲覧回数 101,170
916人が討論中
4
#BinanceReopensWithdrawalsForMoreAssets
閲覧回数 236,550
2,038人が討論中
5
#BinanceHourlyDepositsExceedWithdrawals
閲覧回数 105,715
985人が討論中
6
#SECDivisionSaysCantonCoinIsADigitalCommodity
閲覧回数 21
9人が討論中
7
#BhutanGelephuCentralBankApprovedToHoldDigitalAssets
閲覧回数 0
1人が討論中
8
#MorganStanleyAmongFirstBanksToUseDTCCTokenization
閲覧回数 482
29人が討論中
9
#NasdaqRises0.8%AsChipStocksRebound
閲覧回数 386
17人が討論中
10
#AnthropicIPOPricedDownasInvestorsEye$1.5T
閲覧回数 6,033
68人が討論中