
#cryptoandstocks
cryptoandstocks
閲覧回数 57,180
76人が討論中
注目
最新


·
--
$AAOI ロングの準備 📈
$AAOI を監視し、ブレイクアウトの可能性を探ります。
エントリーゾーン:121.70 – 121.80
🎯 TP1:124.00
🎯 TP2:126.00
🎯 TP3:128.00
🛑 ストップロス:120.00
リスク管理を最優先に——失ってもいい範囲以上は決してリスクを取らないでください。
この先、強気(ブル)がさらに押し上げられるか見ていきましょう。 🔥
#AAOI #Trading #CryptoAndStocks
{future}(AAOIUSDT)
$AAOI ロングの準備 📈
$AAOI を監視し、ブレイクアウトの可能性を探ります。
エントリーゾーン:121.70 – 121.80
🎯 TP1:124.00
🎯 TP2:126.00
🎯 TP3:128.00
🛑 ストップロス:120.00
リスク管理を最優先に——失ってもいい範囲以上は決してリスクを取らないでください。
この先、強気(ブル)がさらに押し上げられるか見ていきましょう。 🔥
#AAOI #Trading #CryptoAndStocks
$AAOI を監視し、ブレイクアウトの可能性を探ります。
エントリーゾーン:121.70 – 121.80
🎯 TP1:124.00
🎯 TP2:126.00
🎯 TP3:128.00
🛑 ストップロス:120.00
リスク管理を最優先に——失ってもいい範囲以上は決してリスクを取らないでください。
この先、強気(ブル)がさらに押し上げられるか見ていきましょう。 🔥
#AAOI #Trading #CryptoAndStocks
362

·
--
🚀 マイクロンが市場の後退を跳ね返し、記録的高値を打ち破った! 🚀
広範な市場がわずかに下落する中、マイクロンテクノロジー ($MU
{future}(MUUSDT)
) は期待を完全に超え、1株あたり1,210ドルを超える史上最高値を更新し、1兆ドル市場キャップクラブのエリートに仲間入りしました!
ここに花火を燃やす要因があります:
アンソロピックのパワームーブ:マイクロンは、AIメモリーインフラとシリーズHファンディングのためにアンソロピックとの大規模な戦略的パートナーシップを結び、次世代AIエコシステムでの地位を固めました。
売り切れ需要:NvidiaのブラックウェルGPUを駆動する不可欠なチップである高帯域幅メモリ(HBM)への飽くなき需要により、マイクロンの2026年の生産能力は完全に予約されています。
収益カウントダウン:この大規模な上昇は、今日の午後(6月24日)のQ3収益発表の直前に起こります。ウォール街は爆発的な収益成長を予想しています。$BTC
{spot}(BTCUSDT)
暗号通貨と株式トレーダーにとっての大きな疑問:このAIメモリーのブームは構造的に永続的なのか、それとも循環的なピークに近づいているのか?
👀 あなたは$MUを保有していますか、それとも次のAI暗号通貨/株式のプレイを探していますか?コメントで話しましょう!
#MicronHitsRecordHigh #AI #CryptoAndStocks #trading
🚀 マイクロンが市場の後退を跳ね返し、記録的高値を打ち破った! 🚀
広範な市場がわずかに下落する中、マイクロンテクノロジー ($MU
) は期待を完全に超え、1株あたり1,210ドルを超える史上最高値を更新し、1兆ドル市場キャップクラブのエリートに仲間入りしました!
ここに花火を燃やす要因があります:
アンソロピックのパワームーブ:マイクロンは、AIメモリーインフラとシリーズHファンディングのためにアンソロピックとの大規模な戦略的パートナーシップを結び、次世代AIエコシステムでの地位を固めました。
売り切れ需要:NvidiaのブラックウェルGPUを駆動する不可欠なチップである高帯域幅メモリ(HBM)への飽くなき需要により、マイクロンの2026年の生産能力は完全に予約されています。
収益カウントダウン:この大規模な上昇は、今日の午後(6月24日)のQ3収益発表の直前に起こります。ウォール街は爆発的な収益成長を予想しています。$BTC
暗号通貨と株式トレーダーにとっての大きな疑問:このAIメモリーのブームは構造的に永続的なのか、それとも循環的なピークに近づいているのか?
👀 あなたは$MU を保有していますか、それとも次のAI暗号通貨/株式のプレイを探していますか?コメントで話しましょう!
#MicronHitsRecordHigh #AI #CryptoAndStocks #trading
広範な市場がわずかに下落する中、マイクロンテクノロジー ($MU
) は期待を完全に超え、1株あたり1,210ドルを超える史上最高値を更新し、1兆ドル市場キャップクラブのエリートに仲間入りしました!
ここに花火を燃やす要因があります:
アンソロピックのパワームーブ:マイクロンは、AIメモリーインフラとシリーズHファンディングのためにアンソロピックとの大規模な戦略的パートナーシップを結び、次世代AIエコシステムでの地位を固めました。
売り切れ需要:NvidiaのブラックウェルGPUを駆動する不可欠なチップである高帯域幅メモリ(HBM)への飽くなき需要により、マイクロンの2026年の生産能力は完全に予約されています。
収益カウントダウン:この大規模な上昇は、今日の午後(6月24日)のQ3収益発表の直前に起こります。ウォール街は爆発的な収益成長を予想しています。$BTC
暗号通貨と株式トレーダーにとっての大きな疑問:このAIメモリーのブームは構造的に永続的なのか、それとも循環的なピークに近づいているのか?
👀 あなたは$MU を保有していますか、それとも次のAI暗号通貨/株式のプレイを探していますか?コメントで話しましょう!
#MicronHitsRecordHigh #AI #CryptoAndStocks #trading

2
241

·
--
翻訳参照
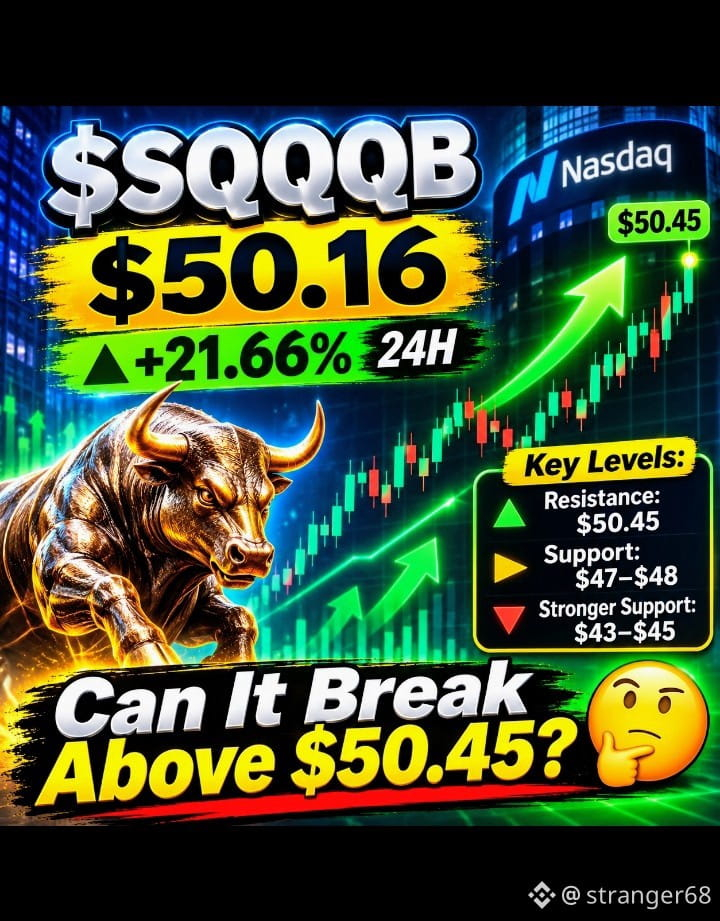
📉 $SQQQB Jumps 21.66% — Is Nasdaq Facing Another Wave of Selling? ⚡
🔥 A powerful move has lifted SQQQB to $50.16, up 21.66% in 24 hours, with price reaching $50.45 after climbing from $41.23. The sharp breakout suggests strong demand for downside Nasdaq exposure, but can this momentum continue? 🚀
⚡ 1H Chart: Price is trading above all three moving averages: MA(7) at $48.77, MA(25) at $44.33, and MA(99) at $42.79. Short-term momentum remains strong, although a pause near the $50.45 high would not be surprising. 📊
📈 4H Chart: The breakout is becoming more significant, with price well above MA(7) at $45.15, MA(25) at $43.11, and MA(99) at $40.03. Holding the $47–$48 region could help maintain the current upward structure. 🔥
🌍 1D Chart: The broader recovery is impressive, with price moving above MA(7) at $43.05 and MA(25) at $39.34. The latest surge signals strong momentum, but volatility could increase after such a rapid advance. 🛡️
🎯 Important Levels:
- Resistance: $50.45
- Immediate support: $47–$48
- Stronger support: $43–$45
⚠️ Remember, this is a leveraged inverse Nasdaq ETF, so sharp moves can bring equally sharp reversals.
💬 Can the price break above $50.45 and extend the rally, or is a pullback approaching? What's your take? 🔥
#SQQQB #Nasdaq #CryptoAndStocks
{spot}(SQQQBUSDT)
#BinanceReopensWithdrawalsForMoreAssets #USMidterms-WhatAreMarketsExpecting? #Binance98PercentReplenished #ADPUSPrivateEmployersAdd86000JobsInOctober
📉 $SQQQB Jumps 21.66% — Is Nasdaq Facing Another Wave of Selling? ⚡
🔥 A powerful move has lifted SQQQB to $50.16, up 21.66% in 24 hours, with price reaching $50.45 after climbing from $41.23. The sharp breakout suggests strong demand for downside Nasdaq exposure, but can this momentum continue? 🚀
⚡ 1H Chart: Price is trading above all three moving averages: MA(7) at $48.77, MA(25) at $44.33, and MA(99) at $42.79. Short-term momentum remains strong, although a pause near the $50.45 high would not be surprising. 📊
📈 4H Chart: The breakout is becoming more significant, with price well above MA(7) at $45.15, MA(25) at $43.11, and MA(99) at $40.03. Holding the $47–$48 region could help maintain the current upward structure. 🔥
🌍 1D Chart: The broader recovery is impressive, with price moving above MA(7) at $43.05 and MA(25) at $39.34. The latest surge signals strong momentum, but volatility could increase after such a rapid advance. 🛡️
🎯 Important Levels:
- Resistance: $50.45
- Immediate support: $47–$48
- Stronger support: $43–$45
⚠️ Remember, this is a leveraged inverse Nasdaq ETF, so sharp moves can bring equally sharp reversals.
💬 Can the price break above $50.45 and extend the rally, or is a pullback approaching? What's your take? 🔥
#SQQQB #Nasdaq #CryptoAndStocks
#BinanceReopensWithdrawalsForMoreAssets #USMidterms-WhatAreMarketsExpecting? #Binance98PercentReplenished #ADPUSPrivateEmployersAdd86000JobsInOctober
🔥 A powerful move has lifted SQQQB to $50.16, up 21.66% in 24 hours, with price reaching $50.45 after climbing from $41.23. The sharp breakout suggests strong demand for downside Nasdaq exposure, but can this momentum continue? 🚀
⚡ 1H Chart: Price is trading above all three moving averages: MA(7) at $48.77, MA(25) at $44.33, and MA(99) at $42.79. Short-term momentum remains strong, although a pause near the $50.45 high would not be surprising. 📊
📈 4H Chart: The breakout is becoming more significant, with price well above MA(7) at $45.15, MA(25) at $43.11, and MA(99) at $40.03. Holding the $47–$48 region could help maintain the current upward structure. 🔥
🌍 1D Chart: The broader recovery is impressive, with price moving above MA(7) at $43.05 and MA(25) at $39.34. The latest surge signals strong momentum, but volatility could increase after such a rapid advance. 🛡️
🎯 Important Levels:
- Resistance: $50.45
- Immediate support: $47–$48
- Stronger support: $43–$45
⚠️ Remember, this is a leveraged inverse Nasdaq ETF, so sharp moves can bring equally sharp reversals.
💬 Can the price break above $50.45 and extend the rally, or is a pullback approaching? What's your take? 🔥
#SQQQB #Nasdaq #CryptoAndStocks
#BinanceReopensWithdrawalsForMoreAssets #USMidterms-WhatAreMarketsExpecting? #Binance98PercentReplenished #ADPUSPrivateEmployersAdd86000JobsInOctober
52

·
--
Binance TradFiスナップショット:半導体・テックが下落、AppleとAmazonは底堅さを維持📉 Binance TradFiスナップショット:半導体・テックが下落、AppleとAmazonは底堅さを維持
BinanceのTradFiタブに、暗号資産と並んで米国株が表示されるようになりました。こちらが米国株ボードのスナップショットです。
🔴 レッドゾーン:半導体・ハイベータテック
$SNDK:-12.81%(対象銘柄中で最大の下落)
$AMD:-11.66%
$TSLA:-9.05%
$MU:-8.96%
$SPCX:-6.19%
$NVDA:-4.36%
売り圧力は半導体とメモリーのセクターに大きく集中しています。AMD、Micron、Sandisk、NVIDIAがそろって下落する場合、通常は個別企業のニュースではなく、セクター全体の売りを示しています。
Binance TradFiスナップショット:半導体・テックが下落、AppleとAmazonは底堅さを維持
📉 Binance TradFiスナップショット:半導体・テックが下落、AppleとAmazonは底堅さを維持
BinanceのTradFiタブに、暗号資産と並んで米国株が表示されるようになりました。こちらが米国株ボードのスナップショットです。
🔴 レッドゾーン:半導体・ハイベータテック
$SNDK :-12.81%(対象銘柄中で最大の下落)
$AMD :-11.66%
$TSLA :-9.05%
$MU:-8.96%
$SPCX:-6.19%
$NVDA:-4.36%
売り圧力は半導体とメモリーのセクターに大きく集中しています。AMD、Micron、Sandisk、NVIDIAがそろって下落する場合、通常は個別企業のニュースではなく、セクター全体の売りを示しています。
BinanceのTradFiタブに、暗号資産と並んで米国株が表示されるようになりました。こちらが米国株ボードのスナップショットです。
🔴 レッドゾーン:半導体・ハイベータテック
$SNDK :-12.81%(対象銘柄中で最大の下落)
$AMD :-11.66%
$TSLA :-9.05%
$MU:-8.96%
$SPCX:-6.19%
$NVDA:-4.36%
売り圧力は半導体とメモリーのセクターに大きく集中しています。AMD、Micron、Sandisk、NVIDIAがそろって下落する場合、通常は個別企業のニュースではなく、セクター全体の売りを示しています。
1k

本人確認中
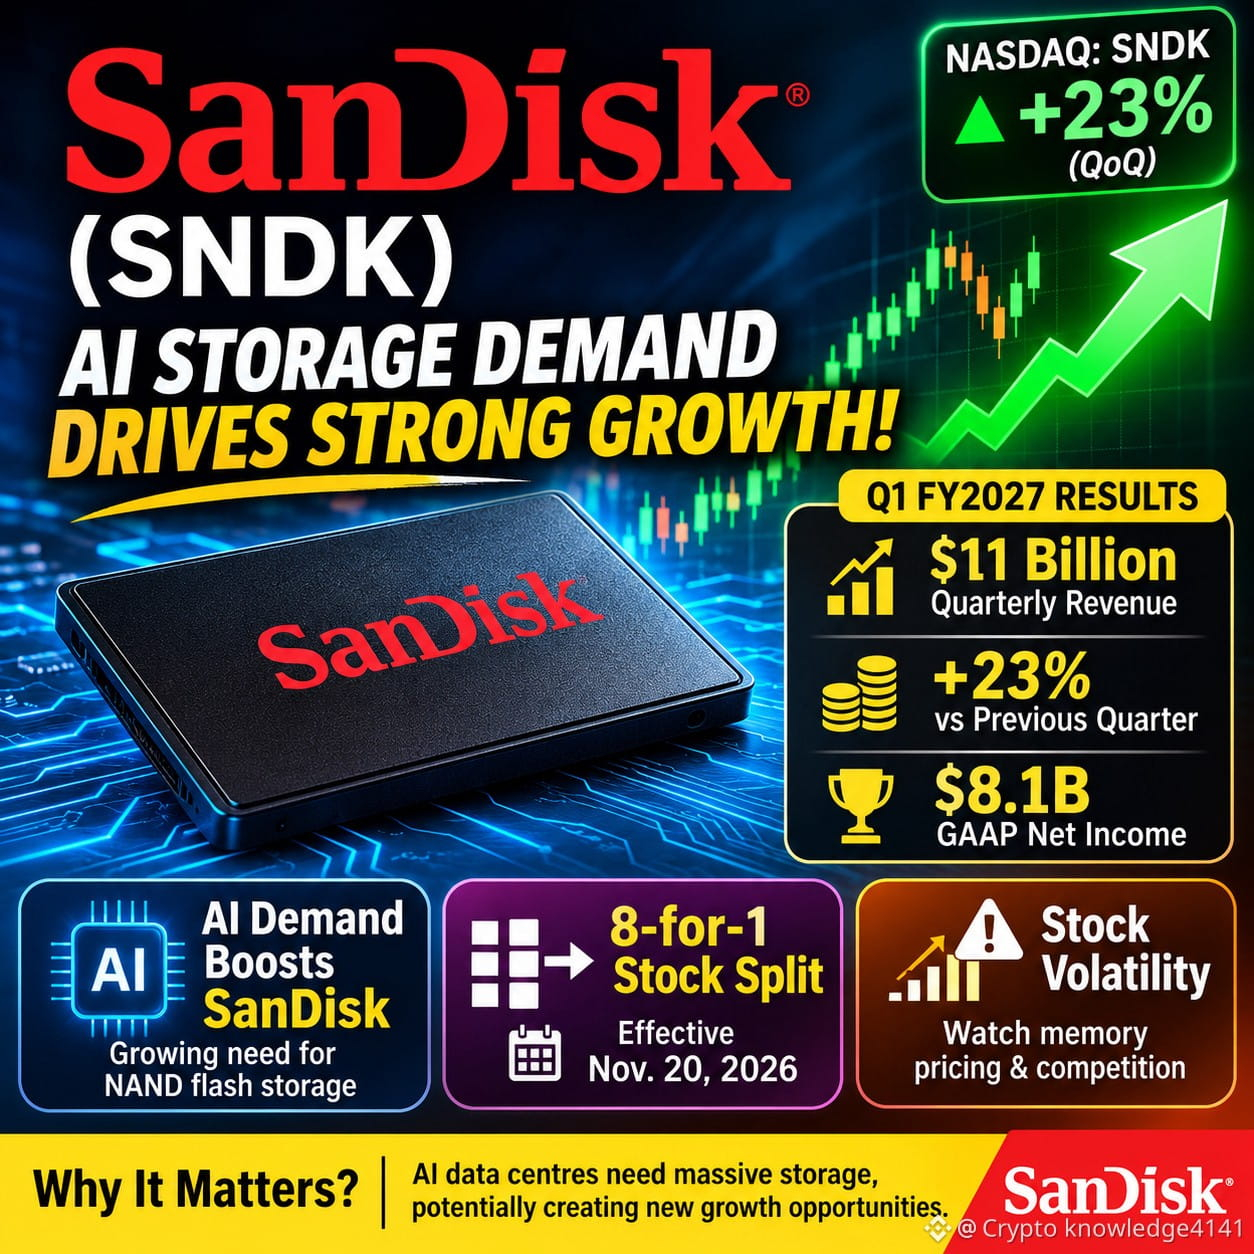
$SNDK 🚀 サンディスク(SNDK):AIストレージ需要が力強い成長を牽引!
サンディスクは2027年度第1四半期に好調な業績を発表し、売上高は110億ドル、前四半期比23%増となりました。
🔥 主なポイント:
- 四半期売上高110億ドル。
- AIストレージへの旺盛な需要。
- NANDフラッシュ技術の重要性が高まっています。
- 11月20日に予定されている8対1の株式分割。
📈 注目すべき理由:AIデータセンターには大容量のストレージが必要であり、サンディスクに新たな成長機会をもたらす可能性があります。
⚠️ 投資家は、メモリー価格や競争、株価の変動にも注目する必要があります。
SNDKの今後について、どう思いますか?
#SNDK #SanDisk #CryptoAndStocks #StockMarket #BinanceSquare
{stock_us}(SNDK.US)
$SNDK 🚀 サンディスク(SNDK):AIストレージ需要が力強い成長を牽引!
サンディスクは2027年度第1四半期に好調な業績を発表し、売上高は110億ドル、前四半期比23%増となりました。
🔥 主なポイント:
- 四半期売上高110億ドル。
- AIストレージへの旺盛な需要。
- NANDフラッシュ技術の重要性が高まっています。
- 11月20日に予定されている8対1の株式分割。
📈 注目すべき理由:AIデータセンターには大容量のストレージが必要であり、サンディスクに新たな成長機会をもたらす可能性があります。
⚠️ 投資家は、メモリー価格や競争、株価の変動にも注目する必要があります。
SNDKの今後について、どう思いますか?
#SNDK #SanDisk #CryptoAndStocks #StockMarket #BinanceSquare
サンディスクは2027年度第1四半期に好調な業績を発表し、売上高は110億ドル、前四半期比23%増となりました。
🔥 主なポイント:
- 四半期売上高110億ドル。
- AIストレージへの旺盛な需要。
- NANDフラッシュ技術の重要性が高まっています。
- 11月20日に予定されている8対1の株式分割。
📈 注目すべき理由:AIデータセンターには大容量のストレージが必要であり、サンディスクに新たな成長機会をもたらす可能性があります。
⚠️ 投資家は、メモリー価格や競争、株価の変動にも注目する必要があります。
SNDKの今後について、どう思いますか?
#SNDK #SanDisk #CryptoAndStocks #StockMarket #BinanceSquare
2.2k

·
--
⚠️ INTCの強気派が9万8,200ドルの損失——売り圧力が強まる!
最新の清算データによると、インテルの強気派は痛手を受けました。約9万8,200ドル相当のレバレッジをかけたロングポジションが63.23ドル付近で清算され、さらなる上昇に賭けていたトレーダーが直面するリスクが浮き彫りになりました。
📊 ポジション状況
資産:インテル($INTC)
清算サイド:ロング 🔴
清算総額:9万8,200ドル
清算価格:63.23ドル
🔍 次に何が起こる?
焦点は、この清算イベント後にINTCが安定するかどうかです。
📉 下落シナリオ:売り手が主導権を維持し、価格が63.23ドルを回復できなければ、弱い買い手がポジションを手放すなか、さらなる下落が起こる可能性があります。
📈 回復シナリオ:出来高を伴って63.23ドルを明確に奪回すれば、反発のきっかけとなり、ショート勢を踏み上げる可能性もあります。
🎯 私のトレード見解:短期的には慎重な姿勢が必要です。強気のエントリーを検討する前に、確認を待ちたいところです。63.23ドル付近を注視してください。市場の反応が次の方向性を示す手がかりになるかもしれません。
注意:清算データが示すのは、レバレッジをかけたトレーダーが捕まった価格帯であり、次に価格が向かう先ではありません。リスクを管理し、感情に任せたエントリーは避けましょう。
#INTC #インテル #清算アラート #トレードシグナル #マーケットウォッチ #CryptoAndStocks
#USOctoberNFP-AreRateCutsStillPossible #AppleEarningsAhead-CanStockHitNewHigh #Verify1to1BinanceReserves #BinanceRestores28FiatWithdrawals
{stock_us}(INTC.US)
⚠️ INTCの強気派が9万8,200ドルの損失——売り圧力が強まる!
最新の清算データによると、インテルの強気派は痛手を受けました。約9万8,200ドル相当のレバレッジをかけたロングポジションが63.23ドル付近で清算され、さらなる上昇に賭けていたトレーダーが直面するリスクが浮き彫りになりました。
📊 ポジション状況
資産:インテル($INTC)
清算サイド:ロング 🔴
清算総額:9万8,200ドル
清算価格:63.23ドル
🔍 次に何が起こる?
焦点は、この清算イベント後にINTCが安定するかどうかです。
📉 下落シナリオ:売り手が主導権を維持し、価格が63.23ドルを回復できなければ、弱い買い手がポジションを手放すなか、さらなる下落が起こる可能性があります。
📈 回復シナリオ:出来高を伴って63.23ドルを明確に奪回すれば、反発のきっかけとなり、ショート勢を踏み上げる可能性もあります。
🎯 私のトレード見解:短期的には慎重な姿勢が必要です。強気のエントリーを検討する前に、確認を待ちたいところです。63.23ドル付近を注視してください。市場の反応が次の方向性を示す手がかりになるかもしれません。
注意:清算データが示すのは、レバレッジをかけたトレーダーが捕まった価格帯であり、次に価格が向かう先ではありません。リスクを管理し、感情に任せたエントリーは避けましょう。
#INTC #インテル #清算アラート #トレードシグナル #マーケットウォッチ #CryptoAndStocks
#USOctoberNFP-AreRateCutsStillPossible #AppleEarningsAhead-CanStockHitNewHigh #Verify1to1BinanceReserves #BinanceRestores28FiatWithdrawals
最新の清算データによると、インテルの強気派は痛手を受けました。約9万8,200ドル相当のレバレッジをかけたロングポジションが63.23ドル付近で清算され、さらなる上昇に賭けていたトレーダーが直面するリスクが浮き彫りになりました。
📊 ポジション状況
資産:インテル($INTC)
清算サイド:ロング 🔴
清算総額:9万8,200ドル
清算価格:63.23ドル
🔍 次に何が起こる?
焦点は、この清算イベント後にINTCが安定するかどうかです。
📉 下落シナリオ:売り手が主導権を維持し、価格が63.23ドルを回復できなければ、弱い買い手がポジションを手放すなか、さらなる下落が起こる可能性があります。
📈 回復シナリオ:出来高を伴って63.23ドルを明確に奪回すれば、反発のきっかけとなり、ショート勢を踏み上げる可能性もあります。
🎯 私のトレード見解:短期的には慎重な姿勢が必要です。強気のエントリーを検討する前に、確認を待ちたいところです。63.23ドル付近を注視してください。市場の反応が次の方向性を示す手がかりになるかもしれません。
注意:清算データが示すのは、レバレッジをかけたトレーダーが捕まった価格帯であり、次に価格が向かう先ではありません。リスクを管理し、感情に任せたエントリーは避けましょう。
#INTC #インテル #清算アラート #トレードシグナル #マーケットウォッチ #CryptoAndStocks
#USOctoberNFP-AreRateCutsStillPossible #AppleEarningsAhead-CanStockHitNewHigh #Verify1to1BinanceReserves #BinanceRestores28FiatWithdrawals
45
·
--
🚨 INTCの弱気派が再び攻勢 — ロングポジションに圧力! 🔴
Intelのデリバティブ市場で、また警戒シグナルが出現!
💥 ロングの清算額:$98.2K
📍 清算価格:$63.23
📉 市場シグナル:レバレッジをかけたロングポジションが一掃され、強気派のトレーダーは再び圧力にさらされています。
🎯 私のトレード見通し:
さらなる下落圧力を防ぐには、INTCは$63.00~$63.20の水準を守る必要があります。売り手が主導権を維持すれば、さらに深い調整が続く可能性があります。ただし、$63.50を上回る力強い回復があれば、反発のきっかけとなり、買い手が再び市場に戻ってくるかもしれません。
注目すべき主要水準:
サポート:$63.00
レジスタンス:$63.50~$64.00
弱気シナリオ:サポートを下抜け。
強気シナリオ:レジスタンスを力強く上抜け。
⚠️ シグナル提供者の見解:レバレッジをかけたロングに慌てて飛び乗るのは避けましょう。確認を待ち、出来高を注視し、慎重にリスクを管理してください。1回の清算イベントで次の方向性が決まるわけではありません。
#INTC #Intel #清算 #トレードシグナル #マーケットウォッチ #CryptoAndStocks
#USOctoberNFP-AreRateCutsStillPossible #AppleEarningsAhead-CanStockHitNewHigh #Verify1to1BinanceReserves #BinanceRestores28FiatWithdrawals
{stock_us}(INTC.US)
🚨 INTCの弱気派が再び攻勢 — ロングポジションに圧力! 🔴
Intelのデリバティブ市場で、また警戒シグナルが出現!
💥 ロングの清算額:$98.2K
📍 清算価格:$63.23
📉 市場シグナル:レバレッジをかけたロングポジションが一掃され、強気派のトレーダーは再び圧力にさらされています。
🎯 私のトレード見通し:
さらなる下落圧力を防ぐには、INTCは$63.00~$63.20の水準を守る必要があります。売り手が主導権を維持すれば、さらに深い調整が続く可能性があります。ただし、$63.50を上回る力強い回復があれば、反発のきっかけとなり、買い手が再び市場に戻ってくるかもしれません。
注目すべき主要水準:
サポート:$63.00
レジスタンス:$63.50~$64.00
弱気シナリオ:サポートを下抜け。
強気シナリオ:レジスタンスを力強く上抜け。
⚠️ シグナル提供者の見解:レバレッジをかけたロングに慌てて飛び乗るのは避けましょう。確認を待ち、出来高を注視し、慎重にリスクを管理してください。1回の清算イベントで次の方向性が決まるわけではありません。
#INTC #Intel #清算 #トレードシグナル #マーケットウォッチ #CryptoAndStocks
#USOctoberNFP-AreRateCutsStillPossible #AppleEarningsAhead-CanStockHitNewHigh #Verify1to1BinanceReserves #BinanceRestores28FiatWithdrawals
Intelのデリバティブ市場で、また警戒シグナルが出現!
💥 ロングの清算額:$98.2K
📍 清算価格:$63.23
📉 市場シグナル:レバレッジをかけたロングポジションが一掃され、強気派のトレーダーは再び圧力にさらされています。
🎯 私のトレード見通し:
さらなる下落圧力を防ぐには、INTCは$63.00~$63.20の水準を守る必要があります。売り手が主導権を維持すれば、さらに深い調整が続く可能性があります。ただし、$63.50を上回る力強い回復があれば、反発のきっかけとなり、買い手が再び市場に戻ってくるかもしれません。
注目すべき主要水準:
サポート:$63.00
レジスタンス:$63.50~$64.00
弱気シナリオ:サポートを下抜け。
強気シナリオ:レジスタンスを力強く上抜け。
⚠️ シグナル提供者の見解:レバレッジをかけたロングに慌てて飛び乗るのは避けましょう。確認を待ち、出来高を注視し、慎重にリスクを管理してください。1回の清算イベントで次の方向性が決まるわけではありません。
#INTC #Intel #清算 #トレードシグナル #マーケットウォッチ #CryptoAndStocks
#USOctoberNFP-AreRateCutsStillPossible #AppleEarningsAhead-CanStockHitNewHigh #Verify1to1BinanceReserves #BinanceRestores28FiatWithdrawals
24

🚀 VIXY市場分析 | トレーダー注目
$VIXY.ETF はボラティリティに特化したETFであり、市場の不確実性が高まる局面で注目すべき重要な資産です。
📊 トレード戦略:
強気:出来高を伴ってレジスタンスを上抜けるか注目しましょう。
弱気:レジスタンスで反落すれば、下落のチャンスとなる可能性があります。
エントリー:ブレイクアウトの確認、またはリテストの成功を待ちましょう。
リスク管理:損切りを設定し、急な値動きを追いかけないようにしましょう。
🔥 トレーダーへの警告:ポジションを取る前に、ボラティリティ、市場センチメント、出来高を確認しましょう。
VIXYのロングまたはショートのセットアップに注目していますか?
#VIXY #Trading #MarketAnalysis #Volatility #ETF #CryptoAndStocks
{etf_us}(VIXY.ETF)
🚀 VIXY市場分析 | トレーダー注目
$VIXY.ETF はボラティリティに特化したETFであり、市場の不確実性が高まる局面で注目すべき重要な資産です。
📊 トレード戦略:
強気:出来高を伴ってレジスタンスを上抜けるか注目しましょう。
弱気:レジスタンスで反落すれば、下落のチャンスとなる可能性があります。
エントリー:ブレイクアウトの確認、またはリテストの成功を待ちましょう。
リスク管理:損切りを設定し、急な値動きを追いかけないようにしましょう。
🔥 トレーダーへの警告:ポジションを取る前に、ボラティリティ、市場センチメント、出来高を確認しましょう。
VIXYのロングまたはショートのセットアップに注目していますか?
#VIXY #Trading #MarketAnalysis #Volatility #ETF #CryptoAndStocks
$VIXY.ETF はボラティリティに特化したETFであり、市場の不確実性が高まる局面で注目すべき重要な資産です。
📊 トレード戦略:
強気:出来高を伴ってレジスタンスを上抜けるか注目しましょう。
弱気:レジスタンスで反落すれば、下落のチャンスとなる可能性があります。
エントリー:ブレイクアウトの確認、またはリテストの成功を待ちましょう。
リスク管理:損切りを設定し、急な値動きを追いかけないようにしましょう。
🔥 トレーダーへの警告:ポジションを取る前に、ボラティリティ、市場センチメント、出来高を確認しましょう。
VIXYのロングまたはショートのセットアップに注目していますか?
#VIXY #Trading #MarketAnalysis #Volatility #ETF #CryptoAndStocks
4
·
--
🚨 #MU ショートスクイーズ警報 — 次の動きが極めて重要になる可能性! ⚡
🟢 ショート清算額:$95.9K
💰 清算価格:$958.77
Micron Technology(#MU)で、$95.9Kのショートポジション清算が発生し、レバレッジをかけた弱気ポジションに圧力がかかっています。買い手が価格を押し上げられるのか、それとも売り手が主導権を取り戻すのかをトレーダーが見極めるうえで、注目すべきシグナルです。
📊 🔍 プロの市場見通し
🐂 強気シナリオ:MUが近くのサポートを維持し、買いの出来高が増加すれば、さらなる上昇によって追加のショート清算が発生する可能性があります。
🐻 弱気シナリオ:価格が勢いを維持できず、サポートを割り込めば、売り手が主導権を取り戻し、反落を招く可能性があります。
🎯 重要な確認ポイント:エントリーを検討する前に、値動き、取引量、そして次のサポートまたはレジスタンスのブレイクアウトを確認しましょう。
🔥 私の見解:今回の清算イベントにより、ショートスクイーズの可能性が注目されていますが、上昇が続くことを示すものではありません。値動きを追いかけるのではなく、次の方向性が明らかになるのを待ちましょう。
⚠️ リスク管理:確認を待ち、適切な損切り水準を設定し、過度なレバレッジは避けましょう。清算データだけでは、買い・売りのシグナルにはなりません。
#MU #MicronTechnology #ショートスクイーズ #トレードシグナル #市場分析 #CryptoAndStocks
#CanGoogleDefindItsCore #OSMOPlansToBurn100MTokensFromCommunityPool #MoodysAssignsRLUSDA2LongTermDepositRating #CanGoogleDefindItsCore
{future}(MUUUSDT)
🚨 #MU ショートスクイーズ警報 — 次の動きが極めて重要になる可能性! ⚡
🟢 ショート清算額:$95.9K
💰 清算価格:$958.77
Micron Technology(#MU)で、$95.9Kのショートポジション清算が発生し、レバレッジをかけた弱気ポジションに圧力がかかっています。買い手が価格を押し上げられるのか、それとも売り手が主導権を取り戻すのかをトレーダーが見極めるうえで、注目すべきシグナルです。
📊 🔍 プロの市場見通し
🐂 強気シナリオ:MUが近くのサポートを維持し、買いの出来高が増加すれば、さらなる上昇によって追加のショート清算が発生する可能性があります。
🐻 弱気シナリオ:価格が勢いを維持できず、サポートを割り込めば、売り手が主導権を取り戻し、反落を招く可能性があります。
🎯 重要な確認ポイント:エントリーを検討する前に、値動き、取引量、そして次のサポートまたはレジスタンスのブレイクアウトを確認しましょう。
🔥 私の見解:今回の清算イベントにより、ショートスクイーズの可能性が注目されていますが、上昇が続くことを示すものではありません。値動きを追いかけるのではなく、次の方向性が明らかになるのを待ちましょう。
⚠️ リスク管理:確認を待ち、適切な損切り水準を設定し、過度なレバレッジは避けましょう。清算データだけでは、買い・売りのシグナルにはなりません。
#MU #MicronTechnology #ショートスクイーズ #トレードシグナル #市場分析 #CryptoAndStocks
#CanGoogleDefindItsCore #OSMOPlansToBurn100MTokensFromCommunityPool #MoodysAssignsRLUSDA2LongTermDepositRating #CanGoogleDefindItsCore
🟢 ショート清算額:$95.9K
💰 清算価格:$958.77
Micron Technology(#MU)で、$95.9Kのショートポジション清算が発生し、レバレッジをかけた弱気ポジションに圧力がかかっています。買い手が価格を押し上げられるのか、それとも売り手が主導権を取り戻すのかをトレーダーが見極めるうえで、注目すべきシグナルです。
📊 🔍 プロの市場見通し
🐂 強気シナリオ:MUが近くのサポートを維持し、買いの出来高が増加すれば、さらなる上昇によって追加のショート清算が発生する可能性があります。
🐻 弱気シナリオ:価格が勢いを維持できず、サポートを割り込めば、売り手が主導権を取り戻し、反落を招く可能性があります。
🎯 重要な確認ポイント:エントリーを検討する前に、値動き、取引量、そして次のサポートまたはレジスタンスのブレイクアウトを確認しましょう。
🔥 私の見解:今回の清算イベントにより、ショートスクイーズの可能性が注目されていますが、上昇が続くことを示すものではありません。値動きを追いかけるのではなく、次の方向性が明らかになるのを待ちましょう。
⚠️ リスク管理:確認を待ち、適切な損切り水準を設定し、過度なレバレッジは避けましょう。清算データだけでは、買い・売りのシグナルにはなりません。
#MU #MicronTechnology #ショートスクイーズ #トレードシグナル #市場分析 #CryptoAndStocks
#CanGoogleDefindItsCore #OSMOPlansToBurn100MTokensFromCommunityPool #MoodysAssignsRLUSDA2LongTermDepositRating #CanGoogleDefindItsCore
1

·
--

記事
Binance Pickの決算シーズンを攻略する方法:$AMZN、$GOOGLB、$MSFTの注目取引機会#earningsseason
Binance公式の予測プラットフォーム「Binance Pick」に、新しい「Finance Earnings」予測セクションが登場しました。トレーダーや投資家は、市場分析の腕を試し、ポイントを獲得し、Binance Squareで大きなトラフィック増加を得る貴重な機会を手にできます!
四半期決算が市場予想を上回るか予測する場合も、決算発表後の株価の勢いを分析する場合も、Binance Squareで毎日、自分の分析を共有することが、フォロワーを増やして追加報酬を獲得する最速の方法です。
ここでは、毎日の予測を最適化する方法を解説し、テック大手の$AMZN、$GOOGLB、$MSFTに関する重要な取引機会をご紹介します。
Binance Pickの決算シーズンを攻略する方法:$AMZN、$GOOGLB、$MSFTの注目取引機会
#earningsseason
Binance公式の予測プラットフォーム「Binance Pick」に、新しい「Finance Earnings」予測セクションが登場しました。トレーダーや投資家は、市場分析の腕を試し、ポイントを獲得し、Binance Squareで大きなトラフィック増加を得る貴重な機会を手にできます!
四半期決算が市場予想を上回るか予測する場合も、決算発表後の株価の勢いを分析する場合も、Binance Squareで毎日、自分の分析を共有することが、フォロワーを増やして追加報酬を獲得する最速の方法です。
ここでは、毎日の予測を最適化する方法を解説し、テック大手の$AMZN 、$GOOGLB 、$MSFT に関する重要な取引機会をご紹介します。
Binance公式の予測プラットフォーム「Binance Pick」に、新しい「Finance Earnings」予測セクションが登場しました。トレーダーや投資家は、市場分析の腕を試し、ポイントを獲得し、Binance Squareで大きなトラフィック増加を得る貴重な機会を手にできます!
四半期決算が市場予想を上回るか予測する場合も、決算発表後の株価の勢いを分析する場合も、Binance Squareで毎日、自分の分析を共有することが、フォロワーを増やして追加報酬を獲得する最速の方法です。
ここでは、毎日の予測を最適化する方法を解説し、テック大手の$AMZN 、$GOOGLB 、$MSFT に関する重要な取引機会をご紹介します。
140

·
--
�
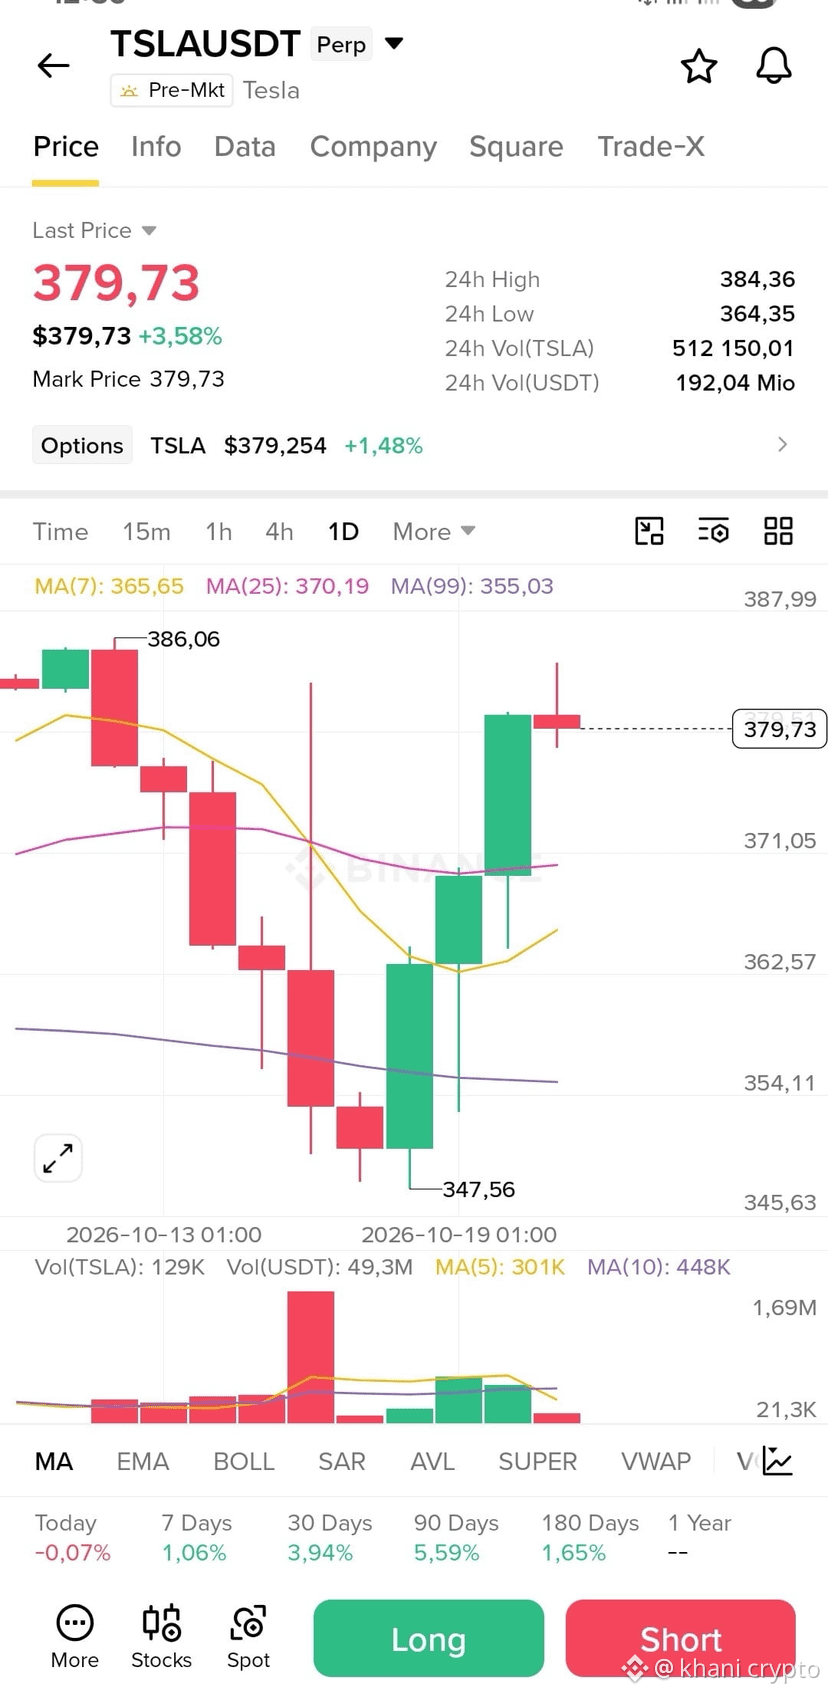
Tesla ($TSLA )は、10月21日水曜日の米国市場終了後に第3四半期決算を発表する予定です。多くのアナリストが1株当たり利益(EPS)に注目するなか、より重要な問いは「市場はどの程度の株価変動を織り込んでいるのか?」です。👀
📊 注目すべき数字:
🔹 Tesla株の決算発表後の通常の値動きは平均約4.5%。一方、算術平均は約7.8%で、これは例外的に大きな値動きが2回あったことで押し上げられています。
🔹 現在、オプション価格はより高い水準に近い値動きを織り込んでおり、大きな変動が予想されていることを示しています。
🔹 納車台数はすでに明らかになっており、Teslaは10月2日に486,532台の納車を発表しました。そのため、今回のサプライズは納車台数そのものよりも、利益率や今後の見通しに左右される可能性が高いでしょう。
⚠️ リスク管理において、なぜこれが重要なのでしょうか?
• 市場終了後の予想外の値動きによって、通常の損切り水準を飛び越えることがあり、実際の決済価格があらかじめ設定した価格と異なる可能性があります。
• 4%の値動きを想定した適切なポジションサイズでも、株価が8%動けば大きすぎて危険な場合があります。
• 過去の例外的な値動きは、大きなリスクが単なる理論上の可能性ではなく、現実に起こり得ることを示しています 👇🔥
$TSLA
表示価格:378.87$ | 変動率:+3.05%
#Tesla #TSLA #EarningsSeason #CryptoAndStocks #Trading
{future}(TSLAUSDT)
�
Tesla ($TSLA )は、10月21日水曜日の米国市場終了後に第3四半期決算を発表する予定です。多くのアナリストが1株当たり利益(EPS)に注目するなか、より重要な問いは「市場はどの程度の株価変動を織り込んでいるのか?」です。👀
📊 注目すべき数字:
🔹 Tesla株の決算発表後の通常の値動きは平均約4.5%。一方、算術平均は約7.8%で、これは例外的に大きな値動きが2回あったことで押し上げられています。
🔹 現在、オプション価格はより高い水準に近い値動きを織り込んでおり、大きな変動が予想されていることを示しています。
🔹 納車台数はすでに明らかになっており、Teslaは10月2日に486,532台の納車を発表しました。そのため、今回のサプライズは納車台数そのものよりも、利益率や今後の見通しに左右される可能性が高いでしょう。
⚠️ リスク管理において、なぜこれが重要なのでしょうか?
• 市場終了後の予想外の値動きによって、通常の損切り水準を飛び越えることがあり、実際の決済価格があらかじめ設定した価格と異なる可能性があります。
• 4%の値動きを想定した適切なポジションサイズでも、株価が8%動けば大きすぎて危険な場合があります。
• 過去の例外的な値動きは、大きなリスクが単なる理論上の可能性ではなく、現実に起こり得ることを示しています 👇🔥
$TSLA
表示価格:378.87$ | 変動率:+3.05%
#Tesla #TSLA #EarningsSeason #CryptoAndStocks #Trading
Tesla ($TSLA )は、10月21日水曜日の米国市場終了後に第3四半期決算を発表する予定です。多くのアナリストが1株当たり利益(EPS)に注目するなか、より重要な問いは「市場はどの程度の株価変動を織り込んでいるのか?」です。👀
📊 注目すべき数字:
🔹 Tesla株の決算発表後の通常の値動きは平均約4.5%。一方、算術平均は約7.8%で、これは例外的に大きな値動きが2回あったことで押し上げられています。
🔹 現在、オプション価格はより高い水準に近い値動きを織り込んでおり、大きな変動が予想されていることを示しています。
🔹 納車台数はすでに明らかになっており、Teslaは10月2日に486,532台の納車を発表しました。そのため、今回のサプライズは納車台数そのものよりも、利益率や今後の見通しに左右される可能性が高いでしょう。
⚠️ リスク管理において、なぜこれが重要なのでしょうか?
• 市場終了後の予想外の値動きによって、通常の損切り水準を飛び越えることがあり、実際の決済価格があらかじめ設定した価格と異なる可能性があります。
• 4%の値動きを想定した適切なポジションサイズでも、株価が8%動けば大きすぎて危険な場合があります。
• 過去の例外的な値動きは、大きなリスクが単なる理論上の可能性ではなく、現実に起こり得ることを示しています 👇🔥
$TSLA
表示価格:378.87$ | 変動率:+3.05%
#Tesla #TSLA #EarningsSeason #CryptoAndStocks #Trading
149

記事
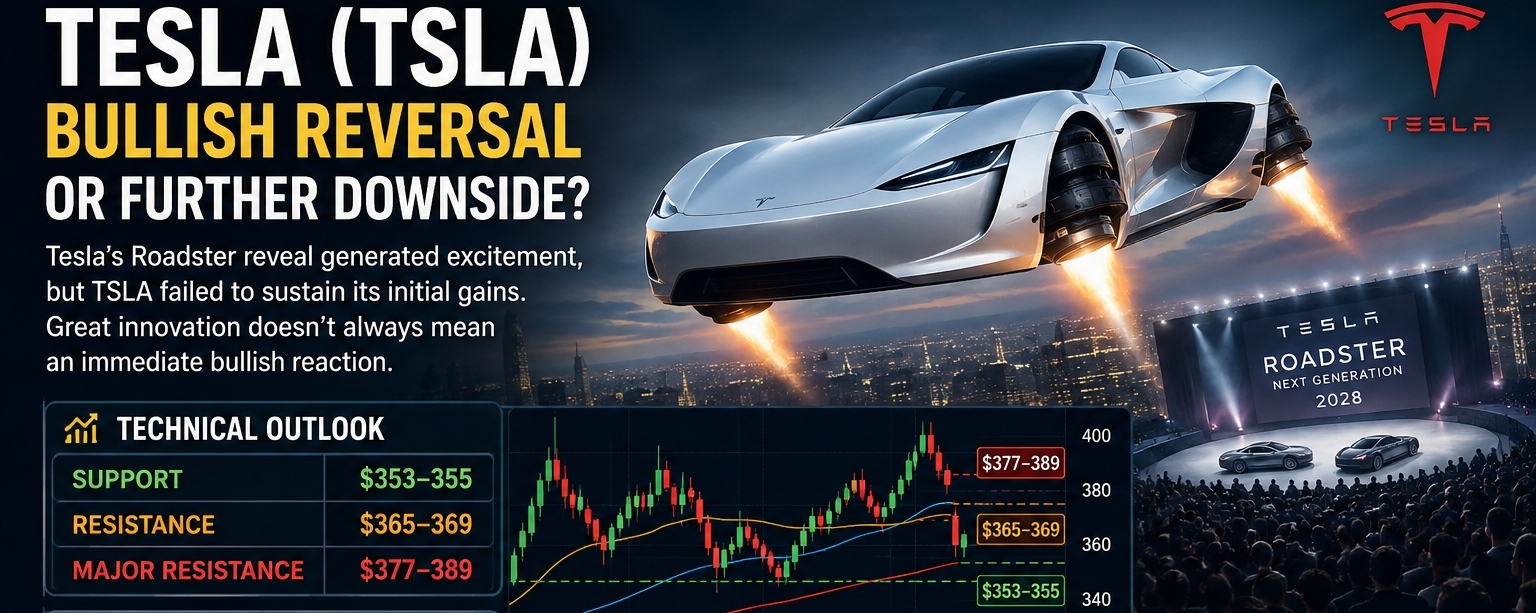
🚨 TESLA (TSLA):空飛ぶロードスター公開後、なぜ株価は下落しているのか?テスラのロードスター公開は大きな期待を集めましたが、TSLAは初動の上昇を維持できませんでした。これは市場の重要な原則を示しています。優れたイノベーションが、必ずしもすぐに強気の反応につながるとは限りません。
🔍 ファンダメンタルズの見方
ロードスターはテスラの技術力に関する評価を高める可能性がありますが、生産開始は2028年を目標としています。投資家は今後、業績、利益率、キャッシュフロー、将来の見通しにより注目するでしょう。
📈 強気シナリオ:サポートラインを維持し、強い出来高を伴って369ドルを上抜ければ、さらに上のレジスタンスを目指す展開が期待できます。
🚨 TESLA (TSLA):空飛ぶロードスター公開後、なぜ株価は下落しているのか?
テスラのロードスター公開は大きな期待を集めましたが、TSLAは初動の上昇を維持できませんでした。これは市場の重要な原則を示しています。優れたイノベーションが、必ずしもすぐに強気の反応につながるとは限りません。
🔍 ファンダメンタルズの見方
ロードスターはテスラの技術力に関する評価を高める可能性がありますが、生産開始は2028年を目標としています。投資家は今後、業績、利益率、キャッシュフロー、将来の見通しにより注目するでしょう。
📈 強気シナリオ:サポートラインを維持し、強い出来高を伴って369ドルを上抜ければ、さらに上のレジスタンスを目指す展開が期待できます。
🔍 ファンダメンタルズの見方
ロードスターはテスラの技術力に関する評価を高める可能性がありますが、生産開始は2028年を目標としています。投資家は今後、業績、利益率、キャッシュフロー、将来の見通しにより注目するでしょう。
📈 強気シナリオ:サポートラインを維持し、強い出来高を伴って369ドルを上抜ければ、さらに上のレジスタンスを目指す展開が期待できます。
2
2
482

·
--
🚨 SNDKに売り圧力!⚠️ ロングポジションが一掃
🔴 #SNDK ロング清算:$1,456.00で$147K
強気派と弱気派の攻防が激化しています!💥 $1,456.00で147,000ドル相当のロングポジションが清算されたことは、レバレッジをかけた買い手が市場から退出させられ、短期的な市場心理に圧力がかかっていることを示しています。
📉 これは何を意味する?
- 🔻 弱気警戒:売りが続けば、ロング清算によって下落の勢いが強まる可能性があります。
- ⚡ ボラティリティ警戒:近くのサポートゾーンやレジスタンスゾーンでは、急激な値動きに備えましょう。
- 🎯 重要な注目点:SNDKが清算価格帯を回復できなければ、売り手がさらに下値を試す可能性があります。
🔮 次の値動きの見通し
短期的な見方:買い手が力強い回復を示すまでは、慎重に弱気。
🐻 弱気シナリオ:軟調な展開が続けば、さらなる下落につながる可能性があります。特に、強い出来高を伴ってサポートを割り込んだ場合は要注意です。
🐂 強気への反転:1,456ドルを力強く回復し、その後も買い圧力が続けば、強気派が主導権を取り戻しつつある兆候となる可能性があります。
📊 プロトレーダーの見解:値動きをむやみに追いかけないこと。取引に入る前に、価格動向、出来高、重要水準での確認を見極めましょう。清算が一度起きただけでは、トレンド反転の確認にはなりません。
🔥 SNDKは回復するのか、それとも売り手が再び攻勢に出るのか?
👇 コメントであなたの相場観をシェアしてください!
📢 清算アラート、市場分析、トレード戦略をさらにチェックするにはフォローしてください。
⚠️ これは市場に関するコメントであり、金融アドバイスではありません。清算データだけで次の値動きを予測することはできません。常にリスク管理を徹底してください。
#SNDK #StockMarket #LiquidationAlert #TradingSignals #MarketAnalysis #CryptoAndStocks
#LedgerAsksSoutheastAsiaHKResellersToHaltSales #USEthereumETFsSee10StraightDaysOfOutflows #AvalancheSaysKoreaKSDPlatformWillSupportItsLedger #UKHighCourtRulesChineseLawGovernsBitcoinClaims
{stock_us}(SNDK.US)
🚨 SNDKに売り圧力!⚠️ ロングポジションが一掃
🔴 #SNDK ロング清算:$1,456.00で$147K
強気派と弱気派の攻防が激化しています!💥 $1,456.00で147,000ドル相当のロングポジションが清算されたことは、レバレッジをかけた買い手が市場から退出させられ、短期的な市場心理に圧力がかかっていることを示しています。
📉 これは何を意味する?
- 🔻 弱気警戒:売りが続けば、ロング清算によって下落の勢いが強まる可能性があります。
- ⚡ ボラティリティ警戒:近くのサポートゾーンやレジスタンスゾーンでは、急激な値動きに備えましょう。
- 🎯 重要な注目点:SNDKが清算価格帯を回復できなければ、売り手がさらに下値を試す可能性があります。
🔮 次の値動きの見通し
短期的な見方:買い手が力強い回復を示すまでは、慎重に弱気。
🐻 弱気シナリオ:軟調な展開が続けば、さらなる下落につながる可能性があります。特に、強い出来高を伴ってサポートを割り込んだ場合は要注意です。
🐂 強気への反転:1,456ドルを力強く回復し、その後も買い圧力が続けば、強気派が主導権を取り戻しつつある兆候となる可能性があります。
📊 プロトレーダーの見解:値動きをむやみに追いかけないこと。取引に入る前に、価格動向、出来高、重要水準での確認を見極めましょう。清算が一度起きただけでは、トレンド反転の確認にはなりません。
🔥 SNDKは回復するのか、それとも売り手が再び攻勢に出るのか?
👇 コメントであなたの相場観をシェアしてください!
📢 清算アラート、市場分析、トレード戦略をさらにチェックするにはフォローしてください。
⚠️ これは市場に関するコメントであり、金融アドバイスではありません。清算データだけで次の値動きを予測することはできません。常にリスク管理を徹底してください。
#SNDK #StockMarket #LiquidationAlert #TradingSignals #MarketAnalysis #CryptoAndStocks
#LedgerAsksSoutheastAsiaHKResellersToHaltSales #USEthereumETFsSee10StraightDaysOfOutflows #AvalancheSaysKoreaKSDPlatformWillSupportItsLedger #UKHighCourtRulesChineseLawGovernsBitcoinClaims
🔴 #SNDK ロング清算:$1,456.00で$147K
強気派と弱気派の攻防が激化しています!💥 $1,456.00で147,000ドル相当のロングポジションが清算されたことは、レバレッジをかけた買い手が市場から退出させられ、短期的な市場心理に圧力がかかっていることを示しています。
📉 これは何を意味する?
- 🔻 弱気警戒:売りが続けば、ロング清算によって下落の勢いが強まる可能性があります。
- ⚡ ボラティリティ警戒:近くのサポートゾーンやレジスタンスゾーンでは、急激な値動きに備えましょう。
- 🎯 重要な注目点:SNDKが清算価格帯を回復できなければ、売り手がさらに下値を試す可能性があります。
🔮 次の値動きの見通し
短期的な見方:買い手が力強い回復を示すまでは、慎重に弱気。
🐻 弱気シナリオ:軟調な展開が続けば、さらなる下落につながる可能性があります。特に、強い出来高を伴ってサポートを割り込んだ場合は要注意です。
🐂 強気への反転:1,456ドルを力強く回復し、その後も買い圧力が続けば、強気派が主導権を取り戻しつつある兆候となる可能性があります。
📊 プロトレーダーの見解:値動きをむやみに追いかけないこと。取引に入る前に、価格動向、出来高、重要水準での確認を見極めましょう。清算が一度起きただけでは、トレンド反転の確認にはなりません。
🔥 SNDKは回復するのか、それとも売り手が再び攻勢に出るのか?
👇 コメントであなたの相場観をシェアしてください!
📢 清算アラート、市場分析、トレード戦略をさらにチェックするにはフォローしてください。
⚠️ これは市場に関するコメントであり、金融アドバイスではありません。清算データだけで次の値動きを予測することはできません。常にリスク管理を徹底してください。
#SNDK #StockMarket #LiquidationAlert #TradingSignals #MarketAnalysis #CryptoAndStocks
#LedgerAsksSoutheastAsiaHKResellersToHaltSales #USEthereumETFsSee10StraightDaysOfOutflows #AvalancheSaysKoreaKSDPlatformWillSupportItsLedger #UKHighCourtRulesChineseLawGovernsBitcoinClaims
8
·
--
🚨 SNDKアラート:ロングポジションが一掃!🔻
🔴 #SNDK ロングの清算:$1,425.06で$142,000
⚠️ 強気派に圧力—さらなる押し目が来るのか?
SNDKでは14万2,000ドル相当のロングポジションが清算され、$1,425.06付近でレバレッジをかけて買っていたトレーダーが直面するリスクが浮き彫りになりました。この出来事は強制的なポジション決済を示していますが、次の動きは、価格が近くのサポート付近でどう反応するかに左右されます。
📉 SNDKの次の展開は?
🔻 弱気シナリオ:売り圧力が続き、価格が直近のサポートを下抜けた場合、さらに多くのレバレッジ・ロングが清算され、SNDKの下落が続く可能性があります。
🟢 強気の回復:買い手がサポートを守り、清算ゾーンを奪回すれば、売り手の勢いが弱まるにつれて反発に発展する可能性があります。
🎯 プロのトレード見解:
- バイアス:価格が安定するまでは慎重、または弱気。
- 重要な注目点:次のサポートテストと出来高による確認。
- 強気の確認材料:ブレイクダウンした価格帯を力強く奪回すること。
- リスク管理:ローソク足を追いかけて飛び乗らず、エントリー前に確認を待ちましょう。
🔥 私の見解:今回の清算は強気派への警告ですが、さらなる下落を保証するものではありません。これが深い調整の始まりなのか、回復前の振るい落としなのか、値動きで確認しましょう。
📌 市場アラート、清算分析、トレードのセットアップをもっと見るにはフォローしてください。
⚠️ これは市場に関するコメントであり、金融アドバイスではありません。清算データだけでは次の価格動向を判断できません。常にリスク管理を徹底してください。
#SNDK #TradingSignals #LiquidationAlert #MarketAnalysis #CryptoAndStocks
#SeptemberCPIWatch #BTCDominanceBackAt60% #UKHighCourtRulesChineseLawGovernsBitcoinClaims #RBNZPausesDigitalCashDevelopment
{stock_us}(SNDK.US)
🚨 SNDKアラート:ロングポジションが一掃!🔻
🔴 #SNDK ロングの清算:$1,425.06で$142,000
⚠️ 強気派に圧力—さらなる押し目が来るのか?
SNDKでは14万2,000ドル相当のロングポジションが清算され、$1,425.06付近でレバレッジをかけて買っていたトレーダーが直面するリスクが浮き彫りになりました。この出来事は強制的なポジション決済を示していますが、次の動きは、価格が近くのサポート付近でどう反応するかに左右されます。
📉 SNDKの次の展開は?
🔻 弱気シナリオ:売り圧力が続き、価格が直近のサポートを下抜けた場合、さらに多くのレバレッジ・ロングが清算され、SNDKの下落が続く可能性があります。
🟢 強気の回復:買い手がサポートを守り、清算ゾーンを奪回すれば、売り手の勢いが弱まるにつれて反発に発展する可能性があります。
🎯 プロのトレード見解:
- バイアス:価格が安定するまでは慎重、または弱気。
- 重要な注目点:次のサポートテストと出来高による確認。
- 強気の確認材料:ブレイクダウンした価格帯を力強く奪回すること。
- リスク管理:ローソク足を追いかけて飛び乗らず、エントリー前に確認を待ちましょう。
🔥 私の見解:今回の清算は強気派への警告ですが、さらなる下落を保証するものではありません。これが深い調整の始まりなのか、回復前の振るい落としなのか、値動きで確認しましょう。
📌 市場アラート、清算分析、トレードのセットアップをもっと見るにはフォローしてください。
⚠️ これは市場に関するコメントであり、金融アドバイスではありません。清算データだけでは次の価格動向を判断できません。常にリスク管理を徹底してください。
#SNDK #TradingSignals #LiquidationAlert #MarketAnalysis #CryptoAndStocks
#SeptemberCPIWatch #BTCDominanceBackAt60% #UKHighCourtRulesChineseLawGovernsBitcoinClaims #RBNZPausesDigitalCashDevelopment
🔴 #SNDK ロングの清算:$1,425.06で$142,000
⚠️ 強気派に圧力—さらなる押し目が来るのか?
SNDKでは14万2,000ドル相当のロングポジションが清算され、$1,425.06付近でレバレッジをかけて買っていたトレーダーが直面するリスクが浮き彫りになりました。この出来事は強制的なポジション決済を示していますが、次の動きは、価格が近くのサポート付近でどう反応するかに左右されます。
📉 SNDKの次の展開は?
🔻 弱気シナリオ:売り圧力が続き、価格が直近のサポートを下抜けた場合、さらに多くのレバレッジ・ロングが清算され、SNDKの下落が続く可能性があります。
🟢 強気の回復:買い手がサポートを守り、清算ゾーンを奪回すれば、売り手の勢いが弱まるにつれて反発に発展する可能性があります。
🎯 プロのトレード見解:
- バイアス:価格が安定するまでは慎重、または弱気。
- 重要な注目点:次のサポートテストと出来高による確認。
- 強気の確認材料:ブレイクダウンした価格帯を力強く奪回すること。
- リスク管理:ローソク足を追いかけて飛び乗らず、エントリー前に確認を待ちましょう。
🔥 私の見解:今回の清算は強気派への警告ですが、さらなる下落を保証するものではありません。これが深い調整の始まりなのか、回復前の振るい落としなのか、値動きで確認しましょう。
📌 市場アラート、清算分析、トレードのセットアップをもっと見るにはフォローしてください。
⚠️ これは市場に関するコメントであり、金融アドバイスではありません。清算データだけでは次の価格動向を判断できません。常にリスク管理を徹底してください。
#SNDK #TradingSignals #LiquidationAlert #MarketAnalysis #CryptoAndStocks
#SeptemberCPIWatch #BTCDominanceBackAt60% #UKHighCourtRulesChineseLawGovernsBitcoinClaims #RBNZPausesDigitalCashDevelopment
40
·
--
⚠️ NBISに圧力!ロングポジション54.2Kドルが清算 — 次に何が起きる? 📉
🔴 #NBIS ロング清算:210.43ドルで54.2Kドル
レバレッジをかけた強気派に、市場から警告の一撃が放たれました!💥 210.43ドルで54,200ドル相当のロングポジションが清算され、価格がポジションと逆方向に動いた場合に買い手が直面するリスクが浮き彫りになりました。NBISが落ち着きを取り戻すのか、それとも売りが再び広がるのか、トレーダーは注視しましょう。
📊 トレードデスクの見通し
🔻 弱気シナリオ:NBISが210.43ドル付近を回復できず、売り手が主導権を握り続ける場合、下落が続く可能性があります。勢いの弱まりや、新たな清算の集中に注目しましょう。
🚀 強気の回復シナリオ:買い手がこの水準を取り戻し、十分な出来高を伴って維持できれば、NBISは反発を試み、ショート勢を踏み上げる可能性があります。
🎯 私の戦略的見解:落ちてくるナイフをつかむのは避けましょう。まずは価格の方向性が定まるのを待つこと。重要なのは、210.43ドルが抵抗線になるのか、それとも買い手がこの水準を取り戻せるのかです。
🔎 注目すべきシグナル:
210.43ドル付近での価格反応
回復時の出来高による裏付け
テクノロジー市場全体のセンチメント
新たなロング・ショートの清算
🛡️ まずはリスク管理を:清算が1件あっただけでは、トレンド転換が確定したとは言えません。明確なセットアップを待ち、損切りラインを設定し、ポジションサイズを慎重に管理しましょう。
#NBIS #LiquidationAlert #TradingStrategy #MarketAnalysis #PriceAction #CryptoAndStocks
#SolanaETFsEnd14WeekInflowStreak #BitcoinOptionsVolatilityHitsFiveYearLow #SolanaETFsEnd14WeekInflowStreak #BitcoinOptionsVolatilityHitsFiveYearLow
{stock_us}(NBIS.US)
⚠️ NBISに圧力!ロングポジション54.2Kドルが清算 — 次に何が起きる? 📉
🔴 #NBIS ロング清算:210.43ドルで54.2Kドル
レバレッジをかけた強気派に、市場から警告の一撃が放たれました!💥 210.43ドルで54,200ドル相当のロングポジションが清算され、価格がポジションと逆方向に動いた場合に買い手が直面するリスクが浮き彫りになりました。NBISが落ち着きを取り戻すのか、それとも売りが再び広がるのか、トレーダーは注視しましょう。
📊 トレードデスクの見通し
🔻 弱気シナリオ:NBISが210.43ドル付近を回復できず、売り手が主導権を握り続ける場合、下落が続く可能性があります。勢いの弱まりや、新たな清算の集中に注目しましょう。
🚀 強気の回復シナリオ:買い手がこの水準を取り戻し、十分な出来高を伴って維持できれば、NBISは反発を試み、ショート勢を踏み上げる可能性があります。
🎯 私の戦略的見解:落ちてくるナイフをつかむのは避けましょう。まずは価格の方向性が定まるのを待つこと。重要なのは、210.43ドルが抵抗線になるのか、それとも買い手がこの水準を取り戻せるのかです。
🔎 注目すべきシグナル:
210.43ドル付近での価格反応
回復時の出来高による裏付け
テクノロジー市場全体のセンチメント
新たなロング・ショートの清算
🛡️ まずはリスク管理を:清算が1件あっただけでは、トレンド転換が確定したとは言えません。明確なセットアップを待ち、損切りラインを設定し、ポジションサイズを慎重に管理しましょう。
#NBIS #LiquidationAlert #TradingStrategy #MarketAnalysis #PriceAction #CryptoAndStocks
#SolanaETFsEnd14WeekInflowStreak #BitcoinOptionsVolatilityHitsFiveYearLow #SolanaETFsEnd14WeekInflowStreak #BitcoinOptionsVolatilityHitsFiveYearLow
🔴 #NBIS ロング清算:210.43ドルで54.2Kドル
レバレッジをかけた強気派に、市場から警告の一撃が放たれました!💥 210.43ドルで54,200ドル相当のロングポジションが清算され、価格がポジションと逆方向に動いた場合に買い手が直面するリスクが浮き彫りになりました。NBISが落ち着きを取り戻すのか、それとも売りが再び広がるのか、トレーダーは注視しましょう。
📊 トレードデスクの見通し
🔻 弱気シナリオ:NBISが210.43ドル付近を回復できず、売り手が主導権を握り続ける場合、下落が続く可能性があります。勢いの弱まりや、新たな清算の集中に注目しましょう。
🚀 強気の回復シナリオ:買い手がこの水準を取り戻し、十分な出来高を伴って維持できれば、NBISは反発を試み、ショート勢を踏み上げる可能性があります。
🎯 私の戦略的見解:落ちてくるナイフをつかむのは避けましょう。まずは価格の方向性が定まるのを待つこと。重要なのは、210.43ドルが抵抗線になるのか、それとも買い手がこの水準を取り戻せるのかです。
🔎 注目すべきシグナル:
210.43ドル付近での価格反応
回復時の出来高による裏付け
テクノロジー市場全体のセンチメント
新たなロング・ショートの清算
🛡️ まずはリスク管理を:清算が1件あっただけでは、トレンド転換が確定したとは言えません。明確なセットアップを待ち、損切りラインを設定し、ポジションサイズを慎重に管理しましょう。
#NBIS #LiquidationAlert #TradingStrategy #MarketAnalysis #PriceAction #CryptoAndStocks
#SolanaETFsEnd14WeekInflowStreak #BitcoinOptionsVolatilityHitsFiveYearLow #SolanaETFsEnd14WeekInflowStreak #BitcoinOptionsVolatilityHitsFiveYearLow
13
·
--
🟢 #SNDK ショート清算アラート 🚀
💥 $1,621.63で$81.1K相当のショートポジションが清算
⚡ SNDKが上昇するなか、突然の踏み上げによりショート勢は撤退を余儀なくされ、弱気ポジションが勢いに逆らう形となりました。$1,621.63付近の清算ゾーンは、積極的な買い圧力と短期的なセンチメントの変化の可能性を示しています。 �
CoinMarketCap
📊 マーケット分析:
SNDKはショートポジションの流動性を一掃した後、強さを見せています。ショート勢が捕まった場合、次の値動きは、買い手が出来高を維持し、重要なサポート水準を守れるかどうかに左右されることがよくあります。
🔥 次の値動きについての見解:
SNDKが清算エリアを上回って推移すれば、強気派はさらに上のレジスタンスゾーンを目指す可能性があります。一方、反落すれば、トレーダーの利益確定により急速な押し戻しが起きる可能性もあります。
🎯 注目すべき重要水準:
🟢 サポート:$1,621付近
🚀 上昇継続:現在のゾーンを上回って維持し、新たな買い手を呼び込む
⚠️ リスク:サポートを割り込むと、短期的な調整につながる可能性
📈 取引バイアス:やや強気 — ショートスクイーズの勢いは続いていますが、さらなる大幅上昇を見込む前に、出来高による確認が重要です。
#SNDK #MarketAlert #Liquidation #TradingSignals #CryptoAndStocks
#SenBlumenthalProbesCantorFitzgeraldTetherTies #IMFSaysTokenizedMarketsSmall #FedMinutesFocusOnOctoberPause #VitalikWarnsAICouldWeakenCryptographySecurity
{stock_us}(SNDK.US)
🟢 #SNDK ショート清算アラート 🚀
💥 $1,621.63で$81.1K相当のショートポジションが清算
⚡ SNDKが上昇するなか、突然の踏み上げによりショート勢は撤退を余儀なくされ、弱気ポジションが勢いに逆らう形となりました。$1,621.63付近の清算ゾーンは、積極的な買い圧力と短期的なセンチメントの変化の可能性を示しています。 �
CoinMarketCap
📊 マーケット分析:
SNDKはショートポジションの流動性を一掃した後、強さを見せています。ショート勢が捕まった場合、次の値動きは、買い手が出来高を維持し、重要なサポート水準を守れるかどうかに左右されることがよくあります。
🔥 次の値動きについての見解:
SNDKが清算エリアを上回って推移すれば、強気派はさらに上のレジスタンスゾーンを目指す可能性があります。一方、反落すれば、トレーダーの利益確定により急速な押し戻しが起きる可能性もあります。
🎯 注目すべき重要水準:
🟢 サポート:$1,621付近
🚀 上昇継続:現在のゾーンを上回って維持し、新たな買い手を呼び込む
⚠️ リスク:サポートを割り込むと、短期的な調整につながる可能性
📈 取引バイアス:やや強気 — ショートスクイーズの勢いは続いていますが、さらなる大幅上昇を見込む前に、出来高による確認が重要です。
#SNDK #MarketAlert #Liquidation #TradingSignals #CryptoAndStocks
#SenBlumenthalProbesCantorFitzgeraldTetherTies #IMFSaysTokenizedMarketsSmall #FedMinutesFocusOnOctoberPause #VitalikWarnsAICouldWeakenCryptographySecurity
💥 $1,621.63で$81.1K相当のショートポジションが清算
⚡ SNDKが上昇するなか、突然の踏み上げによりショート勢は撤退を余儀なくされ、弱気ポジションが勢いに逆らう形となりました。$1,621.63付近の清算ゾーンは、積極的な買い圧力と短期的なセンチメントの変化の可能性を示しています。 �
CoinMarketCap
📊 マーケット分析:
SNDKはショートポジションの流動性を一掃した後、強さを見せています。ショート勢が捕まった場合、次の値動きは、買い手が出来高を維持し、重要なサポート水準を守れるかどうかに左右されることがよくあります。
🔥 次の値動きについての見解:
SNDKが清算エリアを上回って推移すれば、強気派はさらに上のレジスタンスゾーンを目指す可能性があります。一方、反落すれば、トレーダーの利益確定により急速な押し戻しが起きる可能性もあります。
🎯 注目すべき重要水準:
🟢 サポート:$1,621付近
🚀 上昇継続:現在のゾーンを上回って維持し、新たな買い手を呼び込む
⚠️ リスク:サポートを割り込むと、短期的な調整につながる可能性
📈 取引バイアス:やや強気 — ショートスクイーズの勢いは続いていますが、さらなる大幅上昇を見込む前に、出来高による確認が重要です。
#SNDK #MarketAlert #Liquidation #TradingSignals #CryptoAndStocks
#SenBlumenthalProbesCantorFitzgeraldTetherTies #IMFSaysTokenizedMarketsSmall #FedMinutesFocusOnOctoberPause #VitalikWarnsAICouldWeakenCryptographySecurity
82

·
--
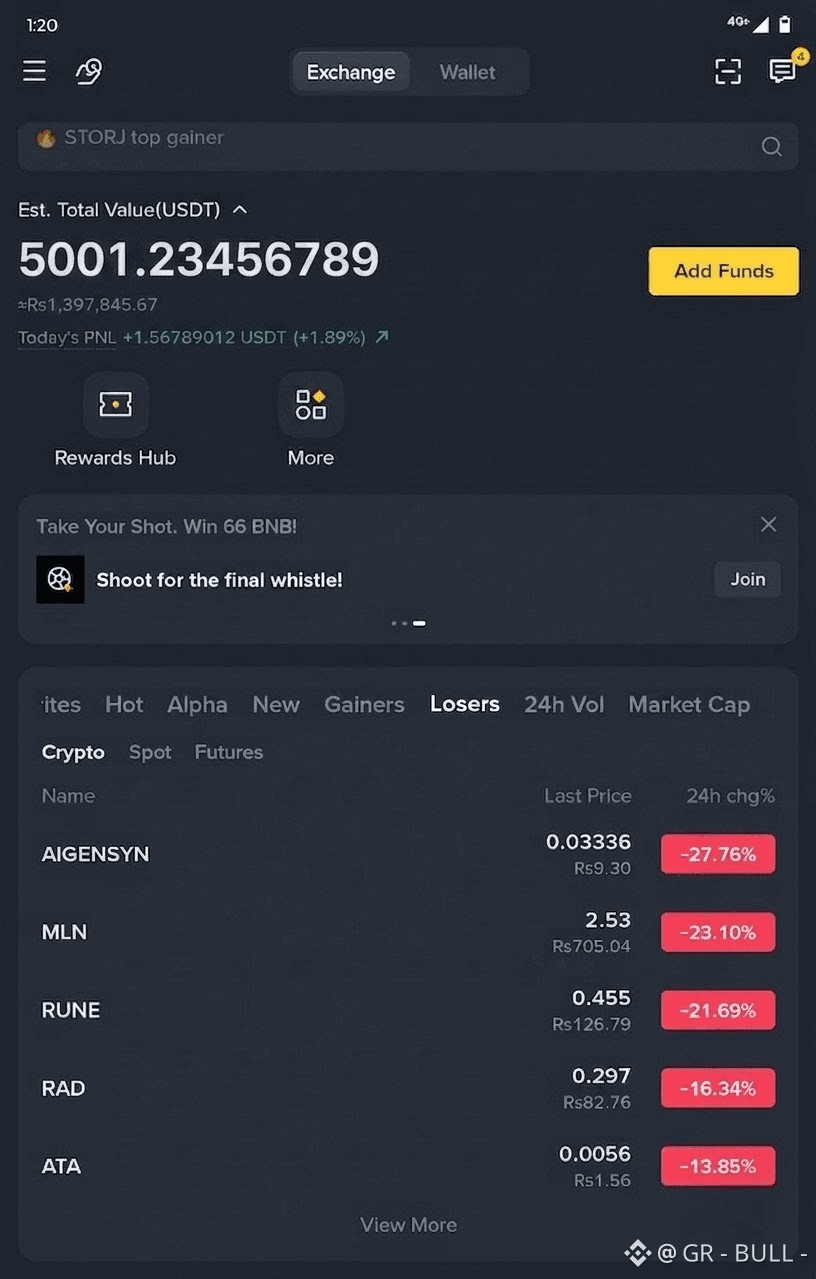
🚀 $5,001から$50,000へ – スリリングな旅!💸
控えめな$5,001が$50,000に爆発する方法を考えたことがありますか?それは魔法ではなく、戦略、リスクテイキング、そしてタイミングです。野心的な投資家がどのようにアプローチするかを見てみましょう:
1️⃣ ハイグロース投資
📈 株式 & ETF: 新興テクノロジー、AI、バイオテクノロジー、またはクリーンエネルギーをターゲットに。
⚡ ヒント: 爆発的な成長ポテンシャルを持つ企業を探しましょう。ただし、ボラティリティは常にあなたの隣にいます。
2️⃣ 暗号通貨 & デジタル資産
🚀 アルトコイン & DeFiプロジェクト: 小さな$5kでも、適切なトレンドに早く乗れば増幅します。
⚠️ 注意: 損失も現実です—ストップロスやスマートサイズで保護しましょう。
3️⃣ オプション & レバレッジ取引
🎯 ハイリスク・ハイリターン: コール/プットオプションは、$5kを急速に増やすことができます。
⚠️ 極端なボラティリティ—限界を知っておかないと、全てを失うことになります。
4️⃣ サイドハッスル & 起業家精神
💡 スキルを現金に変える: フリーランス、デジタル商品、または転売。
🔥 利益を積極的に再投資—複利があなたのスーパーパワーです。
5️⃣ 規律 & マインドセット
🧠 忍耐 + 攻撃性: 資本を着実に成長させ、盲目的にギャンブルしないこと。
📊 すべてを追跡し、損失を早くカットし、勝者だけに倍掛けする。
現実チェック: $5kを$50kに成長させるには、10倍の市場リターンか、信じられないレバレッジを持つビジネスが必要です。それはスリリングですが、保証はありません。
💥 スリルファクター: リスクが高いほど、乗り物は大きくなり、報酬も大きくなります。$5,001から$50kに到達するのは、勇敢な者だけです!
ハッシュタグ: #FinancialFreedom #InvestmentJourney #CryptoAndStocks #HighRiskHighReward #wealthbuilding
🚀 $5,001から$50,000へ – スリリングな旅!💸
控えめな$5,001が$50,000に爆発する方法を考えたことがありますか?それは魔法ではなく、戦略、リスクテイキング、そしてタイミングです。野心的な投資家がどのようにアプローチするかを見てみましょう:
1️⃣ ハイグロース投資
📈 株式 & ETF: 新興テクノロジー、AI、バイオテクノロジー、またはクリーンエネルギーをターゲットに。
⚡ ヒント: 爆発的な成長ポテンシャルを持つ企業を探しましょう。ただし、ボラティリティは常にあなたの隣にいます。
2️⃣ 暗号通貨 & デジタル資産
🚀 アルトコイン & DeFiプロジェクト: 小さな$5kでも、適切なトレンドに早く乗れば増幅します。
⚠️ 注意: 損失も現実です—ストップロスやスマートサイズで保護しましょう。
3️⃣ オプション & レバレッジ取引
🎯 ハイリスク・ハイリターン: コール/プットオプションは、$5kを急速に増やすことができます。
⚠️ 極端なボラティリティ—限界を知っておかないと、全てを失うことになります。
4️⃣ サイドハッスル & 起業家精神
💡 スキルを現金に変える: フリーランス、デジタル商品、または転売。
🔥 利益を積極的に再投資—複利があなたのスーパーパワーです。
5️⃣ 規律 & マインドセット
🧠 忍耐 + 攻撃性: 資本を着実に成長させ、盲目的にギャンブルしないこと。
📊 すべてを追跡し、損失を早くカットし、勝者だけに倍掛けする。
現実チェック: $5kを$50kに成長させるには、10倍の市場リターンか、信じられないレバレッジを持つビジネスが必要です。それはスリリングですが、保証はありません。
💥 スリルファクター: リスクが高いほど、乗り物は大きくなり、報酬も大きくなります。$5,001から$50kに到達するのは、勇敢な者だけです!
ハッシュタグ: #FinancialFreedom #InvestmentJourney #CryptoAndStocks #HighRiskHighReward #wealthbuilding
控えめな$5,001が$50,000に爆発する方法を考えたことがありますか?それは魔法ではなく、戦略、リスクテイキング、そしてタイミングです。野心的な投資家がどのようにアプローチするかを見てみましょう:
1️⃣ ハイグロース投資
📈 株式 & ETF: 新興テクノロジー、AI、バイオテクノロジー、またはクリーンエネルギーをターゲットに。
⚡ ヒント: 爆発的な成長ポテンシャルを持つ企業を探しましょう。ただし、ボラティリティは常にあなたの隣にいます。
2️⃣ 暗号通貨 & デジタル資産
🚀 アルトコイン & DeFiプロジェクト: 小さな$5kでも、適切なトレンドに早く乗れば増幅します。
⚠️ 注意: 損失も現実です—ストップロスやスマートサイズで保護しましょう。
3️⃣ オプション & レバレッジ取引
🎯 ハイリスク・ハイリターン: コール/プットオプションは、$5kを急速に増やすことができます。
⚠️ 極端なボラティリティ—限界を知っておかないと、全てを失うことになります。
4️⃣ サイドハッスル & 起業家精神
💡 スキルを現金に変える: フリーランス、デジタル商品、または転売。
🔥 利益を積極的に再投資—複利があなたのスーパーパワーです。
5️⃣ 規律 & マインドセット
🧠 忍耐 + 攻撃性: 資本を着実に成長させ、盲目的にギャンブルしないこと。
📊 すべてを追跡し、損失を早くカットし、勝者だけに倍掛けする。
現実チェック: $5kを$50kに成長させるには、10倍の市場リターンか、信じられないレバレッジを持つビジネスが必要です。それはスリリングですが、保証はありません。
💥 スリルファクター: リスクが高いほど、乗り物は大きくなり、報酬も大きくなります。$5,001から$50kに到達するのは、勇敢な者だけです!
ハッシュタグ: #FinancialFreedom #InvestmentJourney #CryptoAndStocks #HighRiskHighReward #wealthbuilding
2
1
340

·
--
ブリッシュ
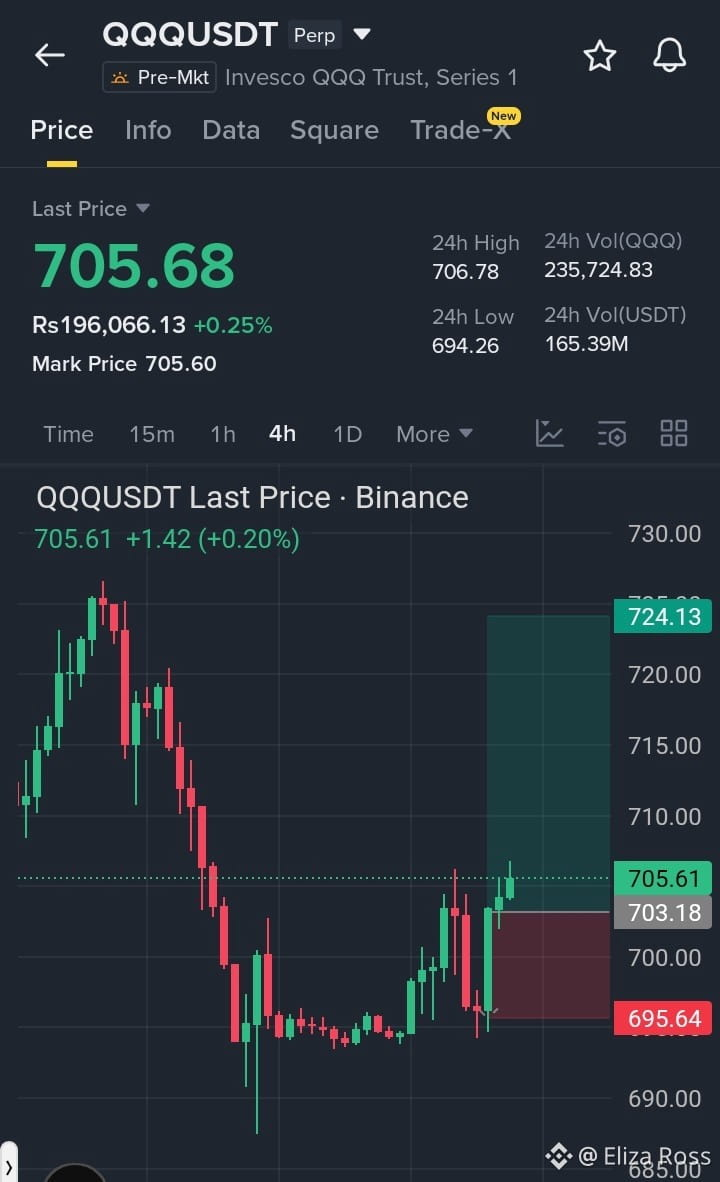
$QQQ 強いブレイクアウトの準備
$QQQ は、重要なサポート水準を維持した後、強い勢いを示しています。現在のゾーン上での値動きは引き続き強気であり、レジスタンスを上抜けできれば、より高い目標に向けた道が開かれる可能性があります。
ロングの売買セットアップ(最大20倍レバレッジ)
エントリー:$703.00 - $706.00
TP1:$712.00
TP2:$720.00
TP3:$724.00
SL:$695.00
$QQQ は買い手が$700のゾーンを防衛していることで、ポジティブな構造を維持しています。$710を上抜ければ勢いが加速し得ますが、$695が強気のセットアップを守るための重要なサポート水準です。
{future}(QQQUSDT)
#QQQ #Trading #TechnicalAnalysis #MarketMomentum #CryptoAndStocks
$QQQ 強いブレイクアウトの準備
$QQQ は、重要なサポート水準を維持した後、強い勢いを示しています。現在のゾーン上での値動きは引き続き強気であり、レジスタンスを上抜けできれば、より高い目標に向けた道が開かれる可能性があります。
ロングの売買セットアップ(最大20倍レバレッジ)
エントリー:$703.00 - $706.00
TP1:$712.00
TP2:$720.00
TP3:$724.00
SL:$695.00
$QQQ は買い手が$700のゾーンを防衛していることで、ポジティブな構造を維持しています。$710を上抜ければ勢いが加速し得ますが、$695が強気のセットアップを守るための重要なサポート水準です。
#QQQ #Trading #TechnicalAnalysis #MarketMomentum #CryptoAndStocks
$QQQ は、重要なサポート水準を維持した後、強い勢いを示しています。現在のゾーン上での値動きは引き続き強気であり、レジスタンスを上抜けできれば、より高い目標に向けた道が開かれる可能性があります。
ロングの売買セットアップ(最大20倍レバレッジ)
エントリー:$703.00 - $706.00
TP1:$712.00
TP2:$720.00
TP3:$724.00
SL:$695.00
$QQQ は買い手が$700のゾーンを防衛していることで、ポジティブな構造を維持しています。$710を上抜ければ勢いが加速し得ますが、$695が強気のセットアップを守るための重要なサポート水準です。
#QQQ #Trading #TechnicalAnalysis #MarketMomentum #CryptoAndStocks
1
166
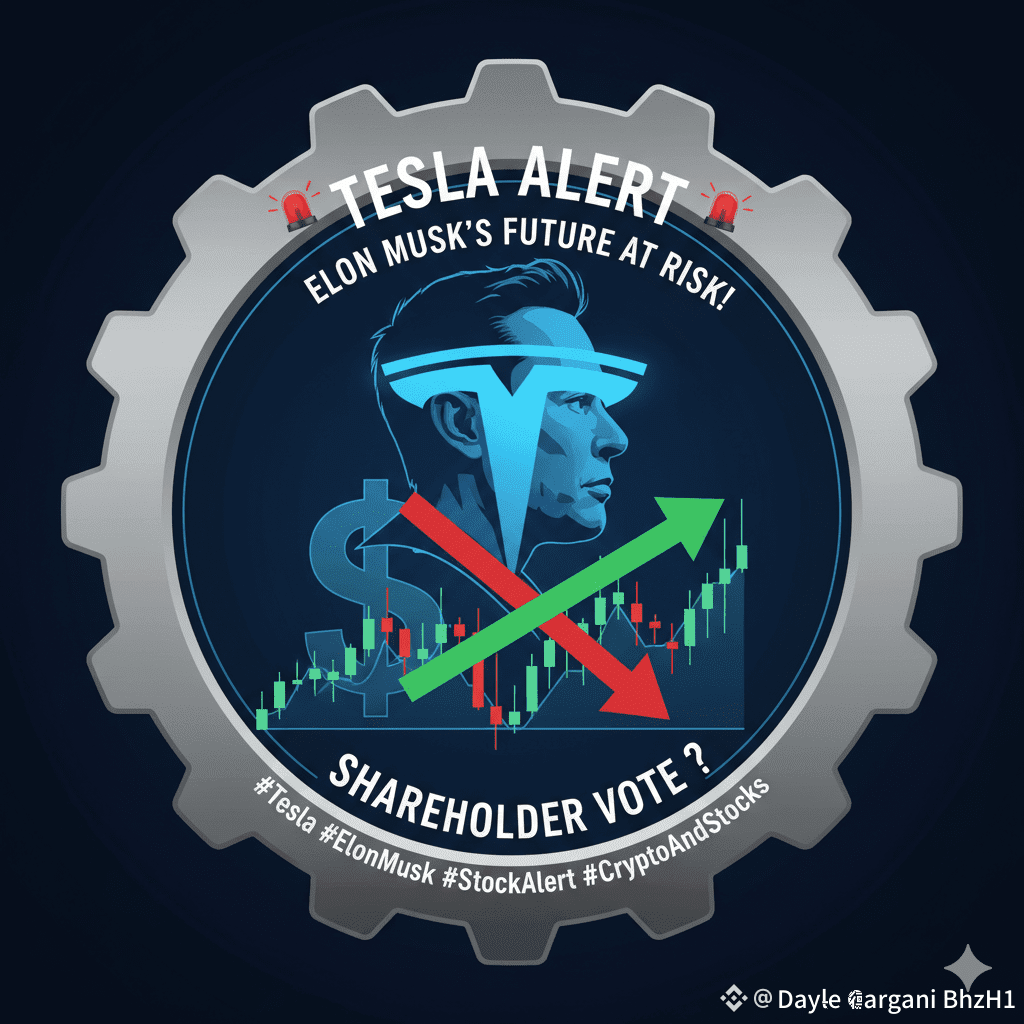
🚨 テスラアラート:イーロン・マスクの未来が危機に! 🚨
テスラは、ロビン・デンホルム会長が株主が彼の驚異的な1兆ドルの報酬パッケージを拒否した場合、イーロン・マスクが会社を去る可能性があると警告しているため、大規模なリーダーシップの揺れに直面する可能性があります。デンホルムは、マスクのビジョンと relentless drive がテスラをニッチな電気自動車スタートアップから世界で最も価値のある企業の一つに変えたことを強調しました。「イーロンは典型的なCEOではありません」と彼女は言いました。「彼のモチベーションは、単なる給料ではなく、野心的な目標と所有権から来ています。もし投資家が彼をテスラの未来に完全にコミットさせたいのであれば、彼の献身を確保することが重要です。」
提案された報酬プランは、企業史上最大のものの一つであり、テスラが市場価値、収益性、革新に関連する攻撃的なパフォーマンス目標を達成した場合、マスクに数十億ドルの株式オプションを提供します。批評家はこれを過剰だと呼んでいますが、支持者は彼が創出した巨大な価値に対する公正な認識と見なしています。
マスクの役割は以前にも疑問視されており、デラウェア州のチャンセリー裁判所が彼の以前の報酬契約を無効にした後、テスラは企業登録をテキサスに移し、より多くの株主の支持を求めている可能性があります。マスクはまた、SpaceX、xAI、Neuralinkなどのベンチャーに時間を費やしており、テスラが彼のコミットメントを確保しない場合、これらが彼の主な焦点になる可能性があります。
アナリストは、マスクを失うことが主要な株式の変動を引き起こし、投資家の信頼を揺るがす可能性があると警告しており、彼がテスラの成功にどれほど重要であるかを強調しています。
💬 あなたはどう思いますか?株主はこの契約を承認するでしょうか、それともテスラはマスクのいない未来に向かっているのでしょうか?
$XRP $DOGE
#Tesla #ElonMusk #StockAlert #CryptoAndStocks #MarketPullback
🚨 テスラアラート:イーロン・マスクの未来が危機に! 🚨
テスラは、ロビン・デンホルム会長が株主が彼の驚異的な1兆ドルの報酬パッケージを拒否した場合、イーロン・マスクが会社を去る可能性があると警告しているため、大規模なリーダーシップの揺れに直面する可能性があります。デンホルムは、マスクのビジョンと relentless drive がテスラをニッチな電気自動車スタートアップから世界で最も価値のある企業の一つに変えたことを強調しました。「イーロンは典型的なCEOではありません」と彼女は言いました。「彼のモチベーションは、単なる給料ではなく、野心的な目標と所有権から来ています。もし投資家が彼をテスラの未来に完全にコミットさせたいのであれば、彼の献身を確保することが重要です。」
提案された報酬プランは、企業史上最大のものの一つであり、テスラが市場価値、収益性、革新に関連する攻撃的なパフォーマンス目標を達成した場合、マスクに数十億ドルの株式オプションを提供します。批評家はこれを過剰だと呼んでいますが、支持者は彼が創出した巨大な価値に対する公正な認識と見なしています。
マスクの役割は以前にも疑問視されており、デラウェア州のチャンセリー裁判所が彼の以前の報酬契約を無効にした後、テスラは企業登録をテキサスに移し、より多くの株主の支持を求めている可能性があります。マスクはまた、SpaceX、xAI、Neuralinkなどのベンチャーに時間を費やしており、テスラが彼のコミットメントを確保しない場合、これらが彼の主な焦点になる可能性があります。
アナリストは、マスクを失うことが主要な株式の変動を引き起こし、投資家の信頼を揺るがす可能性があると警告しており、彼がテスラの成功にどれほど重要であるかを強調しています。
💬 あなたはどう思いますか?株主はこの契約を承認するでしょうか、それともテスラはマスクのいない未来に向かっているのでしょうか?
$XRP $DOGE
#Tesla #ElonMusk #StockAlert #CryptoAndStocks #MarketPullback
テスラは、ロビン・デンホルム会長が株主が彼の驚異的な1兆ドルの報酬パッケージを拒否した場合、イーロン・マスクが会社を去る可能性があると警告しているため、大規模なリーダーシップの揺れに直面する可能性があります。デンホルムは、マスクのビジョンと relentless drive がテスラをニッチな電気自動車スタートアップから世界で最も価値のある企業の一つに変えたことを強調しました。「イーロンは典型的なCEOではありません」と彼女は言いました。「彼のモチベーションは、単なる給料ではなく、野心的な目標と所有権から来ています。もし投資家が彼をテスラの未来に完全にコミットさせたいのであれば、彼の献身を確保することが重要です。」
提案された報酬プランは、企業史上最大のものの一つであり、テスラが市場価値、収益性、革新に関連する攻撃的なパフォーマンス目標を達成した場合、マスクに数十億ドルの株式オプションを提供します。批評家はこれを過剰だと呼んでいますが、支持者は彼が創出した巨大な価値に対する公正な認識と見なしています。
マスクの役割は以前にも疑問視されており、デラウェア州のチャンセリー裁判所が彼の以前の報酬契約を無効にした後、テスラは企業登録をテキサスに移し、より多くの株主の支持を求めている可能性があります。マスクはまた、SpaceX、xAI、Neuralinkなどのベンチャーに時間を費やしており、テスラが彼のコミットメントを確保しない場合、これらが彼の主な焦点になる可能性があります。
アナリストは、マスクを失うことが主要な株式の変動を引き起こし、投資家の信頼を揺るがす可能性があると警告しており、彼がテスラの成功にどれほど重要であるかを強調しています。
💬 あなたはどう思いますか?株主はこの契約を承認するでしょうか、それともテスラはマスクのいない未来に向かっているのでしょうか?
$XRP $DOGE
#Tesla #ElonMusk #StockAlert #CryptoAndStocks #MarketPullback
5
617

·
--
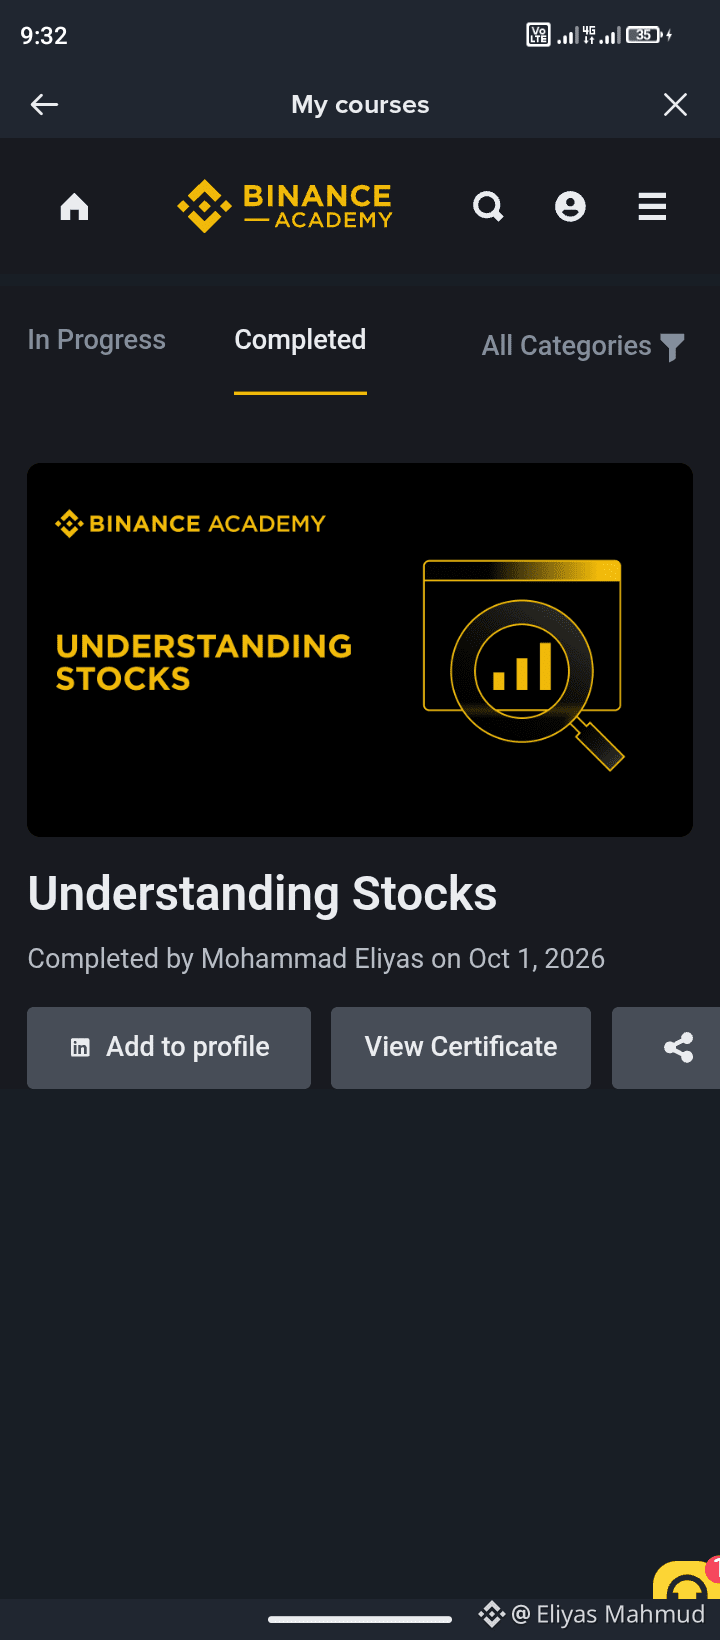
もう一つのマイルストーンをお知らせできて嬉しいです!Binance Academyの「Understanding Stocks」コースをやっと修了しました。😮💨🥶
株式市場と金融リテラシーのしっかりした基礎を身につけることは、今日の現代的な金融エコシステムにおいて不可欠です。次の挑戦へ!🚀
#Binance #CryptoAndStocks #Education #Finance #SelfImprovement
もう一つのマイルストーンをお知らせできて嬉しいです!Binance Academyの「Understanding Stocks」コースをやっと修了しました。😮💨🥶
株式市場と金融リテラシーのしっかりした基礎を身につけることは、今日の現代的な金融エコシステムにおいて不可欠です。次の挑戦へ!🚀
#Binance #CryptoAndStocks #Education #Finance #SelfImprovement
株式市場と金融リテラシーのしっかりした基礎を身につけることは、今日の現代的な金融エコシステムにおいて不可欠です。次の挑戦へ!🚀
#Binance #CryptoAndStocks #Education #Finance #SelfImprovement
1
86
ログインして、さらにコンテンツを読む
厳選トピックで世界の暗号資産トレーダーの仲間入り
⚡️ 暗号資産に関する最新かつ有益な情報が見つかります。
💬 世界最大の暗号資産取引所から信頼されています。
👍 認証を受けたクリエイターから、有益なインサイトを得られます。
メール / 電話番号
トレンドトピック
1
#BinanceReopensWithdrawalsForMoreAssets
閲覧回数 945,317
4,846人が討論中
2
#Binance98PercentReplenished
閲覧回数 242,480
2,022人が討論中
3
#USStocksSlipandCryptoMarketUnderBroadPressure
閲覧回数 38,443
341人が討論中
4
#StrategySTRCResumesIssuanceAfterOver170Days
閲覧回数 33,736
475人が討論中
5
#ADPUSPrivateEmployersAdd86000JobsInOctober
閲覧回数 51,784
625人が討論中
6
#KazakhstanReportedlyInvests$100MInCryptoFunds
閲覧回数 3,802
64人が討論中
7
#SouthKoreaSeeksCryptoTaxDelayUntil2029
閲覧回数 30,106
283人が討論中
8
#USMidterms-WhatAreMarketsExpecting?
閲覧回数 705,823
3,011人が討論中
9
#US10YearTreasuryYieldFallsTo4.845%
閲覧回数 48,386
224人が討論中
10
#ZcashExpectsNU7ToMake$16MSproutZECInaccessible
閲覧回数 2,594
25人が討論中