
RCipheR
25 Posting

RCipheR
Laporkan
Blokir Pengguna
加密貨幣及幣安市場分析 | 技術洞察與價格趨勢 | 僅供教 請注意:本帳號分享的所有內容僅供教育、資訊和分析之用。我並非財務顧問,此處發布的任何內容均不應被視為財務建議。在做出任何交易決策之前,請務必自行研究(DYOR)並妥善管理風險。歡迎加入我的行列,一同追蹤圖表形態、分析市場變化,探索不斷發展的 Web3 世界!
15 Mengikuti
5 Pengikut
30 Disukai
Posting
·
--
Artikel
Lihat terjemahan
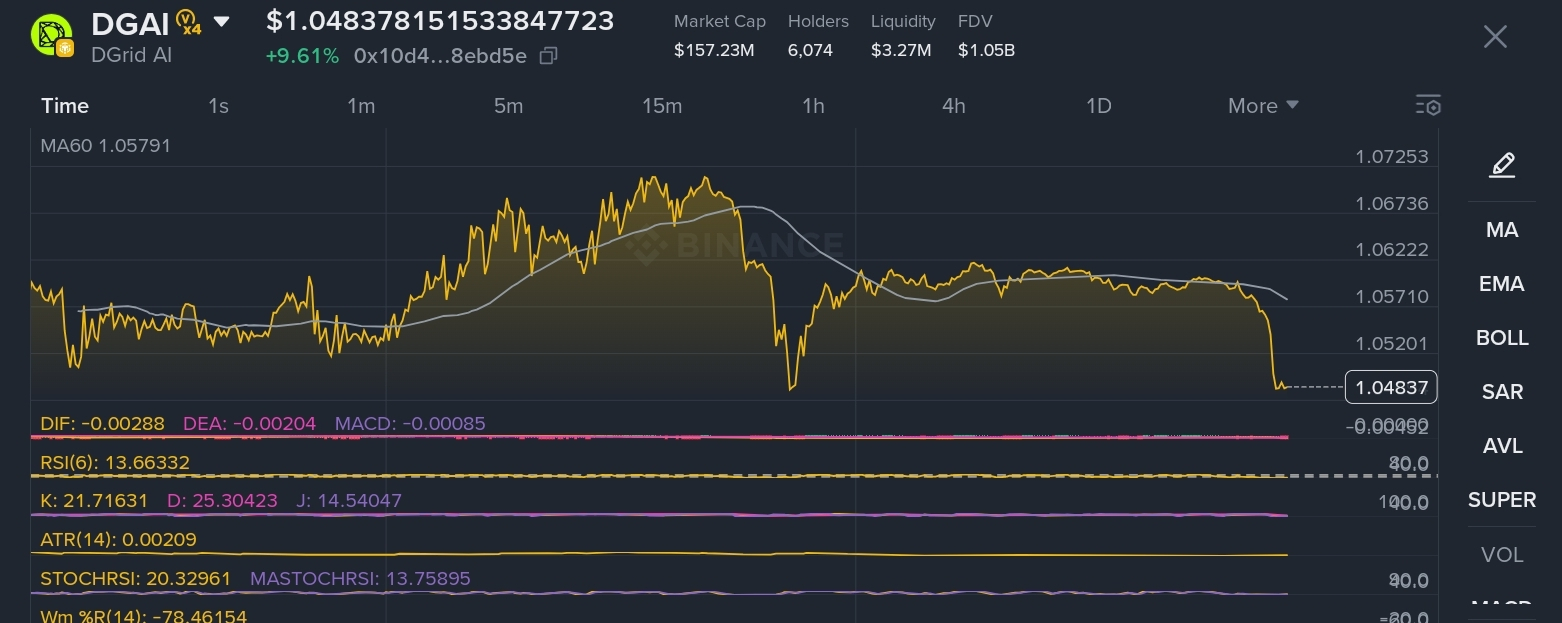
Unpacking DGrid AI (DGAI): Over $1B Volume Meets Severe Supply Concentration RiskDGrid AI is commanding serious attention across the cryptocurrency market, securing over $1 billion in trading volume within a 24-hour window. Operating as a decentralized smart network that provides a unified gateway to over 200 artificial intelligence models, the fundamental utility of the DGAI token spans payments, staking, incentives, and governance. Despite this robust utility and a sharp 10.54% price increase pushing the asset into the $1.04 to $1.05 range, a deeper structural analysis reveals severe volatility risks driven by liquidity fragmentation and supply concentration.
Liquidity Turnover and Mathematical Dilution Analysis
The financial architecture of DGAI presents extreme mathematical divergences between on-chain liquidity and trading velocity. The token has a circulating supply of 150 million against a maximum total supply of 1 billion. At a current price of roughly $1.048, the circulating market capitalization stands at $157.15 million, while the Fully Diluted Valuation (FDV) reaches $1.05 billion.
We can mathematically quantify the structural market pressure through a Volume-to-Liquidity Turnover calculation. The 24-hour trading volume is $1.07 billion. Total on-chain DEX liquidity is recorded at a mere $3.27 million. By dividing the $1.07 billion volume by the $3.27 million on-chain liquidity, we find a Liquidity Turnover Ratio of approximately 327.2x per day. This means the total available decentralized liquidity pool is turned over more than 300 times every 24 hours. A ratio of this magnitude strongly implies heavy high-frequency algorithmic arbitrage between centralized exchanges and decentralized platforms, rather than organic retail accumulation.
Furthermore, the Supply Dilution Overhang calculation highlights a significant long-term headwind. Subtracting the 150 million circulating tokens from the 1 billion total supply leaves 850 million locked or uncirculated tokens. Multiplying these 850 million uncirculated tokens by the current $1.048 price yields an inflationary overhang of $890.8 million. As these tokens vest and enter circulation, the current liquidity depth of just 2.08% (calculated as $3.27 million liquidity divided by the $157.15 million market cap) will not be sufficient to absorb new selling pressure without massive slippage.
The 98.21% Concentration Risk
The most critical threat to current DGAI holders is token distribution. Analytical insights reveal that the top 10 holding addresses control 98.21% of the total token supply.
This concentration fundamentally alters the market mechanics for the 6,072 individual chain holders. Subtracting the 98.21% whale dominance from the total supply leaves only 1.79% as the true retail float. In absolute terms, this represents just 17.9 million tokens distributed among the public. If any of the top 10 entities decide to liquidate even a fraction of their holdings, the resulting sell orders would instantaneously overwhelm the $3.27 million in available on-chain liquidity, triggering a severe downside cascade.
Adding to this pressure, Smart Money addresses are actively realizing profits. On-chain intelligence indicates these entities have secured $468.06 in localized profit, executing sells at an average price of $0.9266 after accumulating at an average buy price of $0.9126. This strategic exit behavior by sophisticated capital often serves as a leading indicator of exhaustion in short-term bullish momentum.
Technical Oscillators and Price Action
From a technical perspective on the 15-minute timeframe, DGAI is exhibiting signs of extreme localized stress. Following a rejection near the 24-hour high of $1.13519, the price compressed down toward $1.047.
The Bollinger Bands (20, 2) confirm this bearish displacement. The asset traded below the middle band baseline of $1.06102 and actively tested the lower band boundary near $1.04986. During this sharp intraday sell-off, the 15-minute 6-period Relative Strength Index (RSI) plunged to an exceptionally oversold reading of 1.80872. While an RSI this low typically signals an imminent mean-reversion bounce, the underlying momentum remains weak. The 5-minute MACD histogram shows a continuous decreasing trend, falling from positive territory to near zero, validating the fading buying pressure.
DGrid AI boasts excellent foundational technology and has successfully captured immense speculative volume. However, traders must navigate this asset with strict risk management. The mathematical reality of a 327x liquidity turnover ratio, combined with a 98.21% supply concentration among the top 10 wallets, creates an environment where abrupt, could lead to sharp volatility.
#Binance #ALPHA #TrendingTopic
Unpacking DGrid AI (DGAI): Over $1B Volume Meets Severe Supply Concentration Risk
DGrid AI is commanding serious attention across the cryptocurrency market, securing over $1 billion in trading volume within a 24-hour window. Operating as a decentralized smart network that provides a unified gateway to over 200 artificial intelligence models, the fundamental utility of the DGAI token spans payments, staking, incentives, and governance. Despite this robust utility and a sharp 10.54% price increase pushing the asset into the $1 .04 to $1 .05 range, a deeper structural analysis reveals severe volatility risks driven by liquidity fragmentation and supply concentration.
Liquidity Turnover and Mathematical Dilution Analysis
The financial architecture of DGAI presents extreme mathematical divergences between on-chain liquidity and trading velocity. The token has a circulating supply of 150 million against a maximum total supply of 1 billion. At a current price of roughly $1 .048, the circulating market capitalization stands at $157.15 million, while the Fully Diluted Valuation (FDV) reaches $1 .05 billion.
We can mathematically quantify the structural market pressure through a Volume-to-Liquidity Turnover calculation. The 24-hour trading volume is $1 .07 billion. Total on-chain DEX liquidity is recorded at a mere $3.27 million. By dividing the $1 .07 billion volume by the $3.27 million on-chain liquidity, we find a Liquidity Turnover Ratio of approximately 327.2x per day. This means the total available decentralized liquidity pool is turned over more than 300 times every 24 hours. A ratio of this magnitude strongly implies heavy high-frequency algorithmic arbitrage between centralized exchanges and decentralized platforms, rather than organic retail accumulation.
Furthermore, the Supply Dilution Overhang calculation highlights a significant long-term headwind. Subtracting the 150 million circulating tokens from the 1 billion total supply leaves 850 million locked or uncirculated tokens. Multiplying these 850 million uncirculated tokens by the current $1 .048 price yields an inflationary overhang of $890.8 million. As these tokens vest and enter circulation, the current liquidity depth of just 2.08% (calculated as $3.27 million liquidity divided by the $157.15 million market cap) will not be sufficient to absorb new selling pressure without massive slippage.
The 98.21% Concentration Risk
The most critical threat to current DGAI holders is token distribution. Analytical insights reveal that the top 10 holding addresses control 98.21% of the total token supply.
This concentration fundamentally alters the market mechanics for the 6,072 individual chain holders. Subtracting the 98.21% whale dominance from the total supply leaves only 1.79% as the true retail float. In absolute terms, this represents just 17.9 million tokens distributed among the public. If any of the top 10 entities decide to liquidate even a fraction of their holdings, the resulting sell orders would instantaneously overwhelm the $3.27 million in available on-chain liquidity, triggering a severe downside cascade.
Adding to this pressure, Smart Money addresses are actively realizing profits. On-chain intelligence indicates these entities have secured $468.06 in localized profit, executing sells at an average price of $0.9266 after accumulating at an average buy price of $0.9126. This strategic exit behavior by sophisticated capital often serves as a leading indicator of exhaustion in short-term bullish momentum.
Technical Oscillators and Price Action
From a technical perspective on the 15-minute timeframe, DGAI is exhibiting signs of extreme localized stress. Following a rejection near the 24-hour high of $1 .13519, the price compressed down toward $1 .047.
The Bollinger Bands (20, 2) confirm this bearish displacement. The asset traded below the middle band baseline of $1 .06102 and actively tested the lower band boundary near $1 .04986. During this sharp intraday sell-off, the 15-minute 6-period Relative Strength Index (RSI) plunged to an exceptionally oversold reading of 1.80872. While an RSI this low typically signals an imminent mean-reversion bounce, the underlying momentum remains weak. The 5-minute MACD histogram shows a continuous decreasing trend, falling from positive territory to near zero, validating the fading buying pressure.
DGrid AI boasts excellent foundational technology and has successfully captured immense speculative volume. However, traders must navigate this asset with strict risk management. The mathematical reality of a 327x liquidity turnover ratio, combined with a 98.21% supply concentration among the top 10 wallets, creates an environment where abrupt, could lead to sharp volatility.
#Binance #ALPHA #TrendingTopic
Liquidity Turnover and Mathematical Dilution Analysis
The financial architecture of DGAI presents extreme mathematical divergences between on-chain liquidity and trading velocity. The token has a circulating supply of 150 million against a maximum total supply of 1 billion. At a current price of roughly $1 .048, the circulating market capitalization stands at $157.15 million, while the Fully Diluted Valuation (FDV) reaches $1 .05 billion.
We can mathematically quantify the structural market pressure through a Volume-to-Liquidity Turnover calculation. The 24-hour trading volume is $1 .07 billion. Total on-chain DEX liquidity is recorded at a mere $3.27 million. By dividing the $1 .07 billion volume by the $3.27 million on-chain liquidity, we find a Liquidity Turnover Ratio of approximately 327.2x per day. This means the total available decentralized liquidity pool is turned over more than 300 times every 24 hours. A ratio of this magnitude strongly implies heavy high-frequency algorithmic arbitrage between centralized exchanges and decentralized platforms, rather than organic retail accumulation.
Furthermore, the Supply Dilution Overhang calculation highlights a significant long-term headwind. Subtracting the 150 million circulating tokens from the 1 billion total supply leaves 850 million locked or uncirculated tokens. Multiplying these 850 million uncirculated tokens by the current $1 .048 price yields an inflationary overhang of $890.8 million. As these tokens vest and enter circulation, the current liquidity depth of just 2.08% (calculated as $3.27 million liquidity divided by the $157.15 million market cap) will not be sufficient to absorb new selling pressure without massive slippage.
The 98.21% Concentration Risk
The most critical threat to current DGAI holders is token distribution. Analytical insights reveal that the top 10 holding addresses control 98.21% of the total token supply.
This concentration fundamentally alters the market mechanics for the 6,072 individual chain holders. Subtracting the 98.21% whale dominance from the total supply leaves only 1.79% as the true retail float. In absolute terms, this represents just 17.9 million tokens distributed among the public. If any of the top 10 entities decide to liquidate even a fraction of their holdings, the resulting sell orders would instantaneously overwhelm the $3.27 million in available on-chain liquidity, triggering a severe downside cascade.
Adding to this pressure, Smart Money addresses are actively realizing profits. On-chain intelligence indicates these entities have secured $468.06 in localized profit, executing sells at an average price of $0.9266 after accumulating at an average buy price of $0.9126. This strategic exit behavior by sophisticated capital often serves as a leading indicator of exhaustion in short-term bullish momentum.
Technical Oscillators and Price Action
From a technical perspective on the 15-minute timeframe, DGAI is exhibiting signs of extreme localized stress. Following a rejection near the 24-hour high of $1 .13519, the price compressed down toward $1 .047.
The Bollinger Bands (20, 2) confirm this bearish displacement. The asset traded below the middle band baseline of $1 .06102 and actively tested the lower band boundary near $1 .04986. During this sharp intraday sell-off, the 15-minute 6-period Relative Strength Index (RSI) plunged to an exceptionally oversold reading of 1.80872. While an RSI this low typically signals an imminent mean-reversion bounce, the underlying momentum remains weak. The 5-minute MACD histogram shows a continuous decreasing trend, falling from positive territory to near zero, validating the fading buying pressure.
DGrid AI boasts excellent foundational technology and has successfully captured immense speculative volume. However, traders must navigate this asset with strict risk management. The mathematical reality of a 327x liquidity turnover ratio, combined with a 98.21% supply concentration among the top 10 wallets, creates an environment where abrupt, could lead to sharp volatility.
#Binance #ALPHA #TrendingTopic
161
·
--
Artikel
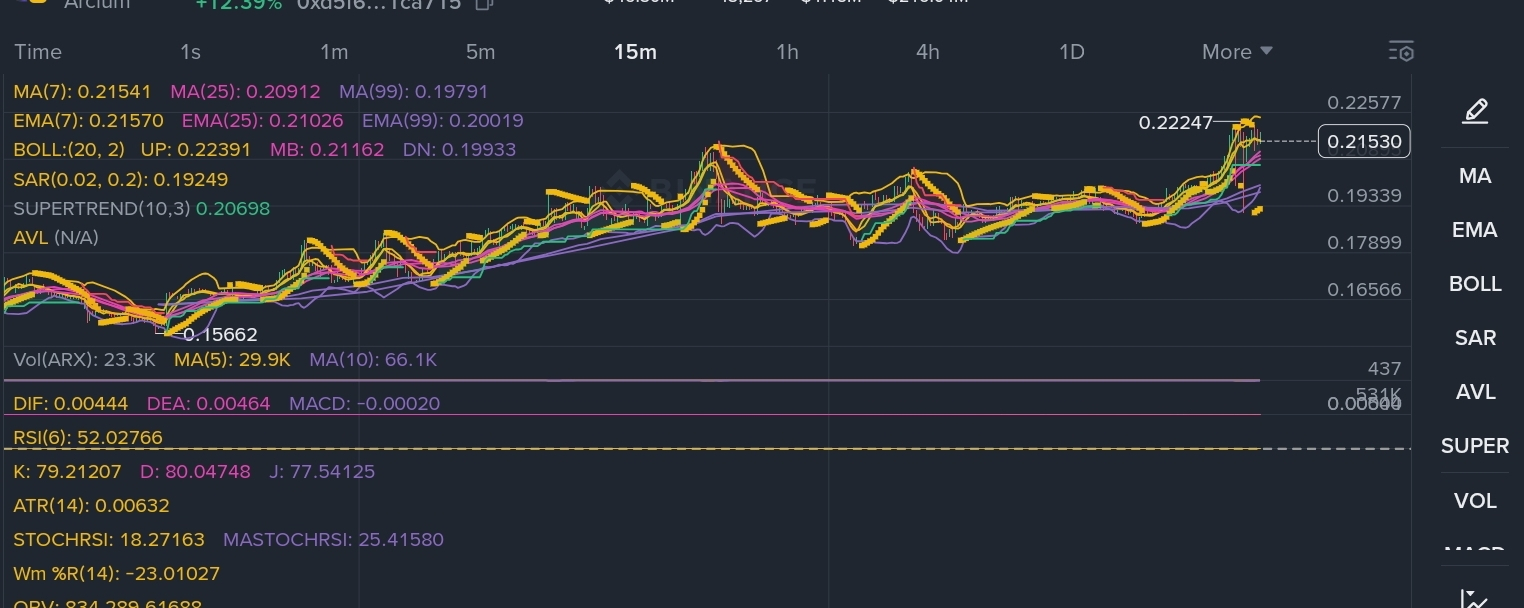
Analisis Mendalam Pasar: Lonjakan Parabolik Arcium ARX dan Prospek TeknisArcium baru-baru ini muncul sebagai salah satu performer menonjol di pasar aset digital, memadukan narasi yang kuat dalam confidential computing dengan pergerakan harga yang luar biasa. Sebagai jaringan confidential computing yang diparalelkan dan dibangun di atas Solana, Arcium menggunakan Multi-Party Computation untuk memproses data terenkripsi bagi aplikasi Web3 dan kecerdasan buatan. Token asli ARX terlihat jelas merespons latar fundamental yang kuat ini, mencatat kenaikan persentase harian dua digit dan menembus batas-batas psikologis kunci.
Analisis Mendalam Pasar: Lonjakan Parabolik Arcium ARX dan Prospek Teknis
Arcium baru-baru ini muncul sebagai salah satu performer menonjol di pasar aset digital, memadukan narasi yang kuat dalam confidential computing dengan pergerakan harga yang luar biasa. Sebagai jaringan confidential computing yang diparalelkan dan dibangun di atas Solana, Arcium menggunakan Multi-Party Computation untuk memproses data terenkripsi bagi aplikasi Web3 dan kecerdasan buatan. Token asli ARX terlihat jelas merespons latar fundamental yang kuat ini, mencatat kenaikan persentase harian dua digit dan menembus batas-batas psikologis kunci.
1
309
·
--
Artikel
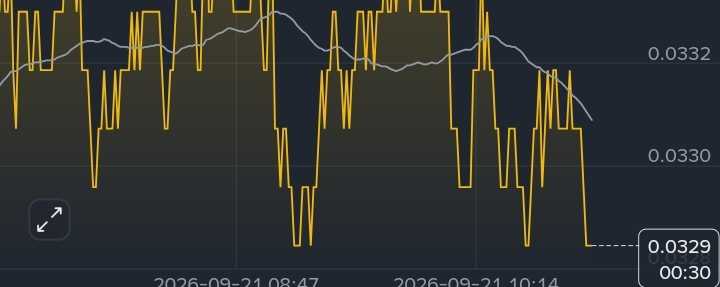
$BANK: Bisakah Membangun Momentum di Siklus Pasar Berikutnya?$BANK menarik perhatian karena para trader mencari token berkap kecil dengan keterlibatan komunitas yang kuat dan ruang untuk pergerakan yang didorong volatilitas. Seperti banyak altcoin yang baru muncul, pergerakan harganya dapat berubah cepat seiring likuiditas, sentimen, dan kondisi pasar yang lebih luas berubah.
Yang paling penting untuk $BANK
Likuiditas dan volume perdagangan
Tren volume yang terus meningkat dapat menandakan meningkatnya partisipasi pasar, sementara likuiditas yang tipis dapat memperkuat baik reli maupun aksi jual. Lonjakan pergerakan harga yang besar tidak selalu menjadi tanda permintaan yang berkelanjutan.
$BANK: Bisakah Membangun Momentum di Siklus Pasar Berikutnya?
$BANK menarik perhatian karena para trader mencari token berkap kecil dengan keterlibatan komunitas yang kuat dan ruang untuk pergerakan yang didorong volatilitas. Seperti banyak altcoin yang baru muncul, pergerakan harganya dapat berubah cepat seiring likuiditas, sentimen, dan kondisi pasar yang lebih luas berubah.
Yang paling penting untuk $BANK
Likuiditas dan volume perdagangan
Tren volume yang terus meningkat dapat menandakan meningkatnya partisipasi pasar, sementara likuiditas yang tipis dapat memperkuat baik reli maupun aksi jual. Lonjakan pergerakan harga yang besar tidak selalu menjadi tanda permintaan yang berkelanjutan.
Yang paling penting untuk $BANK
Likuiditas dan volume perdagangan
Tren volume yang terus meningkat dapat menandakan meningkatnya partisipasi pasar, sementara likuiditas yang tipis dapat memperkuat baik reli maupun aksi jual. Lonjakan pergerakan harga yang besar tidak selalu menjadi tanda permintaan yang berkelanjutan.
2
371
·
--
Artikel
Lihat terjemahan
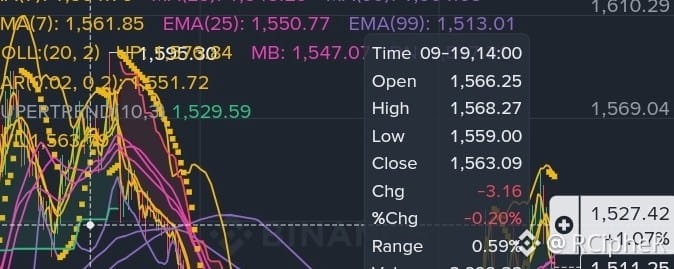
$ZEC Deep Dive: Why Zcash Is Surging +2,900% YTD & What the Order Book Dynamics RevealZcash ($ZEC) has emerged as one of the top trending assets across the cryptocurrency market, delivering a macro rally of over +2,913% over the past year and trading near $1,510 USDT.
Here is a comprehensive breakdown of why $ZEC is trending, an analysis of the multi-timeframe technical structure, derivatives data, and how to interpret its rapidly changing order book dynamics.
Why is $ZEC a Trending Coin?
Zcash's massive structural breakout and sustained momentum are driven by four core catalysts:
Compliant Spot ETF Momentum: Institutional access expanded dramatically following the conversion of the Grayscale Zcash Trust into a NYSE Arca-listed spot ETF ($ZCSH), triggering continuous net institutional inflows.
Resolution of Regulatory Uncertainty: The conclusion of long-standing regulatory inquiries without enforcement action removed a multi-year risk discount, enabling institutional treasuries and funds to allocate capital.
Protocol Upgrades & Privacy Tech Acceleration: The upcoming NU7 Network Upgrade (reducing block times from 75s to 25s) and the Zakura Common Toolkit (speeding up zero-knowledge proof generation on mobile by 14x) have vastly improved user experience and shielded transaction adoption.
Supply Scarcity & Short Squeeze Mechanics: With a hard supply cap of 21 million tokens (matching Bitcoin) and an increasing percentage locked in private z-addresses, high short interest in derivatives markets has repeatedly triggered violent short squeez
1. Daily (1D) Chart — Macro Bullish
Moving Averages: Price trades far above key exponential moving averages:
EMA(7): $1,245.98EMA(25): $1,038.79EMA(99): $595.30Bollinger Bands: Price is pushing above the Upper Band ($1,424.87), indicating extreme trend strength.
Indicators:
RSI(6): 76.55 (Strong momentum in overbought territory).MACD: DIF (147.58) > DEA (131.79) with a positive histogram (+15.78), showing expansion in buyer volume.
2. 4-Hour (4H) Chart — Healthy High-Level Consolidation
Structure: Price is holding above the Middle Bollinger Band ($1,493.54) and EMA(7) ($1,490.82) after touching a high of $1,595.30.
Indicators: RSI(6) at 62.31 shows healthy cooling off without breaking structure, maintaining Supertrend support at $1,364.49.
3. 1-Hour (1H) & 15-Min (15M) Charts — Local Range
Support / Resistance: Immediate support sits at $1,505 (EMA7) and $1,482 (Parabolic SAR). Local resistance stands at $1,535 - $1,548.
RSI(6): Resetting in the 41.31 - 58.52 range, allowing indicators to reset before the next potential move.
Derivatives Sentiment: Open Interest & Long/Short Ratios
Open Interest (OI): ~470K - 472K ZEC (Notional Value: ~$708M - $727M USDT), demonstrating huge liquidity participation.
Top Trader Long/Short Ratio (Accounts):
Long Accounts: 33.22% - 35.09%
Short Accounts: 64.91% - 66.78%
Analyst Insight: Over 64% of top trader accounts are currently holding short positions. In a strong uptrend, an imbalanced short account ratio often sets up a short squeeze, as rising prices force short sellers to buy back tokens to close their positions.
Order Book Dynamics: Why Is the Order Book Constantly Changing?
In high-volatility, high-volume contracts like $ZEC Perpetual, live order book depths shift second-by-second (e.g., Bid ratio fluctuating between 20% Bids / 80% Asks and 93% Bids / 7% Asks within seconds).
Algorithmic High-Frequency Trading (HFT): Market-making algorithms rapidly insert and cancel limit orders to capture bid-ask spreads.
Automated Stop-Loss Triggering: As price approaches micro-levels, liquidations and stop-market orders clear out entire depth tiers instantly.
Iceberg Orders & Hidden Liquidity: Institutional players break large orders into small fragments to avoid disclosing total size.
Trading Takeaway: Never trade solely based on a single snapshot of the order book. Focus on broader volume indicators like On-Balance Volume (OBV: ~93.29M) and major higher-timeframe support/resistance levels.
Key Trading Levels to Watch
Key Resistance Levels: $1,548 ➔ $1,595 ➔ $1,650 ➔ $1,800
Key Support Levels: $1,490 - $1,505 (1H/4H EMA Support) ➔ $1,428 (24h Low) ➔ $1,245 (Daily EMA7)
Disclaimer & Risk Warning
This article is for informational and educational purposes only and does not constitute financial advice, investment recommendations, or an endorsement to buy or sell any digital assets. Cryptocurrency and futures trading carry high market risk and price volatility. Leverage can amplify both profits and losses. Always conduct your own research (DYOR) and apply strict risk management before entering any trade.
#TrendingTopic #Binance
$ZEC Deep Dive: Why Zcash Is Surging +2,900% YTD & What the Order Book Dynamics Reveal
Zcash ($ZEC) has emerged as one of the top trending assets across the cryptocurrency market, delivering a macro rally of over +2,913% over the past year and trading near $1,510 USDT.
Here is a comprehensive breakdown of why $ZEC is trending, an analysis of the multi-timeframe technical structure, derivatives data, and how to interpret its rapidly changing order book dynamics.
Why is $ZEC a Trending Coin?
Zcash's massive structural breakout and sustained momentum are driven by four core catalysts:
Compliant Spot ETF Momentum: Institutional access expanded dramatically following the conversion of the Grayscale Zcash Trust into a NYSE Arca-listed spot ETF ($ZCSH), triggering continuous net institutional inflows.
Resolution of Regulatory Uncertainty: The conclusion of long-standing regulatory inquiries without enforcement action removed a multi-year risk discount, enabling institutional treasuries and funds to allocate capital.
Protocol Upgrades & Privacy Tech Acceleration: The upcoming NU7 Network Upgrade (reducing block times from 75s to 25s) and the Zakura Common Toolkit (speeding up zero-knowledge proof generation on mobile by 14x) have vastly improved user experience and shielded transaction adoption.
Supply Scarcity & Short Squeeze Mechanics: With a hard supply cap of 21 million tokens (matching Bitcoin) and an increasing percentage locked in private z-addresses, high short interest in derivatives markets has repeatedly triggered violent short squeez
1. Daily (1D) Chart — Macro Bullish
Moving Averages: Price trades far above key exponential moving averages:
EMA(7): $1,245.98EMA(25): $1,038.79EMA(99): $595.30Bollinger Bands: Price is pushing above the Upper Band ($1,424.87), indicating extreme trend strength.
Indicators:
RSI(6): 76.55 (Strong momentum in overbought territory).MACD: DIF (147.58) > DEA (131.79) with a positive histogram (+15.78), showing expansion in buyer volume.
2. 4-Hour (4H) Chart — Healthy High-Level Consolidation
Structure: Price is holding above the Middle Bollinger Band ($1,493.54) and EMA(7) ($1,490.82) after touching a high of $1,595.30.
Indicators: RSI(6) at 62.31 shows healthy cooling off without breaking structure, maintaining Supertrend support at $1,364.49.
3. 1-Hour (1H) & 15-Min (15M) Charts — Local Range
Support / Resistance: Immediate support sits at $1,505 (EMA7) and $1,482 (Parabolic SAR). Local resistance stands at $1,535 - $1,548.
RSI(6): Resetting in the 41.31 - 58.52 range, allowing indicators to reset before the next potential move.
Derivatives Sentiment: Open Interest & Long/Short Ratios
Open Interest (OI): ~470K - 472K ZEC (Notional Value: ~$708M - $727M USDT), demonstrating huge liquidity participation.
Top Trader Long/Short Ratio (Accounts):
Long Accounts: 33.22% - 35.09%
Short Accounts: 64.91% - 66.78%
Analyst Insight: Over 64% of top trader accounts are currently holding short positions. In a strong uptrend, an imbalanced short account ratio often sets up a short squeeze, as rising prices force short sellers to buy back tokens to close their positions.
Order Book Dynamics: Why Is the Order Book Constantly Changing?
In high-volatility, high-volume contracts like $ZEC Perpetual, live order book depths shift second-by-second (e.g., Bid ratio fluctuating between 20% Bids / 80% Asks and 93% Bids / 7% Asks within seconds).
Algorithmic High-Frequency Trading (HFT): Market-making algorithms rapidly insert and cancel limit orders to capture bid-ask spreads.
Automated Stop-Loss Triggering: As price approaches micro-levels, liquidations and stop-market orders clear out entire depth tiers instantly.
Iceberg Orders & Hidden Liquidity: Institutional players break large orders into small fragments to avoid disclosing total size.
Trading Takeaway: Never trade solely based on a single snapshot of the order book. Focus on broader volume indicators like On-Balance Volume (OBV: ~93.29M) and major higher-timeframe support/resistance levels.
Key Trading Levels to Watch
Key Resistance Levels: $1,548 ➔ $1,595 ➔ $1,650 ➔ $1,800
Key Support Levels: $1,490 - $1,505 (1H/4H EMA Support) ➔ $1,428 (24h Low) ➔ $1,245 (Daily EMA7)
Disclaimer & Risk Warning
This article is for informational and educational purposes only and does not constitute financial advice, investment recommendations, or an endorsement to buy or sell any digital assets. Cryptocurrency and futures trading carry high market risk and price volatility. Leverage can amplify both profits and losses. Always conduct your own research (DYOR) and apply strict risk management before entering any trade.
#TrendingTopic #Binance
Here is a comprehensive breakdown of why $ZEC is trending, an analysis of the multi-timeframe technical structure, derivatives data, and how to interpret its rapidly changing order book dynamics.
Why is $ZEC a Trending Coin?
Zcash's massive structural breakout and sustained momentum are driven by four core catalysts:
Compliant Spot ETF Momentum: Institutional access expanded dramatically following the conversion of the Grayscale Zcash Trust into a NYSE Arca-listed spot ETF ($ZCSH), triggering continuous net institutional inflows.
Resolution of Regulatory Uncertainty: The conclusion of long-standing regulatory inquiries without enforcement action removed a multi-year risk discount, enabling institutional treasuries and funds to allocate capital.
Protocol Upgrades & Privacy Tech Acceleration: The upcoming NU7 Network Upgrade (reducing block times from 75s to 25s) and the Zakura Common Toolkit (speeding up zero-knowledge proof generation on mobile by 14x) have vastly improved user experience and shielded transaction adoption.
Supply Scarcity & Short Squeeze Mechanics: With a hard supply cap of 21 million tokens (matching Bitcoin) and an increasing percentage locked in private z-addresses, high short interest in derivatives markets has repeatedly triggered violent short squeez
1. Daily (1D) Chart — Macro Bullish
Moving Averages: Price trades far above key exponential moving averages:
EMA(7): $1,245.98EMA(25): $1,038.79EMA(99): $595.30Bollinger Bands: Price is pushing above the Upper Band ($1,424.87), indicating extreme trend strength.
Indicators:
RSI(6): 76.55 (Strong momentum in overbought territory).MACD: DIF (147.58) > DEA (131.79) with a positive histogram (+15.78), showing expansion in buyer volume.
2. 4-Hour (4H) Chart — Healthy High-Level Consolidation
Structure: Price is holding above the Middle Bollinger Band ($1,493.54) and EMA(7) ($1,490.82) after touching a high of $1,595.30.
Indicators: RSI(6) at 62.31 shows healthy cooling off without breaking structure, maintaining Supertrend support at $1,364.49.
3. 1-Hour (1H) & 15-Min (15M) Charts — Local Range
Support / Resistance: Immediate support sits at $1,505 (EMA7) and $1,482 (Parabolic SAR). Local resistance stands at $1,535 - $1,548.
RSI(6): Resetting in the 41.31 - 58.52 range, allowing indicators to reset before the next potential move.
Derivatives Sentiment: Open Interest & Long/Short Ratios
Open Interest (OI): ~470K - 472K ZEC (Notional Value: ~$708M - $727M USDT), demonstrating huge liquidity participation.
Top Trader Long/Short Ratio (Accounts):
Long Accounts: 33.22% - 35.09%
Short Accounts: 64.91% - 66.78%
Analyst Insight: Over 64% of top trader accounts are currently holding short positions. In a strong uptrend, an imbalanced short account ratio often sets up a short squeeze, as rising prices force short sellers to buy back tokens to close their positions.
Order Book Dynamics: Why Is the Order Book Constantly Changing?
In high-volatility, high-volume contracts like $ZEC Perpetual, live order book depths shift second-by-second (e.g., Bid ratio fluctuating between 20% Bids / 80% Asks and 93% Bids / 7% Asks within seconds).
Algorithmic High-Frequency Trading (HFT): Market-making algorithms rapidly insert and cancel limit orders to capture bid-ask spreads.
Automated Stop-Loss Triggering: As price approaches micro-levels, liquidations and stop-market orders clear out entire depth tiers instantly.
Iceberg Orders & Hidden Liquidity: Institutional players break large orders into small fragments to avoid disclosing total size.
Trading Takeaway: Never trade solely based on a single snapshot of the order book. Focus on broader volume indicators like On-Balance Volume (OBV: ~93.29M) and major higher-timeframe support/resistance levels.
Key Trading Levels to Watch
Key Resistance Levels: $1,548 ➔ $1,595 ➔ $1,650 ➔ $1,800
Key Support Levels: $1,490 - $1,505 (1H/4H EMA Support) ➔ $1,428 (24h Low) ➔ $1,245 (Daily EMA7)
Disclaimer & Risk Warning
This article is for informational and educational purposes only and does not constitute financial advice, investment recommendations, or an endorsement to buy or sell any digital assets. Cryptocurrency and futures trading carry high market risk and price volatility. Leverage can amplify both profits and losses. Always conduct your own research (DYOR) and apply strict risk management before entering any trade.
#TrendingTopic #Binance
1
184
·
--
Artikel
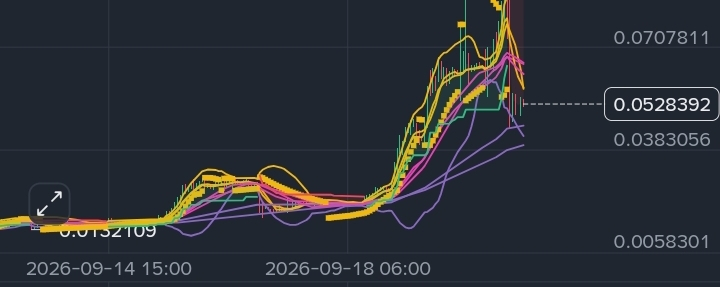
AKE Turun 15%: Apakah Ini Pendinginan yang Sehat atau Awal Koreksi yang Lebih Dalam?Akita Inu ($AKE) mengalami penurunan tajam 15% dalam intraday, menarik harga turun ke kisaran $0,052. Setelah reli makro yang spektakuler dari fase akumulasi musim panasnya, aksi ambil untung kini menjadi sorotan utama.
Pemeriksaan Realitas Teknis
Konsolidasi atau Penembusan? Pada grafik 1 jam, AKE berusaha membentuk lantai lokal. Saat ini harga berada di bawah immediate exponential moving averages (EMA 7 & 25), yang menunjukkan adanya resistensi overhead ketat di sekitar $0,057 - $0,062.
Divergensi RSI: Meskipun RSI 1 jam berada cukup berat di 34,7 (mendekati kondisi oversold), time frame 15 menit justru mulai mendatar di sekitar 53. Ini mengindikasikan bahwa tekanan jual yang intens yang terlihat lebih awal hari ini mulai melemah dan beralih ke konsolidasi menyamping.
AKE Turun 15%: Apakah Ini Pendinginan yang Sehat atau Awal Koreksi yang Lebih Dalam?
Akita Inu ($AKE) mengalami penurunan tajam 15% dalam intraday, menarik harga turun ke kisaran $0,052. Setelah reli makro yang spektakuler dari fase akumulasi musim panasnya, aksi ambil untung kini menjadi sorotan utama.
Pemeriksaan Realitas Teknis
Konsolidasi atau Penembusan? Pada grafik 1 jam, AKE berusaha membentuk lantai lokal. Saat ini harga berada di bawah immediate exponential moving averages (EMA 7 & 25), yang menunjukkan adanya resistensi overhead ketat di sekitar $0,057 - $0,062.
Divergensi RSI: Meskipun RSI 1 jam berada cukup berat di 34,7 (mendekati kondisi oversold), time frame 15 menit justru mulai mendatar di sekitar 53. Ini mengindikasikan bahwa tekanan jual yang intens yang terlihat lebih awal hari ini mulai melemah dan beralih ke konsolidasi menyamping.
Pemeriksaan Realitas Teknis
Konsolidasi atau Penembusan? Pada grafik 1 jam, AKE berusaha membentuk lantai lokal. Saat ini harga berada di bawah immediate exponential moving averages (EMA 7 & 25), yang menunjukkan adanya resistensi overhead ketat di sekitar $0,057 - $0,062.
Divergensi RSI: Meskipun RSI 1 jam berada cukup berat di 34,7 (mendekati kondisi oversold), time frame 15 menit justru mulai mendatar di sekitar 53. Ini mengindikasikan bahwa tekanan jual yang intens yang terlihat lebih awal hari ini mulai melemah dan beralih ke konsolidasi menyamping.
2
349
·
--
Artikel
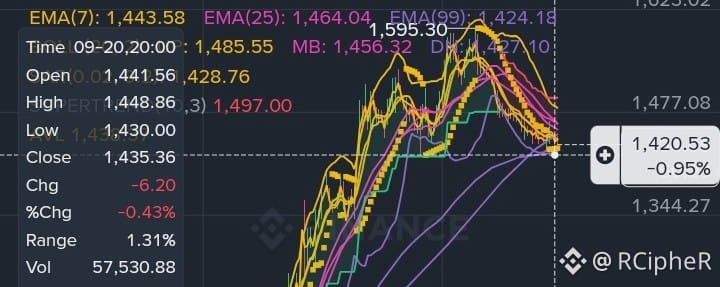
Peringatan ZEC: Oversold atau Jatuh Bebas? Zcash Menguji Support Kritis $1,428Zcash ($ZEC) mengalami koreksi tajam hari ini, turun hampir 6% dan bergerak menuju level $1,434. Karena para beruang mendominasi sesi, para trader mengamati dengan saksama apakah titik terendah 24 jam dapat bertahan.
Snapshot Teknis (Timeframe 1H & 15M)
Pegangan Bearish: Harga tetap kuat di bawah MA7 dan MA25, menegaskan tren turun agresif. Aksi "waterfall" di sepanjang Lower Bollinger Band menunjukkan volume penjualan yang kuat.
Sinyal Oversold: RSI pada chart 1 jam sedang berlegar di sekitar 31, sangat dekat dengan kondisi oversold. Ini biasanya menunjukkan potensi kelelahan jual yang sudah mendekat, yang bisa memicu pantulan bantuan kembali menuju $1,445 - $1,450.
Peringatan ZEC: Oversold atau Jatuh Bebas? Zcash Menguji Support Kritis $1,428
Zcash ($ZEC) mengalami koreksi tajam hari ini, turun hampir 6% dan bergerak menuju level $1,434. Karena para beruang mendominasi sesi, para trader mengamati dengan saksama apakah titik terendah 24 jam dapat bertahan.
Snapshot Teknis (Timeframe 1H & 15M)
Pegangan Bearish: Harga tetap kuat di bawah MA7 dan MA25, menegaskan tren turun agresif. Aksi "waterfall" di sepanjang Lower Bollinger Band menunjukkan volume penjualan yang kuat.
Sinyal Oversold: RSI pada chart 1 jam sedang berlegar di sekitar 31, sangat dekat dengan kondisi oversold. Ini biasanya menunjukkan potensi kelelahan jual yang sudah mendekat, yang bisa memicu pantulan bantuan kembali menuju $1,445 - $1,450.
Snapshot Teknis (Timeframe 1H & 15M)
Pegangan Bearish: Harga tetap kuat di bawah MA7 dan MA25, menegaskan tren turun agresif. Aksi "waterfall" di sepanjang Lower Bollinger Band menunjukkan volume penjualan yang kuat.
Sinyal Oversold: RSI pada chart 1 jam sedang berlegar di sekitar 31, sangat dekat dengan kondisi oversold. Ini biasanya menunjukkan potensi kelelahan jual yang sudah mendekat, yang bisa memicu pantulan bantuan kembali menuju $1,445 - $1,450.
1
289
·
--
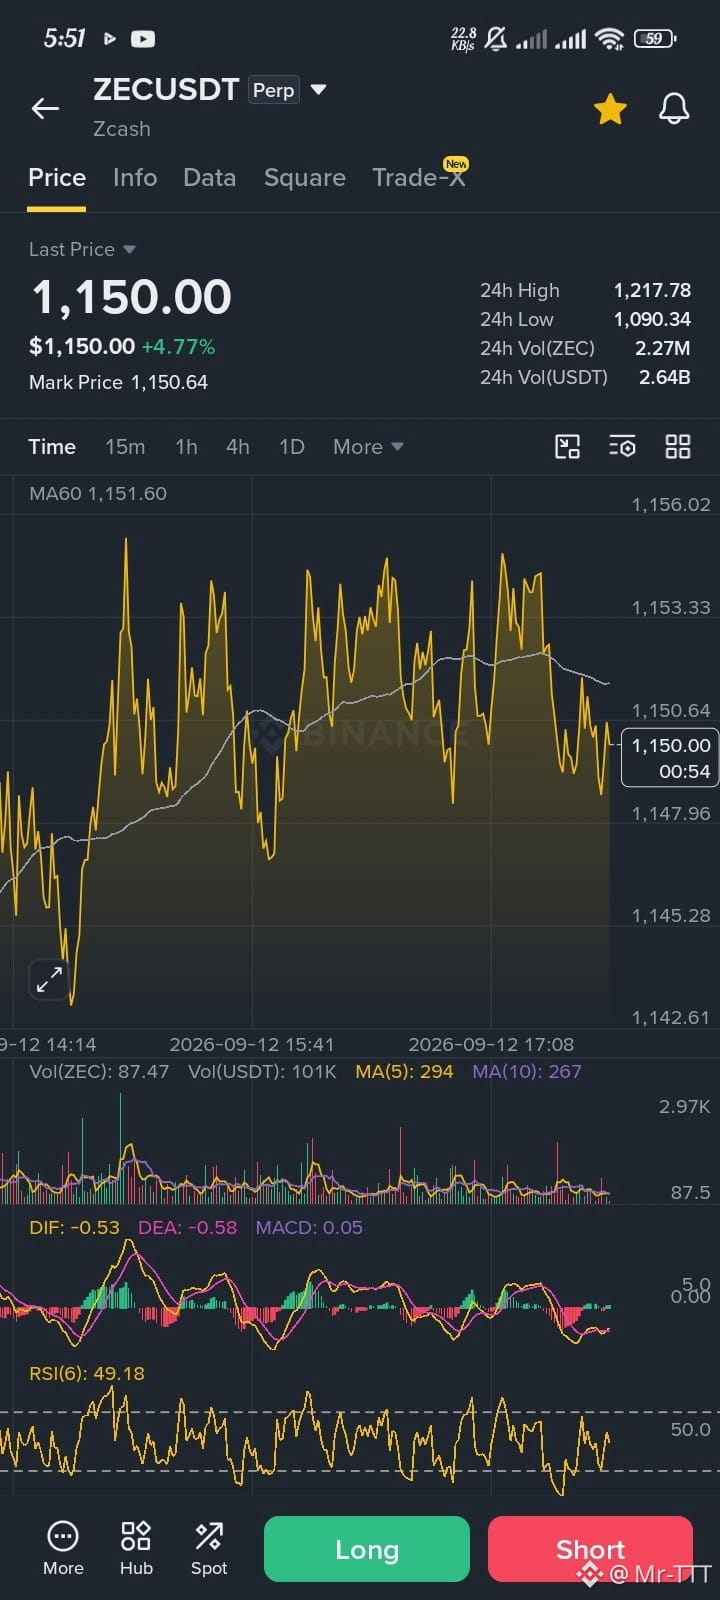
$ZEC kamu yang sialan itu muncul cuma buat menghancurkanku, ya?
{future}(ZECUSDT)
$ZEC kamu yang sialan itu muncul cuma buat menghancurkanku, ya?
2
109
·
--
Artikel
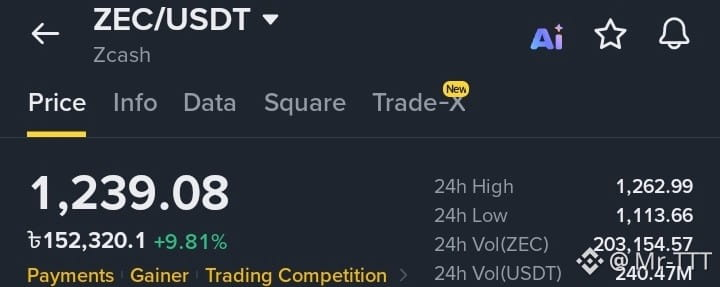
Analisis Pasar Multi-Timeframe ZEC/USDT$ZEC Pasangan perdagangan ZEC/USDT saat ini menunjukkan breakout parabola yang kuat dan diperdagangkan pada sekitar $1.239,08, mencatat kenaikan lebih dari 9,8% dalam 24 jam terakhir. Pergerakan harga mengindikasikan tren bullish yang kuat; namun, analisis multi-timeframe menunjukkan bahwa setelah menyentuh puncak lokal terbaru sebesar $1.262,99, pasar sedang mendekati titik pivot kritis.
Kedalaman Pasar dan Ketidakseimbangan Buku Pesanan
Dominasi 'Buy Wall': Grafik kedalaman pasar mengungkap ketidakseimbangan bullish yang signifikan, dengan 'bids' (pesanan beli) menyumbang 84,01% dari total volume buku pesanan, sementara 'asks' (pesanan jual) hanya 15,99%.
Analisis Pasar Multi-Timeframe ZEC/USDT
$ZEC Pasangan perdagangan ZEC/USDT saat ini menunjukkan breakout parabola yang kuat dan diperdagangkan pada sekitar $1.239,08, mencatat kenaikan lebih dari 9,8% dalam 24 jam terakhir. Pergerakan harga mengindikasikan tren bullish yang kuat; namun, analisis multi-timeframe menunjukkan bahwa setelah menyentuh puncak lokal terbaru sebesar $1.262,99, pasar sedang mendekati titik pivot kritis.
Kedalaman Pasar dan Ketidakseimbangan Buku Pesanan
Dominasi 'Buy Wall': Grafik kedalaman pasar mengungkap ketidakseimbangan bullish yang signifikan, dengan 'bids' (pesanan beli) menyumbang 84,01% dari total volume buku pesanan, sementara 'asks' (pesanan jual) hanya 15,99%.
Kedalaman Pasar dan Ketidakseimbangan Buku Pesanan
Dominasi 'Buy Wall': Grafik kedalaman pasar mengungkap ketidakseimbangan bullish yang signifikan, dengan 'bids' (pesanan beli) menyumbang 84,01% dari total volume buku pesanan, sementara 'asks' (pesanan jual) hanya 15,99%.
1
208
·
--
Lihat terjemahan
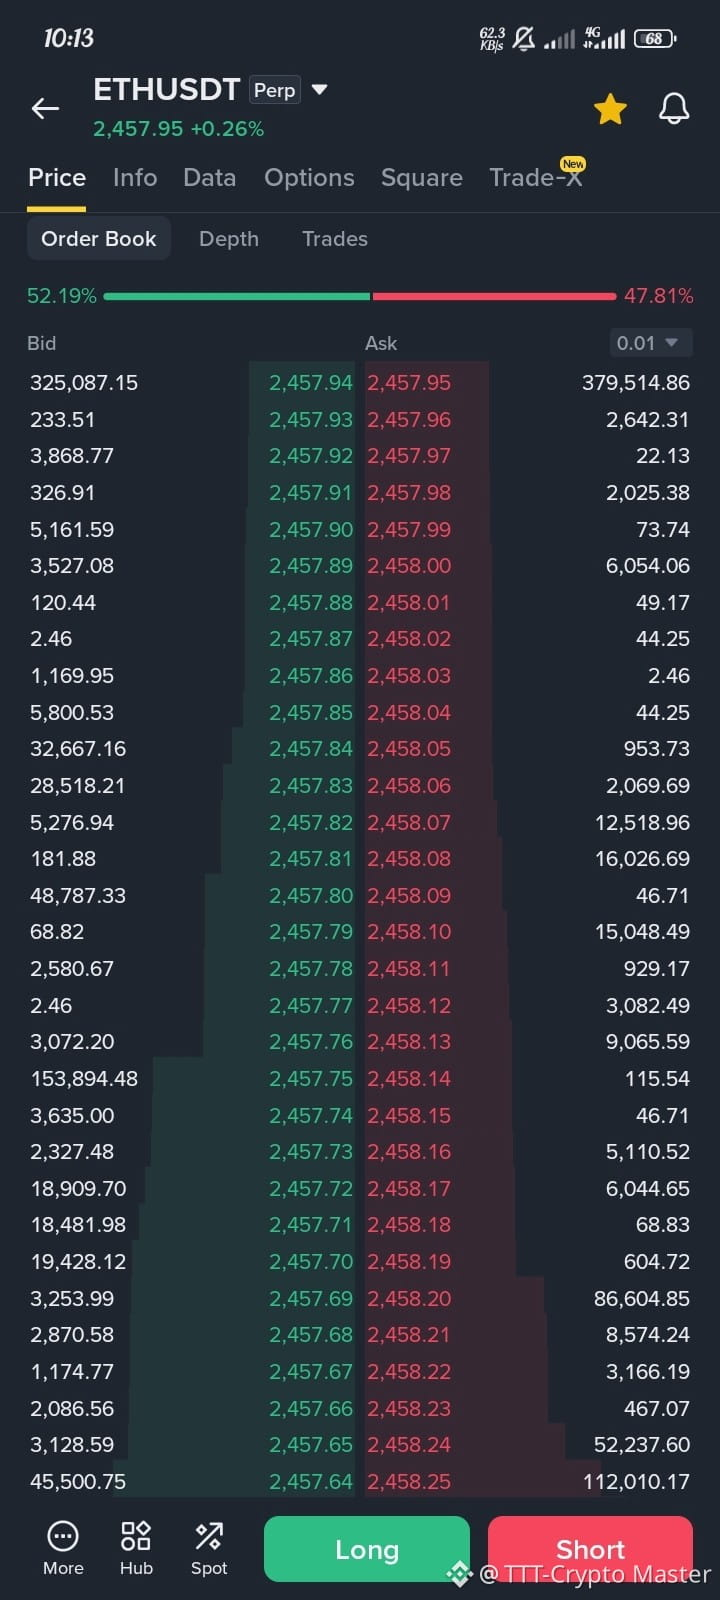
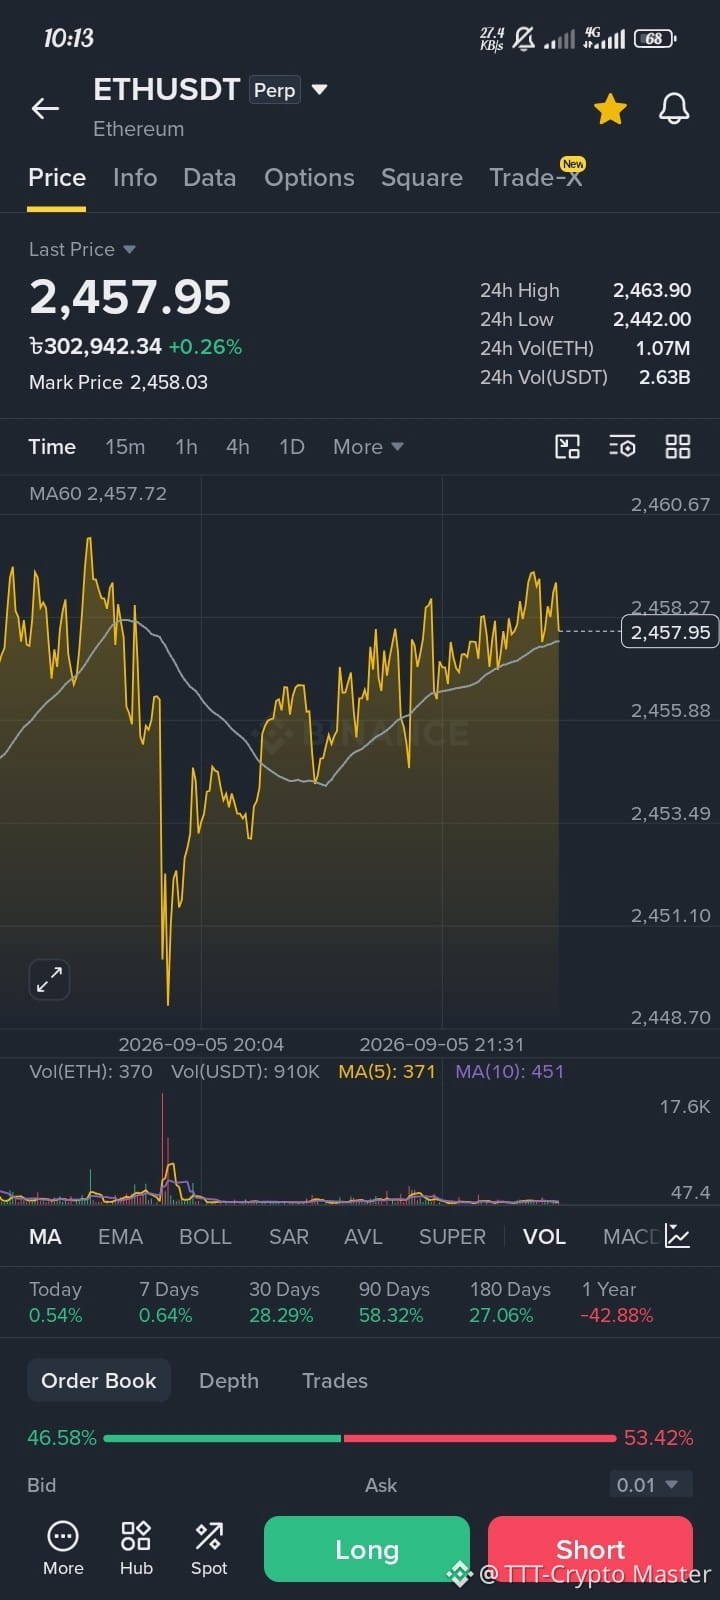
Dip Bought Instantly! ETH Targets $2,500 After Sweeping Short Liquidity
$ETH
{future}(ETHUSDT)
Dip Bought Instantly! ETH Targets $2,500 After Sweeping Short Liquidity
$ETH
$ETH
1
87
·
--
Artikel
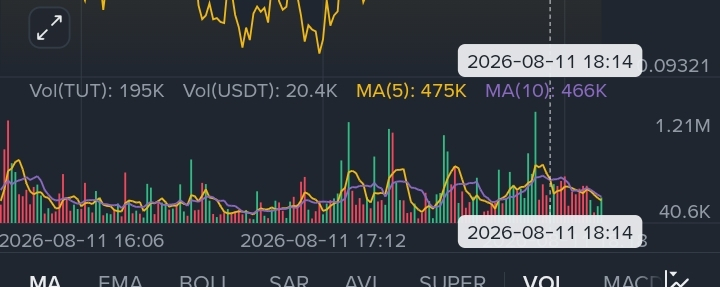
Analisis Pasar TUT/USDT: Volatilitas Tinggi pada Buku Pesanan Live dan Peran Level SupportLihat aktivitas perdagangan terbaru dan buku pesanan live token TUT (Tutorial) di pasar kripto mengungkap gambaran yang sangat dramatis dan sensitif. Setelah koreksi besar dalam 24 jam terakhir, harga saat ini berada dalam fase konsolidasi pada kisaran support tertentu.
Mari lakukan analisis profesional terhadap arus pasar live saat ini, pergeseran likuiditas, serta parameter teknis.
1. Situasi Pasar Saat Ini dan Pergerakan Harga
Pasangan TUT/USDT saat ini diperdagangkan dalam kisaran $0.1000 hingga $0.1010, yang menunjukkan penurunan sekitar 13,3% hingga 14,0% dalam 24 jam terakhir.
Analisis Pasar TUT/USDT: Volatilitas Tinggi pada Buku Pesanan Live dan Peran Level Support
Lihat aktivitas perdagangan terbaru dan buku pesanan live token TUT (Tutorial) di pasar kripto mengungkap gambaran yang sangat dramatis dan sensitif. Setelah koreksi besar dalam 24 jam terakhir, harga saat ini berada dalam fase konsolidasi pada kisaran support tertentu.
Mari lakukan analisis profesional terhadap arus pasar live saat ini, pergeseran likuiditas, serta parameter teknis.
1. Situasi Pasar Saat Ini dan Pergerakan Harga
Pasangan TUT/USDT saat ini diperdagangkan dalam kisaran $0.1000 hingga $0.1010, yang menunjukkan penurunan sekitar 13,3% hingga 14,0% dalam 24 jam terakhir.
Mari lakukan analisis profesional terhadap arus pasar live saat ini, pergeseran likuiditas, serta parameter teknis.
1. Situasi Pasar Saat Ini dan Pergerakan Harga
Pasangan TUT/USDT saat ini diperdagangkan dalam kisaran $0.1000 hingga $0.1010, yang menunjukkan penurunan sekitar 13,3% hingga 14,0% dalam 24 jam terakhir.
1
213
·
--
Artikel
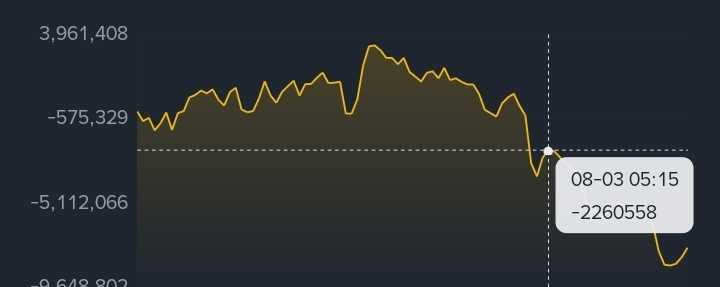
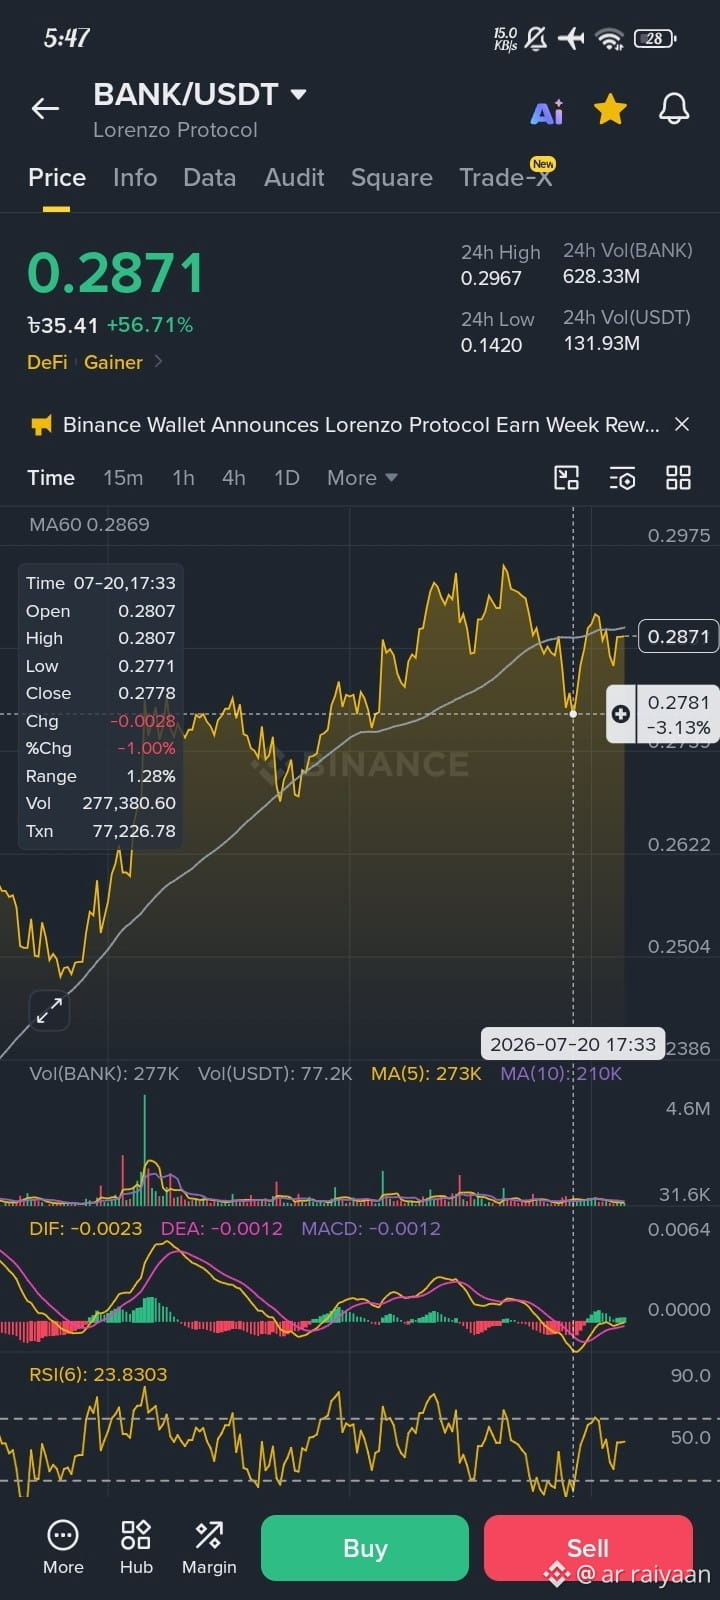
Update Pasar: Kebocoran Parah pada Token BANK dan Peringatan Pembuangan Mega untuk Bitcoin (BTC)!Teman-teman! Hari ini saya akan membahas dua topik penting. Yang pertama adalah kondisi terkini token BANK/USDT milik Lorenzo Protocol dan yang kedua adalah peta jalan analis yang menakutkan namun tetap realistis untuk Bitcoin (BTC). Mari kita lihat apa yang dikatakan datanya.
1. BANK/USDT - Beli Saat Turun atau Terjebak?
Grafik token BANK pasti membuat siapa pun mengernyit. Mari kita lakukan analisis teknikal dan arus dananya:
Kejatuhan yang Parah: Token ini saat ini diperdagangkan di $0.0439 dan turun sekitar 10,77% dalam 24 jam terakhir. Tapi yang paling menakutkan adalah bahwa token ini telah jatuh sekitar 89,06% dalam 7 hari terakhir! Penurunan sedrastis itu dalam waktu seminggu saja menunjukkan bahwa telah terjadi aksi jual besar-besaran.
Update Pasar: Kebocoran Parah pada Token BANK dan Peringatan Pembuangan Mega untuk Bitcoin (BTC)!
Teman-teman! Hari ini saya akan membahas dua topik penting. Yang pertama adalah kondisi terkini token BANK/USDT milik Lorenzo Protocol dan yang kedua adalah peta jalan analis yang menakutkan namun tetap realistis untuk Bitcoin (BTC). Mari kita lihat apa yang dikatakan datanya.
1. BANK/USDT - Beli Saat Turun atau Terjebak?
Grafik token BANK pasti membuat siapa pun mengernyit. Mari kita lakukan analisis teknikal dan arus dananya:
Kejatuhan yang Parah: Token ini saat ini diperdagangkan di $0.0439 dan turun sekitar 10,77% dalam 24 jam terakhir. Tapi yang paling menakutkan adalah bahwa token ini telah jatuh sekitar 89,06% dalam 7 hari terakhir! Penurunan sedrastis itu dalam waktu seminggu saja menunjukkan bahwa telah terjadi aksi jual besar-besaran.
1. BANK/USDT - Beli Saat Turun atau Terjebak?
Grafik token BANK pasti membuat siapa pun mengernyit. Mari kita lakukan analisis teknikal dan arus dananya:
Kejatuhan yang Parah: Token ini saat ini diperdagangkan di $0.0439 dan turun sekitar 10,77% dalam 24 jam terakhir. Tapi yang paling menakutkan adalah bahwa token ini telah jatuh sekitar 89,06% dalam 7 hari terakhir! Penurunan sedrastis itu dalam waktu seminggu saja menunjukkan bahwa telah terjadi aksi jual besar-besaran.
1
224
·
--
Artikel
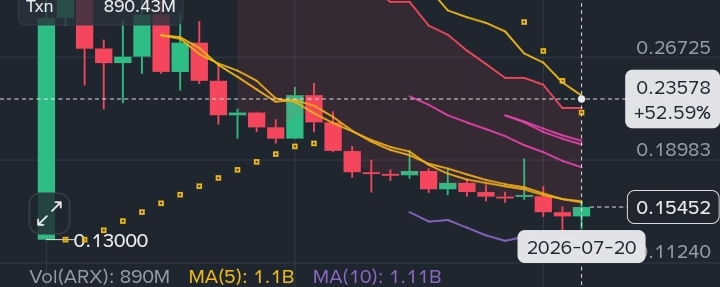
Analisis Teknis ARX (Arcium): Apakah Bullish Relief Rally Akan Segera Terjadi?Rincian Indikator Teknis
1. Price Action & Bollinger Bands
Pantulan Support: Harga ARX menemukan support kuat di dasar terbarunya pada $0.13000. Berdasarkan chart, harga berhasil memantul kembali dengan menyentuh lower band Bollinger Band ($0.13057).
Rata-Rata Bergerak: Harga saat ini diperdagangkan tepat di bawah MA(7) - $0.15793. Jika level ini ditembus, target berikutnya adalah MA(25) - $0.20161.
2. Indikator Momentum (Pemulihan dari Oversold)
RSI (6): RSI saat ini berada di 31.93. Ini menunjukkan bahwa pasar berada di zona oversold yang sangat parah dan sekarang pembeli mulai kembali ke pasar dari sana.
Analisis Teknis ARX (Arcium): Apakah Bullish Relief Rally Akan Segera Terjadi?
Rincian Indikator Teknis
1. Price Action & Bollinger Bands
Pantulan Support: Harga ARX menemukan support kuat di dasar terbarunya pada $0.13000. Berdasarkan chart, harga berhasil memantul kembali dengan menyentuh lower band Bollinger Band ($0.13057).
Rata-Rata Bergerak: Harga saat ini diperdagangkan tepat di bawah MA(7) - $0.15793. Jika level ini ditembus, target berikutnya adalah MA(25) - $0.20161.
2. Indikator Momentum (Pemulihan dari Oversold)
RSI (6): RSI saat ini berada di 31.93. Ini menunjukkan bahwa pasar berada di zona oversold yang sangat parah dan sekarang pembeli mulai kembali ke pasar dari sana.
1. Price Action & Bollinger Bands
Pantulan Support: Harga ARX menemukan support kuat di dasar terbarunya pada $0.13000. Berdasarkan chart, harga berhasil memantul kembali dengan menyentuh lower band Bollinger Band ($0.13057).
Rata-Rata Bergerak: Harga saat ini diperdagangkan tepat di bawah MA(7) - $0.15793. Jika level ini ditembus, target berikutnya adalah MA(25) - $0.20161.
2. Indikator Momentum (Pemulihan dari Oversold)
RSI (6): RSI saat ini berada di 31.93. Ini menunjukkan bahwa pasar berada di zona oversold yang sangat parah dan sekarang pembeli mulai kembali ke pasar dari sana.
1
438
·
--
Artikel
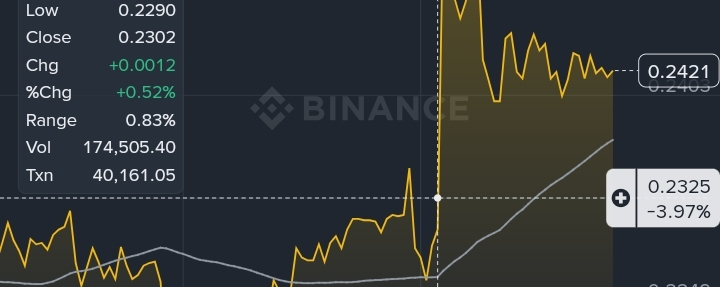
$BANK/USDT Breakout: Apa indikator teknis dan data on-chain yang memberikan sinyal?Cara pasangan BANK/USDT bergerak saat ini benar-benar menakjubkan! Harga telah naik sekitar 129% dalam 24 jam terakhir dan berhasil menegaskan posisinya sebagai salah satu peraih kenaikan tertinggi di pasar. Setelah pergerakan sebesar itu, wajar jika para trader mulai mengamankan sebagian profit. Dan itulah mengapa sekarang harga mulai pulih sedikit, mendekati $0.24.
Namun, hal paling positif bagi saya adalah harga belum mengalami penurunan tajam. Sebaliknya, harga tetap bertahan tepat di atas MA60 (Moving Average 60). Ini jelas menunjukkan bahwa para pembeli masih sepenuhnya mengendalikan pasar.
$BANK/USDT Breakout: Apa indikator teknis dan data on-chain yang memberikan sinyal?
Cara pasangan BANK/USDT bergerak saat ini benar-benar menakjubkan! Harga telah naik sekitar 129% dalam 24 jam terakhir dan berhasil menegaskan posisinya sebagai salah satu peraih kenaikan tertinggi di pasar. Setelah pergerakan sebesar itu, wajar jika para trader mulai mengamankan sebagian profit. Dan itulah mengapa sekarang harga mulai pulih sedikit, mendekati $0.24.
Namun, hal paling positif bagi saya adalah harga belum mengalami penurunan tajam. Sebaliknya, harga tetap bertahan tepat di atas MA60 (Moving Average 60). Ini jelas menunjukkan bahwa para pembeli masih sepenuhnya mengendalikan pasar.
Namun, hal paling positif bagi saya adalah harga belum mengalami penurunan tajam. Sebaliknya, harga tetap bertahan tepat di atas MA60 (Moving Average 60). Ini jelas menunjukkan bahwa para pembeli masih sepenuhnya mengendalikan pasar.
1
290
Masuk untuk menjelajahi konten lainnya
Bergabunglah dengan pengguna kripto global di Binance Square
⚡️ Dapatkan informasi terbaru dan berguna tentang kripto.
💬 Dipercayai oleh bursa kripto terbesar di dunia.
👍 Temukan wawasan nyata dari kreator terverifikasi.
Email/Nomor Ponsel
Topik Sedang Tren
CardanoAddedToX402KitForADAPayments
2 penayangan
20 Berdiskusi
#cardanoaddedtox402kitforadapayments
🚨 CARDANO BARU MASUK KE PERLOMBAAN PEMBAYARAN BERBASIS AI! 🤖🔥
$ADA kini menjadi bagian resmi dari x402 SDK, membuka jalur pembayaran baru untuk aplikasi dan agen AI.
💥 Apa yang berubah?
• Aplikasi bisa membayar panggilan API menggunakan ADA atau token asli Cardano
• Pembayaran bisa dilakukan langsung melalui permintaan web standar
• Tidak diperlukan akun, API key, atau checkout tradisional
• Cardano bergabung dengan ekosistem pembayaran mesin-ke-mesin yang terus berkembang
• Fasilitator x402 bahkan sudah menyelesaikan transaksi nyata di jaringan pra-produksi Cardano
Ini bisa memberi $ADA narasi utilitas AI + pembayaran yang lebih segar karena agen otonom semakin membutuhkan cara membayar untuk data dan layanan online.
⚠️ Adopsi mainnet dan volume pembayaran nyata masih perlu berkembang.
🔥 Apakah ini awal dari narasi ADA yang baru?
#Cardano #ADA #AI
Faizan Crypto Learner
·Disukai 0 Kali
·18 penayangan
XRPRises8%
6,032 penayangan
370 Berdiskusi
AMDHits$1TrillionMarketCap
5 penayangan
11 Berdiskusi