

HALIFI
8.9k Publications

HALIFI
Signaler
Bloquer l’utilisateur
إخلاء مسؤولية لا يتحمل صاحب الحساب أي مسؤولية ولا يعد أي محتوى منشور نصيحة استثمارية جميع .المنشورات لأغراض تعليمية وإعلامية فقط
2.8K+ Suivis
1.4K+ Abonnés
1.2K+ J’aime
Publications
Tous
Citations
Vidéos
Direct
·
--
Voir la traduction
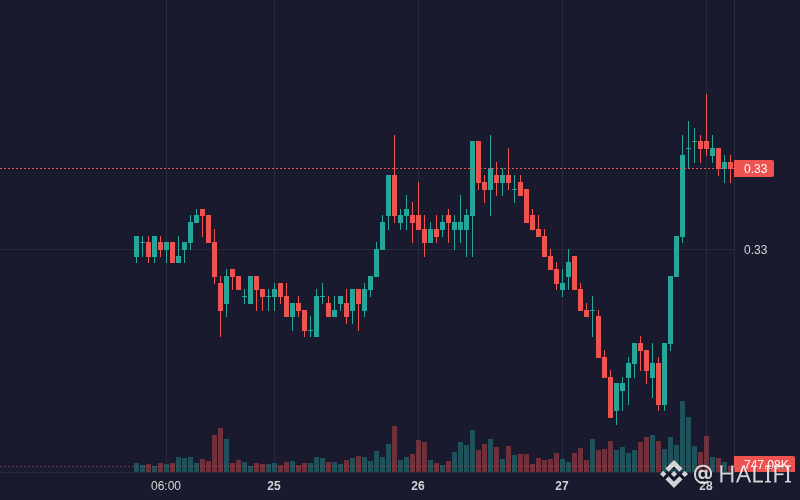
$TRX TRX is showing bullish movement: 0.64% (Crypto).
Volume: 30.46M | Last: $0.331100
Key signals: high trader activity.
Bias Daily: BULLISH 🟢 | Weekly: BULLISH 🟢
TRX rose 0.64% over 24h to $0.3312 following institutional ETF catalysts and strong concentrated capital inflows.
**Institutional ETF integration (High)**: Canary Capital filed/introduced TRXS physical staking ETF → boosts long-term spot demand expectations
- **Large inflow surge (High)**: Spot net inflows topped +$4.7M in a single hour with >60% large-order share → propelled price from $0.3277 to $0.3315
- **Ecosystem expansion (Medium)**: Protocol upgrade and upcoming tokenized RWA assets rollout strengthen network fundamentals
#TRX #BinanceSquare #EarningsSeason #CanGoogleDefindItsCore #Crypto
27
·
--
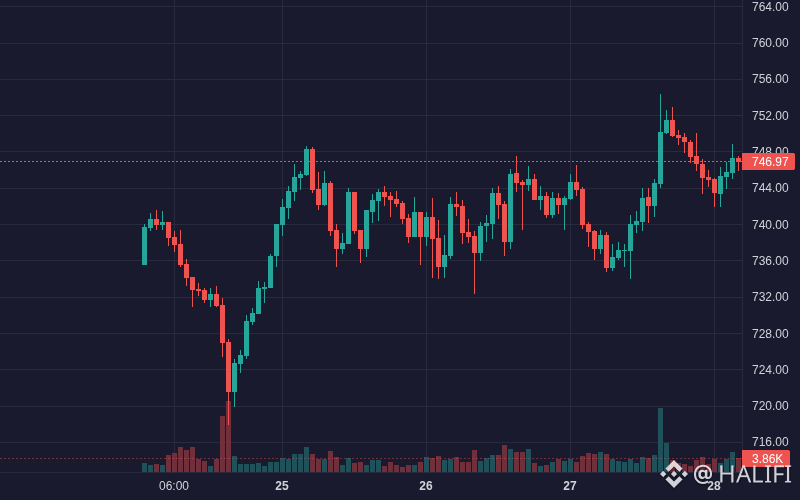
$BNB BNB affiche une tendance haussière : 1.00 % (Crypto).
Volume : 81.94M | Dernier cours : $746.31
Signaux clés : forte activité des traders.
Biais journalier : HAUSSIER 🟢 | Hebdomadaire : HAUSSIER 🟢
BNB a gagné 1.33 % en 24 h, atteignant $747.19, à la suite d’une exposition institutionnelle sur le Nasdaq et d’importants afflux de capitaux liés à des ordres importants.
**Visibilité institutionnelle et dynamique (élevées)** : la cérémonie de changement d’image de marque de l’entreprise sur le Nasdaq, ainsi que les projets de réseau L1 à haut débit et le hard fork Jenner, ont stimulé une forte demande sur le marché au comptant.
- **Afflux des baleines et des ordres importants (élevé)** : plus de $14M d’afflux nets sur deux heures consécutives, dominés par des ordres importants, ont fait passer BNB de $744 à un sommet de $751.50.
- **Structure de tendance haussière (modérée)** : le cours reste au-dessus des EMA 7, 25 et 99, confirmant la vigueur durable de la tendance à moyen terme.
#BNB #BinanceSquare #EarningsSeason #CanGoogleDefindItsCore #Crypto
24
·
--
Voir la traduction
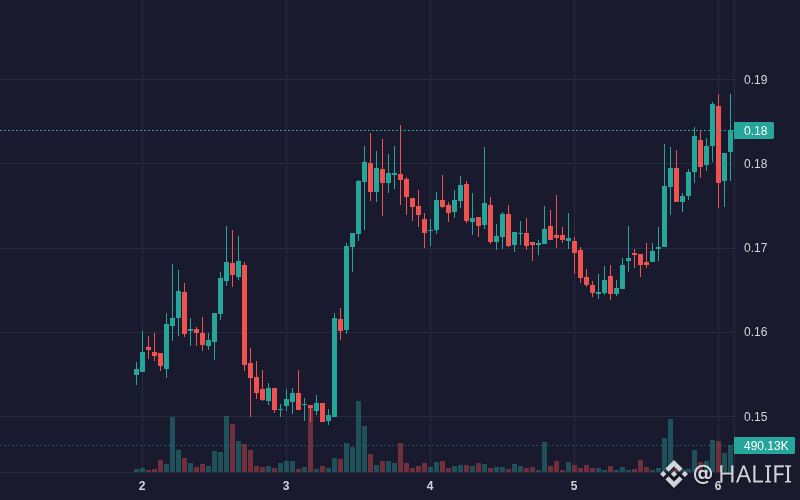
$STG STG is showing bullish movement: 11.04% (Crypto).
Volume: 935.43K | Last: $0.184000
Key signals: strong momentum, high volatility.
Bias Daily: BULLISH 🟢 | Weekly: BULLISH 🟢
#STG #BinanceSquare #EarningsSeason #CanGoogleDefindItsCore #Crypto
$STG STG is showing bullish movement: 11.04% (Crypto).
Volume: 935.43K | Last: $0.184000
Key signals: strong momentum, high volatility.
Bias Daily: BULLISH 🟢 | Weekly: BULLISH 🟢
#STG #BinanceSquare #EarningsSeason #CanGoogleDefindItsCore #Crypto
Volume: 935.43K | Last: $0.184000
Key signals: strong momentum, high volatility.
Bias Daily: BULLISH 🟢 | Weekly: BULLISH 🟢
#STG #BinanceSquare #EarningsSeason #CanGoogleDefindItsCore #Crypto
14
·
--
Voir la traduction
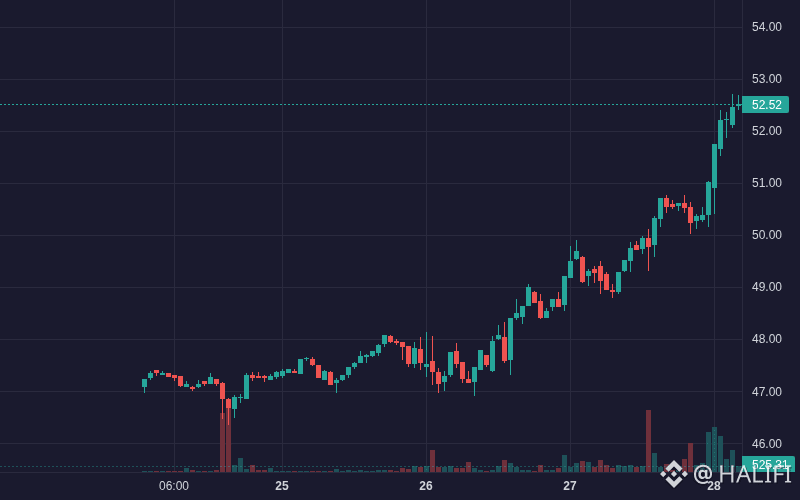
$DRAMB DRAMB is showing bullish movement: 6.45% (Crypto).
Volume: 2.00M | Last: $52.50
Key signals: strong momentum, high volatility.
Bias Daily: BULLISH 🟢 | Weekly: BULLISH 🟢
DRAMB climbed 6.41% over the past 24 hours to $52.45, powered by AI memory demand and robust inflows.
**Industry demand surge (High)**: Major tech agreements for AI data-center memory chip demand through 2027 sparked positive sentiment across the DRAM sector
- **Aggressive capital inflows (High)**: Over +$720K net inflow recorded in late trading hours → fueled breakout toward $52.45
- **Technical breakout (Medium)**: Bullish alignment across EMA 7/25/99 and MACD histogram expansion (+0.165) accelerated price momentum above Bollinger upper band
#DRAMB #BinanceSquare #EarningsSeason #CanGoogleDefindItsCore #Crypto
10
·
--
Voir la traduction
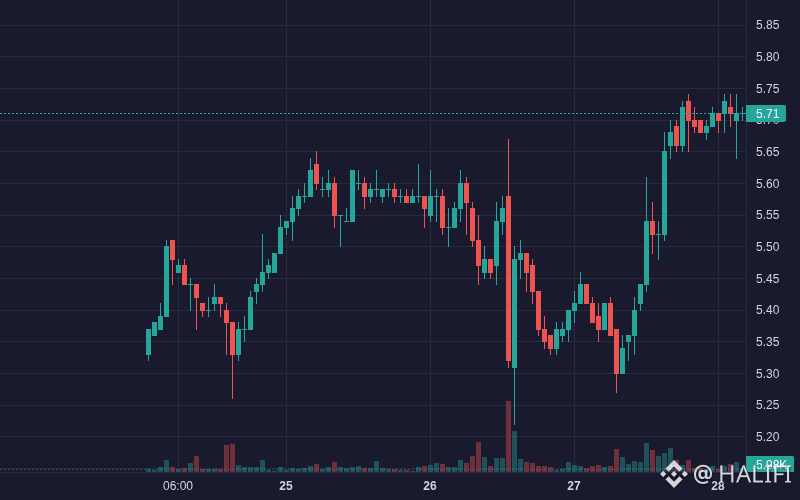
$BNCB BNCB is showing bullish movement: 5.54% (Crypto).
Volume: 3.93M | Last: $5.71
Key signals: strong momentum, high volatility.
Bias Daily: BULLISH 🟢 | Weekly: BULLISH 🟢
BNCB rose 6.3% over 24 hours driven by corporate rebranding milestones and expanding decentralized exchange liquidity integrations.
**Corporate rebrand & treasury visibility (High)**: Nasdaq opening bell rebrand ceremony and disclosure of 515,000 BNB treasury reserves → catalyzed institutional buyer interest
- **DeFi liquidity adoption (Medium)**: BNB Chain launchpads integrated BNCB into primary liquidity pools → broadened on-chain utility and ecosystem absorption
- **Spot inflows & breakout (Medium)**: Successive large buy inflows topping $280K sparked bullish momentum above the 25-EMA and 99-EMA
#BNCB #BinanceSquare #EarningsSeason #CanGoogleDefindItsCore #Crypto
8
·
--
Voir la traduction
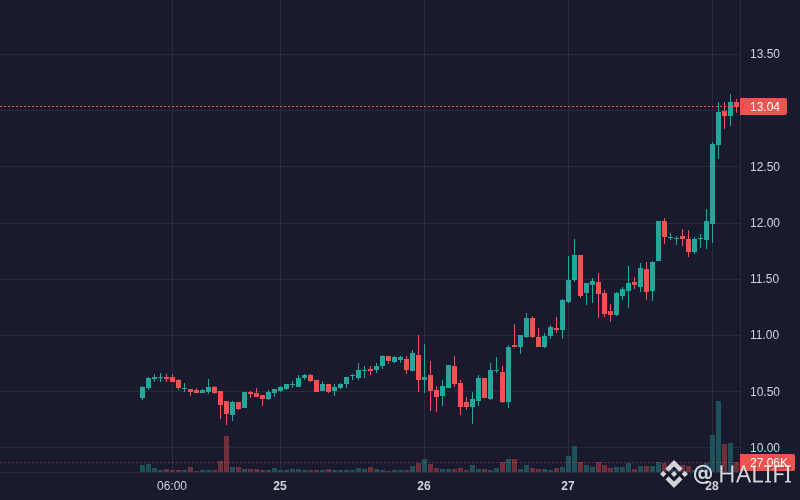
$KORUB KORUB is showing bullish movement: 14.01% (Crypto).
Volume: 9.89M | Last: $13.02
Key signals: strong momentum, high volatility.
Bias Daily: BULLISH 🟢 | Weekly: BULLISH 🟢
KORUB rallied 13.09% over 24h on semiconductor sector momentum, but extreme overbought RSI signals potential near-term correction.
**Korean semiconductor momentum (High)**: AI optimism fueled sharp gains in underlying equities Samsung and SK Hynix → amplified 3x leveraged ETF demand.
- **Breakout volume expansion (High)**: Hourly turnover surged over $5.38M as price breached upper Bollinger Bands ($12.83) → triggered trend acceleration.
- **Bullish trend alignment (Medium)**: Price crossed above EMA 7 ($12.46) and EMA 25 ($11.86), while MACD histogram expanded positively (+0.107).
#KORUB #BinanceSquare #EarningsSeason #CanGoogleDefindItsCore #Crypto
8
·
--
Voir la traduction
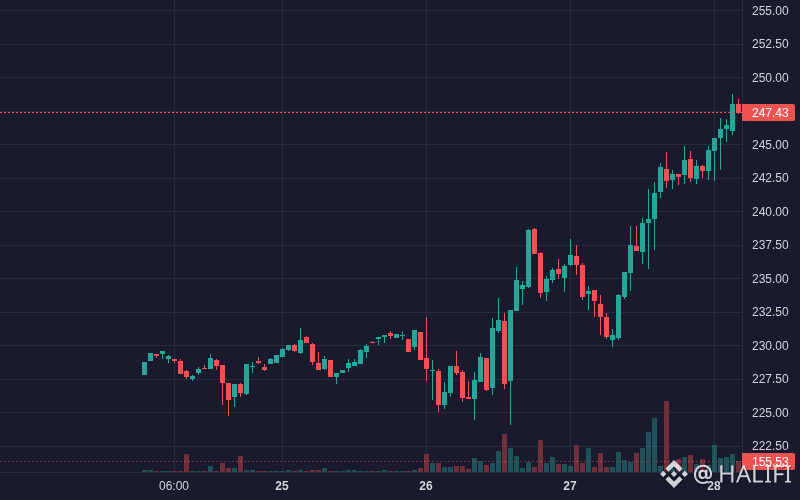
$MRVLB MRVLB is showing bullish movement: 6.30% (Crypto).
Volume: 1.53M | Last: $247.51
Key signals: strong momentum, high volatility.
Bias Daily: BULLISH 🟢 | Weekly: BULLISH 🟢
MRVLB climbed 5.3% over 24h supported by tokenized asset adoption and bullish technicals despite overbought RSI signals.
**Tokenized asset narrative (High)**: Expanding adoption as tokenized equities reach $3.09B market cap → boosts structural demand for Marvell tokenized shares
- **AI semiconductor fundamentals (Medium)**: Favorable PEG ratio (~0.5) reinforces bullish sentiment around underlying growth projections
- **Bullish momentum breakout (Medium)**: Price crossed above EMA-7/25/99 with MACD histogram expanding positive → triggered technical trend-following buying
#MRVLB #BinanceSquare #EarningsSeason #CanGoogleDefindItsCore #Crypto
7
·
--
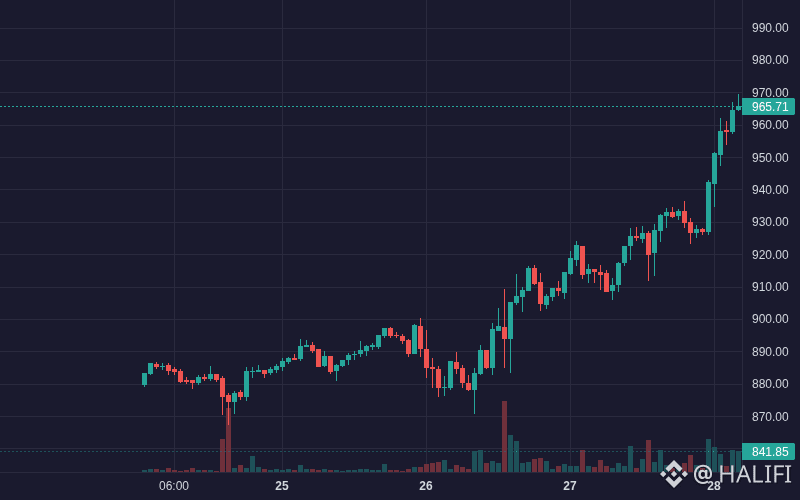
$MUB MUB affiche une tendance haussière : 5.59 % (Crypto).
Volume : 11.88M | Dernier cours : 965,60 $
Signaux clés : forte dynamique, volatilité élevée.
Tendance quotidienne : HAUSSIÈRE 🟢 | Hebdomadaire : HAUSSIÈRE 🟢
MUB a progressé de 4.67 % en 24 h, à 958,14 $, grâce à l’adoption des actifs tokenisés, même si un RSI en zone de surachat laisse présager un repli.
**Adoption des actions tokenisées (élevée)** : L’expansion des produits bStocks sur différentes plateformes de négociation et l’ajout de fonctionnalités pour les bots soutiennent le volume au comptant et la demande d’exposition aux actifs sous-jacents.
- **Demande de DRAM pour la robotique (moyenne)** : Les prévisions du secteur annonçant une forte hausse de l’utilisation de DRAM basse consommation en robotique renforcent les perspectives à long terme de Micron.
- **Cassure technique (moyenne)** : Le cours a franchi à la hausse la bande supérieure de Bollinger (955,71 $), tandis que l’histogramme MACD s’élargissait à +2.39 → accélération de la dynamique haussière.
#MUB #BinanceSquare #EarningsSeason #CanGoogleDefindItsCore #Crypto
5
·
--
Voir la traduction
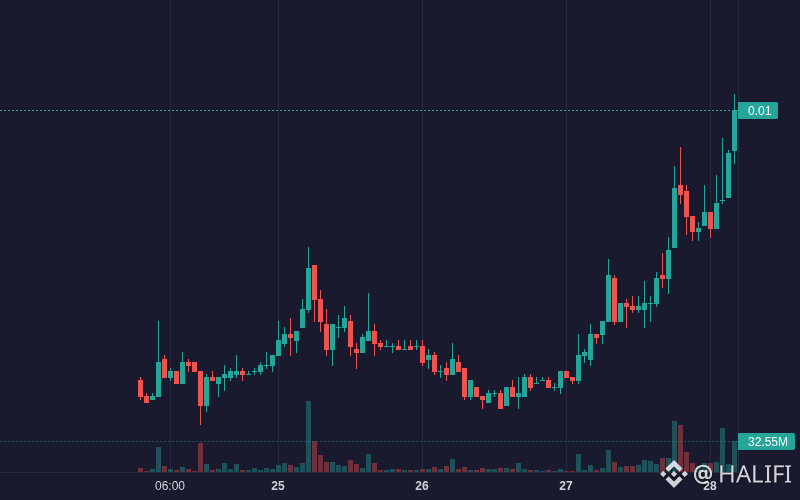
$SOLV SOLV is showing bullish movement: 17.79% (Crypto).
Volume: 1.82M | Last: $0.005230
Key signals: strong momentum, high volatility.
Bias Daily: BULLISH 🟢 | Weekly: BULLISH 🟢
SOLV advanced 11.1% over the past 24h, reaching $0.00492 amid strong volume, despite looming late-October unlock risks.
**Volume breakout (High)**: Trading volume surged past $1.18M USDT alongside a push above the upper Bollinger Band → price rallied from $0.00443 to a high of $0.00496
- **Bullish trend alignment (Medium)**: Moving averages shifted into positive alignment (EMA 7 > EMA 25 > EMA 99) with MACD histogram expanding positive → supported steady upward momentum
- **Net spot demand (Medium)**: Persistent retail buying with positive net inflows totaling over $73K in recent hours helped absorb pullbacks
#SOLV #BinanceSquare #EarningsSeason #CanGoogleDefindItsCore #Crypto
6
·
--
Voir la traduction
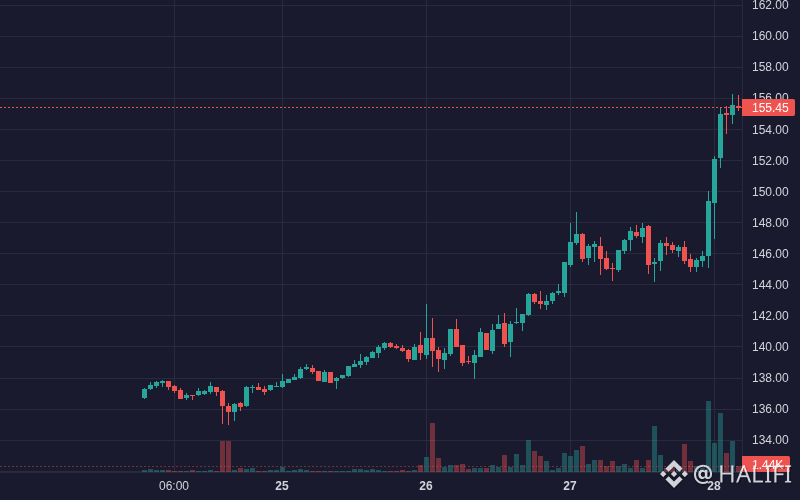
$SKHYB SKHYB is showing bullish movement: 6.23% (Crypto).
Volume: 17.23M | Last: $155.44
Key signals: strong momentum, high volatility, high trader activity.
Bias Daily: BULLISH 🟢 | Weekly: BULLISH 🟢
SKHYB gained 5.8% over the past 24 hours, reaching $155.00 on strong earnings despite overbought technicals.
**Earnings surge & AI expansion (High)**: Q3 earnings beat expectations with triple-digit profit growth → accelerated HBM4 factory capacity plans spurred strong buying
- **Technical breakout (High)**: Sharp move from $145.84 to $155.00 (+6.3%) → price surged above the upper Bollinger Band ($153.42) alongside a bullish MACD histogram expansion (+0.82)
- **Volume expansion (Medium)**: Turnover spiked above $5.9M on the initial breakout candle, validating upward momentum
#SKHYB #BinanceSquare #EarningsSeason #CanGoogleDefindItsCore #Crypto
14
·
--
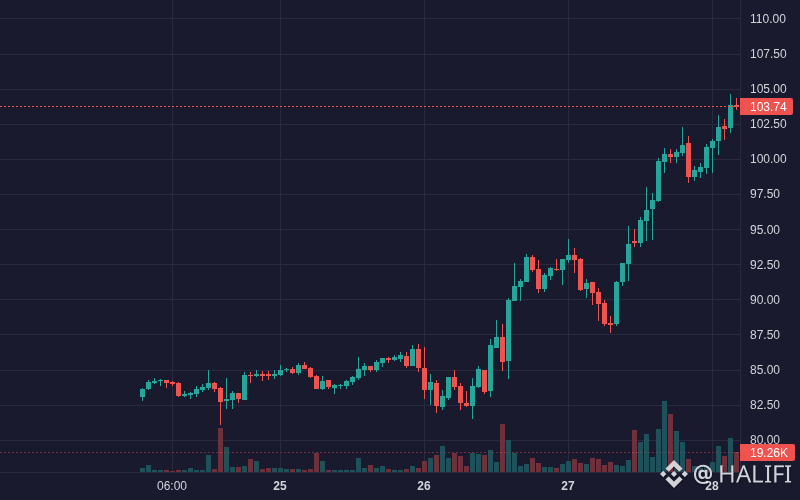
$SOXLB SOXLB affiche une tendance haussière : 14,73 % (crypto).
Volume : 53,67 M | Dernier cours : 103,76 $
Signaux clés : forte dynamique, volatilité élevée, activité de trading intense.
Tendance journalière : HAUSSIÈRE 🟢 | Hebdomadaire : HAUSSIÈRE 🟢
SOXLB a bondi de 12,1 % en 24 h pour atteindre 102,21 $, bien qu’un RSI en zone de surachat et des sorties nettes de capitaux persistantes présentent des risques de repli.
**Demande d’actions tokenisées (élevée)** : l’adoption croissante des jetons adossés à des actions américaines sur les plateformes centralisées a stimulé l’appétit pour les titres de semi-conducteurs à bêta élevé.
- **Cassure haussière de la dynamique (moyenne)** : le cours a franchi la bande de Bollinger supérieure (96,89 $) pour atteindre 102,21 $, tandis que l’EMA-7 est passée au-dessus de l’EMA-25, parallèlement à une expansion soutenue de l’histogramme MACD positif.
- **Volume de trading élevé (moyen)** : le volume a fortement augmenté, atteignant 14 M USDT par heure, absorbant les prises de bénéfices et soutenant la tendance haussière.
#SOXLB #BinanceSquare #EarningsSeason #CanGoogleDefindItsCore #Crypto
7
·
--
Voir la traduction
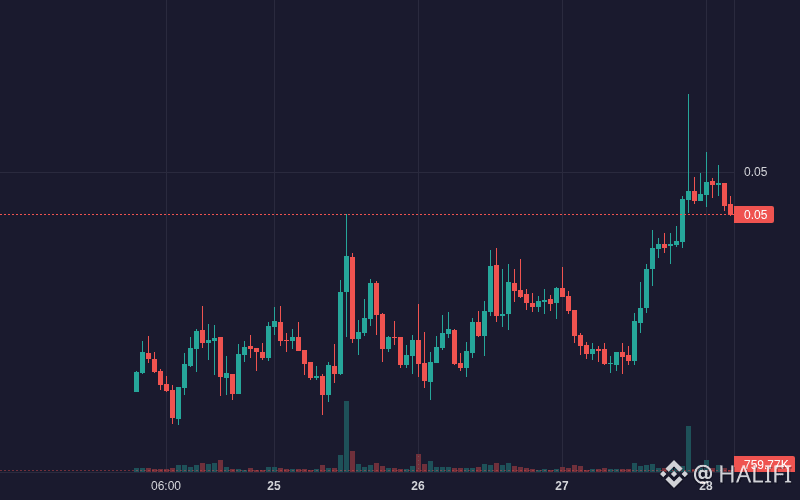
$MEGA MEGA is showing bullish movement: 7.51% (Crypto).
Volume: 3.79M | Last: $0.048960
Key signals: strong momentum, high volatility, high trader activity.
Bias Daily: BULLISH 🟢 | Weekly: BULLISH 🟢
MEGA rose 9.2% over 24 hours to $0.0497 amid campaign incentives, though upcoming unlocks pose near-term headwinds.
**Campaign incentive extension (High)**: Mega Boost campaign extended through October 31 → sustained user engagement and retail speculative interest
- **Spot volume breakout (High)**: Hourly volume spiked past $2.91M as price broke above the $0.0465 resistance → accelerated bullish momentum
- **Large buyer accumulation (Medium)**: Peak net inflows reached +$107.6K with high large-inflow ratio (0.50), supporting the upward price push
#MEGA #BinanceSquare #EarningsSeason #CanGoogleDefindItsCore #Crypto
9
·
--
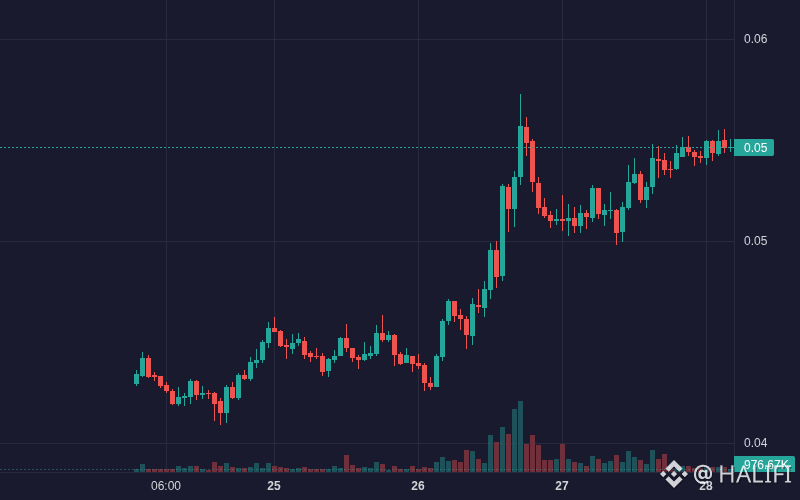
$CHIP CHIP affiche une tendance haussière : 6.74% (Crypto).
Volume : 5.70M | Dernier cours : $0.054780
Signaux clés : forte dynamique, forte volatilité, activité élevée des traders.
Tendance quotidienne : HAUSSIÈRE 🟢 | Hebdomadaire : HAUSSIÈRE 🟢
CHIP a progressé de 6.95% au cours des dernières 24 heures, atteignant $0.05496, porté par des informations sur un rachat, malgré un important excédent de jetons bloqués.
**Catalyseur du rachat de jetons (Élevé)** : Un rachat de CHIP d’un montant annoncé de $1M a suscité un intérêt acheteur, dans un contexte d’engouement croissant pour les projets liés au récit des infrastructures d’IA.
- **Poursuite de la tendance et moyennes mobiles (Élevé)** : Le cours est passé au-dessus de l’EMA 7 ($0.0545) et est resté au-dessus de l’EMA 25 ($0.0531) et de l’EMA 99 ($0.0491) → dynamique haussière soutenue sur 24 h.
- **Pic des entrées de capitaux importantes (Moyen)** : La forte hausse du volume a entraîné des entrées nettes totales de +$505.5K, dont $395.6K provenant de gros ordres, faisant passer le cours de $0.0526 à $0.0541.
#CHIP #BinanceSquare #EarningsSeason #CanGoogleDefindItsCore #Crypto
8
·
--
Voir la traduction
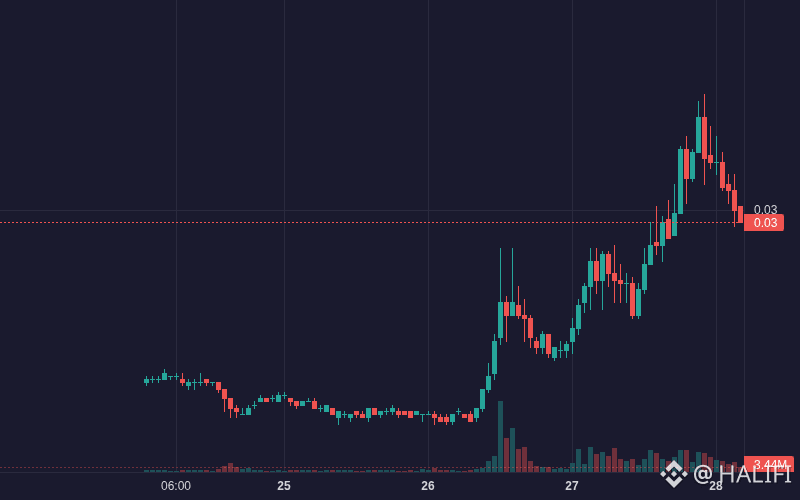
$BANK BANK is showing bullish movement: 6.09% (Crypto).
Volume: 8.83M | Last: $0.029600
Key signals: strong momentum, high volatility, high trader activity.
Bias Daily: BULLISH 🟢 | Weekly: BULLISH 🟢
BANK gained 7.37% over 24 hours after hitting $0.0329, but consecutive net outflows indicate momentum exhaustion.
**Speculative momentum buying (High)**: Spot price pushed from $0.0285 to a peak of $0.0329 → accompanied by surge in large buyer inflows exceeding $110K per hour
- **Technical breakout expansion (Medium)**: Price pierced the upper Bollinger Band with MACD histogram widening → attracted technical trend-followers
- **Momentum-driven volume spikes (Low)**: Hourly volume spiked above $3.3M during early impulsive legs despite a total lack of protocol fundamental announcements
#BANK #BinanceSquare #EarningsSeason #CanGoogleDefindItsCore #Crypto
15
·
--
Voir la traduction
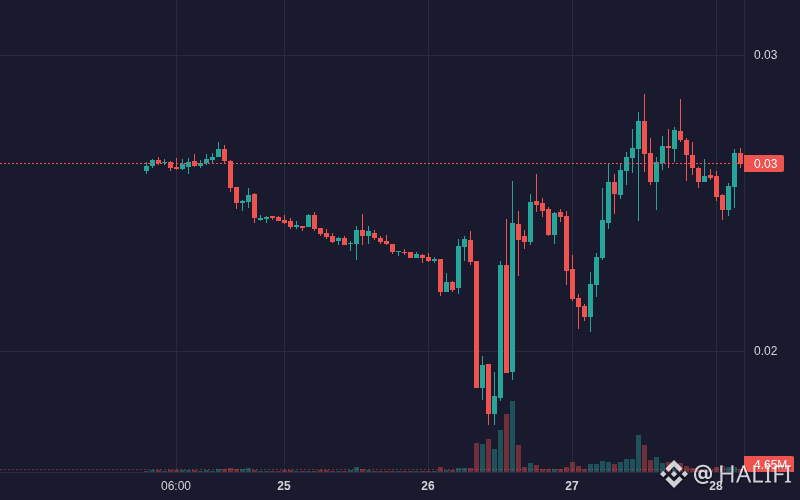
$HUMA HUMA is showing bullish movement: 17.30% (Crypto).
Volume: 11.83M | Last: $0.026440
Key signals: strong momentum, high volatility, high trader activity.
Bias Daily: BULLISH 🟢 | Weekly: BULLISH 🟢
HUMA advanced 14.8% over the past 24 hours behind strong network traction, though upcoming unlocks pose near-term risk.
**PayFi volume & partner traction (High)**: Processed >$4.5B in transactions across Circle, Solana, and Stellar → boosted network fundamental valuation
- **Surging spot trading activity (Medium)**: Volume peaked at $6.45M during the test of $0.0277 resistance → ignited a multi-hour rally
- **Short-term momentum breakout (Medium)**: MACD flipped positive alongside RSI peaking at 81.4 → accelerated 24h upside from $0.0222 to $0.0277
#HUMA #BinanceSquare #EarningsSeason #CanGoogleDefindItsCore #Crypto
16
·
--
Voir la traduction
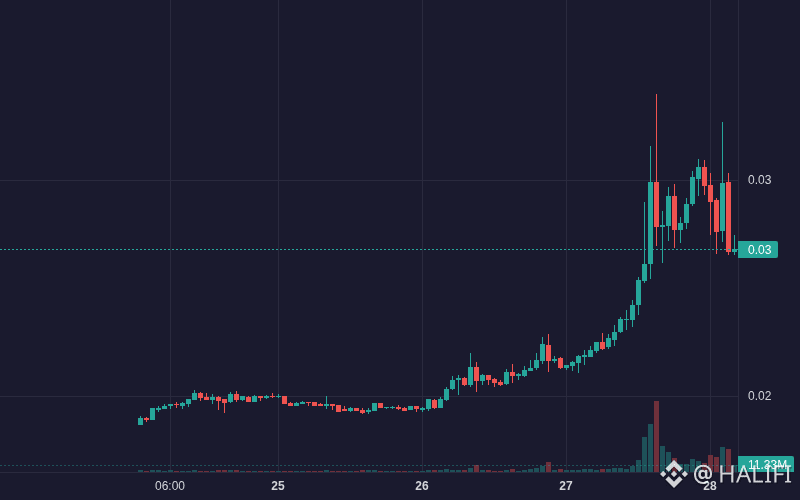
$HAEDAL HAEDAL is showing bullish movement: 21.60% (Crypto).
Volume: 19.98M | Last: $0.026910
Key signals: strong momentum, high volatility, high trader activity.
Bias Daily: BULLISH 🟢 | Weekly: BULLISH 🟢
HAEDAL surged 36.3% over 24 hours driven by speculative capital inflows, though upcoming token unlocks introduce downside risk.
**Speculative rotation (High)**: Traders targeting micro-cap DeFi assets prompted sharp upside momentum → price climbed from $0.0218 to peak at $0.0306.
- **Surging spot inflows (High)**: Large net inflows peaked at +$1.22M alongside massive volume surges exceeding $13.4M per hour.
- **Trend momentum breakout (Medium)**: Price crossed above EMA 7/25/99 bands → sustained strong bullish structure across short timeframes.
#HAEDAL #BinanceSquare #EarningsSeason #CanGoogleDefindItsCore #Crypto
13
·
--
Voir la traduction
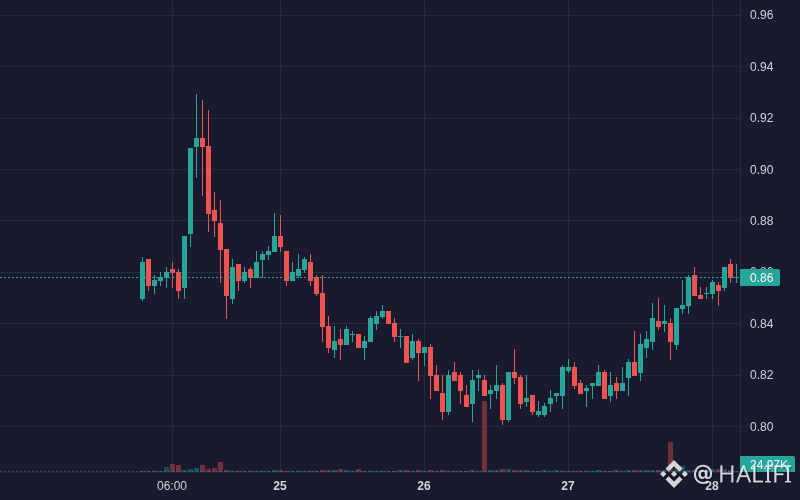
$VANA VANA is showing bullish movement: 5.41% (Crypto).
Volume: 3.32M | Last: $0.857000
Key signals: strong momentum, high volatility, high trader activity.
Bias Daily: BULLISH 🟢 | Weekly: BULLISH 🟢
VANA rebounded 5.8% over the past 24 hours to $0.862, driven by technical momentum off all-time lows.
**Bullish technical breakout (High)**: Price pushed decisively above the EMA_7, EMA_25, and EMA_99 alongside positive MACD histogram expansion → sparked strong upward momentum.
- **Spot net accumulation (Medium)**: Successive positive hourly inflows exceeding +$310K USDT absorbed previous selling pressure near the $0.80 historical floor.
- **AI DataDAO narrative (Low)**: Persistent interest in decentralized data monetization mechanisms provides underlying baseline support during technical rebounds.
#VANA #BinanceSquare #EarningsSeason #CanGoogleDefindItsCore #Crypto
36
·
--
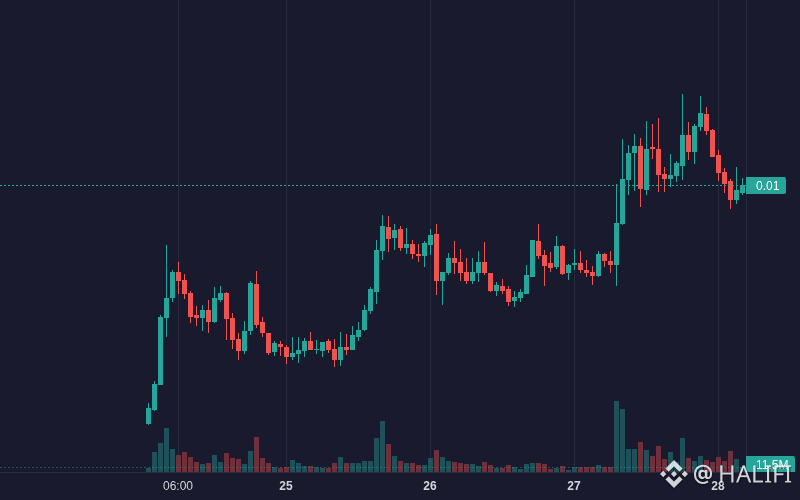
$REZ REZ affiche une évolution haussière : 8.32 % (Crypto).
Volume : 7.70M | Dernier cours : $0.005040
Signaux clés : forte dynamique, forte volatilité, activité élevée des traders.
Tendance quotidienne : HAUSSIÈRE 🟢 | Hebdomadaire : HAUSSIÈRE 🟢
REZ a gagné 8.3 % au cours des dernières 24 heures, atteignant $0.00497, après avoir reculé depuis un sommet de $0.00540, dans un contexte de prises de bénéfices.
**Franchissement à la hausse des volumes (Élevé)** : le volume des échanges a dépassé $3.2M pendant plusieurs heures consécutives → le cours est passé de $0.00465 à un sommet de $0.00540
- **Importants flux nets entrants (Modéré)** : des flux entrants horaires positifs et soutenus, totalisant plus de $1M, ont absorbé la résistance au-dessus du cours
- **Alignement de la tendance haussière (Modéré)** : l’EMA 7 à court terme est passée au-dessus des EMA 25 et EMA 99 → forte dynamique haussière confirmée
#REZ #BinanceSquare #EarningsSeason #CanGoogleDefindItsCore #Crypto
43
·
--
Voir la traduction
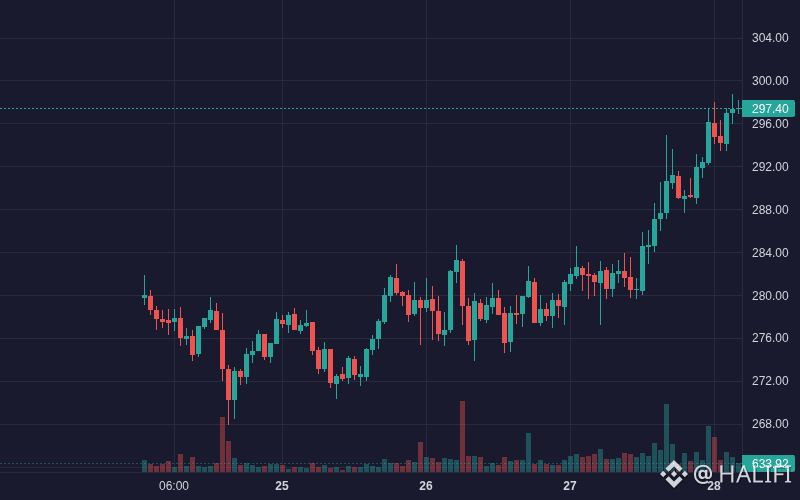
$BCH BCH is showing bullish movement: 5.80% (Crypto).
Volume: 10.84M | Last: $297.50
Key signals: strong momentum, high volatility, high trader activity.
Bias Daily: BULLISH 🟢 | Weekly: BULLISH 🟢
BCH climbed 5.36% over the last 24 hours behind strong large-inflow volume and trend-following momentum.
**Large-order spot inflows (High)**: Repeated surges in large net inflows, peaking at +$273K within an hour, fueled buying pressure → pushed price from $281.90 to $297.00
- **Bullish momentum breakout (Medium)**: MACD histogram expanded positively (+0.68) alongside EMA alignment (EMA7 > EMA25 > EMA99) → accelerated upward price continuation
#BCH #BinanceSquare #EarningsSeason #CanGoogleDefindItsCore #Crypto
66
·
--
Voir la traduction
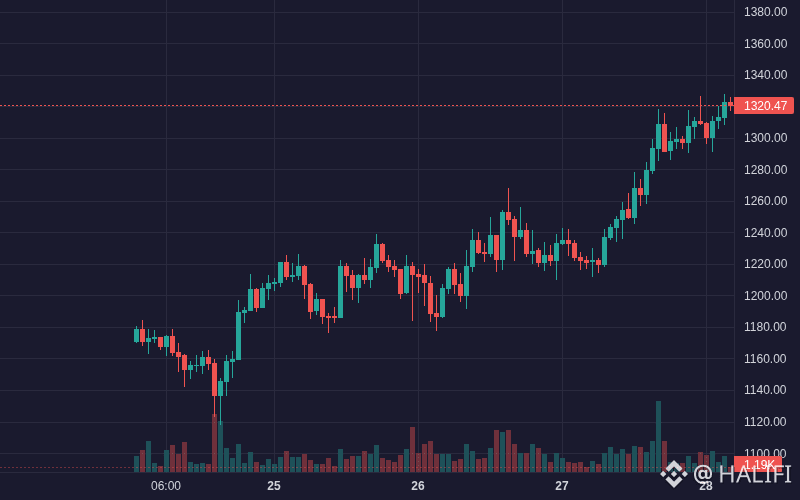
$ZEC ZEC is showing bullish movement: 7.88% (Crypto).
Volume: 164.60M | Last: $1320.69
Key signals: strong momentum, high volatility, high trader activity, massive volume inflow.
Bias Daily: BULLISH 🟢 | Weekly: BULLISH 🟢
ZEC gained 7.4% over 24 hours to $1,312.92, propelled by block subsidy redirection proposals and institutional trust inflows.
**Supply tightening proposal (High)**: Co-founder proposal to redirect the 8% block subsidy to reserve mechanisms → reduced circulating inflation expectations
- **Institutional accumulation (High)**: Steady Trust inflows reaching $41M recently paired with +$13.3M spot net inflow peak → rapid push past $1,300 resistance
- **Scalability & ecosystem expansion (Medium)**: Upcoming NU7 upgrade and cross-chain integrations expanded utility demand
#ZEC #BinanceSquare #EarningsSeason #CanGoogleDefindItsCore #Crypto
70
Connectez-vous pour découvrir plus de contenu
Rejoignez la communauté mondiale des adeptes de cryptomonnaies sur Binance Square
⚡️ Suviez les dernières informations importantes sur les cryptomonnaies.
💬 Jugé digne de confiance par la plus grande plateforme d’échange de cryptomonnaies au monde.
👍 Découvrez les connaissances que partagent les créateurs vérifiés.
Adresse e-mail/Nº de téléphone
Sujets d’actualité
CanMicrosoftDeliverOnAI
226,396 vues
1,893 mentions
Saison des résultats, session 3 : Google et Microsoft dépasseront-ils les attentes ?
Binance Square Official
·108 mentions J’aime
·40.3k vues
CanGoogleDefindItsCore
128,901 vues
1,389 mentions
EarningsSeason
5.8M vues
27,867 mentions