
Mukhtiar_Ali_55
11.8k Publications

Mukhtiar_Ali_55
Signaler
Bloquer l’utilisateur
32 Suivis
433 Abonnés
4.4K+ J’aime
Publications
Tous
Citations
LAB CHUTE DE PLUS DE 14 % : LES VENDEURS DOMINENT, LE PRIX SE RAPPROCHE DE SON PLUS BAS SUR 24 H 📉🔥🚨
$LAB | LAB (on-chain)
💰 Prix : $0.029668
📉 Variation sur 24 h : -14.33%
📊 Plus haut sur 24 h : $0.035513
📉 Plus bas sur 24 h : $0.029239
💵 Volume sur 24 h : $106.35M
🏦 Capitalisation boursière : $22.05M
💧 Liquidité on-chain : $776,181.68
👥 Détenteurs : 31,136
⚠️ Analyse du marché (unité de temps : 1 h) :
LAB suit une tendance baissière depuis la zone de 0.036203, et une forte dégringolade s’est imposée au cours des dernières heures 🧨
🔻 Le mouvement est marqué par une succession de sommets et de creux de plus en plus bas
🔻 Une grande bougie rouge près de 0.0319 a brisé la structure et fait chuter brutalement le prix
LAB CHUTE DE PLUS DE 14 % : LES VENDEURS DOMINENT, LE PRIX SE RAPPROCHE DE SON PLUS BAS SUR 24 H 📉🔥
🚨
$LAB | LAB (on-chain)
💰 Prix : $0.029668
📉 Variation sur 24 h : -14.33%
📊 Plus haut sur 24 h : $0.035513
📉 Plus bas sur 24 h : $0.029239
💵 Volume sur 24 h : $106.35M
🏦 Capitalisation boursière : $22.05M
💧 Liquidité on-chain : $776,181.68
👥 Détenteurs : 31,136
⚠️ Analyse du marché (unité de temps : 1 h) :
LAB suit une tendance baissière depuis la zone de 0.036203, et une forte dégringolade s’est imposée au cours des dernières heures 🧨
🔻 Le mouvement est marqué par une succession de sommets et de creux de plus en plus bas
🔻 Une grande bougie rouge près de 0.0319 a brisé la structure et fait chuter brutalement le prix
$LAB | LAB (on-chain)
💰 Prix : $0.029668
📉 Variation sur 24 h : -14.33%
📊 Plus haut sur 24 h : $0.035513
📉 Plus bas sur 24 h : $0.029239
💵 Volume sur 24 h : $106.35M
🏦 Capitalisation boursière : $22.05M
💧 Liquidité on-chain : $776,181.68
👥 Détenteurs : 31,136
⚠️ Analyse du marché (unité de temps : 1 h) :
LAB suit une tendance baissière depuis la zone de 0.036203, et une forte dégringolade s’est imposée au cours des dernières heures 🧨
🔻 Le mouvement est marqué par une succession de sommets et de creux de plus en plus bas
🔻 Une grande bougie rouge près de 0.0319 a brisé la structure et fait chuter brutalement le prix
21
DASH CHUTE DE PLUS DE 10 % : LES VENDEURS PRENNENT L’AVANTAGE, LE COURS SE MAINTENANT JUSTE AU PLUS BAS SUR 24 H 📉🔥🚨
$DASH | DASH/USDT
💰 Prix : 32.41
📉 Variation sur 24 h : -10.12%
📊 Plus haut sur 24 h : 36.71
📉 Plus bas sur 24 h : 32.35
💵 Volume sur 24 h (USDT) : 3.71M
🪙 Volume sur 24 h (DASH) : 108,040.11
⚠️ Analyse du marché (graphique 1 h) :
Le Dash a connu une baisse régulière depuis la zone des 37.47, chaque rebond échouant à créer une dynamique durable 🧨
🔻 Une configuration nette de sommets et de creux de plus en plus bas caractérise la tendance depuis plusieurs heures
🔻 Une brève phase latérale autour de 35 – 35.50 a laissé place à une nouvelle baisse
🔻 Une grande bougie baissière près de 34.30 a accéléré la chute, et la dernière bougie rouge clôture juste au niveau du plus bas sur 24 h, autour de 32.35 🧲
DASH CHUTE DE PLUS DE 10 % : LES VENDEURS PRENNENT L’AVANTAGE, LE COURS SE MAINTENANT JUSTE AU PLUS BAS SUR 24 H 📉🔥
🚨
$DASH | DASH/USDT
💰 Prix : 32.41
📉 Variation sur 24 h : -10.12%
📊 Plus haut sur 24 h : 36.71
📉 Plus bas sur 24 h : 32.35
💵 Volume sur 24 h (USDT) : 3.71M
🪙 Volume sur 24 h (DASH) : 108,040.11
⚠️ Analyse du marché (graphique 1 h) :
Le Dash a connu une baisse régulière depuis la zone des 37.47, chaque rebond échouant à créer une dynamique durable 🧨
🔻 Une configuration nette de sommets et de creux de plus en plus bas caractérise la tendance depuis plusieurs heures
🔻 Une brève phase latérale autour de 35 – 35.50 a laissé place à une nouvelle baisse
🔻 Une grande bougie baissière près de 34.30 a accéléré la chute, et la dernière bougie rouge clôture juste au niveau du plus bas sur 24 h, autour de 32.35 🧲
$DASH | DASH/USDT
💰 Prix : 32.41
📉 Variation sur 24 h : -10.12%
📊 Plus haut sur 24 h : 36.71
📉 Plus bas sur 24 h : 32.35
💵 Volume sur 24 h (USDT) : 3.71M
🪙 Volume sur 24 h (DASH) : 108,040.11
⚠️ Analyse du marché (graphique 1 h) :
Le Dash a connu une baisse régulière depuis la zone des 37.47, chaque rebond échouant à créer une dynamique durable 🧨
🔻 Une configuration nette de sommets et de creux de plus en plus bas caractérise la tendance depuis plusieurs heures
🔻 Une brève phase latérale autour de 35 – 35.50 a laissé place à une nouvelle baisse
🔻 Une grande bougie baissière près de 34.30 a accéléré la chute, et la dernière bougie rouge clôture juste au niveau du plus bas sur 24 h, autour de 32.35 🧲
6
QUANT ($QNT) CHUTE DE PLUS DE 9 % : LES VENDEURS GARDENT LA MAIN, LE PRIX FLIRTANT AVEC SON PLUS BAS SUR 24 H 📉🔥🚨
$QNT | QNT/USDT
💰 Prix : 135.02
📉 Variation sur 24 h : -9.23%
📊 Plus haut sur 24 h : 150.95
📉 Plus bas sur 24 h : 134.14
💵 Volume sur 24 h (USDT) : 7.47M
🪙 Volume sur 24 h (QNT) : 52,985.28
⚠️ Analyse du marché (unité de temps : 1 h) :
Quant recule depuis la zone des 152.65, chaque rebond échouant à créer une dynamique durable 🧨
Une succession régulière de sommets et de creux de plus en plus bas caractérise la tendance depuis plusieurs heures
🔻 Un fort rebond haussier près de 145 a rapidement été vendu et n’a pas réussi à inverser la tendance
🔻 Une lourde bougie baissière près de 140 a fait chuter le prix jusqu’au plus bas de 134.14. La dernière bougie est un petit doji près de 135.02, signe d’hésitation 🧲
QUANT ($QNT) CHUTE DE PLUS DE 9 % : LES VENDEURS GARDENT LA MAIN, LE PRIX FLIRTANT AVEC SON PLUS BAS SUR 24 H 📉🔥
🚨
$QNT | QNT/USDT
💰 Prix : 135.02
📉 Variation sur 24 h : -9.23%
📊 Plus haut sur 24 h : 150.95
📉 Plus bas sur 24 h : 134.14
💵 Volume sur 24 h (USDT) : 7.47M
🪙 Volume sur 24 h (QNT) : 52,985.28
⚠️ Analyse du marché (unité de temps : 1 h) :
Quant recule depuis la zone des 152.65, chaque rebond échouant à créer une dynamique durable 🧨
Une succession régulière de sommets et de creux de plus en plus bas caractérise la tendance depuis plusieurs heures
🔻 Un fort rebond haussier près de 145 a rapidement été vendu et n’a pas réussi à inverser la tendance
🔻 Une lourde bougie baissière près de 140 a fait chuter le prix jusqu’au plus bas de 134.14. La dernière bougie est un petit doji près de 135.02, signe d’hésitation 🧲
$QNT | QNT/USDT
💰 Prix : 135.02
📉 Variation sur 24 h : -9.23%
📊 Plus haut sur 24 h : 150.95
📉 Plus bas sur 24 h : 134.14
💵 Volume sur 24 h (USDT) : 7.47M
🪙 Volume sur 24 h (QNT) : 52,985.28
⚠️ Analyse du marché (unité de temps : 1 h) :
Quant recule depuis la zone des 152.65, chaque rebond échouant à créer une dynamique durable 🧨
Une succession régulière de sommets et de creux de plus en plus bas caractérise la tendance depuis plusieurs heures
🔻 Un fort rebond haussier près de 145 a rapidement été vendu et n’a pas réussi à inverser la tendance
🔻 Une lourde bougie baissière près de 140 a fait chuter le prix jusqu’au plus bas de 134.14. La dernière bougie est un petit doji près de 135.02, signe d’hésitation 🧲
12
OFFICIAL TRUMP ($TRUMP) CHUTE DE PLUS DE 11 % : LES VENDEURS GARDENT LA MAIN, LE PRIX STAGNANT PRÈS DE SON PLUS BAS SUR 24 H 📉🔥🚨
$TRUMP | TRUMP/USDT
💰 Prix : 0.833
📉 Variation sur 24 h : -11.76%
📊 Plus haut sur 24 h : 0.958
📉 Plus bas sur 24 h : 0.814
💵 Volume sur 24 h (USDT) : 9.82M
🪙 Volume sur 24 h (TRUMP) : 11.27M
⚠️ Analyse du marché (période de 1 h) :
TRUMP recule depuis la zone des 0.970, chaque rebond échouant à générer un véritable élan 🧨
🔻 Une succession de sommets et de creux de plus en plus bas caractérise la tendance depuis des heures
🔻 Une grande bougie baissière près de 0.875 a accéléré la chute et fait plonger le prix jusqu'au plus bas de 0.814
🔻 Le prix a légèrement rebondi depuis ce plus bas, mais stagne désormais près de 0.833, un petit doji témoignant d'une hésitation 🧲
OFFICIAL TRUMP ($TRUMP) CHUTE DE PLUS DE 11 % : LES VENDEURS GARDENT LA MAIN, LE PRIX STAGNANT PRÈS DE SON PLUS BAS SUR 24 H 📉🔥
🚨
$TRUMP | TRUMP/USDT
💰 Prix : 0.833
📉 Variation sur 24 h : -11.76%
📊 Plus haut sur 24 h : 0.958
📉 Plus bas sur 24 h : 0.814
💵 Volume sur 24 h (USDT) : 9.82M
🪙 Volume sur 24 h (TRUMP) : 11.27M
⚠️ Analyse du marché (période de 1 h) :
TRUMP recule depuis la zone des 0.970, chaque rebond échouant à générer un véritable élan 🧨
🔻 Une succession de sommets et de creux de plus en plus bas caractérise la tendance depuis des heures
🔻 Une grande bougie baissière près de 0.875 a accéléré la chute et fait plonger le prix jusqu'au plus bas de 0.814
🔻 Le prix a légèrement rebondi depuis ce plus bas, mais stagne désormais près de 0.833, un petit doji témoignant d'une hésitation 🧲
$TRUMP | TRUMP/USDT
💰 Prix : 0.833
📉 Variation sur 24 h : -11.76%
📊 Plus haut sur 24 h : 0.958
📉 Plus bas sur 24 h : 0.814
💵 Volume sur 24 h (USDT) : 9.82M
🪙 Volume sur 24 h (TRUMP) : 11.27M
⚠️ Analyse du marché (période de 1 h) :
TRUMP recule depuis la zone des 0.970, chaque rebond échouant à générer un véritable élan 🧨
🔻 Une succession de sommets et de creux de plus en plus bas caractérise la tendance depuis des heures
🔻 Une grande bougie baissière près de 0.875 a accéléré la chute et fait plonger le prix jusqu'au plus bas de 0.814
🔻 Le prix a légèrement rebondi depuis ce plus bas, mais stagne désormais près de 0.833, un petit doji témoignant d'une hésitation 🧲
21
Voir la traduction
CYBER ($CYBER) SURGES OVER 12%: SHARP PUMP FADES AS PRICE RETESTS KEY SUPPORT 📈🔥🚀
$CYBER | CYBER/USDT
💰 Price: 0.228
📈 24H Change: +12.32%
📊 24H High: 0.312
📉 24H Low: 0.201
💵 24H Volume (USDT): 10.08M
🪙 24H Volume (CYBER): 38.55M
⚠️ Market Breakdown (1H Timeframe):
Cyber spent hours moving quietly near the 0.200 – 0.215 zone, then exploded higher in one massive green candle 🧨
🔺 A single large breakout candle sent price straight up toward the 0.312 high
🔻 Sellers took over at the top, and a run of red candles followed as early buyers locked in profits
🔺 Price has since slowed down near 0.228 and is now hovering right on the MA(25), with a long upper wick showing sellers still defending higher levels 🧲
📈 Moving Averages Tell the Story:
📌 MA(7): 0.232
📌 MA(25): 0.229
📌 MA(99): 0.215
⚠️ Price is trading just below the MA(7) and sitting right on the MA(25)
✅ Price is still holding above the MA(99), so the broader structure remains positive
⚠️ The MA(7) and MA(25) are now almost flat and tightly squeezed, showing the momentum has cooled 🐂
📊 Volume Insight:
🟢 Volume surged massively on the breakout candle, confirming strong participation
💥 This points to aggressive buying, likely driven by momentum traders and short squeezes
🔴 Volume has dropped sharply since the peak, which suggests profit-taking and fading interest rather than panic selling
⚠️ Expect volatility to stay high
🧠 What This Means:
This move didn’t come out of nowhere ✅
A flat base followed by a one-candle, high-volume breakout usually reflects a sudden burst of interest, and the long fade afterward is a normal cooldown after such a sharp spike.
🔹 Short-term trend: Bullish structure, but losing steam
🔹 Momentum: Weak, with price testing support
🔹 Market sentiment: Cautious 😐
🎯 Key Levels to Watch:
🟢 Support: 0.215 – 0.229 zone
🔴 Resistance: 0.232 – 0.268 zone
📌 A reclaim of 0.232 (MA7) would be the first sign of momentum returning
📌 A clean break below 0.215 (MA99) could open the door to a deeper retracement toward 0.200 ⬇️
💡 Final Take:
CYBER is in a high-risk, high-volatility phase where sharp pumps can reverse just as fast. Avoid chasing green candles, wait for confirmation, keep your position size under control, and always protect your capital with a stop-loss. 🧘🛡️
Discipline will always outlast impulse 💎
#Cyber #CYBER #CYBERUSDT #CryptoAnalysis #CryptoTrading
$CYBER
{spot}(CYBERUSDT)
CYBER ($CYBER) SURGES OVER 12%: SHARP PUMP FADES AS PRICE RETESTS KEY SUPPORT 📈🔥
🚀
$CYBER | CYBER/USDT
💰 Price: 0.228
📈 24H Change: +12.32%
📊 24H High: 0.312
📉 24H Low: 0.201
💵 24H Volume (USDT): 10.08M
🪙 24H Volume (CYBER): 38.55M
⚠️ Market Breakdown (1H Timeframe):
Cyber spent hours moving quietly near the 0.200 – 0.215 zone, then exploded higher in one massive green candle 🧨
🔺 A single large breakout candle sent price straight up toward the 0.312 high
🔻 Sellers took over at the top, and a run of red candles followed as early buyers locked in profits
🔺 Price has since slowed down near 0.228 and is now hovering right on the MA(25), with a long upper wick showing sellers still defending higher levels 🧲
📈 Moving Averages Tell the Story:
📌 MA(7): 0.232
📌 MA(25): 0.229
📌 MA(99): 0.215
⚠️ Price is trading just below the MA(7) and sitting right on the MA(25)
✅ Price is still holding above the MA(99), so the broader structure remains positive
⚠️ The MA(7) and MA(25) are now almost flat and tightly squeezed, showing the momentum has cooled 🐂
📊 Volume Insight:
🟢 Volume surged massively on the breakout candle, confirming strong participation
💥 This points to aggressive buying, likely driven by momentum traders and short squeezes
🔴 Volume has dropped sharply since the peak, which suggests profit-taking and fading interest rather than panic selling
⚠️ Expect volatility to stay high
🧠 What This Means:
This move didn’t come out of nowhere ✅
A flat base followed by a one-candle, high-volume breakout usually reflects a sudden burst of interest, and the long fade afterward is a normal cooldown after such a sharp spike.
🔹 Short-term trend: Bullish structure, but losing steam
🔹 Momentum: Weak, with price testing support
🔹 Market sentiment: Cautious 😐
🎯 Key Levels to Watch:
🟢 Support: 0.215 – 0.229 zone
🔴 Resistance: 0.232 – 0.268 zone
📌 A reclaim of 0.232 (MA7) would be the first sign of momentum returning
📌 A clean break below 0.215 (MA99) could open the door to a deeper retracement toward 0.200 ⬇️
💡 Final Take:
CYBER is in a high-risk, high-volatility phase where sharp pumps can reverse just as fast. Avoid chasing green candles, wait for confirmation, keep your position size under control, and always protect your capital with a stop-loss. 🧘🛡️
Discipline will always outlast impulse 💎
#Cyber #CYBER #CYBERUSDT #CryptoAnalysis #CryptoTrading
$CYBER
$CYBER | CYBER/USDT
💰 Price: 0.228
📈 24H Change: +12.32%
📊 24H High: 0.312
📉 24H Low: 0.201
💵 24H Volume (USDT): 10.08M
🪙 24H Volume (CYBER): 38.55M
⚠️ Market Breakdown (1H Timeframe):
Cyber spent hours moving quietly near the 0.200 – 0.215 zone, then exploded higher in one massive green candle 🧨
🔺 A single large breakout candle sent price straight up toward the 0.312 high
🔻 Sellers took over at the top, and a run of red candles followed as early buyers locked in profits
🔺 Price has since slowed down near 0.228 and is now hovering right on the MA(25), with a long upper wick showing sellers still defending higher levels 🧲
📈 Moving Averages Tell the Story:
📌 MA(7): 0.232
📌 MA(25): 0.229
📌 MA(99): 0.215
⚠️ Price is trading just below the MA(7) and sitting right on the MA(25)
✅ Price is still holding above the MA(99), so the broader structure remains positive
⚠️ The MA(7) and MA(25) are now almost flat and tightly squeezed, showing the momentum has cooled 🐂
📊 Volume Insight:
🟢 Volume surged massively on the breakout candle, confirming strong participation
💥 This points to aggressive buying, likely driven by momentum traders and short squeezes
🔴 Volume has dropped sharply since the peak, which suggests profit-taking and fading interest rather than panic selling
⚠️ Expect volatility to stay high
🧠 What This Means:
This move didn’t come out of nowhere ✅
A flat base followed by a one-candle, high-volume breakout usually reflects a sudden burst of interest, and the long fade afterward is a normal cooldown after such a sharp spike.
🔹 Short-term trend: Bullish structure, but losing steam
🔹 Momentum: Weak, with price testing support
🔹 Market sentiment: Cautious 😐
🎯 Key Levels to Watch:
🟢 Support: 0.215 – 0.229 zone
🔴 Resistance: 0.232 – 0.268 zone
📌 A reclaim of 0.232 (MA7) would be the first sign of momentum returning
📌 A clean break below 0.215 (MA99) could open the door to a deeper retracement toward 0.200 ⬇️
💡 Final Take:
CYBER is in a high-risk, high-volatility phase where sharp pumps can reverse just as fast. Avoid chasing green candles, wait for confirmation, keep your position size under control, and always protect your capital with a stop-loss. 🧘🛡️
Discipline will always outlast impulse 💎
#Cyber #CYBER #CYBERUSDT #CryptoAnalysis #CryptoTrading
$CYBER
5
Voir la traduction
KERNELDAO ($KERNEL) SURGES OVER 18%: EXPLOSIVE PUMP FOLLOWED BY A HEALTHY PULLBACK 📈🔥🚀
$KERNEL | KERNEL/USDT
💰 Price: 0.0466
📈 24H Change: +18.58%
📊 24H High: 0.0638
📉 24H Low: 0.0390
💵 24H Volume (USDT): 11.77M
🪙 24H Volume (KERNEL): 226.16M
⚠️ Market Breakdown (1H Timeframe):
KernelDAO spent hours moving quietly near the 0.0385 – 0.0400 zone, then exploded higher in a sudden burst 🧨
🔺 A series of strong green candles pushed price straight up to the 0.0638 high
🔻 Sellers stepped in at the top, and a run of red candles followed as early buyers took profit
🔺 Price has since found footing near 0.0430 and printed a green candle, showing buyers are still active 🧲
📈 Moving Averages Tell the Story:
📌 MA(7): 0.0480
📌 MA(25): 0.0450
📌 MA(99): 0.0403
❌ Price is trading below the MA(7) and acting as short-term resistance
✅ Price is holding above the MA(99), keeping the broader structure positive
⚠️ The MA(25) near 0.0450 is the level to watch, as price is hovering right around it 🐂
📊 Volume Insight:
🟢 Volume surged massively on the breakout candles, confirming strong participation
💥 This points to aggressive buying, likely driven by momentum traders and short squeezes
🔴 Volume has faded noticeably during the pullback, which suggests profit-taking rather than panic selling
⚠️ Expect volatility to stay very high
🧠 What This Means:
This move didn’t come out of nowhere ✅
A flat base followed by a high-volume breakout usually reflects a sudden shift in interest, and the pullback is a normal cooldown after such a sharp run.
🔹 Short-term trend: Bullish, but cooling off
🔹 Momentum: Mixed, with the pullback still being tested
🔹 Market sentiment: Excited but cautious 😮
🎯 Key Levels to Watch:
🟢 Support: 0.0428 – 0.0450 zone
🔴 Resistance: 0.0480 – 0.0539 zone
📌 A reclaim of 0.0480 (MA7) would signal momentum returning
📌 A clean break below 0.0428 could open the door to a deeper retracement toward 0.0403 ⬇️
💡 Final Take:
KERNEL is in a high-risk, high-volatility phase where sharp pumps can reverse just as fast. Avoid chasing green candles, wait for confirmation, keep your position size under control, and always protect your capital with a stop-loss. 🧘🛡️
Discipline will always outlast impulse 💎
#KernelDAO #KERNEL #KERNELUSDT #CryptoAnalysis #CryptoTrading
$KERNEL
{spot}(KERNELUSDT)
KERNELDAO ($KERNEL) SURGES OVER 18%: EXPLOSIVE PUMP FOLLOWED BY A HEALTHY PULLBACK 📈🔥
🚀
$KERNEL | KERNEL/USDT
💰 Price: 0.0466
📈 24H Change: +18.58%
📊 24H High: 0.0638
📉 24H Low: 0.0390
💵 24H Volume (USDT): 11.77M
🪙 24H Volume (KERNEL): 226.16M
⚠️ Market Breakdown (1H Timeframe):
KernelDAO spent hours moving quietly near the 0.0385 – 0.0400 zone, then exploded higher in a sudden burst 🧨
🔺 A series of strong green candles pushed price straight up to the 0.0638 high
🔻 Sellers stepped in at the top, and a run of red candles followed as early buyers took profit
🔺 Price has since found footing near 0.0430 and printed a green candle, showing buyers are still active 🧲
📈 Moving Averages Tell the Story:
📌 MA(7): 0.0480
📌 MA(25): 0.0450
📌 MA(99): 0.0403
❌ Price is trading below the MA(7) and acting as short-term resistance
✅ Price is holding above the MA(99), keeping the broader structure positive
⚠️ The MA(25) near 0.0450 is the level to watch, as price is hovering right around it 🐂
📊 Volume Insight:
🟢 Volume surged massively on the breakout candles, confirming strong participation
💥 This points to aggressive buying, likely driven by momentum traders and short squeezes
🔴 Volume has faded noticeably during the pullback, which suggests profit-taking rather than panic selling
⚠️ Expect volatility to stay very high
🧠 What This Means:
This move didn’t come out of nowhere ✅
A flat base followed by a high-volume breakout usually reflects a sudden shift in interest, and the pullback is a normal cooldown after such a sharp run.
🔹 Short-term trend: Bullish, but cooling off
🔹 Momentum: Mixed, with the pullback still being tested
🔹 Market sentiment: Excited but cautious 😮
🎯 Key Levels to Watch:
🟢 Support: 0.0428 – 0.0450 zone
🔴 Resistance: 0.0480 – 0.0539 zone
📌 A reclaim of 0.0480 (MA7) would signal momentum returning
📌 A clean break below 0.0428 could open the door to a deeper retracement toward 0.0403 ⬇️
💡 Final Take:
KERNEL is in a high-risk, high-volatility phase where sharp pumps can reverse just as fast. Avoid chasing green candles, wait for confirmation, keep your position size under control, and always protect your capital with a stop-loss. 🧘🛡️
Discipline will always outlast impulse 💎
#KernelDAO #KERNEL #KERNELUSDT #CryptoAnalysis #CryptoTrading
$KERNEL
$KERNEL | KERNEL/USDT
💰 Price: 0.0466
📈 24H Change: +18.58%
📊 24H High: 0.0638
📉 24H Low: 0.0390
💵 24H Volume (USDT): 11.77M
🪙 24H Volume (KERNEL): 226.16M
⚠️ Market Breakdown (1H Timeframe):
KernelDAO spent hours moving quietly near the 0.0385 – 0.0400 zone, then exploded higher in a sudden burst 🧨
🔺 A series of strong green candles pushed price straight up to the 0.0638 high
🔻 Sellers stepped in at the top, and a run of red candles followed as early buyers took profit
🔺 Price has since found footing near 0.0430 and printed a green candle, showing buyers are still active 🧲
📈 Moving Averages Tell the Story:
📌 MA(7): 0.0480
📌 MA(25): 0.0450
📌 MA(99): 0.0403
❌ Price is trading below the MA(7) and acting as short-term resistance
✅ Price is holding above the MA(99), keeping the broader structure positive
⚠️ The MA(25) near 0.0450 is the level to watch, as price is hovering right around it 🐂
📊 Volume Insight:
🟢 Volume surged massively on the breakout candles, confirming strong participation
💥 This points to aggressive buying, likely driven by momentum traders and short squeezes
🔴 Volume has faded noticeably during the pullback, which suggests profit-taking rather than panic selling
⚠️ Expect volatility to stay very high
🧠 What This Means:
This move didn’t come out of nowhere ✅
A flat base followed by a high-volume breakout usually reflects a sudden shift in interest, and the pullback is a normal cooldown after such a sharp run.
🔹 Short-term trend: Bullish, but cooling off
🔹 Momentum: Mixed, with the pullback still being tested
🔹 Market sentiment: Excited but cautious 😮
🎯 Key Levels to Watch:
🟢 Support: 0.0428 – 0.0450 zone
🔴 Resistance: 0.0480 – 0.0539 zone
📌 A reclaim of 0.0480 (MA7) would signal momentum returning
📌 A clean break below 0.0428 could open the door to a deeper retracement toward 0.0403 ⬇️
💡 Final Take:
KERNEL is in a high-risk, high-volatility phase where sharp pumps can reverse just as fast. Avoid chasing green candles, wait for confirmation, keep your position size under control, and always protect your capital with a stop-loss. 🧘🛡️
Discipline will always outlast impulse 💎
#KernelDAO #KERNEL #KERNELUSDT #CryptoAnalysis #CryptoTrading
$KERNEL
7
BITTENSOR ($TAO) CHUTE DE PRÈS DE 9 % : LES VENDEURS GARDENT LA MAIN, LE PRIX RESTANT PROCHE DE SON PLUS BAS SUR 24 H 📉🔥🚨
$TAO | TAO/USDT
💰 Prix : 175.1
📉 Variation sur 24 h : -8.90%
📊 Plus haut sur 24 h : 193.3
📉 Plus bas sur 24 h : 173.2
💵 Volume sur 24 h (USDT) : 20.76M
🪙 Volume sur 24 h (TAO) : 113,940.10
⚠️ Analyse du marché (unité de temps : 1 h) :
Bittensor poursuit sa baisse depuis la zone des 197.2, chaque tentative de reprise s’essoufflant 🧨
🔻 Une succession de sommets et de creux de plus en plus bas a marqué le mouvement pendant des heures
🔻 Une brève phase latérale autour de 185 – 188 n’a pas tenu et a cédé la place à une forte chute
🔻 Une grande bougie baissière près de 183 a fait chuter brusquement le prix. Depuis, celui-ci évolue dans une fourchette étroite, juste au-dessus du plus bas sur 24 h à 173.2 🧲
BITTENSOR ($TAO) CHUTE DE PRÈS DE 9 % : LES VENDEURS GARDENT LA MAIN, LE PRIX RESTANT PROCHE DE SON PLUS BAS SUR 24 H 📉🔥
🚨
$TAO | TAO/USDT
💰 Prix : 175.1
📉 Variation sur 24 h : -8.90%
📊 Plus haut sur 24 h : 193.3
📉 Plus bas sur 24 h : 173.2
💵 Volume sur 24 h (USDT) : 20.76M
🪙 Volume sur 24 h (TAO) : 113,940.10
⚠️ Analyse du marché (unité de temps : 1 h) :
Bittensor poursuit sa baisse depuis la zone des 197.2, chaque tentative de reprise s’essoufflant 🧨
🔻 Une succession de sommets et de creux de plus en plus bas a marqué le mouvement pendant des heures
🔻 Une brève phase latérale autour de 185 – 188 n’a pas tenu et a cédé la place à une forte chute
🔻 Une grande bougie baissière près de 183 a fait chuter brusquement le prix. Depuis, celui-ci évolue dans une fourchette étroite, juste au-dessus du plus bas sur 24 h à 173.2 🧲
$TAO | TAO/USDT
💰 Prix : 175.1
📉 Variation sur 24 h : -8.90%
📊 Plus haut sur 24 h : 193.3
📉 Plus bas sur 24 h : 173.2
💵 Volume sur 24 h (USDT) : 20.76M
🪙 Volume sur 24 h (TAO) : 113,940.10
⚠️ Analyse du marché (unité de temps : 1 h) :
Bittensor poursuit sa baisse depuis la zone des 197.2, chaque tentative de reprise s’essoufflant 🧨
🔻 Une succession de sommets et de creux de plus en plus bas a marqué le mouvement pendant des heures
🔻 Une brève phase latérale autour de 185 – 188 n’a pas tenu et a cédé la place à une forte chute
🔻 Une grande bougie baissière près de 183 a fait chuter brusquement le prix. Depuis, celui-ci évolue dans une fourchette étroite, juste au-dessus du plus bas sur 24 h à 173.2 🧲
19
Voir la traduction
SUI DROPS OVER 10%: SELLERS KEEP CONTROL AS PRICE SITS RIGHT AT THE 24H LOW 📉🔥🚨
$SUI | SUI/USDT
💰 Price: 0.6340
📉 24H Change: -10.17%
📊 24H High: 0.7166
📉 24H Low: 0.6321
💵 24H Volume (USDT): 40.13M
🪙 24H Volume (SUI): 59.34M
⚠️ Market Breakdown (1H Timeframe):
Sui has been sliding steadily from the 0.7231 area, with each bounce failing to build any real momentum 🧨
🔻 A clear pattern of lower highs and lower lows has defined the trend for hours
🔻 One large bearish candle near 0.6676 accelerated the drop and pushed price sharply lower
🔻 Price is now sitting just above the 24H low at 0.6321, with small candles showing hesitation but no real buyer strength 🧲
📉 Moving Averages Tell the Story:
📌 MA(7): 0.6461
📌 MA(25): 0.6826
📌 MA(99): 0.7135
❌ Price is trading below all three major MAs
❌ All of them are sloping downward
❌ The MA(7) is falling fast and has capped every recovery attempt 🐻
📊 Volume Insight:
🔴 Volume spiked heavily on the breakdown candle
💥 This points to aggressive selling and likely forced liquidations
🟢 Volume has dried up on the latest candles, so selling pressure is cooling, but no confirmed reversal has appeared yet
⚠️ Expect volatility to stay elevated
🧠 What This Means:
This move wasn’t random ❌
A steady downtrend followed by a high-volume breakdown usually signals trend continuation, with a leverage flush adding pressure.
🔹 Short-term trend: Bearish
🔹 Momentum: Weak, with tiny candles near the lows
🔹 Market sentiment: Cautious to fearful 😨
🎯 Key Levels to Watch:
🟢 Support: 0.6275 – 0.6321 zone
🔴 Resistance: 0.6461 – 0.6826 zone
📌 A reclaim of 0.6461 (MA7) would be the first sign of relief
📌 A clean break below 0.6321 could open the door to deeper downside ⬇️
💡 Final Take:
SUI is in a high-risk, high-volatility phase where patience beats prediction. Wait for confirmation, keep your position size under control, and always protect your capital with a stop-loss. 🧘🛡️
Discipline will always outlast impulse 💎
#Sui #SUI #SUIUSDT #CryptoAnalysis #CryptoTrading
$SUI
{spot}(SUIUSDT)
SUI DROPS OVER 10%: SELLERS KEEP CONTROL AS PRICE SITS RIGHT AT THE 24H LOW 📉🔥
🚨
$SUI | SUI/USDT
💰 Price: 0.6340
📉 24H Change: -10.17%
📊 24H High: 0.7166
📉 24H Low: 0.6321
💵 24H Volume (USDT): 40.13M
🪙 24H Volume (SUI): 59.34M
⚠️ Market Breakdown (1H Timeframe):
Sui has been sliding steadily from the 0.7231 area, with each bounce failing to build any real momentum 🧨
🔻 A clear pattern of lower highs and lower lows has defined the trend for hours
🔻 One large bearish candle near 0.6676 accelerated the drop and pushed price sharply lower
🔻 Price is now sitting just above the 24H low at 0.6321, with small candles showing hesitation but no real buyer strength 🧲
📉 Moving Averages Tell the Story:
📌 MA(7): 0.6461
📌 MA(25): 0.6826
📌 MA(99): 0.7135
❌ Price is trading below all three major MAs
❌ All of them are sloping downward
❌ The MA(7) is falling fast and has capped every recovery attempt 🐻
📊 Volume Insight:
🔴 Volume spiked heavily on the breakdown candle
💥 This points to aggressive selling and likely forced liquidations
🟢 Volume has dried up on the latest candles, so selling pressure is cooling, but no confirmed reversal has appeared yet
⚠️ Expect volatility to stay elevated
🧠 What This Means:
This move wasn’t random ❌
A steady downtrend followed by a high-volume breakdown usually signals trend continuation, with a leverage flush adding pressure.
🔹 Short-term trend: Bearish
🔹 Momentum: Weak, with tiny candles near the lows
🔹 Market sentiment: Cautious to fearful 😨
🎯 Key Levels to Watch:
🟢 Support: 0.6275 – 0.6321 zone
🔴 Resistance: 0.6461 – 0.6826 zone
📌 A reclaim of 0.6461 (MA7) would be the first sign of relief
📌 A clean break below 0.6321 could open the door to deeper downside ⬇️
💡 Final Take:
SUI is in a high-risk, high-volatility phase where patience beats prediction. Wait for confirmation, keep your position size under control, and always protect your capital with a stop-loss. 🧘🛡️
Discipline will always outlast impulse 💎
#Sui #SUI #SUIUSDT #CryptoAnalysis #CryptoTrading
$SUI
$SUI | SUI/USDT
💰 Price: 0.6340
📉 24H Change: -10.17%
📊 24H High: 0.7166
📉 24H Low: 0.6321
💵 24H Volume (USDT): 40.13M
🪙 24H Volume (SUI): 59.34M
⚠️ Market Breakdown (1H Timeframe):
Sui has been sliding steadily from the 0.7231 area, with each bounce failing to build any real momentum 🧨
🔻 A clear pattern of lower highs and lower lows has defined the trend for hours
🔻 One large bearish candle near 0.6676 accelerated the drop and pushed price sharply lower
🔻 Price is now sitting just above the 24H low at 0.6321, with small candles showing hesitation but no real buyer strength 🧲
📉 Moving Averages Tell the Story:
📌 MA(7): 0.6461
📌 MA(25): 0.6826
📌 MA(99): 0.7135
❌ Price is trading below all three major MAs
❌ All of them are sloping downward
❌ The MA(7) is falling fast and has capped every recovery attempt 🐻
📊 Volume Insight:
🔴 Volume spiked heavily on the breakdown candle
💥 This points to aggressive selling and likely forced liquidations
🟢 Volume has dried up on the latest candles, so selling pressure is cooling, but no confirmed reversal has appeared yet
⚠️ Expect volatility to stay elevated
🧠 What This Means:
This move wasn’t random ❌
A steady downtrend followed by a high-volume breakdown usually signals trend continuation, with a leverage flush adding pressure.
🔹 Short-term trend: Bearish
🔹 Momentum: Weak, with tiny candles near the lows
🔹 Market sentiment: Cautious to fearful 😨
🎯 Key Levels to Watch:
🟢 Support: 0.6275 – 0.6321 zone
🔴 Resistance: 0.6461 – 0.6826 zone
📌 A reclaim of 0.6461 (MA7) would be the first sign of relief
📌 A clean break below 0.6321 could open the door to deeper downside ⬇️
💡 Final Take:
SUI is in a high-risk, high-volatility phase where patience beats prediction. Wait for confirmation, keep your position size under control, and always protect your capital with a stop-loss. 🧘🛡️
Discipline will always outlast impulse 💎
#Sui #SUI #SUIUSDT #CryptoAnalysis #CryptoTrading
$SUI
16
HYPERLIQUID ($HYPE) CHUTE DE PLUS DE 10 % : LES VENDEURS GARDENT LA MAIN, LE PRIX FLIRTANT AVEC SON PLUS BAS SUR 24 H 📉🔥🚨
$HYPE | HYPE/USDT
💰 Prix : 60,43
📉 Variation sur 24 h : -10,14 %
📊 Plus haut sur 24 h : 67,57
📉 Plus bas sur 24 h : 59,80
💵 Volume sur 24 h (USDT) : 55,71 M
🪙 Volume sur 24 h (HYPE) : 878 236,79
⚠️ Analyse du marché (graphique en 1 h) :
Hyperliquid recule régulièrement depuis la zone des 70,30, chaque rebond s’essoufflant 🧨
🔻 Une succession de sommets et de creux descendants caractérise la tendance depuis plusieurs heures
🔻 Une brève phase latérale autour de 65–66 n’a pas tenu et a laissé place à une nouvelle baisse
🔻 Une forte bougie baissière près de 62 a rapproché le prix du plus bas sur 24 h. La dernière bougie, un petit doji près de 60,43, laisse entrevoir une hésitation 🧲
HYPERLIQUID ($HYPE) CHUTE DE PLUS DE 10 % : LES VENDEURS GARDENT LA MAIN, LE PRIX FLIRTANT AVEC SON PLUS BAS SUR 24 H 📉🔥
🚨
$HYPE | HYPE/USDT
💰 Prix : 60,43
📉 Variation sur 24 h : -10,14 %
📊 Plus haut sur 24 h : 67,57
📉 Plus bas sur 24 h : 59,80
💵 Volume sur 24 h (USDT) : 55,71 M
🪙 Volume sur 24 h (HYPE) : 878 236,79
⚠️ Analyse du marché (graphique en 1 h) :
Hyperliquid recule régulièrement depuis la zone des 70,30, chaque rebond s’essoufflant 🧨
🔻 Une succession de sommets et de creux descendants caractérise la tendance depuis plusieurs heures
🔻 Une brève phase latérale autour de 65–66 n’a pas tenu et a laissé place à une nouvelle baisse
🔻 Une forte bougie baissière près de 62 a rapproché le prix du plus bas sur 24 h. La dernière bougie, un petit doji près de 60,43, laisse entrevoir une hésitation 🧲
$HYPE | HYPE/USDT
💰 Prix : 60,43
📉 Variation sur 24 h : -10,14 %
📊 Plus haut sur 24 h : 67,57
📉 Plus bas sur 24 h : 59,80
💵 Volume sur 24 h (USDT) : 55,71 M
🪙 Volume sur 24 h (HYPE) : 878 236,79
⚠️ Analyse du marché (graphique en 1 h) :
Hyperliquid recule régulièrement depuis la zone des 70,30, chaque rebond s’essoufflant 🧨
🔻 Une succession de sommets et de creux descendants caractérise la tendance depuis plusieurs heures
🔻 Une brève phase latérale autour de 65–66 n’a pas tenu et a laissé place à une nouvelle baisse
🔻 Une forte bougie baissière près de 62 a rapproché le prix du plus bas sur 24 h. La dernière bougie, un petit doji près de 60,43, laisse entrevoir une hésitation 🧲
13
L’OR (XAUT) CHUTE VERS 3,500 : LES VENDEURS MAINTIENNENT LA PRESSION APRÈS L’ÉCHEC DU REBOND 📉🔥🚨 $XAUT | XAUT/USDT
💰 Cours : 3,513.26
📉 Variation sur 24 h : -3.90%
📊 Plus haut sur 24 h : 3,657.46
📉 Plus bas sur 24 h : 3,498.98
💵 Volume sur 24 h (USDT) : 79.47M
🪙 Volume sur 24 h (XAUT) : 22,336.11
⚠️ Analyse du marché (intervalle de 1 h) :
Le Tether Gold a chuté depuis la zone des 3,681, trouvé un plancher, puis rebondi vers 3,570 avant que les vendeurs ne reviennent à la charge 🧨
🔻 La baisse initiale a été brutale, une série de fortes bougies rouges poussant le cours vers 3,500
🔻 Le rebond a buté sous la MA(25) et n’est pas parvenu à former de nouveaux sommets
🔻 Le cours est reparti à la baisse et oscille maintenant juste au-dessus du plus bas sur 24 h, près de 3,498.98, avec une petite mèche qui montre que les acheteurs défendent cette zone 🧲
L’OR (XAUT) CHUTE VERS 3,500 : LES VENDEURS MAINTIENNENT LA PRESSION APRÈS L’ÉCHEC DU REBOND 📉🔥
🚨 $XAUT | XAUT/USDT
💰 Cours : 3,513.26
📉 Variation sur 24 h : -3.90%
📊 Plus haut sur 24 h : 3,657.46
📉 Plus bas sur 24 h : 3,498.98
💵 Volume sur 24 h (USDT) : 79.47M
🪙 Volume sur 24 h (XAUT) : 22,336.11
⚠️ Analyse du marché (intervalle de 1 h) :
Le Tether Gold a chuté depuis la zone des 3,681, trouvé un plancher, puis rebondi vers 3,570 avant que les vendeurs ne reviennent à la charge 🧨
🔻 La baisse initiale a été brutale, une série de fortes bougies rouges poussant le cours vers 3,500
🔻 Le rebond a buté sous la MA(25) et n’est pas parvenu à former de nouveaux sommets
🔻 Le cours est reparti à la baisse et oscille maintenant juste au-dessus du plus bas sur 24 h, près de 3,498.98, avec une petite mèche qui montre que les acheteurs défendent cette zone 🧲
💰 Cours : 3,513.26
📉 Variation sur 24 h : -3.90%
📊 Plus haut sur 24 h : 3,657.46
📉 Plus bas sur 24 h : 3,498.98
💵 Volume sur 24 h (USDT) : 79.47M
🪙 Volume sur 24 h (XAUT) : 22,336.11
⚠️ Analyse du marché (intervalle de 1 h) :
Le Tether Gold a chuté depuis la zone des 3,681, trouvé un plancher, puis rebondi vers 3,570 avant que les vendeurs ne reviennent à la charge 🧨
🔻 La baisse initiale a été brutale, une série de fortes bougies rouges poussant le cours vers 3,500
🔻 Le rebond a buté sous la MA(25) et n’est pas parvenu à former de nouveaux sommets
🔻 Le cours est reparti à la baisse et oscille maintenant juste au-dessus du plus bas sur 24 h, près de 3,498.98, avec une petite mèche qui montre que les acheteurs défendent cette zone 🧲
9
Voir la traduction
NVIDIA (NVDAB) SINKS OVER 14%: HEAVY SELLING PUSHES PRICE TO THE 24H LOW 📉🔥🚨
💰 Price: 125.12
📉 24H Change: -14.37%
📊 24H High: 147.20
📉 24H Low: 124.91
💵 24H Volume (USDT): 109.80M
🪙 24H Volume (NVDAB): 807,886.26
📈 NVDA Stock Price: $125.18 (-14.25%)
⚠️ Market Breakdown (1H Timeframe):
NVDAB has been trending lower since the 153.94 area, and the pace of selling picked up sharply near the end 🧨
🔻 A steady series of lower highs and lower lows has defined the move for hours
🔻 A brief consolidation around 140 – 143 failed to hold and gave way to a heavy drop
🔻 Two large bearish candles in a row pushed price straight to the 24H low near 124.91 with almost no bounce 🧲
📉 Moving Averages Tell the Story:
📌 MA(7): 134.65
📌 MA(25): 141.46
📌 MA(99): 151.89
❌ Price is trading below all three major MAs
❌ All of them are sloping downward
❌ The gap between price and the MA(7) is wide, showing how stretched this move is 🐻
📊 Volume Insight:
🔴 Volume surged dramatically on the latest candle, far above the recent average
💥 This points to aggressive selling and possible capitulation-style panic
⚠️ Spikes like this can lead to a sharp bounce or further continuation, so volatility will likely stay high
🧠 What This Means:
This move wasn’t random ❌
A failed consolidation followed by a high-volume drop shows sellers firmly in control, and the tokenized price is tracking the NVDA stock move closely.
🔹 Short-term trend: Bearish
🔹 Momentum: Weak, no confirmed reversal yet
🔹 Market sentiment: Fear-driven 😨
🎯 Key Levels to Watch:
🟢 Support: 123 – 125 zone
🔴 Resistance: 130 – 134.65 zone
📌 A reclaim of 134.65 (MA7) would be the first sign of relief
📌 A clean break below 124.91 could open the door to deeper downside ⬇️
💡 Final Take:
NVDAB is in a high-risk, high-volatility phase where patience beats prediction. Wait for confirmation, keep your position size under control, and always protect your capital with a stop-loss. 🧘🛡️
Discipline will always outlast impulse 💎
$NVDAB
{spot}(NVDABUSDT)
NVIDIA (NVDAB) SINKS OVER 14%: HEAVY SELLING PUSHES PRICE TO THE 24H LOW 📉🔥
🚨
💰 Price: 125.12
📉 24H Change: -14.37%
📊 24H High: 147.20
📉 24H Low: 124.91
💵 24H Volume (USDT): 109.80M
🪙 24H Volume (NVDAB): 807,886.26
📈 NVDA Stock Price: $125.18 (-14.25%)
⚠️ Market Breakdown (1H Timeframe):
NVDAB has been trending lower since the 153.94 area, and the pace of selling picked up sharply near the end 🧨
🔻 A steady series of lower highs and lower lows has defined the move for hours
🔻 A brief consolidation around 140 – 143 failed to hold and gave way to a heavy drop
🔻 Two large bearish candles in a row pushed price straight to the 24H low near 124.91 with almost no bounce 🧲
📉 Moving Averages Tell the Story:
📌 MA(7): 134.65
📌 MA(25): 141.46
📌 MA(99): 151.89
❌ Price is trading below all three major MAs
❌ All of them are sloping downward
❌ The gap between price and the MA(7) is wide, showing how stretched this move is 🐻
📊 Volume Insight:
🔴 Volume surged dramatically on the latest candle, far above the recent average
💥 This points to aggressive selling and possible capitulation-style panic
⚠️ Spikes like this can lead to a sharp bounce or further continuation, so volatility will likely stay high
🧠 What This Means:
This move wasn’t random ❌
A failed consolidation followed by a high-volume drop shows sellers firmly in control, and the tokenized price is tracking the NVDA stock move closely.
🔹 Short-term trend: Bearish
🔹 Momentum: Weak, no confirmed reversal yet
🔹 Market sentiment: Fear-driven 😨
🎯 Key Levels to Watch:
🟢 Support: 123 – 125 zone
🔴 Resistance: 130 – 134.65 zone
📌 A reclaim of 134.65 (MA7) would be the first sign of relief
📌 A clean break below 124.91 could open the door to deeper downside ⬇️
💡 Final Take:
NVDAB is in a high-risk, high-volatility phase where patience beats prediction. Wait for confirmation, keep your position size under control, and always protect your capital with a stop-loss. 🧘🛡️
Discipline will always outlast impulse 💎
$NVDAB
💰 Price: 125.12
📉 24H Change: -14.37%
📊 24H High: 147.20
📉 24H Low: 124.91
💵 24H Volume (USDT): 109.80M
🪙 24H Volume (NVDAB): 807,886.26
📈 NVDA Stock Price: $125.18 (-14.25%)
⚠️ Market Breakdown (1H Timeframe):
NVDAB has been trending lower since the 153.94 area, and the pace of selling picked up sharply near the end 🧨
🔻 A steady series of lower highs and lower lows has defined the move for hours
🔻 A brief consolidation around 140 – 143 failed to hold and gave way to a heavy drop
🔻 Two large bearish candles in a row pushed price straight to the 24H low near 124.91 with almost no bounce 🧲
📉 Moving Averages Tell the Story:
📌 MA(7): 134.65
📌 MA(25): 141.46
📌 MA(99): 151.89
❌ Price is trading below all three major MAs
❌ All of them are sloping downward
❌ The gap between price and the MA(7) is wide, showing how stretched this move is 🐻
📊 Volume Insight:
🔴 Volume surged dramatically on the latest candle, far above the recent average
💥 This points to aggressive selling and possible capitulation-style panic
⚠️ Spikes like this can lead to a sharp bounce or further continuation, so volatility will likely stay high
🧠 What This Means:
This move wasn’t random ❌
A failed consolidation followed by a high-volume drop shows sellers firmly in control, and the tokenized price is tracking the NVDA stock move closely.
🔹 Short-term trend: Bearish
🔹 Momentum: Weak, no confirmed reversal yet
🔹 Market sentiment: Fear-driven 😨
🎯 Key Levels to Watch:
🟢 Support: 123 – 125 zone
🔴 Resistance: 130 – 134.65 zone
📌 A reclaim of 134.65 (MA7) would be the first sign of relief
📌 A clean break below 124.91 could open the door to deeper downside ⬇️
💡 Final Take:
NVDAB is in a high-risk, high-volatility phase where patience beats prediction. Wait for confirmation, keep your position size under control, and always protect your capital with a stop-loss. 🧘🛡️
Discipline will always outlast impulse 💎
$NVDAB
1
22
Voir la traduction
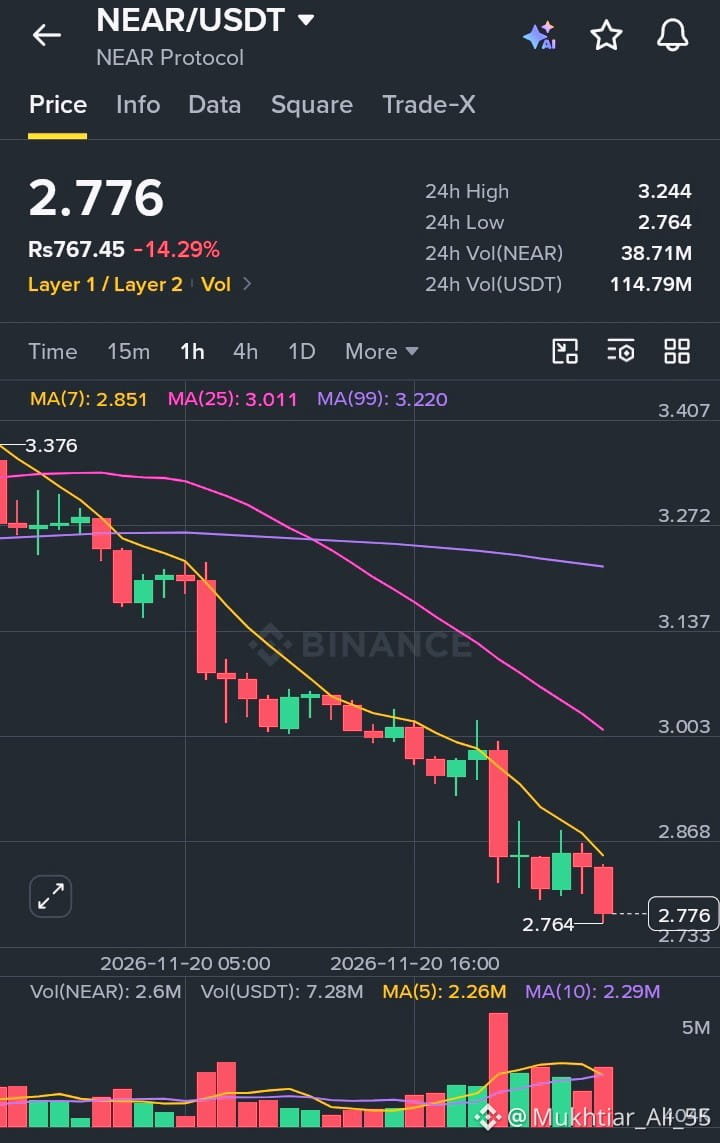
🚨 NEAR PROTOCOL ($NEAR) DROPS OVER 14%: SELLERS KEEP CONTROL AS PRICE TESTS THE 24H LOW 📉🔥
$NEAR | NEAR/USDT
💰 Price: 2.776
📉 24H Change: -14.29%
📊 24H High: 3.244
📉 24H Low: 2.764
💵 24H Volume (USDT): 114.79M
🪙 24H Volume (NEAR): 38.71M
⚠️ Market Breakdown (1H Timeframe):
NEAR has been sliding steadily from the 3.376 area, with every bounce failing to hold 🧨
🔻 A clear sequence of lower highs and lower lows has defined the trend for hours
🔻 A heavy bearish candle near 3.00 accelerated the drop and pushed price toward fresh lows
🔻 Price is now sitting right at the 24H low, with the latest candle closing near 2.764 🧲
📉 Moving Averages Tell the Story:
📌 MA(7): 2.851
📌 MA(25): 3.011
📌 MA(99): 3.220
❌ Price is trading below all three major MAs
❌ All of them are sloping downward
❌ The MA(7) has capped every recovery attempt 🐻
📊 Volume Insight:
🔴 Volume spiked sharply on the breakdown candle
💥 This points to aggressive selling and likely forced liquidations
🔴 Volume remains healthy on the latest red candles, so selling pressure hasn’t faded yet
⚠️ Expect volatility to stay high
🧠 What This Means:
This move wasn’t random ❌
A persistent downtrend with a high-volume breakdown usually signals trend continuation, with a leverage flush adding pressure.
🔹 Short-term trend: Bearish
🔹 Momentum: Weak, no confirmed reversal yet
🔹 Market sentiment: Fear-driven 😨
🎯 Key Levels to Watch:
🟢 Support: 2.733 – 2.764 zone
🔴 Resistance: 2.851 – 3.011 zone
📌 A reclaim of 2.851 (MA7) would be the first sign of relief
📌 A clean break below 2.764 could open the door to deeper downside ⬇️
💡 Final Take:
NEAR is in a high-risk, high-volatility phase where patience beats prediction. Wait for confirmation, keep your position size under control, and always protect your capital with a stop-loss. 🧘🛡️
Discipline will always outlast impulse 💎
#NEAR #NEARUSDT #CryptoAnalysis #CryptoTrading #NEARProtocol
$NEAR
{spot}(NEARUSDT)
🚨 NEAR PROTOCOL ($NEAR ) DROPS OVER 14%: SELLERS KEEP CONTROL AS PRICE TESTS THE 24H LOW 📉🔥
$NEAR | NEAR/USDT
💰 Price: 2.776
📉 24H Change: -14.29%
📊 24H High: 3.244
📉 24H Low: 2.764
💵 24H Volume (USDT): 114.79M
🪙 24H Volume (NEAR): 38.71M
⚠️ Market Breakdown (1H Timeframe):
NEAR has been sliding steadily from the 3.376 area, with every bounce failing to hold 🧨
🔻 A clear sequence of lower highs and lower lows has defined the trend for hours
🔻 A heavy bearish candle near 3.00 accelerated the drop and pushed price toward fresh lows
🔻 Price is now sitting right at the 24H low, with the latest candle closing near 2.764 🧲
📉 Moving Averages Tell the Story:
📌 MA(7): 2.851
📌 MA(25): 3.011
📌 MA(99): 3.220
❌ Price is trading below all three major MAs
❌ All of them are sloping downward
❌ The MA(7) has capped every recovery attempt 🐻
📊 Volume Insight:
🔴 Volume spiked sharply on the breakdown candle
💥 This points to aggressive selling and likely forced liquidations
🔴 Volume remains healthy on the latest red candles, so selling pressure hasn’t faded yet
⚠️ Expect volatility to stay high
🧠 What This Means:
This move wasn’t random ❌
A persistent downtrend with a high-volume breakdown usually signals trend continuation, with a leverage flush adding pressure.
🔹 Short-term trend: Bearish
🔹 Momentum: Weak, no confirmed reversal yet
🔹 Market sentiment: Fear-driven 😨
🎯 Key Levels to Watch:
🟢 Support: 2.733 – 2.764 zone
🔴 Resistance: 2.851 – 3.011 zone
📌 A reclaim of 2.851 (MA7) would be the first sign of relief
📌 A clean break below 2.764 could open the door to deeper downside ⬇️
💡 Final Take:
NEAR is in a high-risk, high-volatility phase where patience beats prediction. Wait for confirmation, keep your position size under control, and always protect your capital with a stop-loss. 🧘🛡️
Discipline will always outlast impulse 💎
#NEAR #NEARUSDT #CryptoAnalysis #CryptoTrading #NEARProtocol
$NEAR
$NEAR | NEAR/USDT
💰 Price: 2.776
📉 24H Change: -14.29%
📊 24H High: 3.244
📉 24H Low: 2.764
💵 24H Volume (USDT): 114.79M
🪙 24H Volume (NEAR): 38.71M
⚠️ Market Breakdown (1H Timeframe):
NEAR has been sliding steadily from the 3.376 area, with every bounce failing to hold 🧨
🔻 A clear sequence of lower highs and lower lows has defined the trend for hours
🔻 A heavy bearish candle near 3.00 accelerated the drop and pushed price toward fresh lows
🔻 Price is now sitting right at the 24H low, with the latest candle closing near 2.764 🧲
📉 Moving Averages Tell the Story:
📌 MA(7): 2.851
📌 MA(25): 3.011
📌 MA(99): 3.220
❌ Price is trading below all three major MAs
❌ All of them are sloping downward
❌ The MA(7) has capped every recovery attempt 🐻
📊 Volume Insight:
🔴 Volume spiked sharply on the breakdown candle
💥 This points to aggressive selling and likely forced liquidations
🔴 Volume remains healthy on the latest red candles, so selling pressure hasn’t faded yet
⚠️ Expect volatility to stay high
🧠 What This Means:
This move wasn’t random ❌
A persistent downtrend with a high-volume breakdown usually signals trend continuation, with a leverage flush adding pressure.
🔹 Short-term trend: Bearish
🔹 Momentum: Weak, no confirmed reversal yet
🔹 Market sentiment: Fear-driven 😨
🎯 Key Levels to Watch:
🟢 Support: 2.733 – 2.764 zone
🔴 Resistance: 2.851 – 3.011 zone
📌 A reclaim of 2.851 (MA7) would be the first sign of relief
📌 A clean break below 2.764 could open the door to deeper downside ⬇️
💡 Final Take:
NEAR is in a high-risk, high-volatility phase where patience beats prediction. Wait for confirmation, keep your position size under control, and always protect your capital with a stop-loss. 🧘🛡️
Discipline will always outlast impulse 💎
#NEAR #NEARUSDT #CryptoAnalysis #CryptoTrading #NEARProtocol
$NEAR
8
Voir la traduction
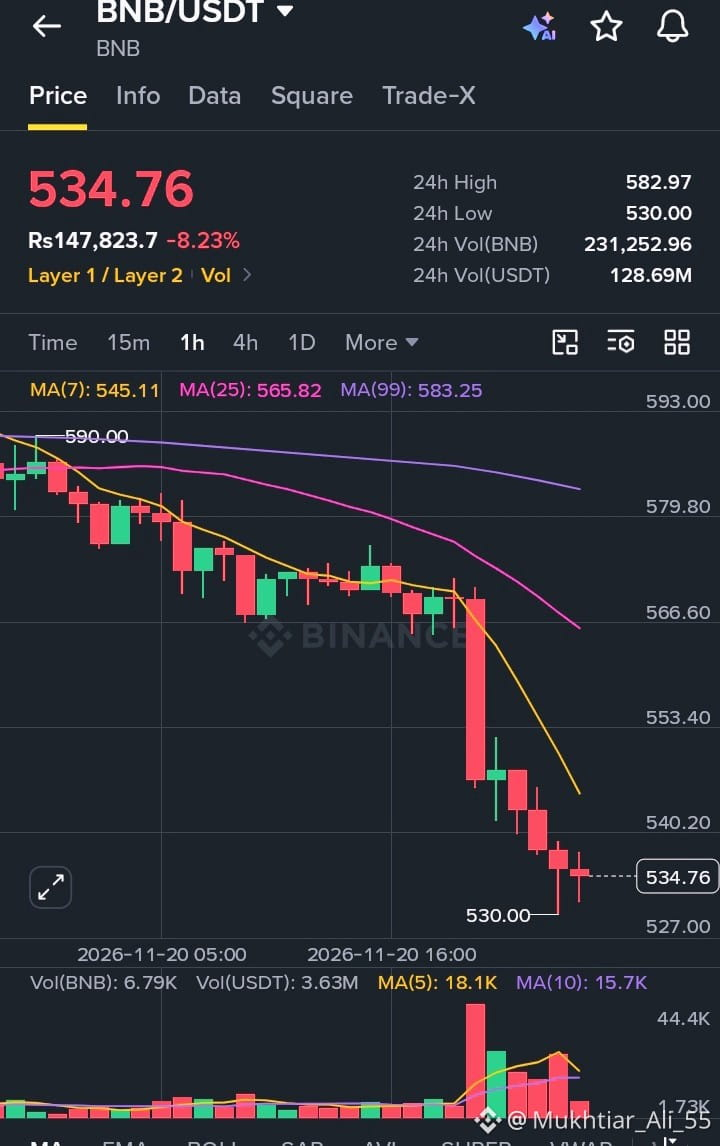
🚨 BNB SLIPS BELOW KEY LEVELS: SELLERS DRIVE PRICE NEAR THE 24H LOW AFTER A SHARP BREAKDOWN 📉🔥
$BNB | BNB/USDT
💰 Price: 534.76
📉 24H Change: -8.23%
📊 24H High: 582.97
📉 24H Low: 530.00
💵 24H Volume (USDT): 128.69M
🪙 24H Volume (BNB): 231,252.96
⚠️ Market Breakdown (1H Timeframe):
BNB drifted lower from the 590 area, then spent hours stuck in a weak range around 560 – 570 before breaking down 🧨
🔻 The 590 rejection set the tone, with lower highs forming the whole way down
🔻 One large bearish candle near 566 broke the range and sent price sharply lower
🔻 Price is now hovering just above the 24H low, with a small wick near 530 showing buyers testing the waters 🧲
📉 Moving Averages Tell the Story:
📌 MA(7): 545.11
📌 MA(25): 565.82
📌 MA(99): 583.25
❌ Price is trading below all three major MAs
❌ All of them are sloping downward
❌ The steep fall in the MA(7) reflects strong downside momentum 🐻
📊 Volume Insight:
🔴 Volume spiked heavily on the breakdown candle
💥 This points to aggressive selling and likely forced liquidations
🟢 Volume has cooled on the latest candles, so selling pressure is easing, but no real reversal has shown up yet
⚠️ Expect volatility to stay elevated
🧠 What This Means:
This move wasn’t random ❌
A weak range breaking down on heavy volume usually signals a leverage flush, with trend continuation risk still in play.
🔹 Short-term trend: Bearish
🔹 Momentum: Weak, no confirmed bounce yet
🔹 Market sentiment: Fearful 😨
🎯 Key Levels to Watch:
🟢 Support: 527 – 534 zone
🔴 Resistance: 545 – 566 zone
📌 A reclaim of 545 (MA7) would be the first sign of relief
📌 A clean break below 530 could open the door to deeper downside ⬇️
💡 Final Take:
BNB is in a high-volatility phase where patience beats prediction. Wait for confirmation, keep your position size under control, and always protect your capital with a stop-loss. 🧘🛡️
Discipline will always outlast impulse 💎
#BNB #BNBUSDT #CryptoAnalysis
$BNB
{spot}(BNBUSDT)
🚨 BNB SLIPS BELOW KEY LEVELS: SELLERS DRIVE PRICE NEAR THE 24H LOW AFTER A SHARP BREAKDOWN 📉🔥
$BNB | BNB/USDT
💰 Price: 534.76
📉 24H Change: -8.23%
📊 24H High: 582.97
📉 24H Low: 530.00
💵 24H Volume (USDT): 128.69M
🪙 24H Volume (BNB): 231,252.96
⚠️ Market Breakdown (1H Timeframe):
BNB drifted lower from the 590 area, then spent hours stuck in a weak range around 560 – 570 before breaking down 🧨
🔻 The 590 rejection set the tone, with lower highs forming the whole way down
🔻 One large bearish candle near 566 broke the range and sent price sharply lower
🔻 Price is now hovering just above the 24H low, with a small wick near 530 showing buyers testing the waters 🧲
📉 Moving Averages Tell the Story:
📌 MA(7): 545.11
📌 MA(25): 565.82
📌 MA(99): 583.25
❌ Price is trading below all three major MAs
❌ All of them are sloping downward
❌ The steep fall in the MA(7) reflects strong downside momentum 🐻
📊 Volume Insight:
🔴 Volume spiked heavily on the breakdown candle
💥 This points to aggressive selling and likely forced liquidations
🟢 Volume has cooled on the latest candles, so selling pressure is easing, but no real reversal has shown up yet
⚠️ Expect volatility to stay elevated
🧠 What This Means:
This move wasn’t random ❌
A weak range breaking down on heavy volume usually signals a leverage flush, with trend continuation risk still in play.
🔹 Short-term trend: Bearish
🔹 Momentum: Weak, no confirmed bounce yet
🔹 Market sentiment: Fearful 😨
🎯 Key Levels to Watch:
🟢 Support: 527 – 534 zone
🔴 Resistance: 545 – 566 zone
📌 A reclaim of 545 (MA7) would be the first sign of relief
📌 A clean break below 530 could open the door to deeper downside ⬇️
💡 Final Take:
BNB is in a high-volatility phase where patience beats prediction. Wait for confirmation, keep your position size under control, and always protect your capital with a stop-loss. 🧘🛡️
Discipline will always outlast impulse 💎
#BNB #BNBUSDT #CryptoAnalysis
$BNB
$BNB | BNB/USDT
💰 Price: 534.76
📉 24H Change: -8.23%
📊 24H High: 582.97
📉 24H Low: 530.00
💵 24H Volume (USDT): 128.69M
🪙 24H Volume (BNB): 231,252.96
⚠️ Market Breakdown (1H Timeframe):
BNB drifted lower from the 590 area, then spent hours stuck in a weak range around 560 – 570 before breaking down 🧨
🔻 The 590 rejection set the tone, with lower highs forming the whole way down
🔻 One large bearish candle near 566 broke the range and sent price sharply lower
🔻 Price is now hovering just above the 24H low, with a small wick near 530 showing buyers testing the waters 🧲
📉 Moving Averages Tell the Story:
📌 MA(7): 545.11
📌 MA(25): 565.82
📌 MA(99): 583.25
❌ Price is trading below all three major MAs
❌ All of them are sloping downward
❌ The steep fall in the MA(7) reflects strong downside momentum 🐻
📊 Volume Insight:
🔴 Volume spiked heavily on the breakdown candle
💥 This points to aggressive selling and likely forced liquidations
🟢 Volume has cooled on the latest candles, so selling pressure is easing, but no real reversal has shown up yet
⚠️ Expect volatility to stay elevated
🧠 What This Means:
This move wasn’t random ❌
A weak range breaking down on heavy volume usually signals a leverage flush, with trend continuation risk still in play.
🔹 Short-term trend: Bearish
🔹 Momentum: Weak, no confirmed bounce yet
🔹 Market sentiment: Fearful 😨
🎯 Key Levels to Watch:
🟢 Support: 527 – 534 zone
🔴 Resistance: 545 – 566 zone
📌 A reclaim of 545 (MA7) would be the first sign of relief
📌 A clean break below 530 could open the door to deeper downside ⬇️
💡 Final Take:
BNB is in a high-volatility phase where patience beats prediction. Wait for confirmation, keep your position size under control, and always protect your capital with a stop-loss. 🧘🛡️
Discipline will always outlast impulse 💎
#BNB #BNBUSDT #CryptoAnalysis
$BNB
4
Voir la traduction
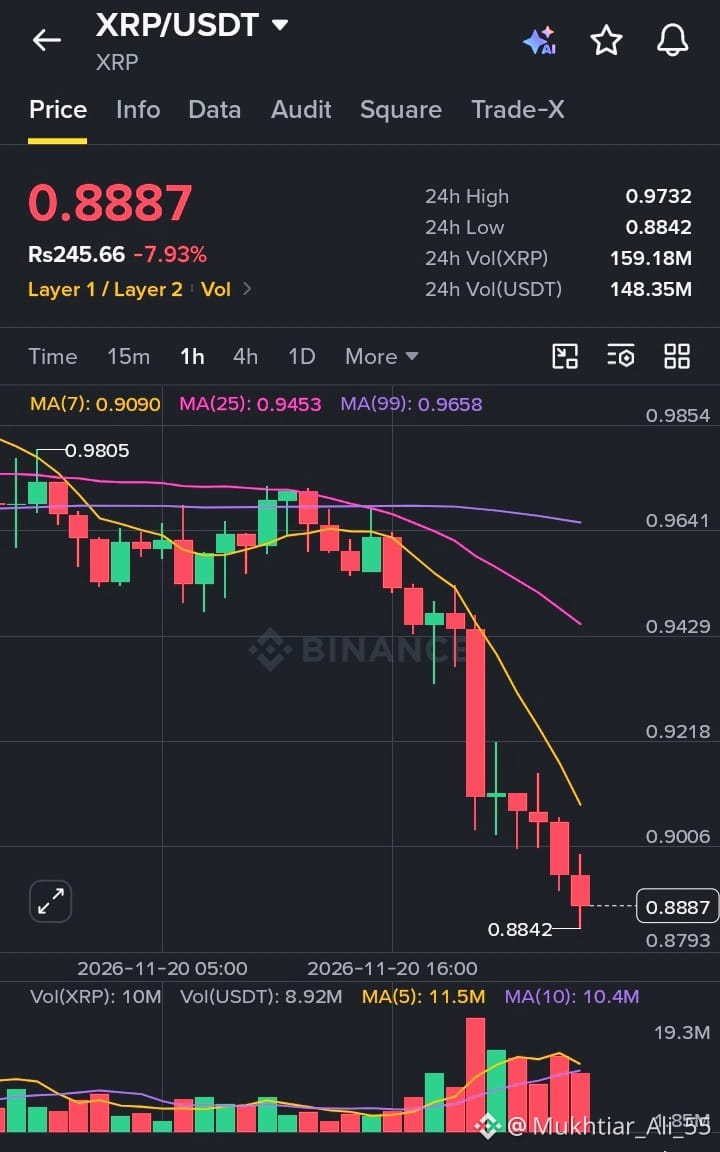
🚨 XRP BREAKS LOWER: BEARS PUSH PRICE TOWARD THE 24H LOW AFTER A SHARP DROP 📉🔥
$XRP | XRP/USDT
💰 Price: 0.8887
📉 24H Change: -7.93%
📊 24H High: 0.9732
📉 24H Low: 0.8842
💵 24H Volume (USDT): 148.35M
🪙 24H Volume (XRP): 159.18M
⚠️ Market Breakdown (1H Timeframe):
XRP spent hours moving sideways around the 0.95 – 0.97 zone, then lost that range and slipped fast 🧨
🔻 The rejection came from the 0.9805 area, and lower highs have followed since
🔻 One large bearish candle near 0.93 broke the structure and sent price sharply lower
🔻 A string of red candles followed, with price now sitting right at the 24H low near 0.8842 🧲
📉 Moving Averages Tell the Story:
📌 MA(7): 0.9090
📌 MA(25): 0.9453
📌 MA(99): 0.9658
❌ Price is trading below all three major MAs
❌ All of them are sloping downward
❌ The MA(7) is falling steeply, showing strong downside momentum 🐻
📊 Volume Insight:
🔴 Volume spiked heavily on the breakdown candle
💥 This points to aggressive selling and likely forced liquidations
🔴 Volume has stayed elevated on the red candles that followed, so selling pressure hasn’t eased yet
⚠️ Expect volatility to stay high
🧠 What This Means:
This move wasn’t random ❌
A sideways range breaking down on heavy volume usually signals a leverage flush, with trend continuation risk on top.
🔹 Short-term trend: Bearish
🔹 Momentum: Weak, no confirmed bounce yet
🔹 Market sentiment: Fearful 😨
🎯 Key Levels to Watch:
🟢 Support: 0.8800 – 0.8850 zone
🔴 Resistance: 0.9090 – 0.9450 zone
📌 A reclaim of 0.9090 (MA7) would be the first sign of relief
📌 A clean break below 0.8842 could open the door to deeper downside ⬇️
💡 Final Take:
XRP is in a high-volatility phase where patience beats prediction. Wait for confirmation, keep your position size under control, and always protect your capital with a stop-loss. 🧘🛡️
Discipline will always outlast impulse 💎
#XRP #XRPUSDT #CryptoAnalysis #CryptoTrading #XRPNews
$XRP
{spot}(XRPUSDT)
🚨 XRP BREAKS LOWER: BEARS PUSH PRICE TOWARD THE 24H LOW AFTER A SHARP DROP 📉🔥
$XRP | XRP/USDT
💰 Price: 0.8887
📉 24H Change: -7.93%
📊 24H High: 0.9732
📉 24H Low: 0.8842
💵 24H Volume (USDT): 148.35M
🪙 24H Volume (XRP): 159.18M
⚠️ Market Breakdown (1H Timeframe):
XRP spent hours moving sideways around the 0.95 – 0.97 zone, then lost that range and slipped fast 🧨
🔻 The rejection came from the 0.9805 area, and lower highs have followed since
🔻 One large bearish candle near 0.93 broke the structure and sent price sharply lower
🔻 A string of red candles followed, with price now sitting right at the 24H low near 0.8842 🧲
📉 Moving Averages Tell the Story:
📌 MA(7): 0.9090
📌 MA(25): 0.9453
📌 MA(99): 0.9658
❌ Price is trading below all three major MAs
❌ All of them are sloping downward
❌ The MA(7) is falling steeply, showing strong downside momentum 🐻
📊 Volume Insight:
🔴 Volume spiked heavily on the breakdown candle
💥 This points to aggressive selling and likely forced liquidations
🔴 Volume has stayed elevated on the red candles that followed, so selling pressure hasn’t eased yet
⚠️ Expect volatility to stay high
🧠 What This Means:
This move wasn’t random ❌
A sideways range breaking down on heavy volume usually signals a leverage flush, with trend continuation risk on top.
🔹 Short-term trend: Bearish
🔹 Momentum: Weak, no confirmed bounce yet
🔹 Market sentiment: Fearful 😨
🎯 Key Levels to Watch:
🟢 Support: 0.8800 – 0.8850 zone
🔴 Resistance: 0.9090 – 0.9450 zone
📌 A reclaim of 0.9090 (MA7) would be the first sign of relief
📌 A clean break below 0.8842 could open the door to deeper downside ⬇️
💡 Final Take:
XRP is in a high-volatility phase where patience beats prediction. Wait for confirmation, keep your position size under control, and always protect your capital with a stop-loss. 🧘🛡️
Discipline will always outlast impulse 💎
#XRP #XRPUSDT #CryptoAnalysis #CryptoTrading #XRPNews
$XRP
$XRP | XRP/USDT
💰 Price: 0.8887
📉 24H Change: -7.93%
📊 24H High: 0.9732
📉 24H Low: 0.8842
💵 24H Volume (USDT): 148.35M
🪙 24H Volume (XRP): 159.18M
⚠️ Market Breakdown (1H Timeframe):
XRP spent hours moving sideways around the 0.95 – 0.97 zone, then lost that range and slipped fast 🧨
🔻 The rejection came from the 0.9805 area, and lower highs have followed since
🔻 One large bearish candle near 0.93 broke the structure and sent price sharply lower
🔻 A string of red candles followed, with price now sitting right at the 24H low near 0.8842 🧲
📉 Moving Averages Tell the Story:
📌 MA(7): 0.9090
📌 MA(25): 0.9453
📌 MA(99): 0.9658
❌ Price is trading below all three major MAs
❌ All of them are sloping downward
❌ The MA(7) is falling steeply, showing strong downside momentum 🐻
📊 Volume Insight:
🔴 Volume spiked heavily on the breakdown candle
💥 This points to aggressive selling and likely forced liquidations
🔴 Volume has stayed elevated on the red candles that followed, so selling pressure hasn’t eased yet
⚠️ Expect volatility to stay high
🧠 What This Means:
This move wasn’t random ❌
A sideways range breaking down on heavy volume usually signals a leverage flush, with trend continuation risk on top.
🔹 Short-term trend: Bearish
🔹 Momentum: Weak, no confirmed bounce yet
🔹 Market sentiment: Fearful 😨
🎯 Key Levels to Watch:
🟢 Support: 0.8800 – 0.8850 zone
🔴 Resistance: 0.9090 – 0.9450 zone
📌 A reclaim of 0.9090 (MA7) would be the first sign of relief
📌 A clean break below 0.8842 could open the door to deeper downside ⬇️
💡 Final Take:
XRP is in a high-volatility phase where patience beats prediction. Wait for confirmation, keep your position size under control, and always protect your capital with a stop-loss. 🧘🛡️
Discipline will always outlast impulse 💎
#XRP #XRPUSDT #CryptoAnalysis #CryptoTrading #XRPNews
$XRP
10
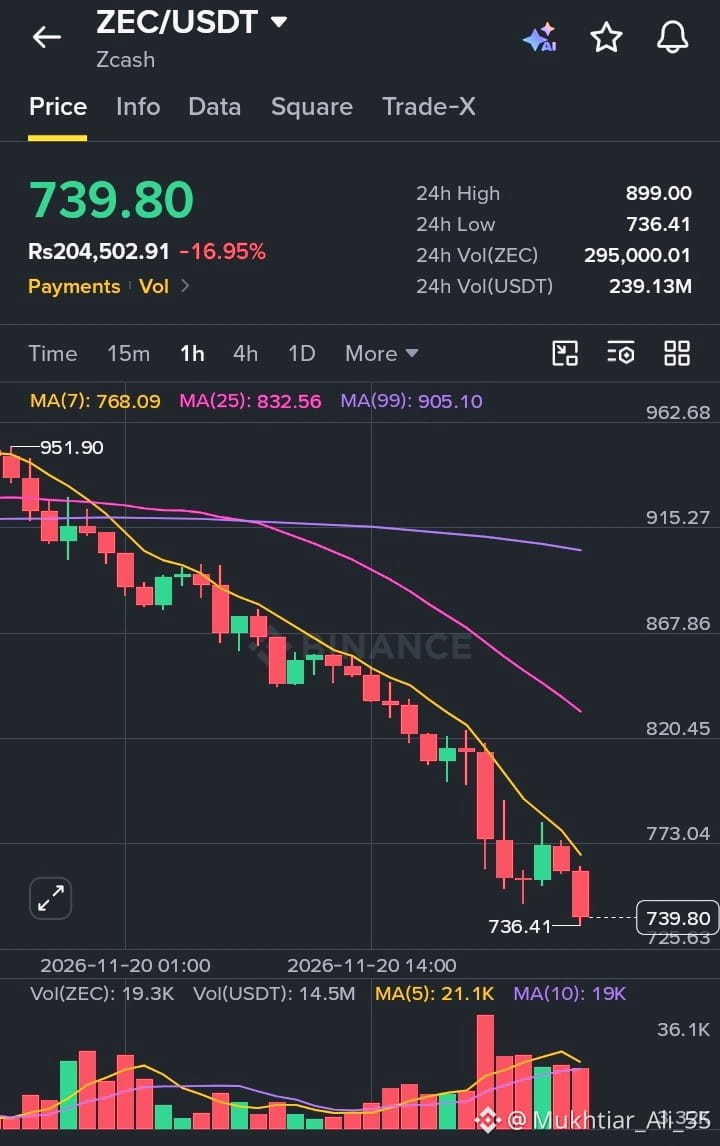
🚨 ZCASH ($ZEC) CHUTE DE PRÈS DE 17 % : LES VENDEURS PRENNENT LE CONTRÔLE TOTAL DE LA TENDANCE 📉🔥
$ZEC | ZEC/USDT
💰 Prix : 739.80
📉 Variation sur 24 h : -16.95%
📊 Plus haut sur 24 h : 899.00
📉 Plus bas sur 24 h : 736.41
💵 Volume sur 24 h (USDT) : 239.13M
🪙 Volume sur 24 h (ZEC) : 295,000.01
⚠️ Analyse du marché (graphique en 1 h) :
Zcash est dans une tendance baissière implacable, glissant depuis la zone des 951.90 avec très peu de répit en cours de route 🧨
🔻 Une longue succession de sommets et de creux descendants caractérise le mouvement depuis des heures
🔻 Les petites bougies vertes ont rapidement été vendues, signe d’une faible conviction des acheteurs
🔻 Une grande bougie baissière près de 773 a fait chuter le prix vers le plus bas sur 24 h, et la dernière bougie clôture juste au plus bas 🧲
📉 Les moyennes mobiles sont révélatrices :
📌 MA(7) : 768.09
📌 MA(25) : 832.56
📌 MA(99) : 905.10
❌ Le prix évolue sous les trois principales moyennes mobiles
❌ Elles sont toutes orientées à la baisse, avec un large écart entre elles
❌ La MA(7) a fait office de plafond à chaque tentative de rebond 🐻
📊 Analyse des volumes :
🔴 Le volume a fortement augmenté lors des grandes bougies rouges
💥 Cela indique des ventes agressives et probablement des liquidations forcées
🔴 Le volume reste élevé sur les dernières bougies : la pression vendeuse ne s’est donc pas encore atténuée
⚠️ La volatilité devrait rester élevée
🧠 Ce que cela signifie :
Ce mouvement n’est pas dû au hasard ❌
Une tendance baissière persistante accompagnée d’une hausse du volume vendeur signale généralement une poursuite de la tendance, alimentée par une liquidation des positions à effet de levier.
🔹 Tendance à court terme : baissière
🔹 Momentum : faible, aucun retournement confirmé pour l’instant
🔹 Sentiment du marché : dicté par la peur 😨
🎯 Niveaux clés à surveiller :
🟢 Support : zone de 725 à 740
🔴 Résistance : zone de 768 à 832
📌 Le franchissement à la hausse de 768 (MA7) serait le premier signe de répit
📌 Une cassure nette sous 736 pourrait ouvrir la voie à une baisse plus profonde ⬇️
💡 En bref :
ZEC traverse une phase à haut risque et forte volatilité, où la patience vaut mieux que les prédictions. Attendez une confirmation, maîtrisez la taille de vos positions et protégez toujours votre capital avec un stop-loss. 🧘🛡️
La discipline finit toujours par l’emporter sur l’impulsivité 💎
#Zcash #ZEC #CryptoAnalysis #ZECUSDT
$ZEC
{spot}(ZECUSDT)
🚨 ZCASH ($ZEC ) CHUTE DE PRÈS DE 17 % : LES VENDEURS PRENNENT LE CONTRÔLE TOTAL DE LA TENDANCE 📉🔥
$ZEC | ZEC/USDT
💰 Prix : 739.80
📉 Variation sur 24 h : -16.95%
📊 Plus haut sur 24 h : 899.00
📉 Plus bas sur 24 h : 736.41
💵 Volume sur 24 h (USDT) : 239.13M
🪙 Volume sur 24 h (ZEC) : 295,000.01
⚠️ Analyse du marché (graphique en 1 h) :
Zcash est dans une tendance baissière implacable, glissant depuis la zone des 951.90 avec très peu de répit en cours de route 🧨
🔻 Une longue succession de sommets et de creux descendants caractérise le mouvement depuis des heures
🔻 Les petites bougies vertes ont rapidement été vendues, signe d’une faible conviction des acheteurs
🔻 Une grande bougie baissière près de 773 a fait chuter le prix vers le plus bas sur 24 h, et la dernière bougie clôture juste au plus bas 🧲
📉 Les moyennes mobiles sont révélatrices :
📌 MA(7) : 768.09
📌 MA(25) : 832.56
📌 MA(99) : 905.10
❌ Le prix évolue sous les trois principales moyennes mobiles
❌ Elles sont toutes orientées à la baisse, avec un large écart entre elles
❌ La MA(7) a fait office de plafond à chaque tentative de rebond 🐻
📊 Analyse des volumes :
🔴 Le volume a fortement augmenté lors des grandes bougies rouges
💥 Cela indique des ventes agressives et probablement des liquidations forcées
🔴 Le volume reste élevé sur les dernières bougies : la pression vendeuse ne s’est donc pas encore atténuée
⚠️ La volatilité devrait rester élevée
🧠 Ce que cela signifie :
Ce mouvement n’est pas dû au hasard ❌
Une tendance baissière persistante accompagnée d’une hausse du volume vendeur signale généralement une poursuite de la tendance, alimentée par une liquidation des positions à effet de levier.
🔹 Tendance à court terme : baissière
🔹 Momentum : faible, aucun retournement confirmé pour l’instant
🔹 Sentiment du marché : dicté par la peur 😨
🎯 Niveaux clés à surveiller :
🟢 Support : zone de 725 à 740
🔴 Résistance : zone de 768 à 832
📌 Le franchissement à la hausse de 768 (MA7) serait le premier signe de répit
📌 Une cassure nette sous 736 pourrait ouvrir la voie à une baisse plus profonde ⬇️
💡 En bref :
ZEC traverse une phase à haut risque et forte volatilité, où la patience vaut mieux que les prédictions. Attendez une confirmation, maîtrisez la taille de vos positions et protégez toujours votre capital avec un stop-loss. 🧘🛡️
La discipline finit toujours par l’emporter sur l’impulsivité 💎
#Zcash #ZEC #CryptoAnalysis #ZECUSDT
$ZEC
$ZEC | ZEC/USDT
💰 Prix : 739.80
📉 Variation sur 24 h : -16.95%
📊 Plus haut sur 24 h : 899.00
📉 Plus bas sur 24 h : 736.41
💵 Volume sur 24 h (USDT) : 239.13M
🪙 Volume sur 24 h (ZEC) : 295,000.01
⚠️ Analyse du marché (graphique en 1 h) :
Zcash est dans une tendance baissière implacable, glissant depuis la zone des 951.90 avec très peu de répit en cours de route 🧨
🔻 Une longue succession de sommets et de creux descendants caractérise le mouvement depuis des heures
🔻 Les petites bougies vertes ont rapidement été vendues, signe d’une faible conviction des acheteurs
🔻 Une grande bougie baissière près de 773 a fait chuter le prix vers le plus bas sur 24 h, et la dernière bougie clôture juste au plus bas 🧲
📉 Les moyennes mobiles sont révélatrices :
📌 MA(7) : 768.09
📌 MA(25) : 832.56
📌 MA(99) : 905.10
❌ Le prix évolue sous les trois principales moyennes mobiles
❌ Elles sont toutes orientées à la baisse, avec un large écart entre elles
❌ La MA(7) a fait office de plafond à chaque tentative de rebond 🐻
📊 Analyse des volumes :
🔴 Le volume a fortement augmenté lors des grandes bougies rouges
💥 Cela indique des ventes agressives et probablement des liquidations forcées
🔴 Le volume reste élevé sur les dernières bougies : la pression vendeuse ne s’est donc pas encore atténuée
⚠️ La volatilité devrait rester élevée
🧠 Ce que cela signifie :
Ce mouvement n’est pas dû au hasard ❌
Une tendance baissière persistante accompagnée d’une hausse du volume vendeur signale généralement une poursuite de la tendance, alimentée par une liquidation des positions à effet de levier.
🔹 Tendance à court terme : baissière
🔹 Momentum : faible, aucun retournement confirmé pour l’instant
🔹 Sentiment du marché : dicté par la peur 😨
🎯 Niveaux clés à surveiller :
🟢 Support : zone de 725 à 740
🔴 Résistance : zone de 768 à 832
📌 Le franchissement à la hausse de 768 (MA7) serait le premier signe de répit
📌 Une cassure nette sous 736 pourrait ouvrir la voie à une baisse plus profonde ⬇️
💡 En bref :
ZEC traverse une phase à haut risque et forte volatilité, où la patience vaut mieux que les prédictions. Attendez une confirmation, maîtrisez la taille de vos positions et protégez toujours votre capital avec un stop-loss. 🧘🛡️
La discipline finit toujours par l’emporter sur l’impulsivité 💎
#Zcash #ZEC #CryptoAnalysis #ZECUSDT
$ZEC
19
Voir la traduction
🚨 SOLANA ($SOL) KEEPS BLEEDING: SELLERS PRESS THE ADVANTAGE AS SUPPORT THINS OUT 📉🔥
$SOL | SOL/USDT
💰 Price: 67.59
📉 24H Change: -7.40%
📊 24H High: 73.56
📉 24H Low: 67.28
💵 24H Volume (USDT): 262.24M
🪙 24H Volume (SOL): 3.72M
⚠️ Market Breakdown (1H Timeframe):
Solana slid steadily from the 75.65 area, then picked up speed once the 72 – 73 zone failed 🧨
🔻 A string of lower highs and lower lows has defined the trend for hours
🔻 One large bearish candle near 70.50 accelerated the drop and flushed out weak hands
🔻 Price is now sitting right at the 24H low, with only a thin wick near 67.28 showing buyers testing the waters 🧲
📉 Moving Averages Tell the Story:
📌 MA(7): 68.99
📌 MA(25): 71.49
📌 MA(99): 73.05
❌ Price is trading below all three major MAs
❌ All of them are sloping downward
❌ The MA(7) keeps rejecting every attempt at a bounce 🐻
📊 Volume Insight:
🔴 Volume spiked heavily on the breakdown candle
💥 This points to aggressive selling and likely forced liquidations
🔴 Recent candles are still red, and the small bounce attempt lacked follow-through
⚠️ Expect volatility to stay elevated
🧠 What This Means:
This move wasn’t random ❌
A steady downtrend followed by a high-volume breakdown usually signals trend continuation with a leverage flush on top.
🔹 Short-term trend: Bearish
🔹 Momentum: Weak, no confirmed reversal yet
🔹 Market sentiment: Fearful 😨
🎯 Key Levels to Watch:
🟢 Support: 66.80 – 67.30 zone
🔴 Resistance: 69 – 71.50 zone
📌 A reclaim of 69 (MA7) would be the first sign of relief
📌 A clean break below 67.28 could open the door to deeper downside ⬇️
💡 Final Take:
SOL is in a high-risk, high-volatility phase where patience beats prediction. Let the chart confirm before acting, manage your position size, and always protect your capital with a stop-loss. 🧘🛡️
Discipline will always outlast impulse 💎
#Solana #SOL #CryptoAnalysis #SOLUSDT #CryptoTrading
$SOL
{spot}(SOLUSDT)
🚨 SOLANA ($SOL ) KEEPS BLEEDING: SELLERS PRESS THE ADVANTAGE AS SUPPORT THINS OUT 📉🔥
$SOL | SOL/USDT
💰 Price: 67.59
📉 24H Change: -7.40%
📊 24H High: 73.56
📉 24H Low: 67.28
💵 24H Volume (USDT): 262.24M
🪙 24H Volume (SOL): 3.72M
⚠️ Market Breakdown (1H Timeframe):
Solana slid steadily from the 75.65 area, then picked up speed once the 72 – 73 zone failed 🧨
🔻 A string of lower highs and lower lows has defined the trend for hours
🔻 One large bearish candle near 70.50 accelerated the drop and flushed out weak hands
🔻 Price is now sitting right at the 24H low, with only a thin wick near 67.28 showing buyers testing the waters 🧲
📉 Moving Averages Tell the Story:
📌 MA(7): 68.99
📌 MA(25): 71.49
📌 MA(99): 73.05
❌ Price is trading below all three major MAs
❌ All of them are sloping downward
❌ The MA(7) keeps rejecting every attempt at a bounce 🐻
📊 Volume Insight:
🔴 Volume spiked heavily on the breakdown candle
💥 This points to aggressive selling and likely forced liquidations
🔴 Recent candles are still red, and the small bounce attempt lacked follow-through
⚠️ Expect volatility to stay elevated
🧠 What This Means:
This move wasn’t random ❌
A steady downtrend followed by a high-volume breakdown usually signals trend continuation with a leverage flush on top.
🔹 Short-term trend: Bearish
🔹 Momentum: Weak, no confirmed reversal yet
🔹 Market sentiment: Fearful 😨
🎯 Key Levels to Watch:
🟢 Support: 66.80 – 67.30 zone
🔴 Resistance: 69 – 71.50 zone
📌 A reclaim of 69 (MA7) would be the first sign of relief
📌 A clean break below 67.28 could open the door to deeper downside ⬇️
💡 Final Take:
SOL is in a high-risk, high-volatility phase where patience beats prediction. Let the chart confirm before acting, manage your position size, and always protect your capital with a stop-loss. 🧘🛡️
Discipline will always outlast impulse 💎
#Solana #SOL #CryptoAnalysis #SOLUSDT #CryptoTrading
$SOL
$SOL | SOL/USDT
💰 Price: 67.59
📉 24H Change: -7.40%
📊 24H High: 73.56
📉 24H Low: 67.28
💵 24H Volume (USDT): 262.24M
🪙 24H Volume (SOL): 3.72M
⚠️ Market Breakdown (1H Timeframe):
Solana slid steadily from the 75.65 area, then picked up speed once the 72 – 73 zone failed 🧨
🔻 A string of lower highs and lower lows has defined the trend for hours
🔻 One large bearish candle near 70.50 accelerated the drop and flushed out weak hands
🔻 Price is now sitting right at the 24H low, with only a thin wick near 67.28 showing buyers testing the waters 🧲
📉 Moving Averages Tell the Story:
📌 MA(7): 68.99
📌 MA(25): 71.49
📌 MA(99): 73.05
❌ Price is trading below all three major MAs
❌ All of them are sloping downward
❌ The MA(7) keeps rejecting every attempt at a bounce 🐻
📊 Volume Insight:
🔴 Volume spiked heavily on the breakdown candle
💥 This points to aggressive selling and likely forced liquidations
🔴 Recent candles are still red, and the small bounce attempt lacked follow-through
⚠️ Expect volatility to stay elevated
🧠 What This Means:
This move wasn’t random ❌
A steady downtrend followed by a high-volume breakdown usually signals trend continuation with a leverage flush on top.
🔹 Short-term trend: Bearish
🔹 Momentum: Weak, no confirmed reversal yet
🔹 Market sentiment: Fearful 😨
🎯 Key Levels to Watch:
🟢 Support: 66.80 – 67.30 zone
🔴 Resistance: 69 – 71.50 zone
📌 A reclaim of 69 (MA7) would be the first sign of relief
📌 A clean break below 67.28 could open the door to deeper downside ⬇️
💡 Final Take:
SOL is in a high-risk, high-volatility phase where patience beats prediction. Let the chart confirm before acting, manage your position size, and always protect your capital with a stop-loss. 🧘🛡️
Discipline will always outlast impulse 💎
#Solana #SOL #CryptoAnalysis #SOLUSDT #CryptoTrading
$SOL
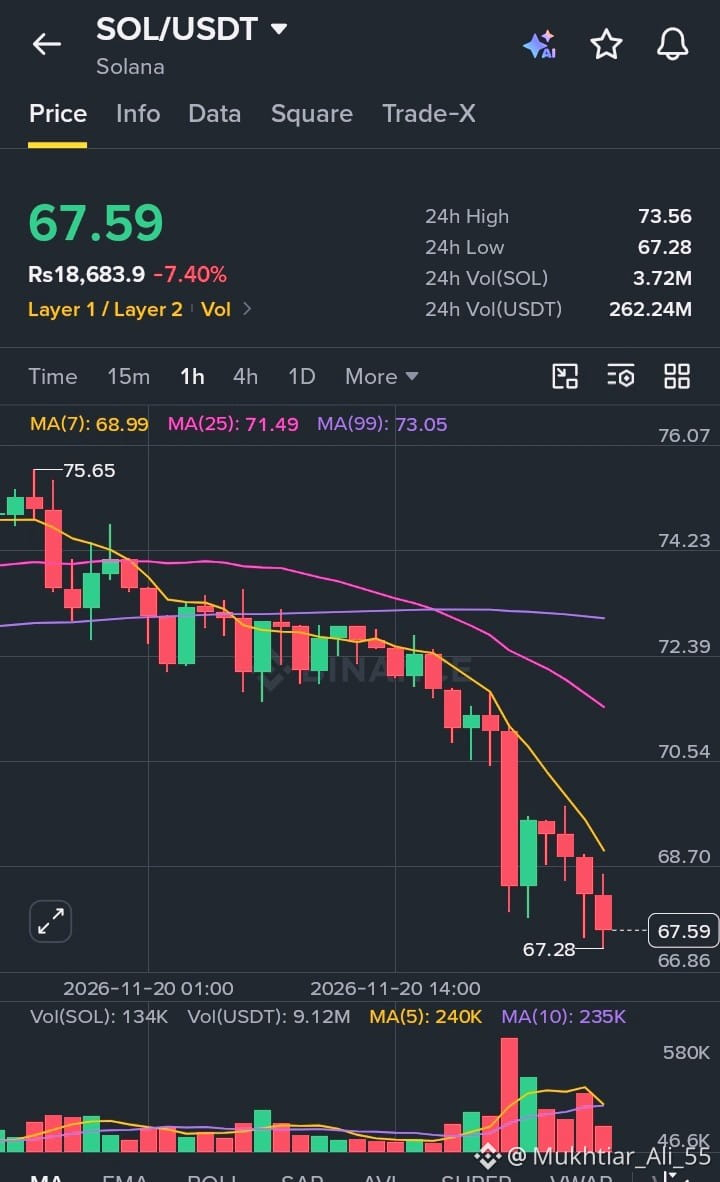
8
Voir la traduction
🚨 ETHEREUM ($ETH) SLIDES HARD: SELLERS DOMINATE AS KEY SUPPORT GIVES WAY 📉🔥
$ETH | ETH/USDT
💰 Price: 1,596.71
📉 24H Change: -9.45%
📊 24H High: 1,770.55
📉 24H Low: 1,581.47
💵 24H Volume (USDT): 1.07B
🪙 24H Volume (ETH): 636,682.43
⚠️ Market Breakdown (1H Timeframe):
Ethereum spent hours consolidating in the 1,700 – 1,740 range before a heavy sell-off took over 🧨
🔻 One large bearish candle sliced through the entire consolidation zone
🔻 The rejection came near the 1,815 area, and sellers have controlled the trend since
🔻 Several consecutive red candles followed, with only a small wick near 1,581 hinting at buyers testing the waters 🧲
📉 Moving Averages Tell the Story:
📌 MA(7): 1,642.42
📌 MA(25): 1,719.02
📌 MA(99): 1,779.88
❌ Price is trading below all three major MAs
❌ All of them are sloping downward
❌ The gap between price and the MA(7) shows how stretched this move is 🐻
📊 Volume Insight:
🔴 Volume exploded on the breakdown candle
💥 This suggests aggressive selling and likely forced liquidations
🔴 Volume stayed elevated on the following red candles, so selling pressure hasn’t faded yet
⚠️ Expect volatility to remain high
🧠 What This Means:
This drop wasn’t random ❌
A tight range gave way on heavy volume, which often points to a leverage flush.
🔹 Short-term trend: Bearish
🔹 Momentum: Weak, no confirmed bounce yet
🔹 Market sentiment: Fearful 😨
🎯 Key Levels to Watch:
🟢 Support: 1,570 – 1,580 zone
🔴 Resistance: 1,640 – 1,720 zone
📌 A reclaim of 1,642 (MA7) would be the first sign of relief
📌 A clean break below 1,581 could open the door to deeper downside ⬇️
💡 Final Take:
ETH is in a high-volatility phase where patience beats prediction. Wait for confirmation, keep position sizes sensible, and protect your capital with a stop-loss. 🧘🛡️
Discipline matters more than chasing every candle 💎
#Ethereum #ETH #CryptoAnalysis #ETHUSDT #CryptoTrading
$ETH
{spot}(ETHUSDT)
🚨 ETHEREUM ($ETH ) SLIDES HARD: SELLERS DOMINATE AS KEY SUPPORT GIVES WAY 📉🔥
$ETH | ETH/USDT
💰 Price: 1,596.71
📉 24H Change: -9.45%
📊 24H High: 1,770.55
📉 24H Low: 1,581.47
💵 24H Volume (USDT): 1.07B
🪙 24H Volume (ETH): 636,682.43
⚠️ Market Breakdown (1H Timeframe):
Ethereum spent hours consolidating in the 1,700 – 1,740 range before a heavy sell-off took over 🧨
🔻 One large bearish candle sliced through the entire consolidation zone
🔻 The rejection came near the 1,815 area, and sellers have controlled the trend since
🔻 Several consecutive red candles followed, with only a small wick near 1,581 hinting at buyers testing the waters 🧲
📉 Moving Averages Tell the Story:
📌 MA(7): 1,642.42
📌 MA(25): 1,719.02
📌 MA(99): 1,779.88
❌ Price is trading below all three major MAs
❌ All of them are sloping downward
❌ The gap between price and the MA(7) shows how stretched this move is 🐻
📊 Volume Insight:
🔴 Volume exploded on the breakdown candle
💥 This suggests aggressive selling and likely forced liquidations
🔴 Volume stayed elevated on the following red candles, so selling pressure hasn’t faded yet
⚠️ Expect volatility to remain high
🧠 What This Means:
This drop wasn’t random ❌
A tight range gave way on heavy volume, which often points to a leverage flush.
🔹 Short-term trend: Bearish
🔹 Momentum: Weak, no confirmed bounce yet
🔹 Market sentiment: Fearful 😨
🎯 Key Levels to Watch:
🟢 Support: 1,570 – 1,580 zone
🔴 Resistance: 1,640 – 1,720 zone
📌 A reclaim of 1,642 (MA7) would be the first sign of relief
📌 A clean break below 1,581 could open the door to deeper downside ⬇️
💡 Final Take:
ETH is in a high-volatility phase where patience beats prediction. Wait for confirmation, keep position sizes sensible, and protect your capital with a stop-loss. 🧘🛡️
Discipline matters more than chasing every candle 💎
#Ethereum #ETH #CryptoAnalysis #ETHUSDT #CryptoTrading
$ETH
$ETH | ETH/USDT
💰 Price: 1,596.71
📉 24H Change: -9.45%
📊 24H High: 1,770.55
📉 24H Low: 1,581.47
💵 24H Volume (USDT): 1.07B
🪙 24H Volume (ETH): 636,682.43
⚠️ Market Breakdown (1H Timeframe):
Ethereum spent hours consolidating in the 1,700 – 1,740 range before a heavy sell-off took over 🧨
🔻 One large bearish candle sliced through the entire consolidation zone
🔻 The rejection came near the 1,815 area, and sellers have controlled the trend since
🔻 Several consecutive red candles followed, with only a small wick near 1,581 hinting at buyers testing the waters 🧲
📉 Moving Averages Tell the Story:
📌 MA(7): 1,642.42
📌 MA(25): 1,719.02
📌 MA(99): 1,779.88
❌ Price is trading below all three major MAs
❌ All of them are sloping downward
❌ The gap between price and the MA(7) shows how stretched this move is 🐻
📊 Volume Insight:
🔴 Volume exploded on the breakdown candle
💥 This suggests aggressive selling and likely forced liquidations
🔴 Volume stayed elevated on the following red candles, so selling pressure hasn’t faded yet
⚠️ Expect volatility to remain high
🧠 What This Means:
This drop wasn’t random ❌
A tight range gave way on heavy volume, which often points to a leverage flush.
🔹 Short-term trend: Bearish
🔹 Momentum: Weak, no confirmed bounce yet
🔹 Market sentiment: Fearful 😨
🎯 Key Levels to Watch:
🟢 Support: 1,570 – 1,580 zone
🔴 Resistance: 1,640 – 1,720 zone
📌 A reclaim of 1,642 (MA7) would be the first sign of relief
📌 A clean break below 1,581 could open the door to deeper downside ⬇️
💡 Final Take:
ETH is in a high-volatility phase where patience beats prediction. Wait for confirmation, keep position sizes sensible, and protect your capital with a stop-loss. 🧘🛡️
Discipline matters more than chasing every candle 💎
#Ethereum #ETH #CryptoAnalysis #ETHUSDT #CryptoTrading
$ETH
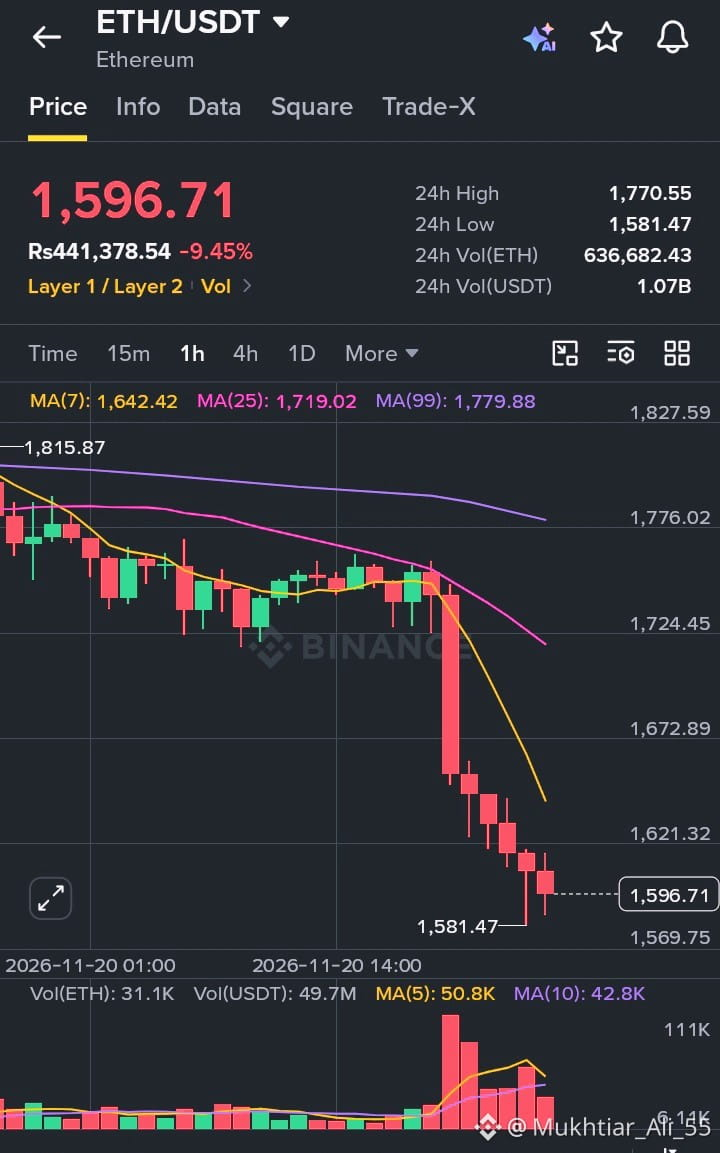
6
🚨 LE BITCOIN ($BTC) S’EFFONDRE : LES BAISSIERS PRENNENT LE CONTRÔLE APRÈS UNE FORTE VAGUE DE VENTES 📉🔥
$BTC | BTC/USDT
💰 Prix : 58,642.77
📉 Variation sur 24 h : -5.62%
📊 Plus haut sur 24 h : 62,639.52
📉 Plus bas sur 24 h : 57,778.35
💵 Volume sur 24 h (USDT) : 2.24B
🪙 Volume sur 24 h (BTC) : 37,007.34
⚠️ Analyse du marché (unité de temps 1 h) :
Le Bitcoin a évolué pendant des heures dans une fourchette latérale de 61,500 à 62,000, avant de chuter brutalement 🧨
🔻 Une grande bougie baissière a effacé toute cette zone de consolidation
🔻 Le rejet est parti de la zone des 63,408, et les vendeurs ont gardé la main depuis
🔻 Une longue mèche basse près de 57,778 montre que les acheteurs sont intervenus pour provoquer un rebond à court terme 🧲
📉 Les moyennes mobiles racontent l’histoire :
📌 MA(7) : 59,367.97
📌 MA(25) : 61,187.75
📌 MA(99) : 63,303.93
❌ Le cours évolue sous les trois principales moyennes mobiles
❌ Elles sont toutes orientées à la baisse
❌ Jusqu’ici, chaque petit rebond s’est heurté à la pression vendeuse 🐻
📊 Analyse des volumes :
🔴 Le volume a fortement bondi lors de la bougie de rupture
💥 Cela indique des ventes agressives et probablement des liquidations forcées
🟢 Le volume a diminué sur les bougies de reprise, le rebond n’est donc pas encore convaincant
⚠️ La volatilité devrait rester élevée
🧠 Ce que cela signifie :
Ce mouvement n’est pas sorti de nulle part ❌
Une fourchette étroite a été rompue à la baisse sur un volume important, ce qui signale généralement une purge des positions à effet de levier.
🔹 Tendance à court terme : baissière
🔹 Dynamique : faible, avec un rebond timide
🔹 Sentiment du marché : prudent à craintif 😨
🎯 Niveaux clés à surveiller :
🟢 Support : zone des 57,500 à 58,000
🔴 Résistance : zone des 59,400 à 61,200
📌 Un retour au-dessus de 59,400 (MA7) serait le premier signe d’un répit
📌 Une nette cassure sous 57,778 pourrait ouvrir la voie à une baisse plus marquée ⬇️
💡 En résumé :
Le BTC traverse une phase de forte volatilité, où réagir sous le coup de l’émotion peut coûter cher. Attendez que le cours confirme son mouvement avant d’agir, dimensionnez soigneusement vos positions et utilisez toujours un ordre stop-loss. 🧘🛡️
La patience et la discipline comptent davantage que le fait d’essayer de saisir chaque mouvement 💎
#Bitcoin #BTC #CryptoAnalysis #BTCUSDT #CryptoTrading
$BTC
{spot}(BTCUSDT)
🚨 LE BITCOIN ($BTC ) S’EFFONDRE : LES BAISSIERS PRENNENT LE CONTRÔLE APRÈS UNE FORTE VAGUE DE VENTES 📉🔥
$BTC | BTC/USDT
💰 Prix : 58,642.77
📉 Variation sur 24 h : -5.62%
📊 Plus haut sur 24 h : 62,639.52
📉 Plus bas sur 24 h : 57,778.35
💵 Volume sur 24 h (USDT) : 2.24B
🪙 Volume sur 24 h (BTC) : 37,007.34
⚠️ Analyse du marché (unité de temps 1 h) :
Le Bitcoin a évolué pendant des heures dans une fourchette latérale de 61,500 à 62,000, avant de chuter brutalement 🧨
🔻 Une grande bougie baissière a effacé toute cette zone de consolidation
🔻 Le rejet est parti de la zone des 63,408, et les vendeurs ont gardé la main depuis
🔻 Une longue mèche basse près de 57,778 montre que les acheteurs sont intervenus pour provoquer un rebond à court terme 🧲
📉 Les moyennes mobiles racontent l’histoire :
📌 MA(7) : 59,367.97
📌 MA(25) : 61,187.75
📌 MA(99) : 63,303.93
❌ Le cours évolue sous les trois principales moyennes mobiles
❌ Elles sont toutes orientées à la baisse
❌ Jusqu’ici, chaque petit rebond s’est heurté à la pression vendeuse 🐻
📊 Analyse des volumes :
🔴 Le volume a fortement bondi lors de la bougie de rupture
💥 Cela indique des ventes agressives et probablement des liquidations forcées
🟢 Le volume a diminué sur les bougies de reprise, le rebond n’est donc pas encore convaincant
⚠️ La volatilité devrait rester élevée
🧠 Ce que cela signifie :
Ce mouvement n’est pas sorti de nulle part ❌
Une fourchette étroite a été rompue à la baisse sur un volume important, ce qui signale généralement une purge des positions à effet de levier.
🔹 Tendance à court terme : baissière
🔹 Dynamique : faible, avec un rebond timide
🔹 Sentiment du marché : prudent à craintif 😨
🎯 Niveaux clés à surveiller :
🟢 Support : zone des 57,500 à 58,000
🔴 Résistance : zone des 59,400 à 61,200
📌 Un retour au-dessus de 59,400 (MA7) serait le premier signe d’un répit
📌 Une nette cassure sous 57,778 pourrait ouvrir la voie à une baisse plus marquée ⬇️
💡 En résumé :
Le BTC traverse une phase de forte volatilité, où réagir sous le coup de l’émotion peut coûter cher. Attendez que le cours confirme son mouvement avant d’agir, dimensionnez soigneusement vos positions et utilisez toujours un ordre stop-loss. 🧘🛡️
La patience et la discipline comptent davantage que le fait d’essayer de saisir chaque mouvement 💎
#Bitcoin #BTC #CryptoAnalysis #BTCUSDT #CryptoTrading
$BTC
$BTC | BTC/USDT
💰 Prix : 58,642.77
📉 Variation sur 24 h : -5.62%
📊 Plus haut sur 24 h : 62,639.52
📉 Plus bas sur 24 h : 57,778.35
💵 Volume sur 24 h (USDT) : 2.24B
🪙 Volume sur 24 h (BTC) : 37,007.34
⚠️ Analyse du marché (unité de temps 1 h) :
Le Bitcoin a évolué pendant des heures dans une fourchette latérale de 61,500 à 62,000, avant de chuter brutalement 🧨
🔻 Une grande bougie baissière a effacé toute cette zone de consolidation
🔻 Le rejet est parti de la zone des 63,408, et les vendeurs ont gardé la main depuis
🔻 Une longue mèche basse près de 57,778 montre que les acheteurs sont intervenus pour provoquer un rebond à court terme 🧲
📉 Les moyennes mobiles racontent l’histoire :
📌 MA(7) : 59,367.97
📌 MA(25) : 61,187.75
📌 MA(99) : 63,303.93
❌ Le cours évolue sous les trois principales moyennes mobiles
❌ Elles sont toutes orientées à la baisse
❌ Jusqu’ici, chaque petit rebond s’est heurté à la pression vendeuse 🐻
📊 Analyse des volumes :
🔴 Le volume a fortement bondi lors de la bougie de rupture
💥 Cela indique des ventes agressives et probablement des liquidations forcées
🟢 Le volume a diminué sur les bougies de reprise, le rebond n’est donc pas encore convaincant
⚠️ La volatilité devrait rester élevée
🧠 Ce que cela signifie :
Ce mouvement n’est pas sorti de nulle part ❌
Une fourchette étroite a été rompue à la baisse sur un volume important, ce qui signale généralement une purge des positions à effet de levier.
🔹 Tendance à court terme : baissière
🔹 Dynamique : faible, avec un rebond timide
🔹 Sentiment du marché : prudent à craintif 😨
🎯 Niveaux clés à surveiller :
🟢 Support : zone des 57,500 à 58,000
🔴 Résistance : zone des 59,400 à 61,200
📌 Un retour au-dessus de 59,400 (MA7) serait le premier signe d’un répit
📌 Une nette cassure sous 57,778 pourrait ouvrir la voie à une baisse plus marquée ⬇️
💡 En résumé :
Le BTC traverse une phase de forte volatilité, où réagir sous le coup de l’émotion peut coûter cher. Attendez que le cours confirme son mouvement avant d’agir, dimensionnez soigneusement vos positions et utilisez toujours un ordre stop-loss. 🧘🛡️
La patience et la discipline comptent davantage que le fait d’essayer de saisir chaque mouvement 💎
#Bitcoin #BTC #CryptoAnalysis #BTCUSDT #CryptoTrading
$BTC
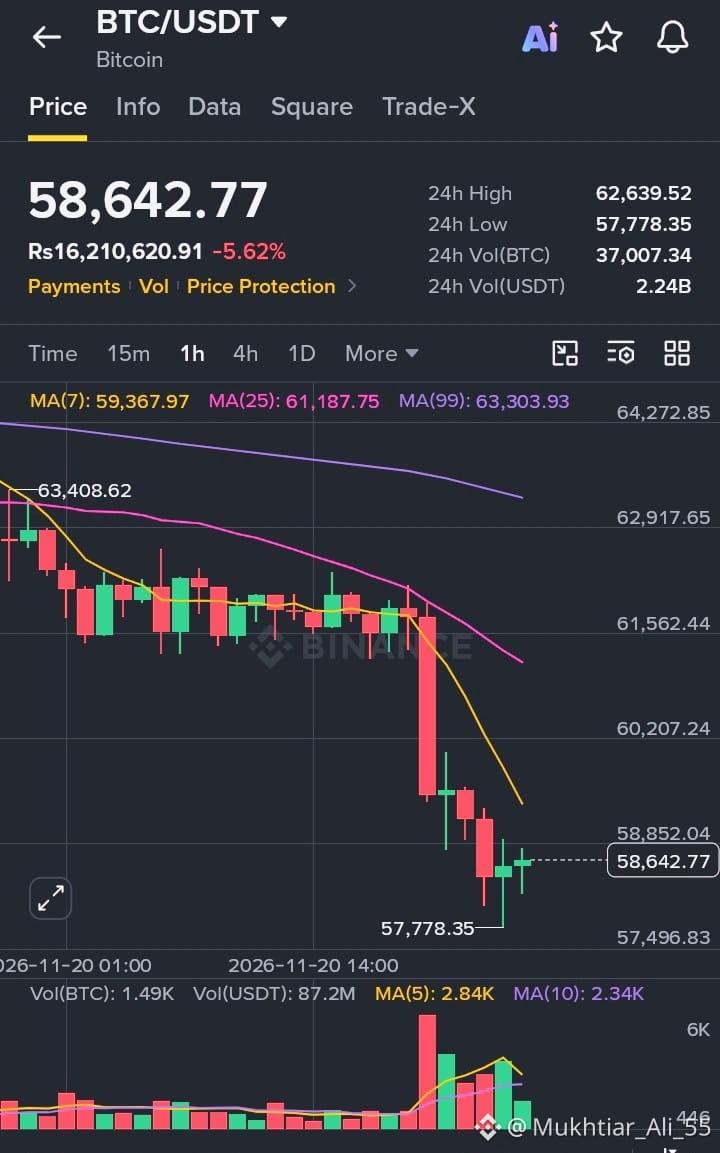
6
Clearpool (CLEAR) : point sur le marché — un pic de volatilité brutal met à l’épreuve la résistance à 0,030 $
Clearpool (CLEAR) connaît une forte activité des prix et s’échange actuellement à 0,027468 $ après avoir enregistré une hausse de 10.60% au cours des dernières 24 heures.
Sur le graphique en 1 heure, le jeton a effectué une brusque percée verticale depuis son plus bas sur 24 heures, à 0,024052 $, jusqu’à tester un sommet local à 0,030405 $, avant de reculer immédiatement dans un pic de volume important. Malgré le rejet marqué indiqué par la longue mèche supérieure, le cours reste bien au-dessus de ses moyennes mobiles à court terme : il se maintient au-dessus de la MA(7) à 0,024799 $ et de la MA(25) à 0,024889 $.
Principales mesures on-chain et de marché :
Capitalisation boursière : 30.85 M$
Valorisation entièrement diluée (FDV) : 39.17 M$
Volume sur 24 h : 163,805.51 $ sur 407 transactions
Liquidité on-chain : 234,011.51 $
Nombre total de détenteurs on-chain : 266
Avec un nombre relativement faible de détenteurs on-chain et une profondeur de liquidité modeste, des ordres d’achat ou de vente soudains peuvent déclencher des chandelles disproportionnées, comme le récent pic. Les traders surveilleront si CLEAR parvient à se stabiliser au-dessus de la zone de moyenne mobile à 0,0248 $ pour en faire un nouveau support, ou si une consolidation supplémentaire suivra le rejet à 0,0304 $. Gérez toujours vos risques et faites vos propres recherches avant toute transaction.
#CLEAR #Clearpool #DeFi #CryptoAnalysis #Altcoins
$CLEAR
Clearpool (CLEAR) : point sur le marché — un pic de volatilité brutal met à l’épreuve la résistance à 0,030 $
Clearpool (CLEAR) connaît une forte activité des prix et s’échange actuellement à 0,027468 $ après avoir enregistré une hausse de 10.60% au cours des dernières 24 heures.
Sur le graphique en 1 heure, le jeton a effectué une brusque percée verticale depuis son plus bas sur 24 heures, à 0,024052 $, jusqu’à tester un sommet local à 0,030405 $, avant de reculer immédiatement dans un pic de volume important. Malgré le rejet marqué indiqué par la longue mèche supérieure, le cours reste bien au-dessus de ses moyennes mobiles à court terme : il se maintient au-dessus de la MA(7) à 0,024799 $ et de la MA(25) à 0,024889 $.
Principales mesures on-chain et de marché :
Capitalisation boursière : 30.85 M$
Valorisation entièrement diluée (FDV) : 39.17 M$
Volume sur 24 h : 163,805.51 $ sur 407 transactions
Liquidité on-chain : 234,011.51 $
Nombre total de détenteurs on-chain : 266
Avec un nombre relativement faible de détenteurs on-chain et une profondeur de liquidité modeste, des ordres d’achat ou de vente soudains peuvent déclencher des chandelles disproportionnées, comme le récent pic. Les traders surveilleront si CLEAR parvient à se stabiliser au-dessus de la zone de moyenne mobile à 0,0248 $ pour en faire un nouveau support, ou si une consolidation supplémentaire suivra le rejet à 0,0304 $. Gérez toujours vos risques et faites vos propres recherches avant toute transaction.
#CLEAR #Clearpool #DeFi #CryptoAnalysis #Altcoins
$CLEAR
Clearpool (CLEAR) connaît une forte activité des prix et s’échange actuellement à 0,027468 $ après avoir enregistré une hausse de 10.60% au cours des dernières 24 heures.
Sur le graphique en 1 heure, le jeton a effectué une brusque percée verticale depuis son plus bas sur 24 heures, à 0,024052 $, jusqu’à tester un sommet local à 0,030405 $, avant de reculer immédiatement dans un pic de volume important. Malgré le rejet marqué indiqué par la longue mèche supérieure, le cours reste bien au-dessus de ses moyennes mobiles à court terme : il se maintient au-dessus de la MA(7) à 0,024799 $ et de la MA(25) à 0,024889 $.
Principales mesures on-chain et de marché :
Capitalisation boursière : 30.85 M$
Valorisation entièrement diluée (FDV) : 39.17 M$
Volume sur 24 h : 163,805.51 $ sur 407 transactions
Liquidité on-chain : 234,011.51 $
Nombre total de détenteurs on-chain : 266
Avec un nombre relativement faible de détenteurs on-chain et une profondeur de liquidité modeste, des ordres d’achat ou de vente soudains peuvent déclencher des chandelles disproportionnées, comme le récent pic. Les traders surveilleront si CLEAR parvient à se stabiliser au-dessus de la zone de moyenne mobile à 0,0248 $ pour en faire un nouveau support, ou si une consolidation supplémentaire suivra le rejet à 0,0304 $. Gérez toujours vos risques et faites vos propres recherches avant toute transaction.
#CLEAR #Clearpool #DeFi #CryptoAnalysis #Altcoins
$CLEAR
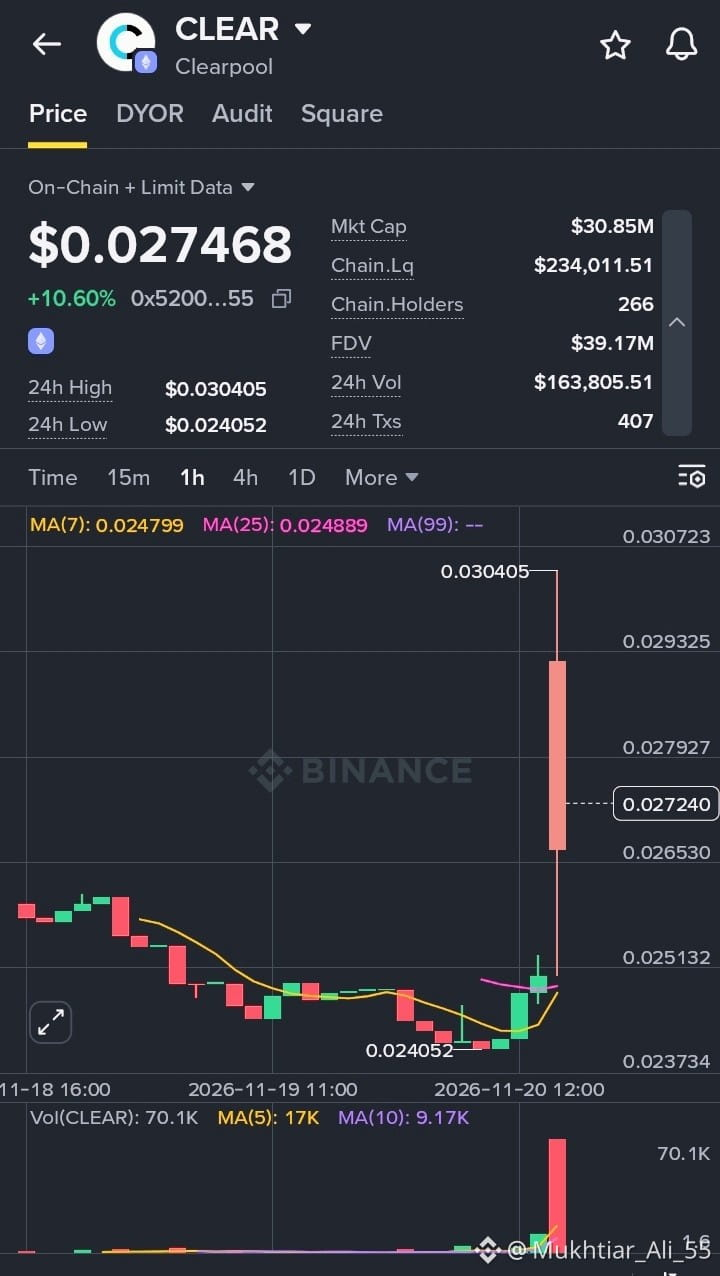
6
Actualités du marché de Folks Finance (FOLKS) : une cassure haussière propulse le cours près de son plus haut sur 24 h
Folks Finance (FOLKS) affiche un regain de dynamique haussière et s’échange actuellement à 2,29545 $, après avoir progressé de 4,94 % au cours des dernières 24 heures.
Sur le graphique horaire, le jeton a rebondi nettement depuis son plus bas sur 24 h, à 2,12563 $, et a bondi pour tester son plus haut sur 24 h, à 2,30951 $. Le cours a franchi de manière décisive toutes les principales moyennes mobiles — se maintenant confortablement au-dessus de la MA(7), à 2,23981 $, de la MA(25), à 2,21539 $, et de la MA(99), à 2,14596 $ — avec à l’appui un pic notable du volume acheteur.
Principales métriques on-chain et de marché :
Capitalisation boursière : 42,08 M$
Valorisation entièrement diluée (FDV) : 114,81 M$
Volume sur 24 h : 491 811,15 $ pour 8 206 transactions
Liquidité on-chain : 242 244,54 $
Nombre total de détenteurs : 2 560
Avec une base de détenteurs relativement restreinte et une liquidité plus faible par rapport à sa capitalisation boursière, les pics de volume peuvent entraîner de fortes variations de prix. Les traders surveilleront si FOLKS parvient à franchir nettement la résistance des 2,31 $ ou s’il reteste la zone de la MA(7), à 2,24 $, comme nouveau support. Gérez toujours votre risque et faites vos propres recherches avant d’effectuer des transactions.
#FOLKS #FolksFinance #DeFi #CryptoAnalysis #Altcoins
$FOLKS
{future}(FOLKSUSDT)
Actualités du marché de Folks Finance (FOLKS) : une cassure haussière propulse le cours près de son plus haut sur 24 h
Folks Finance (FOLKS) affiche un regain de dynamique haussière et s’échange actuellement à 2,29545 $, après avoir progressé de 4,94 % au cours des dernières 24 heures.
Sur le graphique horaire, le jeton a rebondi nettement depuis son plus bas sur 24 h, à 2,12563 $, et a bondi pour tester son plus haut sur 24 h, à 2,30951 $. Le cours a franchi de manière décisive toutes les principales moyennes mobiles — se maintenant confortablement au-dessus de la MA(7), à 2,23981 $, de la MA(25), à 2,21539 $, et de la MA(99), à 2,14596 $ — avec à l’appui un pic notable du volume acheteur.
Principales métriques on-chain et de marché :
Capitalisation boursière : 42,08 M$
Valorisation entièrement diluée (FDV) : 114,81 M$
Volume sur 24 h : 491 811,15 $ pour 8 206 transactions
Liquidité on-chain : 242 244,54 $
Nombre total de détenteurs : 2 560
Avec une base de détenteurs relativement restreinte et une liquidité plus faible par rapport à sa capitalisation boursière, les pics de volume peuvent entraîner de fortes variations de prix. Les traders surveilleront si FOLKS parvient à franchir nettement la résistance des 2,31 $ ou s’il reteste la zone de la MA(7), à 2,24 $, comme nouveau support. Gérez toujours votre risque et faites vos propres recherches avant d’effectuer des transactions.
#FOLKS #FolksFinance #DeFi #CryptoAnalysis #Altcoins
$FOLKS
Folks Finance (FOLKS) affiche un regain de dynamique haussière et s’échange actuellement à 2,29545 $, après avoir progressé de 4,94 % au cours des dernières 24 heures.
Sur le graphique horaire, le jeton a rebondi nettement depuis son plus bas sur 24 h, à 2,12563 $, et a bondi pour tester son plus haut sur 24 h, à 2,30951 $. Le cours a franchi de manière décisive toutes les principales moyennes mobiles — se maintenant confortablement au-dessus de la MA(7), à 2,23981 $, de la MA(25), à 2,21539 $, et de la MA(99), à 2,14596 $ — avec à l’appui un pic notable du volume acheteur.
Principales métriques on-chain et de marché :
Capitalisation boursière : 42,08 M$
Valorisation entièrement diluée (FDV) : 114,81 M$
Volume sur 24 h : 491 811,15 $ pour 8 206 transactions
Liquidité on-chain : 242 244,54 $
Nombre total de détenteurs : 2 560
Avec une base de détenteurs relativement restreinte et une liquidité plus faible par rapport à sa capitalisation boursière, les pics de volume peuvent entraîner de fortes variations de prix. Les traders surveilleront si FOLKS parvient à franchir nettement la résistance des 2,31 $ ou s’il reteste la zone de la MA(7), à 2,24 $, comme nouveau support. Gérez toujours votre risque et faites vos propres recherches avant d’effectuer des transactions.
#FOLKS #FolksFinance #DeFi #CryptoAnalysis #Altcoins
$FOLKS
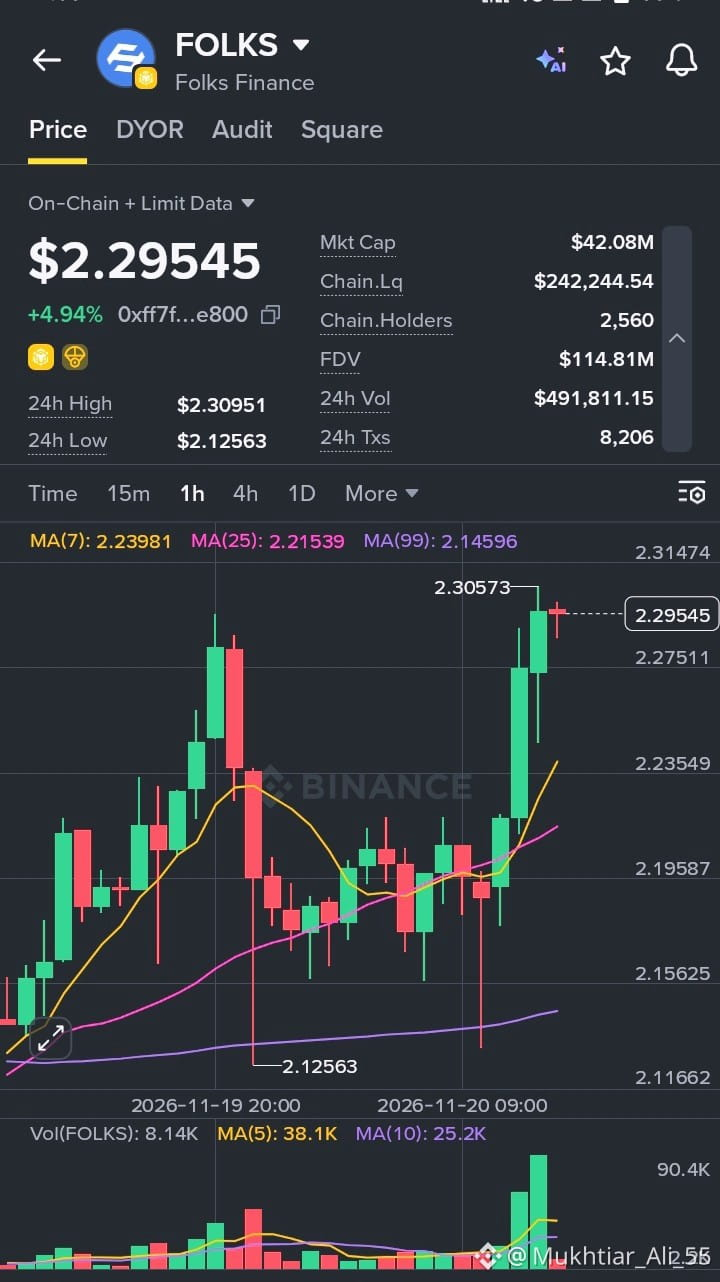
9
Connectez-vous pour découvrir plus de contenu
Rejoignez la communauté mondiale des adeptes de cryptomonnaies sur Binance Square
⚡️ Suviez les dernières informations importantes sur les cryptomonnaies.
💬 Jugé digne de confiance par la plus grande plateforme d’échange de cryptomonnaies au monde.
👍 Découvrez les connaissances que partagent les créateurs vérifiés.
Adresse e-mail/Nº de téléphone
Sujets d’actualité
CanBTCReboundAfterFallingBelow60K?
157,514 vues
687 mentions
Actualités du bitcoin | Le bitcoin passe sous les 60 000 dollars pour la première fois depuis juillet, tandis que l’IBIT enregistre une sortie record de 541 millions de dollars
Binance News
·41 mentions J’aime
·76.5k vues
GlobalStocksFaceLongestLosingStreakSince2023
64,311 vues
609 mentions
AnthropicPlungesTowardIPOPriceonDay2
25,416 vues
269 mentions