🚨
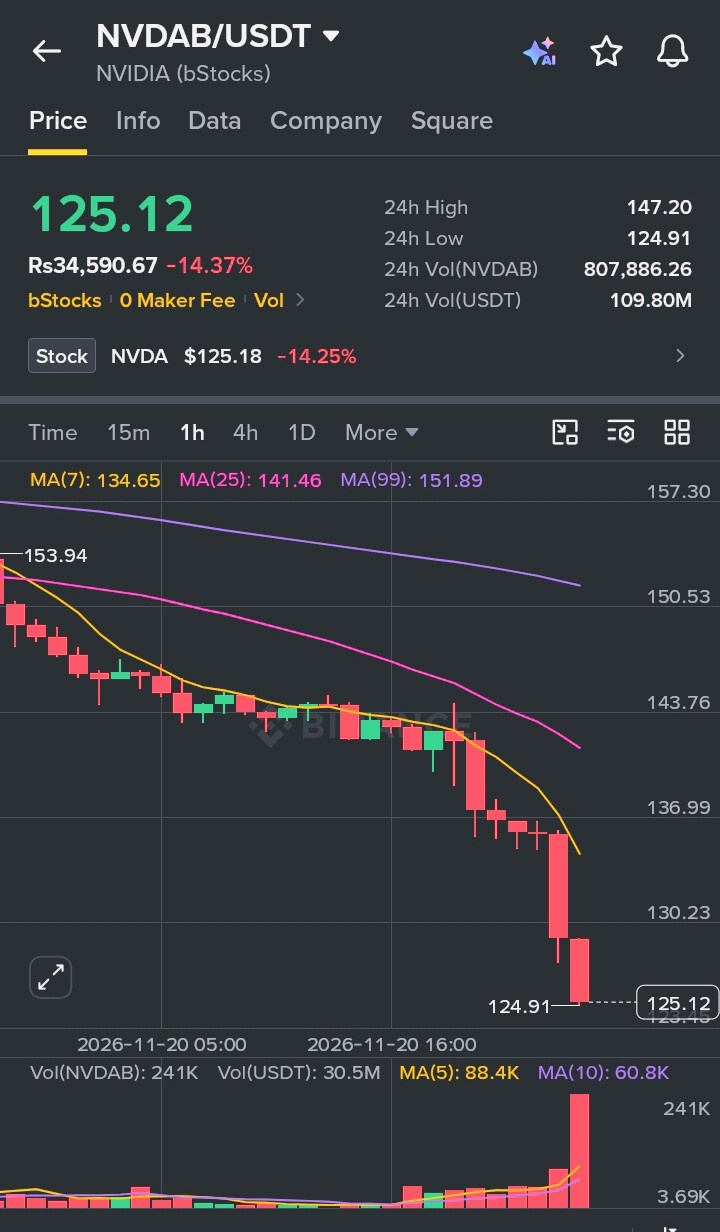
💰 Price: 125.12
📉 24H Change: -14.37%
📊 24H High: 147.20
📉 24H Low: 124.91
💵 24H Volume (USDT): 109.80M
🪙 24H Volume (NVDAB): 807,886.26
📈 NVDA Stock Price: $125.18 (-14.25%)
⚠️ Market Breakdown (1H Timeframe):
NVDAB has been trending lower since the 153.94 area, and the pace of selling picked up sharply near the end 🧨
🔻 A steady series of lower highs and lower lows has defined the move for hours
🔻 A brief consolidation around 140 – 143 failed to hold and gave way to a heavy drop
🔻 Two large bearish candles in a row pushed price straight to the 24H low near 124.91 with almost no bounce 🧲
📉 Moving Averages Tell the Story:
📌 MA(7): 134.65
📌 MA(25): 141.46
📌 MA(99): 151.89
❌ Price is trading below all three major MAs
❌ All of them are sloping downward
❌ The gap between price and the MA(7) is wide, showing how stretched this move is 🐻
📊 Volume Insight:
🔴 Volume surged dramatically on the latest candle, far above the recent average
💥 This points to aggressive selling and possible capitulation-style panic
⚠️ Spikes like this can lead to a sharp bounce or further continuation, so volatility will likely stay high
🧠 What This Means:
This move wasn’t random ❌
A failed consolidation followed by a high-volume drop shows sellers firmly in control, and the tokenized price is tracking the NVDA stock move closely.
🔹 Short-term trend: Bearish
🔹 Momentum: Weak, no confirmed reversal yet
🔹 Market sentiment: Fear-driven 😨
🎯 Key Levels to Watch:
🟢 Support: 123 – 125 zone
🔴 Resistance: 130 – 134.65 zone
📌 A reclaim of 134.65 (MA7) would be the first sign of relief
📌 A clean break below 124.91 could open the door to deeper downside ⬇️
💡 Final Take:
NVDAB is in a high-risk, high-volatility phase where patience beats prediction. Wait for confirmation, keep your position size under control, and always protect your capital with a stop-loss. 🧘🛡️
Discipline will always outlast impulse 💎