

Joshua Brown 007
3k Publications

Joshua Brown 007
Signaler
Bloquer l’utilisateur
I am a forward-thinking crypto advisor with a strong grasp of blockchain innovation and digital asset management. @JavedJatt331726
Ouvert au trading
Trade fréquemment
2.5 an(s)
1.2K+ Suivis
15.7K+ Abonnés
6.5K+ J’aime
Publications
Portefeuille
Tous
Citations
Vidéos
Direct
Je regarde un seul chiffre avant de faire mon prochain mouvement sur le BTC :
🇺🇸 US Jobless Claims
Le marché s’attendait à environ 201K, après la lecture étonnamment basse de la semaine dernière (196K).
Mais voici ce qui compte pour moi :
🔹 Sous 198K → Marché du travail solide
→ Moins de pression pour un assouplissement de la politique de la Fed
→ Peut soutenir le USD/les rendements
→ Les actifs risqués pourraient subir une pression
🔹 Autour de 202K → Près des attentes
→ Réaction immédiate probablement limitée
→ Le BTC pourrait revenir sur des niveaux techniques
🔹 Au-dessus de 210K → Refroidissement du marché du travail plus clair
→ Plus d’attention sur la politique future de la Fed
→ Peut soutenir les actifs sensibles aux taux, y compris la crypto
Le tableau d’ensemble est intéressant.
Reuters a rapporté que la récente lecture à 196K aurait pu être faussée par la volatilité saisonnière liée au Labor Day, tandis que le marché du travail sous-jacent restait relativement stable.
Et voici un autre avertissement important : les demandes d’allocations chômage mesurent principalement les licenciements, pas les embauches. Donc un chiffre bas, à lui seul, ne prouve pas que l’ensemble du marché du travail se renforce.
Pour le BTC, je ne trade pas uniquement le titre.
Je vais surveiller :
Claims → DXY → rendements des Treasury → attentes de la Fed → liquidité du BTC
Cette réaction en chaîne compte davantage qu’un seul chiffre économique.
Pas de long à l’aveugle.
Pas de short à l’aveugle.
Laissez les données arriver d’abord, puis observez comment le prix réagit.
#USGovernment
{future}(BTCUSDT)
{future}(BNBUSDT)
{future}(XRPUSDT)
Je regarde un seul chiffre avant de faire mon prochain mouvement sur le BTC :
🇺🇸 US Jobless Claims
Le marché s’attendait à environ 201K, après la lecture étonnamment basse de la semaine dernière (196K).
Mais voici ce qui compte pour moi :
🔹 Sous 198K → Marché du travail solide
→ Moins de pression pour un assouplissement de la politique de la Fed
→ Peut soutenir le USD/les rendements
→ Les actifs risqués pourraient subir une pression
🔹 Autour de 202K → Près des attentes
→ Réaction immédiate probablement limitée
→ Le BTC pourrait revenir sur des niveaux techniques
🔹 Au-dessus de 210K → Refroidissement du marché du travail plus clair
→ Plus d’attention sur la politique future de la Fed
→ Peut soutenir les actifs sensibles aux taux, y compris la crypto
Le tableau d’ensemble est intéressant.
Reuters a rapporté que la récente lecture à 196K aurait pu être faussée par la volatilité saisonnière liée au Labor Day, tandis que le marché du travail sous-jacent restait relativement stable.
Et voici un autre avertissement important : les demandes d’allocations chômage mesurent principalement les licenciements, pas les embauches. Donc un chiffre bas, à lui seul, ne prouve pas que l’ensemble du marché du travail se renforce.
Pour le BTC, je ne trade pas uniquement le titre.
Je vais surveiller :
Claims → DXY → rendements des Treasury → attentes de la Fed → liquidité du BTC
Cette réaction en chaîne compte davantage qu’un seul chiffre économique.
Pas de long à l’aveugle.
Pas de short à l’aveugle.
Laissez les données arriver d’abord, puis observez comment le prix réagit.
#USGovernment
🇺🇸 US Jobless Claims
Le marché s’attendait à environ 201K, après la lecture étonnamment basse de la semaine dernière (196K).
Mais voici ce qui compte pour moi :
🔹 Sous 198K → Marché du travail solide
→ Moins de pression pour un assouplissement de la politique de la Fed
→ Peut soutenir le USD/les rendements
→ Les actifs risqués pourraient subir une pression
🔹 Autour de 202K → Près des attentes
→ Réaction immédiate probablement limitée
→ Le BTC pourrait revenir sur des niveaux techniques
🔹 Au-dessus de 210K → Refroidissement du marché du travail plus clair
→ Plus d’attention sur la politique future de la Fed
→ Peut soutenir les actifs sensibles aux taux, y compris la crypto
Le tableau d’ensemble est intéressant.
Reuters a rapporté que la récente lecture à 196K aurait pu être faussée par la volatilité saisonnière liée au Labor Day, tandis que le marché du travail sous-jacent restait relativement stable.
Et voici un autre avertissement important : les demandes d’allocations chômage mesurent principalement les licenciements, pas les embauches. Donc un chiffre bas, à lui seul, ne prouve pas que l’ensemble du marché du travail se renforce.
Pour le BTC, je ne trade pas uniquement le titre.
Je vais surveiller :
Claims → DXY → rendements des Treasury → attentes de la Fed → liquidité du BTC
Cette réaction en chaîne compte davantage qu’un seul chiffre économique.
Pas de long à l’aveugle.
Pas de short à l’aveugle.
Laissez les données arriver d’abord, puis observez comment le prix réagit.
#USGovernment
113
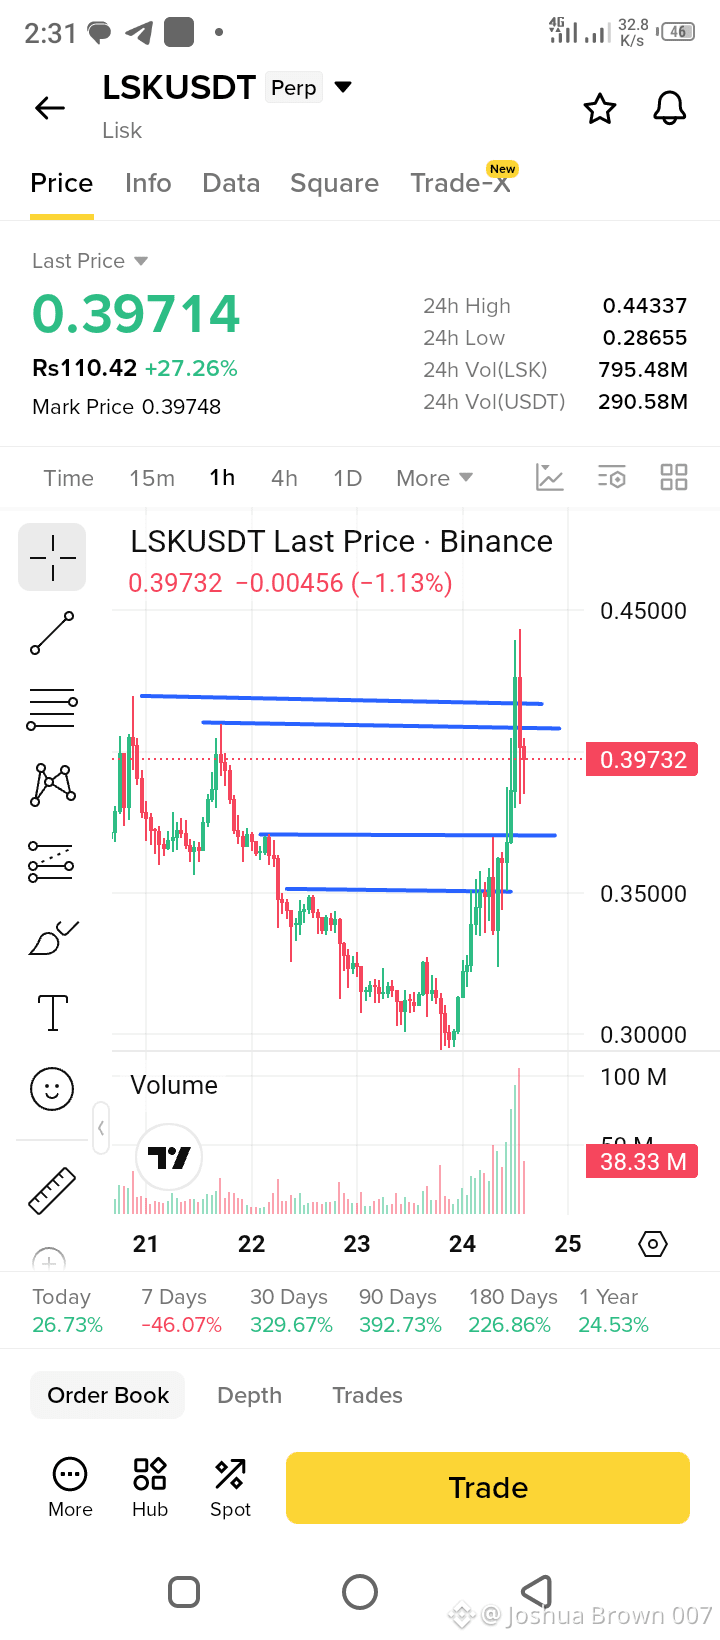
Trading sur 30 j de 10.7K USDT en $LSK
#Trade Short cuir chevelu $LSK
Entrée 0.3930 - 0.4000
SL 0.4150
TP 0.3700 FVG 1H
TP 0.3500 zone de forte demande
Conditions d’invalidation :
La clôture de la bougie 1H au-dessus de 0.4200 invalide complètement la thèse micro baissière.
$LSK
{future}(LSKUSDT)
#Trade Short cuir chevelu $LSK
Entrée 0.3930 - 0.4000
SL 0.4150
TP 0.3700 FVG 1H
TP 0.3500 zone de forte demande
Conditions d’invalidation :
La clôture de la bougie 1H au-dessus de 0.4200 invalide complètement la thèse micro baissière.
$LSK
Entrée 0.3930 - 0.4000
SL 0.4150
TP 0.3700 FVG 1H
TP 0.3500 zone de forte demande
Conditions d’invalidation :
La clôture de la bougie 1H au-dessus de 0.4200 invalide complètement la thèse micro baissière.
$LSK
190
·
--
Haussier
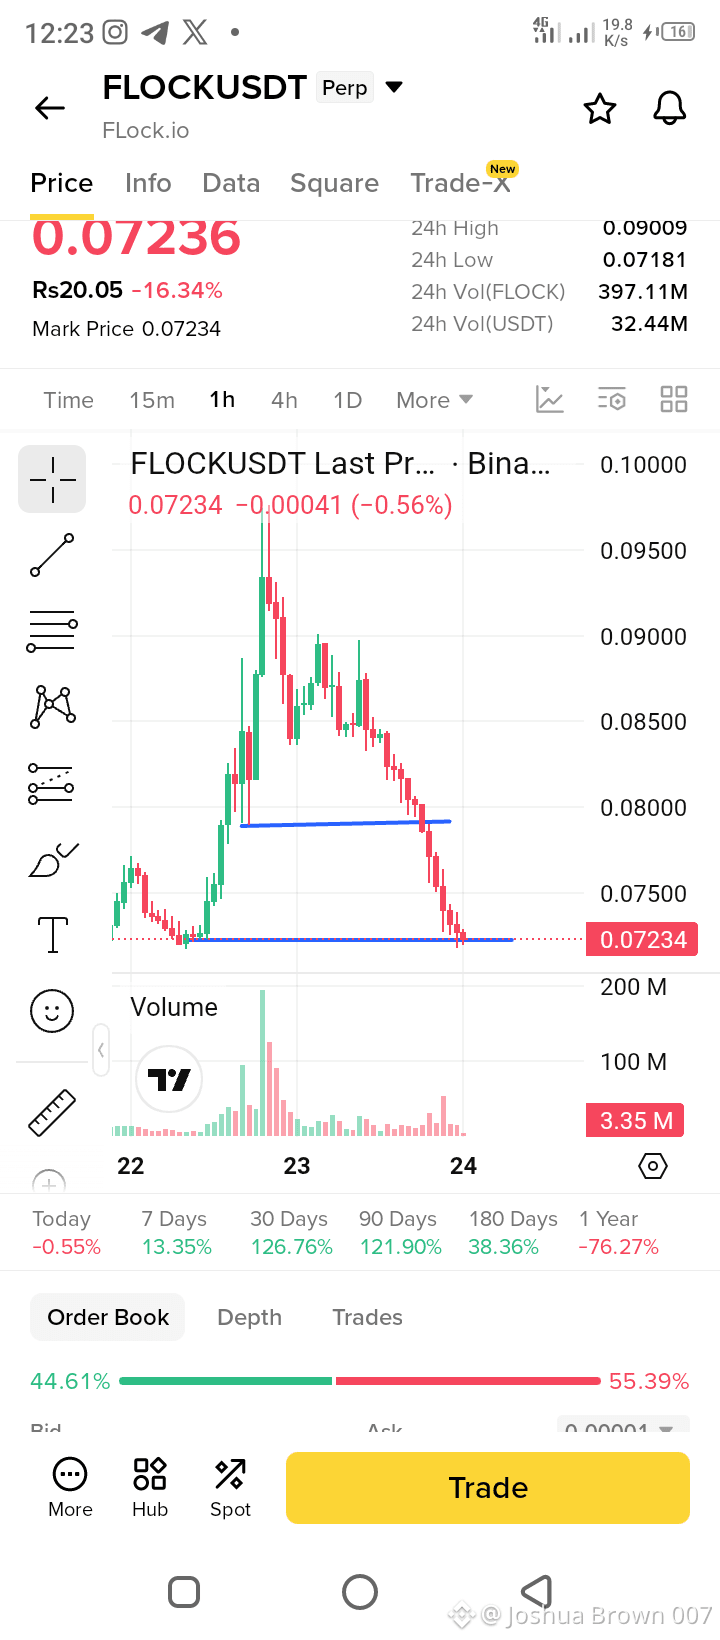
Trading sur 30 j de 7K USDT en $FLOCK
#Trade $FLOCK LONG Configuration
Limite d’entrée 0.0715 - 0.0725
SL 0.0690
TP 0.07482
TP 0.08050
Conditions d’invalidation :
Clôture d’une bougie 1H sous 0.0690 invalide la thèse de rebond immédiat.
pic soudain du volume de vente qui casse le support 0.0650.
Si le prix passe sous 0.0690 avec un volume élevé, entrer en position short lors du retest de 0.0710, avec pour objectif 0.0650. SL à 0.0730.
$TAKE $CAP
{future}(FLOCKUSDT)
{future}(TAKEUSDT)
{future}(CAPUSDT)
#Trade $FLOCK LONG Configuration
Limite d’entrée 0.0715 - 0.0725
SL 0.0690
TP 0.07482
TP 0.08050
Conditions d’invalidation :
Clôture d’une bougie 1H sous 0.0690 invalide la thèse de rebond immédiat.
pic soudain du volume de vente qui casse le support 0.0650.
Si le prix passe sous 0.0690 avec un volume élevé, entrer en position short lors du retest de 0.0710, avec pour objectif 0.0650. SL à 0.0730.
$TAKE $CAP
Limite d’entrée 0.0715 - 0.0725
SL 0.0690
TP 0.07482
TP 0.08050
Conditions d’invalidation :
Clôture d’une bougie 1H sous 0.0690 invalide la thèse de rebond immédiat.
pic soudain du volume de vente qui casse le support 0.0650.
Si le prix passe sous 0.0690 avec un volume élevé, entrer en position short lors du retest de 0.0710, avec pour objectif 0.0650. SL à 0.0730.
$TAKE $CAP
539
Article
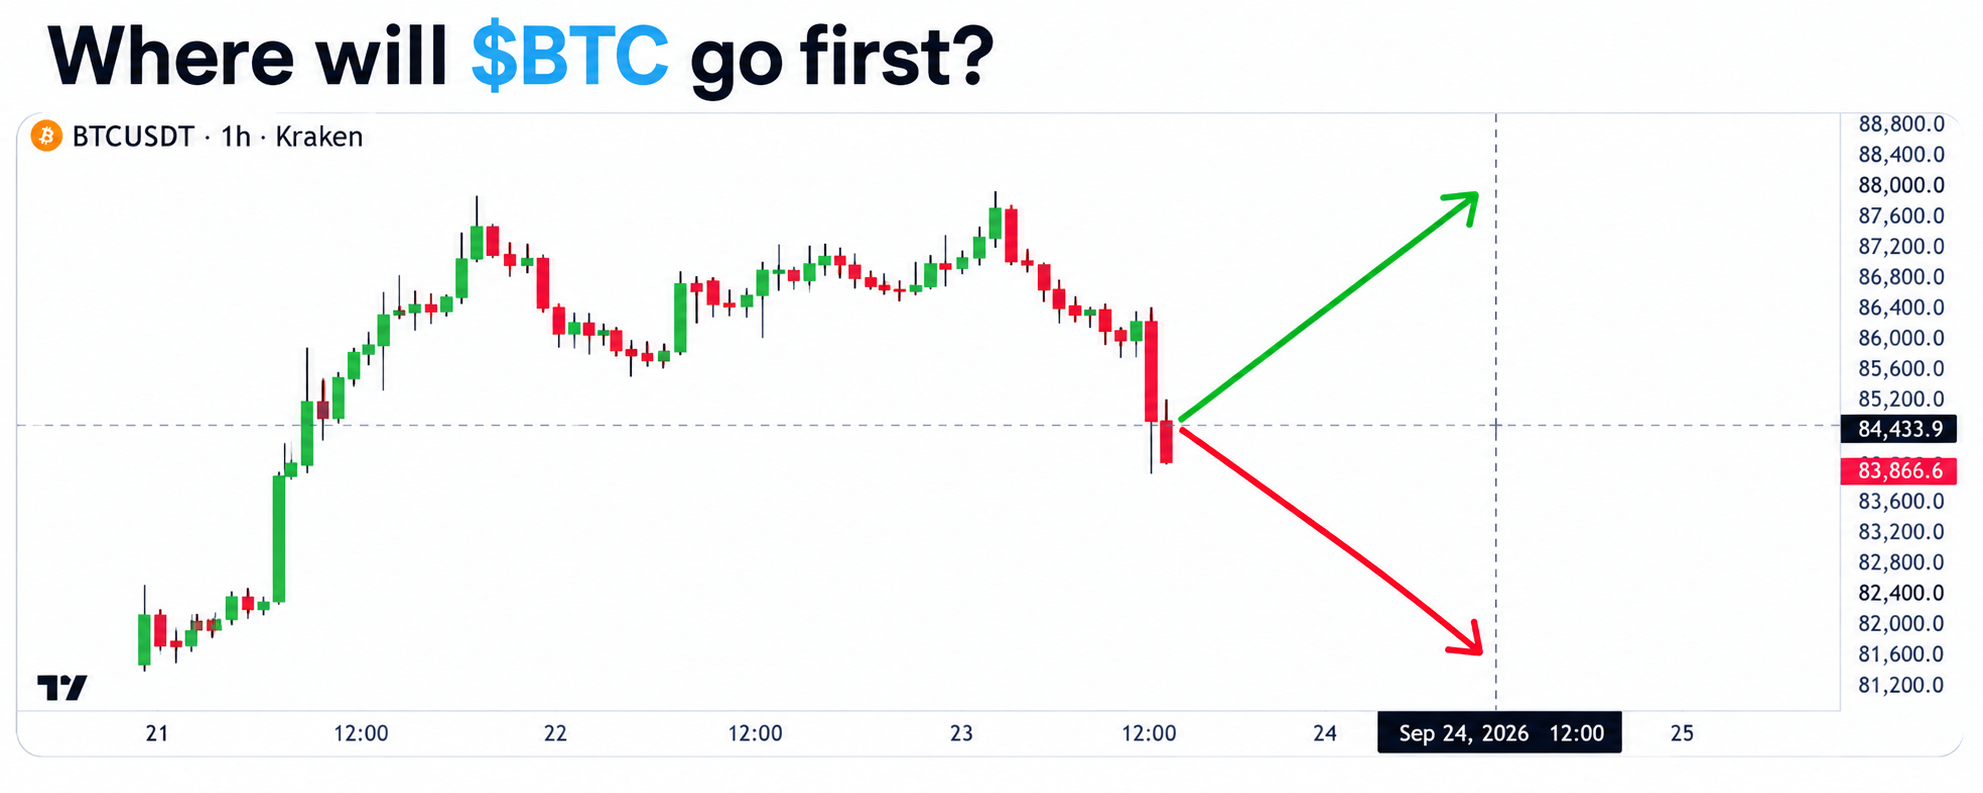
Où le $BTC ira-t-il d’abord : vers le haut ou vers le bas ?Je reviens sans cesse à ce graphique et une question ressort :
Le Bitcoin va-t-il d’abord absorber la liquidité au-dessus, ou balayer d’abord la baisse avant le prochain mouvement ?
Le graphique montre la zone de décision clé autour de 84,4 K$, avec environ 87,6 K$ à la hausse et 81,6 K$ à la baisse.
Mais il y a une mise à jour importante : le BTC a déjà poussé dans la zone des 87 K$ aujourd’hui, donc ce graphique doit être traité comme une capture de la configuration précédente, et non comme la structure actuelle en temps réel. Le dernier tableau de bord de CryptoQuant affichait un BTC autour de 87,36 K$ et son indicateur Bull/Bear était passé en positif à +0,27.
Où le $BTC ira-t-il d’abord : vers le haut ou vers le bas ?
Je reviens sans cesse à ce graphique et une question ressort :
Le Bitcoin va-t-il d’abord absorber la liquidité au-dessus, ou balayer d’abord la baisse avant le prochain mouvement ?
Le graphique montre la zone de décision clé autour de 84,4 K$, avec environ 87,6 K$ à la hausse et 81,6 K$ à la baisse.
Mais il y a une mise à jour importante : le BTC a déjà poussé dans la zone des 87 K$ aujourd’hui, donc ce graphique doit être traité comme une capture de la configuration précédente, et non comme la structure actuelle en temps réel. Le dernier tableau de bord de CryptoQuant affichait un BTC autour de 87,36 K$ et son indicateur Bull/Bear était passé en positif à +0,27.
Le Bitcoin va-t-il d’abord absorber la liquidité au-dessus, ou balayer d’abord la baisse avant le prochain mouvement ?
Le graphique montre la zone de décision clé autour de 84,4 K$, avec environ 87,6 K$ à la hausse et 81,6 K$ à la baisse.
Mais il y a une mise à jour importante : le BTC a déjà poussé dans la zone des 87 K$ aujourd’hui, donc ce graphique doit être traité comme une capture de la configuration précédente, et non comme la structure actuelle en temps réel. Le dernier tableau de bord de CryptoQuant affichait un BTC autour de 87,36 K$ et son indicateur Bull/Bear était passé en positif à +0,27.
1
4
8.3k
#zec
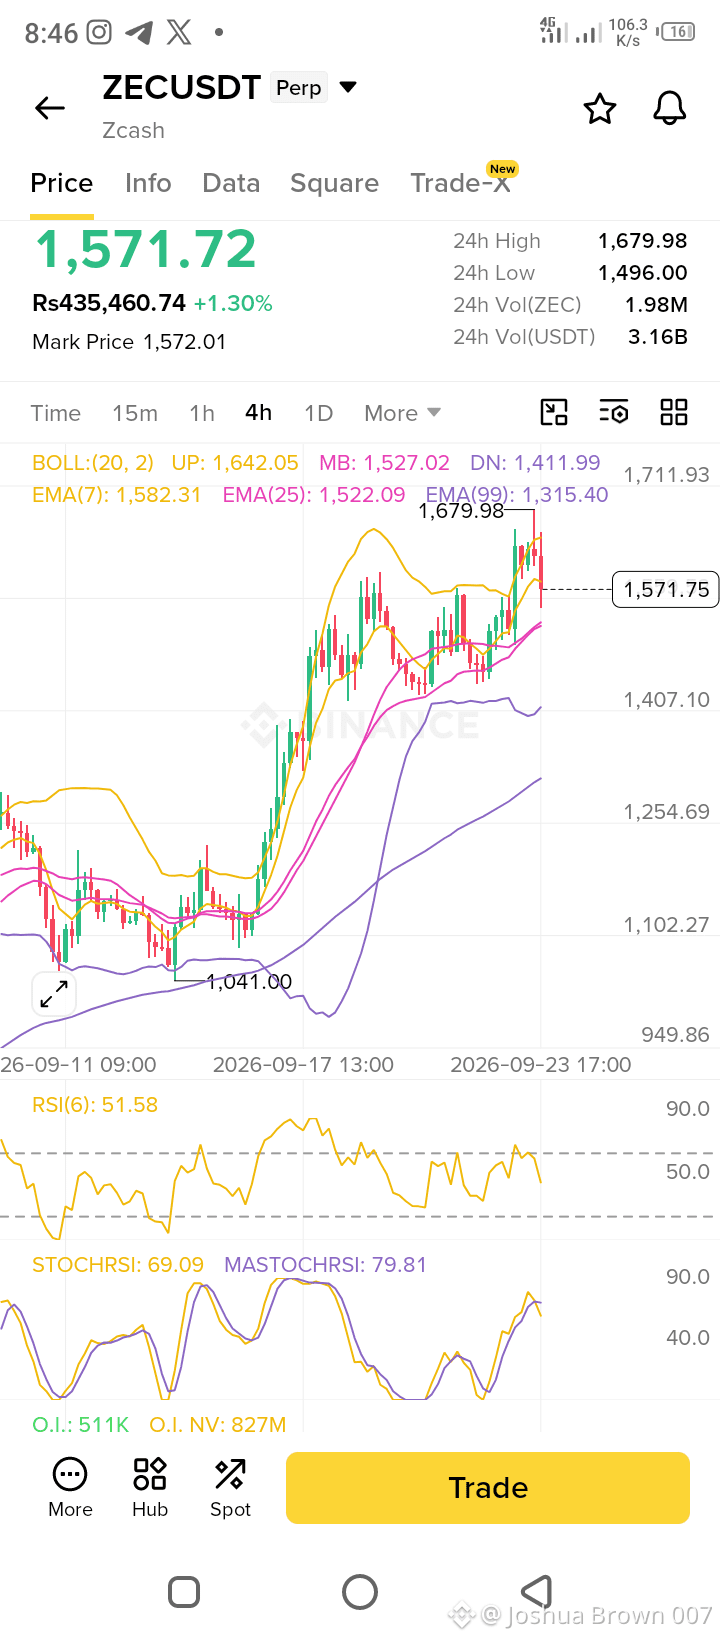
ATTENDEZ UN RETOUR À LA BAISSE ET PASSEZ À L’ACHAT (LONG).
$ZEC USDT est dans une tendance haussière puissante, mais subit actuellement une correction nécessaire à court terme. Les indicateurs se sont nettement refroidis et le prix teste l’EMA (25).
Ne FOMO pas sur le prix actuel (1 571).
Entrée Long 1 520 - 1 540
SL 1 480
TP 1 645
TP 1 780
Horizon de temps prévu 08 h - 1 Jour
Conditions d’invalidation :
Si la clôture de la bougie 4H passe sous 1 315 (EMA 99), cela invalide complètement la thèse haussière macro.
{future}(ZECUSDT)
$TAO
{future}(TAOUSDT)
$ZEN
{future}(ZENUSDT)
#zec
ATTENDEZ UN RETOUR À LA BAISSE ET PASSEZ À L’ACHAT (LONG).
$ZEC USDT est dans une tendance haussière puissante, mais subit actuellement une correction nécessaire à court terme. Les indicateurs se sont nettement refroidis et le prix teste l’EMA (25).
Ne FOMO pas sur le prix actuel (1 571).
Entrée Long 1 520 - 1 540
SL 1 480
TP 1 645
TP 1 780
Horizon de temps prévu 08 h - 1 Jour
Conditions d’invalidation :
Si la clôture de la bougie 4H passe sous 1 315 (EMA 99), cela invalide complètement la thèse haussière macro.
$TAO
$ZEN
ATTENDEZ UN RETOUR À LA BAISSE ET PASSEZ À L’ACHAT (LONG).
$ZEC USDT est dans une tendance haussière puissante, mais subit actuellement une correction nécessaire à court terme. Les indicateurs se sont nettement refroidis et le prix teste l’EMA (25).
Ne FOMO pas sur le prix actuel (1 571).
Entrée Long 1 520 - 1 540
SL 1 480
TP 1 645
TP 1 780
Horizon de temps prévu 08 h - 1 Jour
Conditions d’invalidation :
Si la clôture de la bougie 4H passe sous 1 315 (EMA 99), cela invalide complètement la thèse haussière macro.
$TAO
$ZEN
421
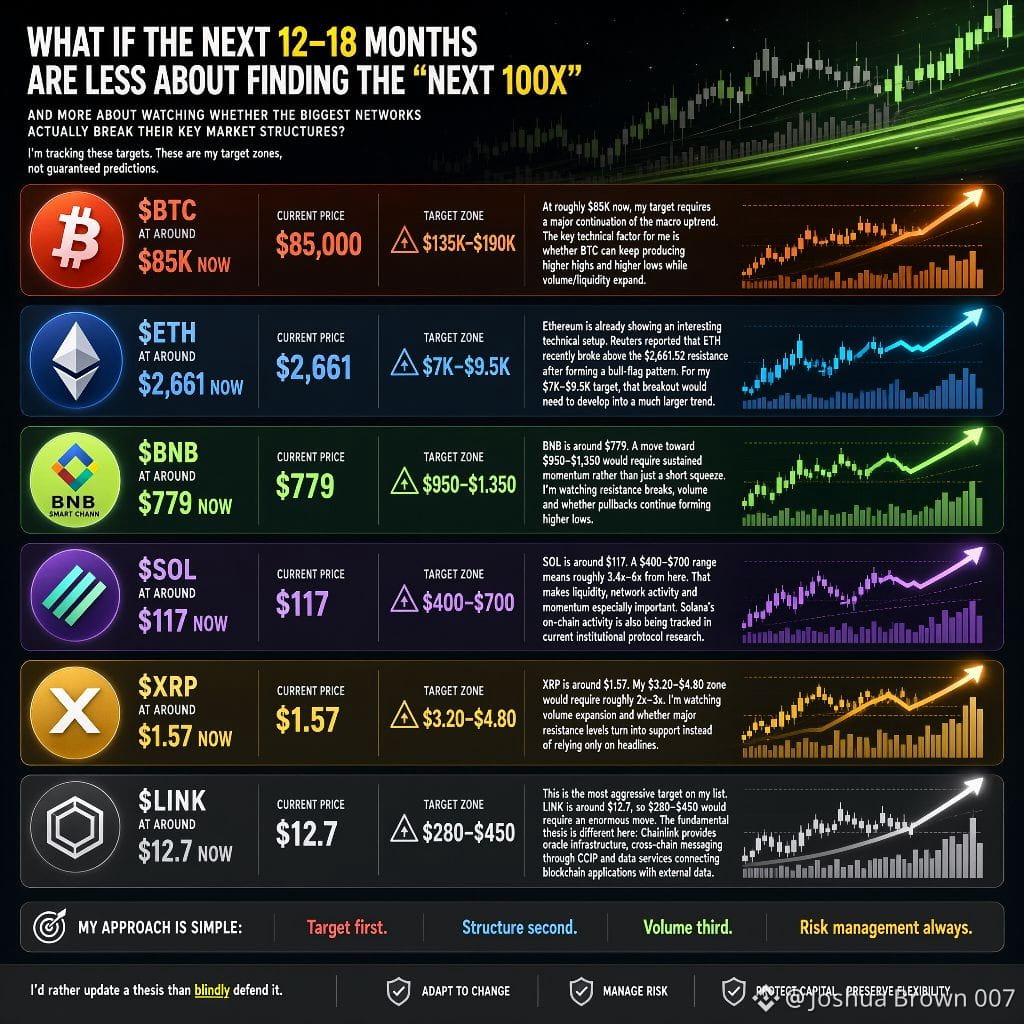
Et si les 12 à 18 prochains mois étaient moins une question de trouver le « prochain 100x » et davantage de surveiller si les plus grands réseaux parviennent réellement à rompre leurs structures clés de marché ?
Je suis ces objectifs :
$BTC → 135K$–190K$
$ETH → 7K$–9,5K$
$BNB → 950$–1 350$
$SOL → 400$–700$
$XRP → 3,20$–4,80$
$LINK → 280$–450$
Voici mes zones cibles, pas des prédictions garanties.
🔹 $BTC
À environ 85K$ à l’heure actuelle, mon objectif exige une poursuite majeure de la tendance macro. Le facteur technique clé pour moi est de savoir si le BTC peut continuer à former des plus hauts et des plus bas plus élevés, tout en voyant le volume/liquidité augmenter.
🔹 $ETH
L’Ethereum montre déjà une configuration technique intéressante. Reuters a rapporté qu’ETH a récemment franchi la résistance des 2 661,52 $ après avoir formé une figure en drapeau haussier.
Pour mon objectif de 7K$–9,5K$, cette cassure devrait se transformer en une tendance beaucoup plus large.
🔹 $BNB
BNB est autour de 779. Un mouvement vers 950$–1 350$ exigerait une dynamique durable plutôt qu’une simple squeeze courte. Je surveille les cassures de résistance, le volume et la question de savoir si les replis continuent de former des plus bas plus élevés.
🔹 $SOL
SOL est autour de 117. Une fourchette de 400$–700$ représente environ 3,4x–6x à partir d’ici.
Cela rend la liquidité, l’activité du réseau et l’élan particulièrement importants. L’activité on-chain de Solana est aussi suivie dans les recherches actuelles menées par des protocoles institutionnels.
🔹 $XRP
XRP est autour de 1,57. Ma zone 3,20$–4,80$ nécessiterait environ 2x–3x. Je surveille l’expansion du volume et si les principaux niveaux de résistance se transforment en supports plutôt que de compter uniquement sur les gros titres.
Mon approche est simple :
Objectif d’abord.
Structure ensuite.
Volume en troisième.
Gestion du risque toujours.
Si la structure du marché change, mes objectifs peuvent aussi changer.
Je préfère mettre à jour une thèse plutôt que de la défendre aveuglément.
{spot}(BTCUSDT)
{spot}(ETHUSDT)
{spot}(BNBUSDT)
Et si les 12 à 18 prochains mois étaient moins une question de trouver le « prochain 100x » et davantage de surveiller si les plus grands réseaux parviennent réellement à rompre leurs structures clés de marché ?
Je suis ces objectifs :
$BTC → 135K$–190K$
$ETH → 7K$–9,5K$
$BNB → 950$–1 350$
$SOL → 400$–700$
$XRP → 3,20$–4,80$
$LINK → 280$–450$
Voici mes zones cibles, pas des prédictions garanties.
🔹 $BTC
À environ 85K$ à l’heure actuelle, mon objectif exige une poursuite majeure de la tendance macro. Le facteur technique clé pour moi est de savoir si le BTC peut continuer à former des plus hauts et des plus bas plus élevés, tout en voyant le volume/liquidité augmenter.
🔹 $ETH
L’Ethereum montre déjà une configuration technique intéressante. Reuters a rapporté qu’ETH a récemment franchi la résistance des 2 661,52 $ après avoir formé une figure en drapeau haussier.
Pour mon objectif de 7K$–9,5K$, cette cassure devrait se transformer en une tendance beaucoup plus large.
🔹 $BNB
BNB est autour de 779. Un mouvement vers 950$–1 350$ exigerait une dynamique durable plutôt qu’une simple squeeze courte. Je surveille les cassures de résistance, le volume et la question de savoir si les replis continuent de former des plus bas plus élevés.
🔹 $SOL
SOL est autour de 117. Une fourchette de 400$–700$ représente environ 3,4x–6x à partir d’ici.
Cela rend la liquidité, l’activité du réseau et l’élan particulièrement importants. L’activité on-chain de Solana est aussi suivie dans les recherches actuelles menées par des protocoles institutionnels.
🔹 $XRP
XRP est autour de 1,57. Ma zone 3,20$–4,80$ nécessiterait environ 2x–3x. Je surveille l’expansion du volume et si les principaux niveaux de résistance se transforment en supports plutôt que de compter uniquement sur les gros titres.
Mon approche est simple :
Objectif d’abord.
Structure ensuite.
Volume en troisième.
Gestion du risque toujours.
Si la structure du marché change, mes objectifs peuvent aussi changer.
Je préfère mettre à jour une thèse plutôt que de la défendre aveuglément.
Je suis ces objectifs :
$BTC → 135K$–190K$
$ETH → 7K$–9,5K$
$BNB → 950$–1 350$
$SOL → 400$–700$
$XRP → 3,20$–4,80$
$LINK → 280$–450$
Voici mes zones cibles, pas des prédictions garanties.
🔹 $BTC
À environ 85K$ à l’heure actuelle, mon objectif exige une poursuite majeure de la tendance macro. Le facteur technique clé pour moi est de savoir si le BTC peut continuer à former des plus hauts et des plus bas plus élevés, tout en voyant le volume/liquidité augmenter.
🔹 $ETH
L’Ethereum montre déjà une configuration technique intéressante. Reuters a rapporté qu’ETH a récemment franchi la résistance des 2 661,52 $ après avoir formé une figure en drapeau haussier.
Pour mon objectif de 7K$–9,5K$, cette cassure devrait se transformer en une tendance beaucoup plus large.
🔹 $BNB
BNB est autour de 779. Un mouvement vers 950$–1 350$ exigerait une dynamique durable plutôt qu’une simple squeeze courte. Je surveille les cassures de résistance, le volume et la question de savoir si les replis continuent de former des plus bas plus élevés.
🔹 $SOL
SOL est autour de 117. Une fourchette de 400$–700$ représente environ 3,4x–6x à partir d’ici.
Cela rend la liquidité, l’activité du réseau et l’élan particulièrement importants. L’activité on-chain de Solana est aussi suivie dans les recherches actuelles menées par des protocoles institutionnels.
🔹 $XRP
XRP est autour de 1,57. Ma zone 3,20$–4,80$ nécessiterait environ 2x–3x. Je surveille l’expansion du volume et si les principaux niveaux de résistance se transforment en supports plutôt que de compter uniquement sur les gros titres.
Mon approche est simple :
Objectif d’abord.
Structure ensuite.
Volume en troisième.
Gestion du risque toujours.
Si la structure du marché change, mes objectifs peuvent aussi changer.
Je préfère mettre à jour une thèse plutôt que de la défendre aveuglément.
200
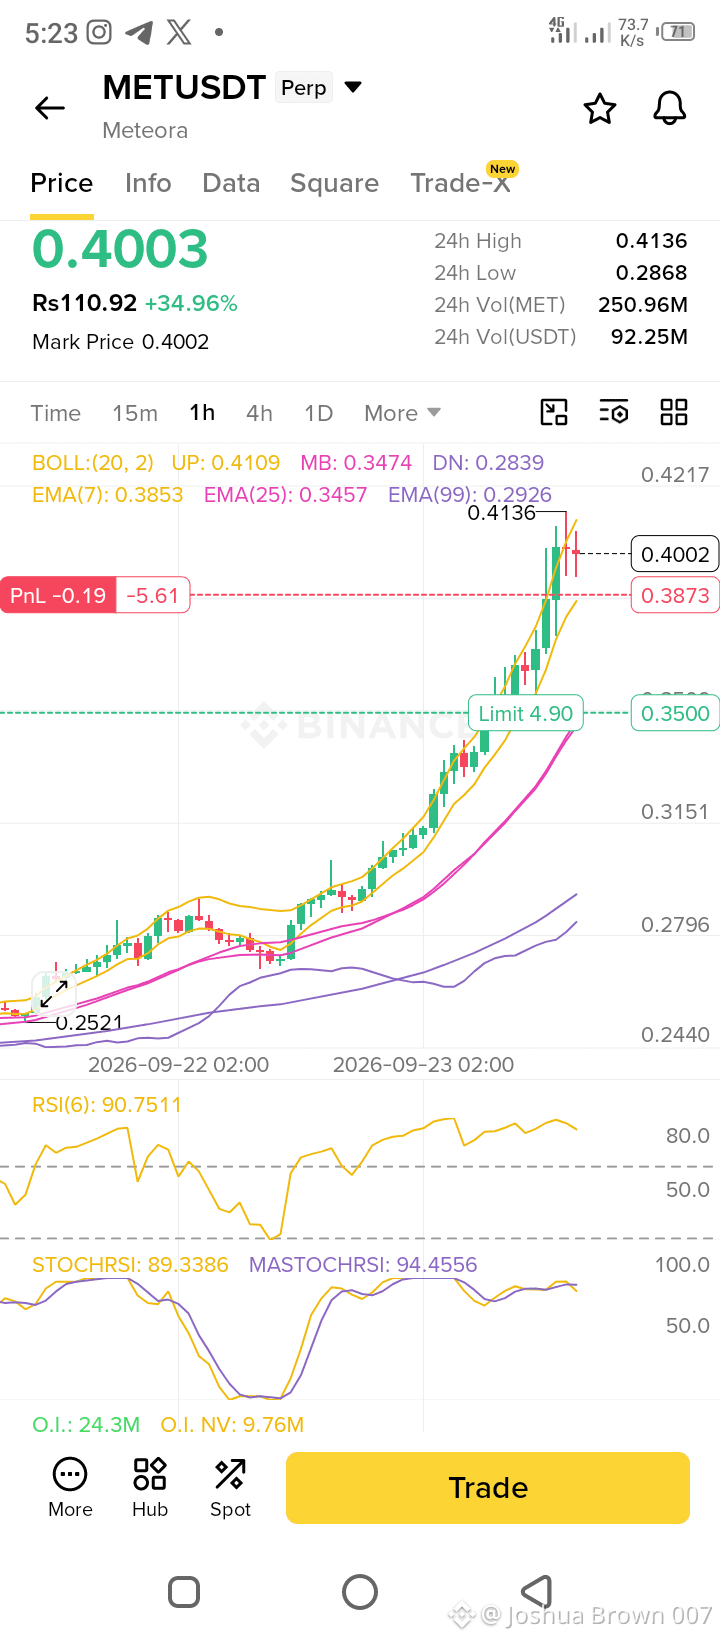
$MET Short Sell
Entrée 0.4000 - 0.4050
SL 0.4150
TP 0.3860 et 0.3490
attention :
Si le prix reconquiert 0.4136 avec un volume élevé et casse 0.4217, entrez en long avec pour objectif 0.450. SL à 0.400.
{future}(METUSDT)
$MET Short Sell
Entrée 0.4000 - 0.4050
SL 0.4150
TP 0.3860 et 0.3490
attention :
Si le prix reconquiert 0.4136 avec un volume élevé et casse 0.4217, entrez en long avec pour objectif 0.450. SL à 0.400.
Entrée 0.4000 - 0.4050
SL 0.4150
TP 0.3860 et 0.3490
attention :
Si le prix reconquiert 0.4136 avec un volume élevé et casse 0.4217, entrez en long avec pour objectif 0.450. SL à 0.400.
154
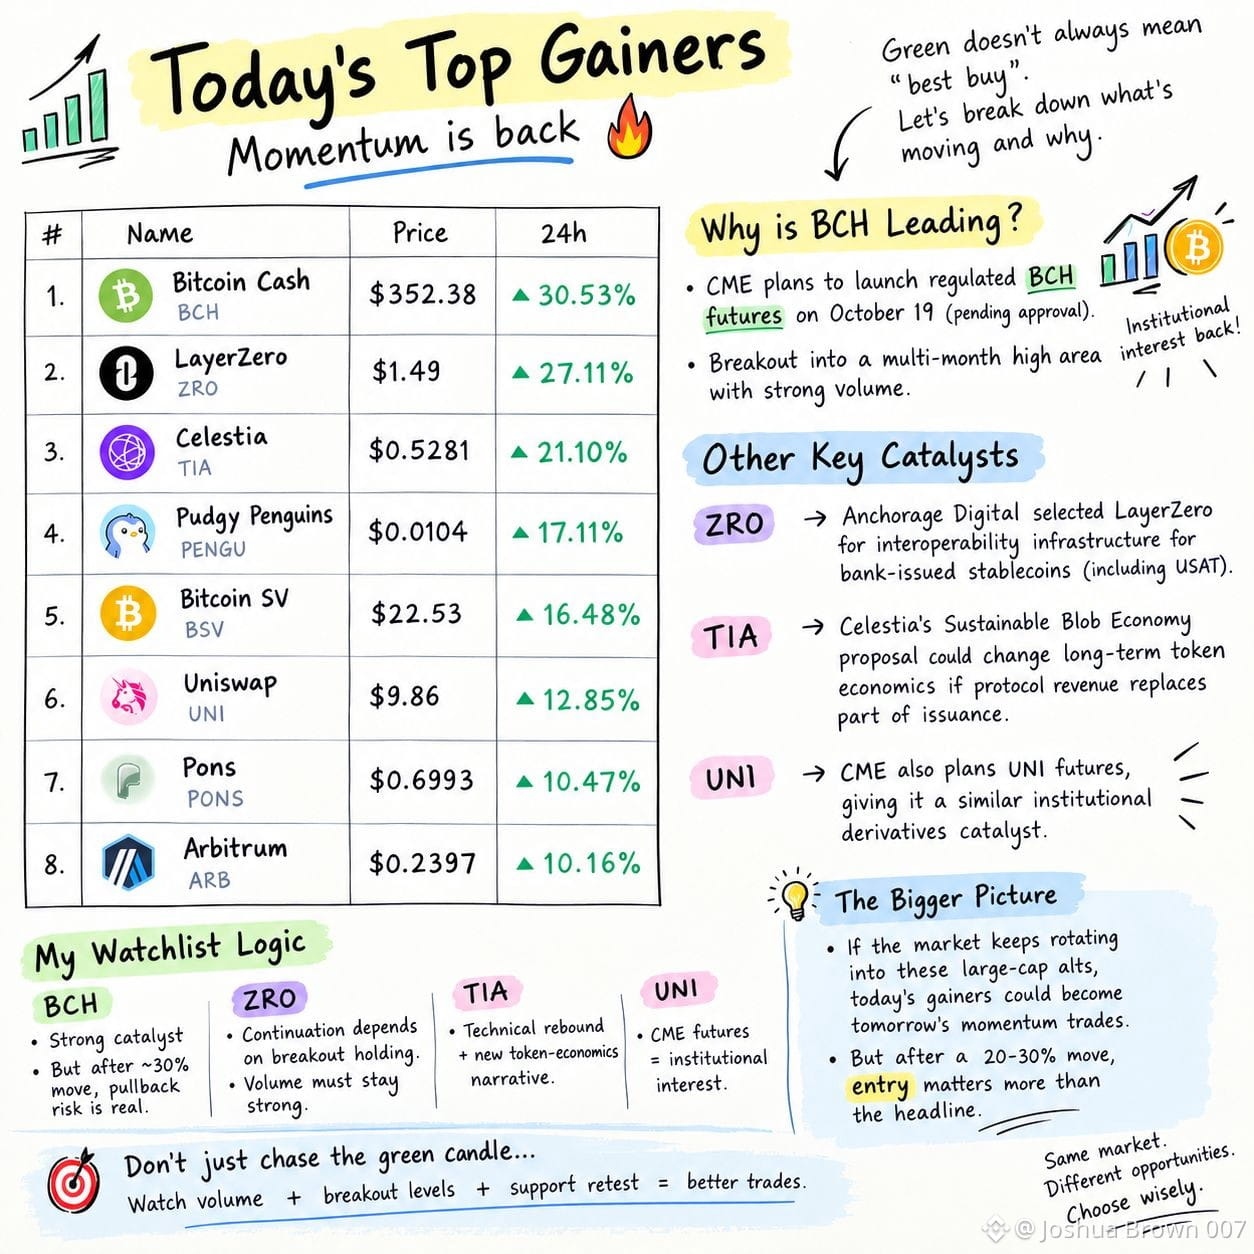
Le momentum des meilleurs gagnants du jour est de retour 🔥
Le classement d’aujourd’hui est intéressant parce que ce n’est pas juste une petite pompe à micro-cap.
$BCH +30.53%
$ZRO +27.11%
$TIA +21.10%
$PENGU +17.11%
$BSV +16.48%
$UNI +12.85%
$PONS +10.47%
$ARB +10.16%
La plus grosse actualité, c’est BCH. Le mouvement est lié aux projets de la CME pour des contrats à terme réglementés sur BCH, prévus pour le 19 octobre, sous réserve d’approbation réglementaire. BCH a également franchi une zone de plus hauts multi-mensuels avec un volume élevé.
Mais voici la partie importante 👇
Une pièce qui a déjà pris +30% n’est pas automatiquement celle qui a le plus de potentiel à la hausse restant.
ZRO a aussi un catalyseur fondamental intéressant : Anchorage Digital a choisi LayerZero pour l’infrastructure d’interopérabilité des stablecoins émis par des banques, y compris la USAT de Tether.
TIA mérite aussi qu’on s’y intéresse, car la nouvelle proposition de Celestia, « Sustainable Blob Economy », pourrait modifier l’économie des tokens à long terme si les revenus du protocole remplacent éventuellement une partie de l’émission.
Ma logique de suivi
BCH : catalyseur le plus solide actuellement, mais après un mouvement quotidien d’environ ~30%, le risque de repli compte.
ZRO : la continuation dépend du fait que la cassure du jour tient et que le volume reste solide.
TIA : combinaison intéressante de rebond technique + nouveau récit sur l’économie des tokens.
UNI : la CME prévoit aussi des futures UNI, ce qui lui donne un catalyseur similaire lié aux dérivés institutionnels.
Donc au lieu de courir aveuglément après la plus grosse bougie verte, je surveille le volume + le niveau de cassure + la reteste de support.
Si le marché continue de tourner vers ces grosses capitalisations (Alts), les gagnants d’aujourd’hui pourraient devenir les trades de momentum de demain, mais après un mouvement de 20–30%, l’entrée compte plus que le titre.
{future}(BCHUSDT)
{future}(ZROUSDT)
{future}(TIAUSDT)
Le momentum des meilleurs gagnants du jour est de retour 🔥
Le classement d’aujourd’hui est intéressant parce que ce n’est pas juste une petite pompe à micro-cap.
$BCH +30.53%
$ZRO +27.11%
$TIA +21.10%
$PENGU +17.11%
$BSV +16.48%
$UNI +12.85%
$PONS +10.47%
$ARB +10.16%
La plus grosse actualité, c’est BCH. Le mouvement est lié aux projets de la CME pour des contrats à terme réglementés sur BCH, prévus pour le 19 octobre, sous réserve d’approbation réglementaire. BCH a également franchi une zone de plus hauts multi-mensuels avec un volume élevé.
Mais voici la partie importante 👇
Une pièce qui a déjà pris +30% n’est pas automatiquement celle qui a le plus de potentiel à la hausse restant.
ZRO a aussi un catalyseur fondamental intéressant : Anchorage Digital a choisi LayerZero pour l’infrastructure d’interopérabilité des stablecoins émis par des banques, y compris la USAT de Tether.
TIA mérite aussi qu’on s’y intéresse, car la nouvelle proposition de Celestia, « Sustainable Blob Economy », pourrait modifier l’économie des tokens à long terme si les revenus du protocole remplacent éventuellement une partie de l’émission.
Ma logique de suivi
BCH : catalyseur le plus solide actuellement, mais après un mouvement quotidien d’environ ~30%, le risque de repli compte.
ZRO : la continuation dépend du fait que la cassure du jour tient et que le volume reste solide.
TIA : combinaison intéressante de rebond technique + nouveau récit sur l’économie des tokens.
UNI : la CME prévoit aussi des futures UNI, ce qui lui donne un catalyseur similaire lié aux dérivés institutionnels.
Donc au lieu de courir aveuglément après la plus grosse bougie verte, je surveille le volume + le niveau de cassure + la reteste de support.
Si le marché continue de tourner vers ces grosses capitalisations (Alts), les gagnants d’aujourd’hui pourraient devenir les trades de momentum de demain, mais après un mouvement de 20–30%, l’entrée compte plus que le titre.
Le classement d’aujourd’hui est intéressant parce que ce n’est pas juste une petite pompe à micro-cap.
$BCH +30.53%
$ZRO +27.11%
$TIA +21.10%
$PENGU +17.11%
$BSV +16.48%
$UNI +12.85%
$PONS +10.47%
$ARB +10.16%
La plus grosse actualité, c’est BCH. Le mouvement est lié aux projets de la CME pour des contrats à terme réglementés sur BCH, prévus pour le 19 octobre, sous réserve d’approbation réglementaire. BCH a également franchi une zone de plus hauts multi-mensuels avec un volume élevé.
Mais voici la partie importante 👇
Une pièce qui a déjà pris +30% n’est pas automatiquement celle qui a le plus de potentiel à la hausse restant.
ZRO a aussi un catalyseur fondamental intéressant : Anchorage Digital a choisi LayerZero pour l’infrastructure d’interopérabilité des stablecoins émis par des banques, y compris la USAT de Tether.
TIA mérite aussi qu’on s’y intéresse, car la nouvelle proposition de Celestia, « Sustainable Blob Economy », pourrait modifier l’économie des tokens à long terme si les revenus du protocole remplacent éventuellement une partie de l’émission.
Ma logique de suivi
BCH : catalyseur le plus solide actuellement, mais après un mouvement quotidien d’environ ~30%, le risque de repli compte.
ZRO : la continuation dépend du fait que la cassure du jour tient et que le volume reste solide.
TIA : combinaison intéressante de rebond technique + nouveau récit sur l’économie des tokens.
UNI : la CME prévoit aussi des futures UNI, ce qui lui donne un catalyseur similaire lié aux dérivés institutionnels.
Donc au lieu de courir aveuglément après la plus grosse bougie verte, je surveille le volume + le niveau de cassure + la reteste de support.
Si le marché continue de tourner vers ces grosses capitalisations (Alts), les gagnants d’aujourd’hui pourraient devenir les trades de momentum de demain, mais après un mouvement de 20–30%, l’entrée compte plus que le titre.
1
303
#AIStocksWhatNext
Le commerce a besoin de calculer le marché + la passion et d’attendre le résultat😎
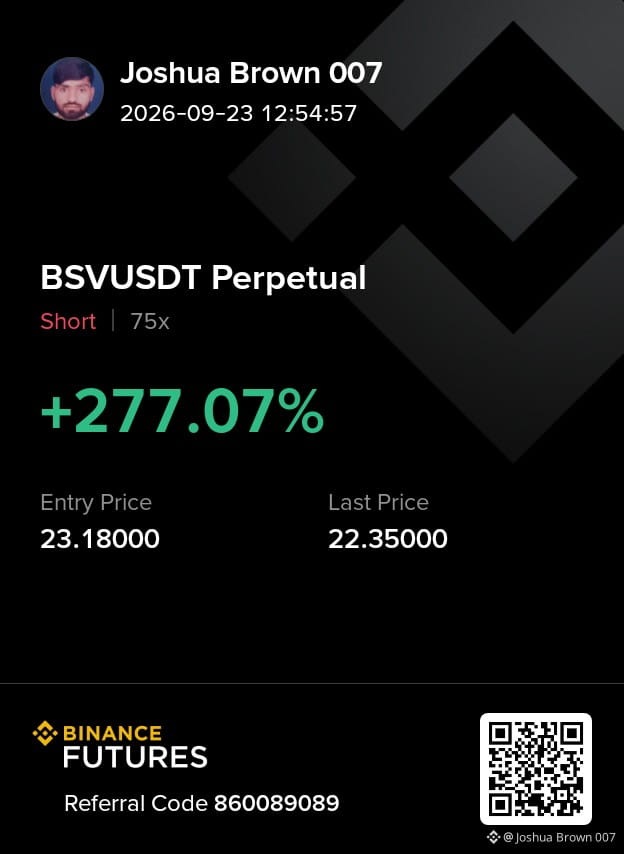
{future}(BSVUSDT)
[https://www.binance.info/en/futures/ref/860089089](https://www.binance.info/en/futures/ref/860089089)
#AIStocksWhatNext
Le commerce a besoin de calculer le marché + la passion et d’attendre le résultat😎
https://www.binance.info/en/futures/ref/860089089
Le commerce a besoin de calculer le marché + la passion et d’attendre le résultat😎
https://www.binance.info/en/futures/ref/860089089
114
Article
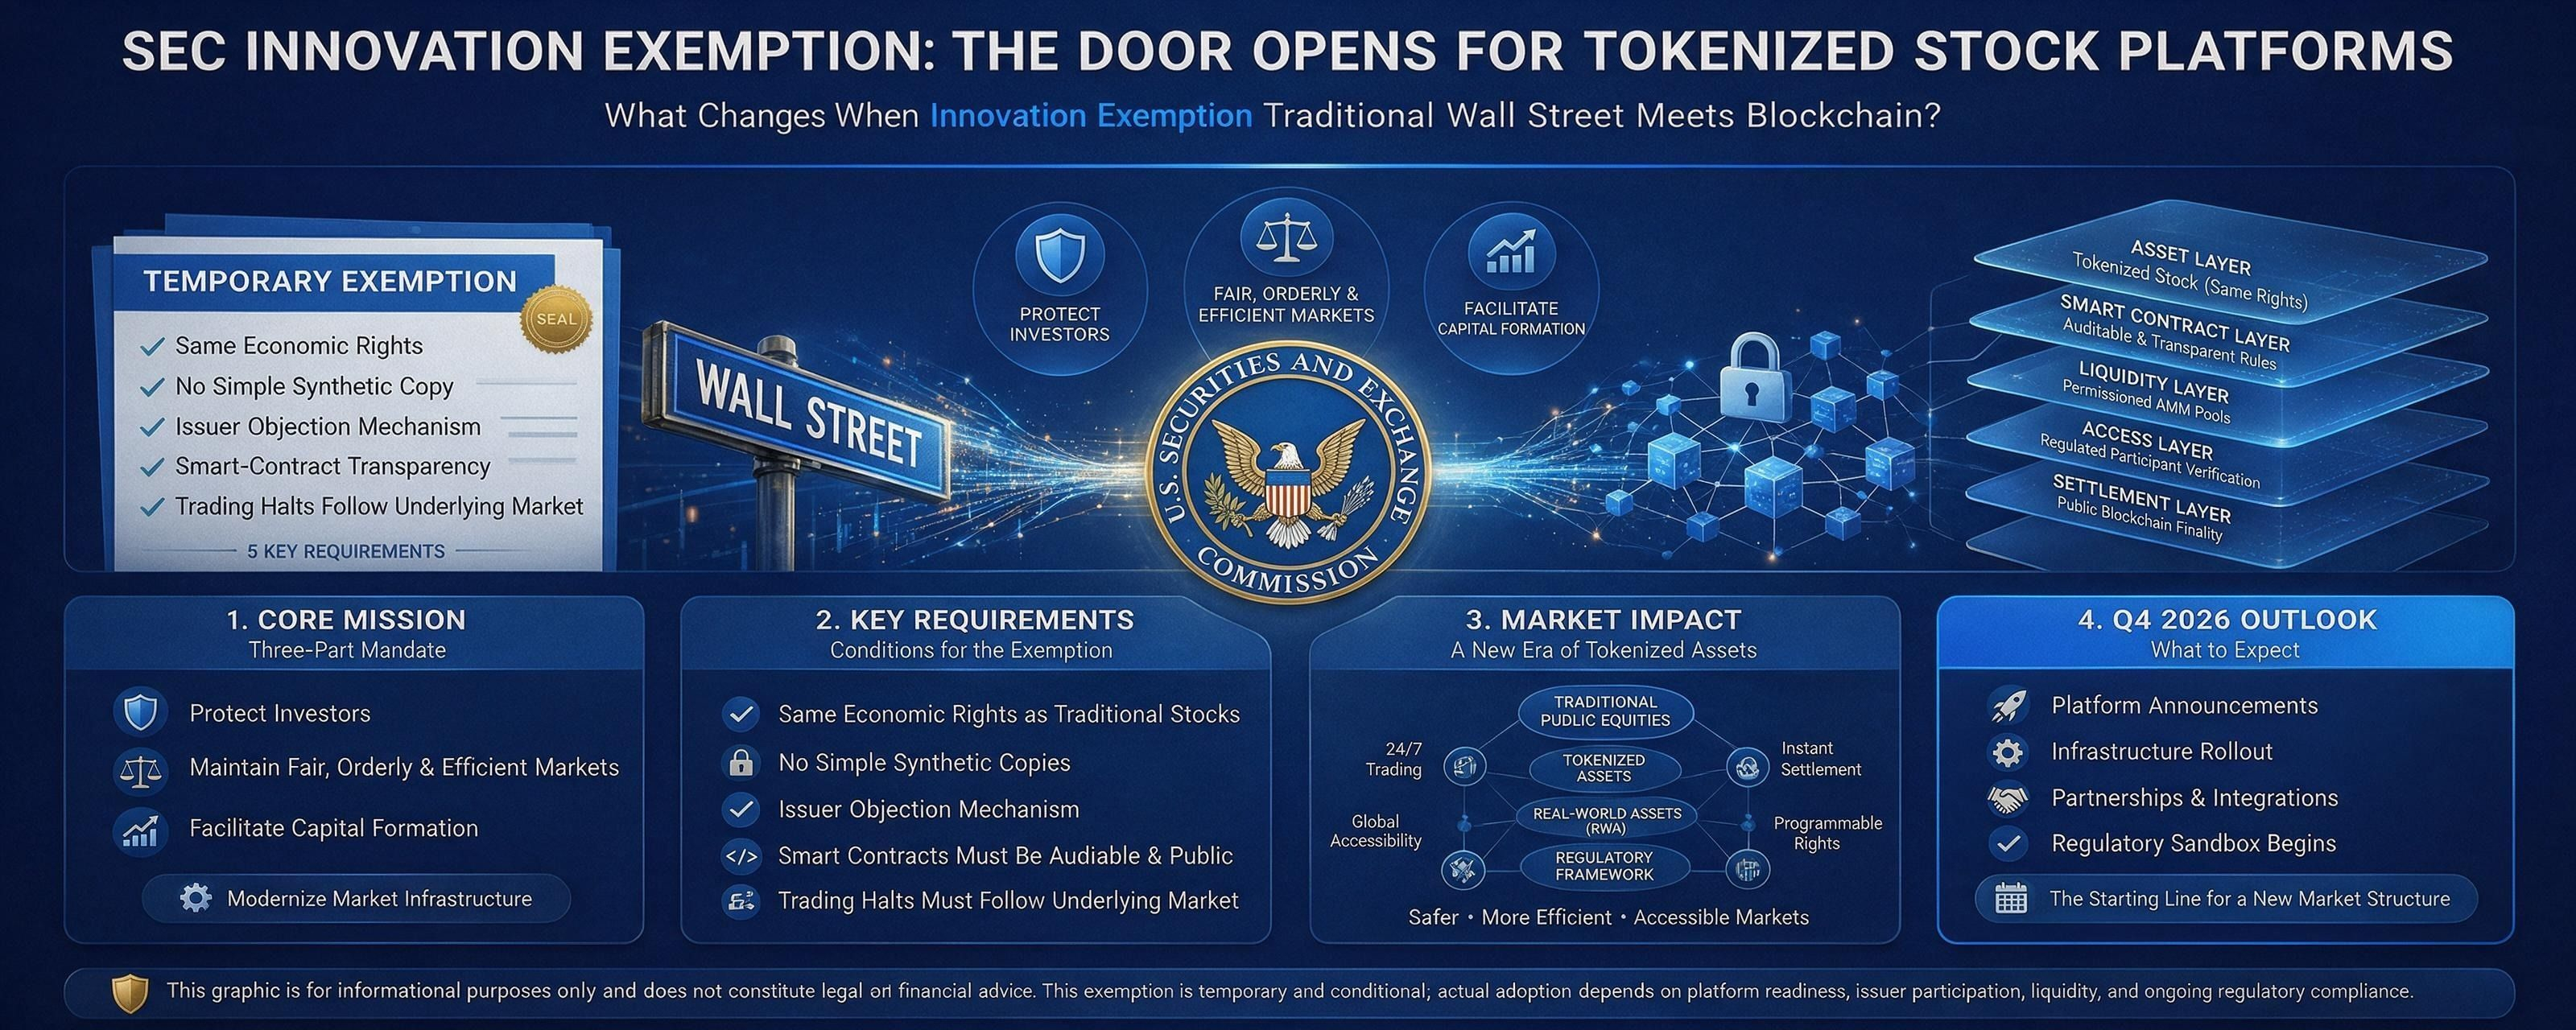
La dispense d’innovation de la SEC pourrait ouvrir la voie aux plateformes d’actions tokenisées au T4Quelque chose d’important est en train de changer entre la bourse traditionnelle de Wall Street et la blockchain.
Le 17 septembre 2026, la Securities and Exchange Commission (SEC) américaine a introduit sa dispense temporaire d’innovation, créant un parcours réglementaire permettant à certaines plateformes d’échanger des actions américaines tokenisées sur des plateformes basées sur la blockchain. Le développement pourrait permettre aux plateformes d’actions tokenisées intéressées d’annoncer des plans dès le T4 2026.
Mais avant d’envisager l’impact sur les cryptoactifs, il est important de comprendre ce que fait réellement la SEC.
La dispense d’innovation de la SEC pourrait ouvrir la voie aux plateformes d’actions tokenisées au T4
Quelque chose d’important est en train de changer entre la bourse traditionnelle de Wall Street et la blockchain.
Le 17 septembre 2026, la Securities and Exchange Commission (SEC) américaine a introduit sa dispense temporaire d’innovation, créant un parcours réglementaire permettant à certaines plateformes d’échanger des actions américaines tokenisées sur des plateformes basées sur la blockchain. Le développement pourrait permettre aux plateformes d’actions tokenisées intéressées d’annoncer des plans dès le T4 2026.
Mais avant d’envisager l’impact sur les cryptoactifs, il est important de comprendre ce que fait réellement la SEC.
Le 17 septembre 2026, la Securities and Exchange Commission (SEC) américaine a introduit sa dispense temporaire d’innovation, créant un parcours réglementaire permettant à certaines plateformes d’échanger des actions américaines tokenisées sur des plateformes basées sur la blockchain. Le développement pourrait permettre aux plateformes d’actions tokenisées intéressées d’annoncer des plans dès le T4 2026.
Mais avant d’envisager l’impact sur les cryptoactifs, il est important de comprendre ce que fait réellement la SEC.
1
169
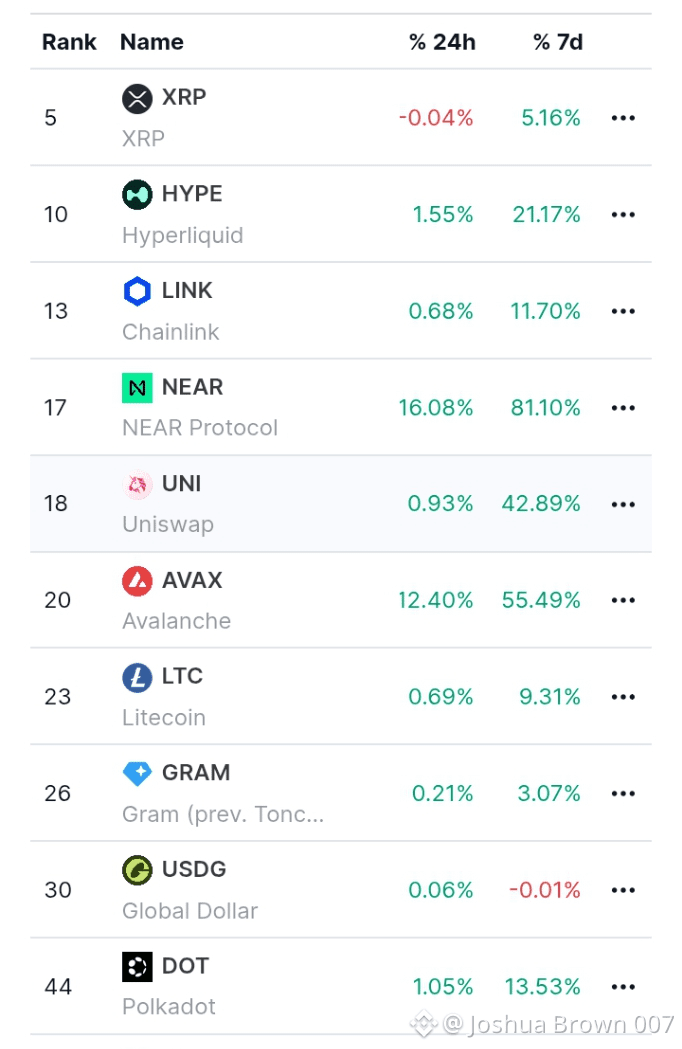
Top 10 des actifs par volume Aperçu du marché des crypto-monnaies | 20 septembre 2026.
La rotation devient intéressante
Les données du 20 septembre montrent un fort élan sur 7 jours sur plusieurs grandes altcoins.
🔹 $NEAR : +81,10 % sur 7 J, le plus fort mouvement de ce groupe
🔹 $AVAX : +55,49 %
🔹 $UNI : +42,89 %
🔹 $HYPE : +21,17 %
🔹 $DOT : +13,53 %
🔹 $LINK : +11,70 %
🔹 $LTC : +9,31 %
🔹 $XRP : +5,16 %
La partie intéressante, c’est le volume.
$XRP a échangé $2,69 Md, $NEAR $2,05 Md, $AVAX $1,48 Md et $HYPE $854 M sur 24 h.
Ce n’est pas seulement un mouvement de prix : le capital et le volume tournent entre différents secteurs.
Mais après de tels gains hebdomadaires marqués, la volatilité peut s’accroître rapidement.
Je surveille si le volume continue de confirmer le mouvement ou s’il commence à s’estomper.
Je ne poursuis pas les bougies. J’observe le flux.
Top 10 des actifs par volume Aperçu du marché des crypto-monnaies | 20 septembre 2026.
La rotation devient intéressante
Les données du 20 septembre montrent un fort élan sur 7 jours sur plusieurs grandes altcoins.
🔹 $NEAR : +81,10 % sur 7 J, le plus fort mouvement de ce groupe
🔹 $AVAX : +55,49 %
🔹 $UNI : +42,89 %
🔹 $HYPE : +21,17 %
🔹 $DOT : +13,53 %
🔹 $LINK : +11,70 %
🔹 $LTC : +9,31 %
🔹 $XRP : +5,16 %
La partie intéressante, c’est le volume.
$XRP a échangé $2,69 Md, $NEAR $2,05 Md, $AVAX $1,48 Md et $HYPE $854 M sur 24 h.
Ce n’est pas seulement un mouvement de prix : le capital et le volume tournent entre différents secteurs.
Mais après de tels gains hebdomadaires marqués, la volatilité peut s’accroître rapidement.
Je surveille si le volume continue de confirmer le mouvement ou s’il commence à s’estomper.
Je ne poursuis pas les bougies. J’observe le flux.
La rotation devient intéressante
Les données du 20 septembre montrent un fort élan sur 7 jours sur plusieurs grandes altcoins.
🔹 $NEAR : +81,10 % sur 7 J, le plus fort mouvement de ce groupe
🔹 $AVAX : +55,49 %
🔹 $UNI : +42,89 %
🔹 $HYPE : +21,17 %
🔹 $DOT : +13,53 %
🔹 $LINK : +11,70 %
🔹 $LTC : +9,31 %
🔹 $XRP : +5,16 %
La partie intéressante, c’est le volume.
$XRP a échangé $2,69 Md, $NEAR $2,05 Md, $AVAX $1,48 Md et $HYPE $854 M sur 24 h.
Ce n’est pas seulement un mouvement de prix : le capital et le volume tournent entre différents secteurs.
Mais après de tels gains hebdomadaires marqués, la volatilité peut s’accroître rapidement.
Je surveille si le volume continue de confirmer le mouvement ou s’il commence à s’estomper.
Je ne poursuis pas les bougies. J’observe le flux.
1
385
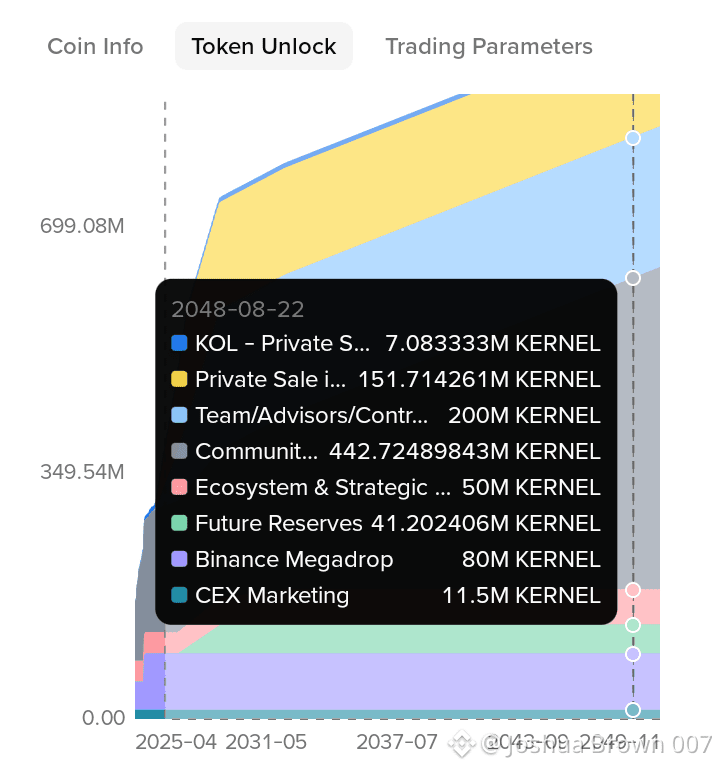
$KERNEL bondit fortement, mais demain commence un test d’approvisionnement.
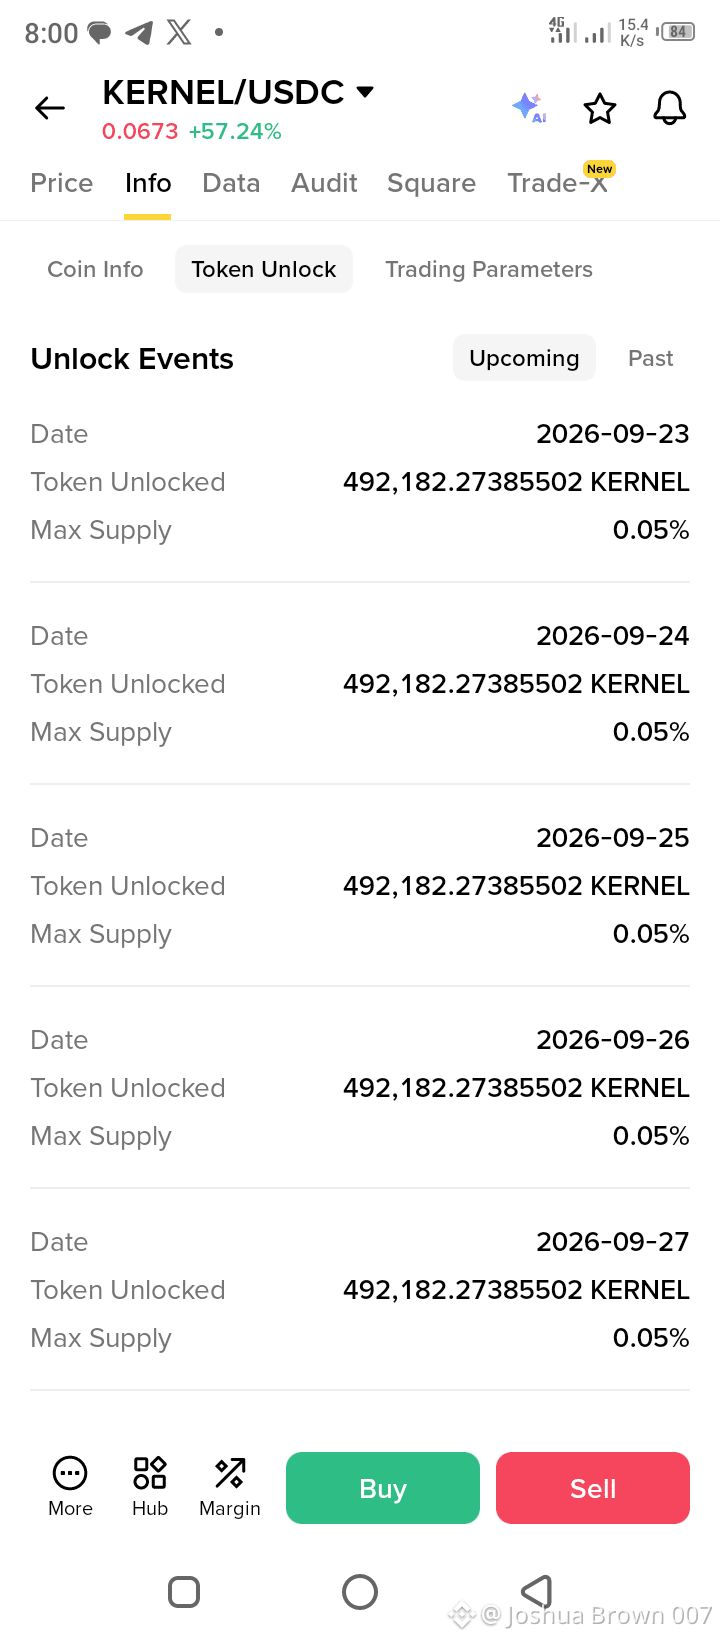
KERNEL est autour de 0,0673 $, déjà +57 % à l’écran que je regarde.
Mais à partir du 23 septembre, le calendrier de déblocage des tokens indique :
492 182 KERNEL chaque jour = 0,05 % de l’offre maximale
23 sept. → 24 → 25 → 26 → 27…
Ce même rythme se poursuit, soit environ 1 % de l’offre maximale sur les 20 prochains jours.
À 0,0673 $, chaque déblocage quotidien représente à peu près 33 K$ de tokens.
Cela semble faible, mais l’offre en circulation de KERNEL ne représente qu’environ 28,8 % de l’offre maximale de 1 Md, donc même une libération quotidienne relativement modeste augmente l’offre disponible.
Tokenomist +1
La partie intéressante :
Le prix grimpe de +57 %, tandis qu’une nouvelle offre entre chaque jour.
Cela crée deux forces :
🟢 Un fort volume peut absorber les nouveaux tokens
🔴 Une demande faible peut transformer les déblocages en pression de vente
Et KERNEL a historiquement montré une volatilité notable autour des événements de déblocage plus importants ; les déblocages précédents ont été suivis de baisses sur plusieurs périodes, même si cela ne signifie pas que le même schéma doit se reproduire.
Donc demain, je surveille :
Prix + Volume + entrées CEX + déblocages quotidiens
La hausse est une histoire.
L’offre qui entre sur le marché est l’histoire que je regarde ensuite.
#DAO #ARB🔥🔥🔥 #NEARRisesNearly80%InAWeek
{future}(KERNELUSDT)
{future}(ARBUSDT)
{future}(NEARUSDT)
$KERNEL bondit fortement, mais demain commence un test d’approvisionnement.
KERNEL est autour de 0,0673 $, déjà +57 % à l’écran que je regarde.
Mais à partir du 23 septembre, le calendrier de déblocage des tokens indique :
492 182 KERNEL chaque jour = 0,05 % de l’offre maximale
23 sept. → 24 → 25 → 26 → 27…
Ce même rythme se poursuit, soit environ 1 % de l’offre maximale sur les 20 prochains jours.
À 0,0673 $, chaque déblocage quotidien représente à peu près 33 K$ de tokens.
Cela semble faible, mais l’offre en circulation de KERNEL ne représente qu’environ 28,8 % de l’offre maximale de 1 Md, donc même une libération quotidienne relativement modeste augmente l’offre disponible.
Tokenomist +1
La partie intéressante :
Le prix grimpe de +57 %, tandis qu’une nouvelle offre entre chaque jour.
Cela crée deux forces :
🟢 Un fort volume peut absorber les nouveaux tokens
🔴 Une demande faible peut transformer les déblocages en pression de vente
Et KERNEL a historiquement montré une volatilité notable autour des événements de déblocage plus importants ; les déblocages précédents ont été suivis de baisses sur plusieurs périodes, même si cela ne signifie pas que le même schéma doit se reproduire.
Donc demain, je surveille :
Prix + Volume + entrées CEX + déblocages quotidiens
La hausse est une histoire.
L’offre qui entre sur le marché est l’histoire que je regarde ensuite.
#DAO #ARB🔥🔥🔥 #NEARRisesNearly80%InAWeek
KERNEL est autour de 0,0673 $, déjà +57 % à l’écran que je regarde.
Mais à partir du 23 septembre, le calendrier de déblocage des tokens indique :
492 182 KERNEL chaque jour = 0,05 % de l’offre maximale
23 sept. → 24 → 25 → 26 → 27…
Ce même rythme se poursuit, soit environ 1 % de l’offre maximale sur les 20 prochains jours.
À 0,0673 $, chaque déblocage quotidien représente à peu près 33 K$ de tokens.
Cela semble faible, mais l’offre en circulation de KERNEL ne représente qu’environ 28,8 % de l’offre maximale de 1 Md, donc même une libération quotidienne relativement modeste augmente l’offre disponible.
Tokenomist +1
La partie intéressante :
Le prix grimpe de +57 %, tandis qu’une nouvelle offre entre chaque jour.
Cela crée deux forces :
🟢 Un fort volume peut absorber les nouveaux tokens
🔴 Une demande faible peut transformer les déblocages en pression de vente
Et KERNEL a historiquement montré une volatilité notable autour des événements de déblocage plus importants ; les déblocages précédents ont été suivis de baisses sur plusieurs périodes, même si cela ne signifie pas que le même schéma doit se reproduire.
Donc demain, je surveille :
Prix + Volume + entrées CEX + déblocages quotidiens
La hausse est une histoire.
L’offre qui entre sur le marché est l’histoire que je regarde ensuite.
#DAO #ARB🔥🔥🔥 #NEARRisesNearly80%InAWeek
1
1
449
#Binance
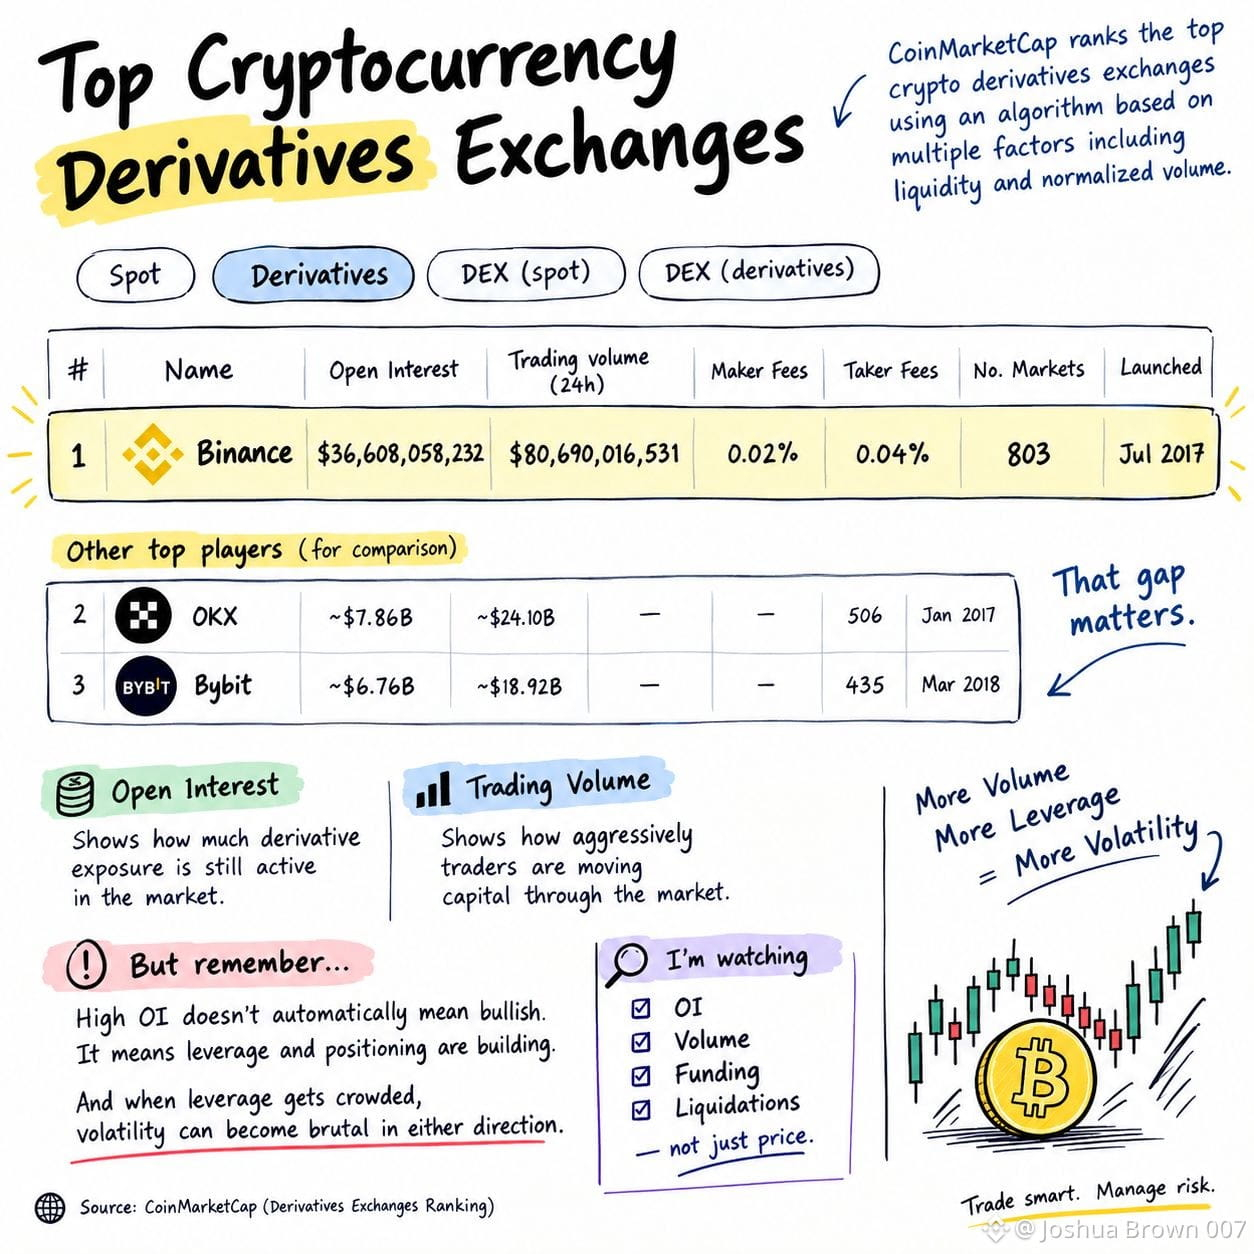
J’ai vérifié les dernières données dérivés de CoinMarketCap et un chiffre ressort immédiatement :
L’écosystème de BNB, Binance, domine encore les dérivés.
Binance • 35,09 Md$ Open Interest • 51,10 Md$ volume dérivés sur 24h • 803 marchés • 0,02% frais maker • 0,04% frais taker
En comparaison, OKX a ~7,86 Md$ d’Open Interest et Bybit ~6,76 Md$.
Cet écart compte.
L’Open Interest indique la quantité d’exposition aux dérivés qui est encore active, tandis que le volume montre avec quelle intensité les traders font circuler le capital sur le marché.
Mais n’oubliez pas : un Open Interest élevé ne signifie pas automatiquement haussier.
Cela veut dire que l’effet de levier et le positionnement se renforcent.
Et quand l’effet de levier devient trop concentré, la volatilité peut devenir brutale dans un sens comme dans l’autre.
Je surveille l’Open Interest + le volume + le financement + les liquidations ensemble, pas seulement le prix.
{spot}(BNBUSDT)
$PHA
{future}(PHAUSDT)
$SUI
{future}(SUIUSDT)
#Binance
J’ai vérifié les dernières données dérivés de CoinMarketCap et un chiffre ressort immédiatement :
L’écosystème de BNB, Binance, domine encore les dérivés.
Binance • 35,09 Md$ Open Interest • 51,10 Md$ volume dérivés sur 24h • 803 marchés • 0,02% frais maker • 0,04% frais taker
En comparaison, OKX a ~7,86 Md$ d’Open Interest et Bybit ~6,76 Md$.
Cet écart compte.
L’Open Interest indique la quantité d’exposition aux dérivés qui est encore active, tandis que le volume montre avec quelle intensité les traders font circuler le capital sur le marché.
Mais n’oubliez pas : un Open Interest élevé ne signifie pas automatiquement haussier.
Cela veut dire que l’effet de levier et le positionnement se renforcent.
Et quand l’effet de levier devient trop concentré, la volatilité peut devenir brutale dans un sens comme dans l’autre.
Je surveille l’Open Interest + le volume + le financement + les liquidations ensemble, pas seulement le prix.
$PHA
$SUI
J’ai vérifié les dernières données dérivés de CoinMarketCap et un chiffre ressort immédiatement :
L’écosystème de BNB, Binance, domine encore les dérivés.
Binance • 35,09 Md$ Open Interest • 51,10 Md$ volume dérivés sur 24h • 803 marchés • 0,02% frais maker • 0,04% frais taker
En comparaison, OKX a ~7,86 Md$ d’Open Interest et Bybit ~6,76 Md$.
Cet écart compte.
L’Open Interest indique la quantité d’exposition aux dérivés qui est encore active, tandis que le volume montre avec quelle intensité les traders font circuler le capital sur le marché.
Mais n’oubliez pas : un Open Interest élevé ne signifie pas automatiquement haussier.
Cela veut dire que l’effet de levier et le positionnement se renforcent.
Et quand l’effet de levier devient trop concentré, la volatilité peut devenir brutale dans un sens comme dans l’autre.
Je surveille l’Open Interest + le volume + le financement + les liquidations ensemble, pas seulement le prix.
$PHA
$SUI
1
205
#BTC☀
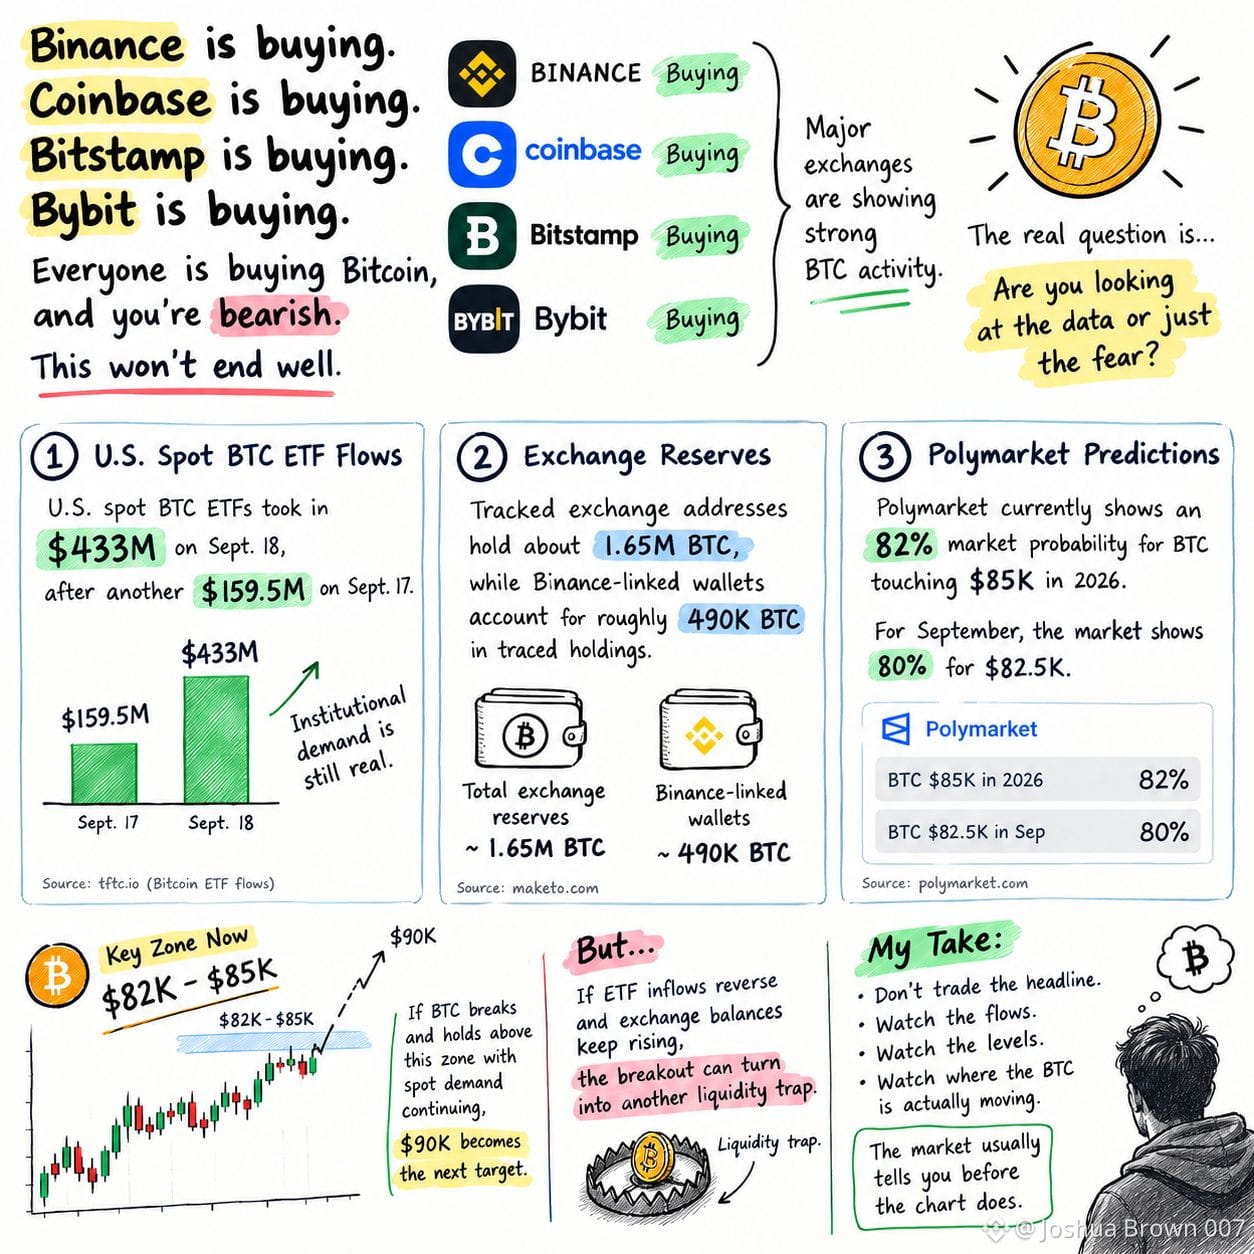
Attendez-vous un creux à 64K $ pour le Bitcoin ? Regardez un aperçu des achats et de la demande institutionnels.
La partie intéressante ne se limite pas au récit : les données montrent désormais une scission entre la liquidité des bourses et la demande institutionnelle.
Des données récentes indiquent que les ETF BTC au comptant aux États-Unis ont attiré 433 M$ le 18 septembre, après encore 159,5 M$ le 17 septembre.
TFTC +1
En même temps, les adresses d’échanges suivies détiennent environ 1,65 M BTC, tandis que les portefeuilles liés à Binance représentent environ 490K BTC dans les avoirs retracés.
Et Polymarket affiche actuellement une probabilité de marché de 82 % pour que le BTC touche 85K $ en 2026, tandis que le marché de septembre montre 80 % pour 82,5K $.
Mon avis :
82K–85K est la zone clé maintenant.
Si le BTC franchit et s’y maintient avec une demande au comptant qui continue, 90K devient la prochaine cible psychologique.
Mais si les entrées des ETF s’inversent et que les soldes sur les bourses continuent d’augmenter, la cassure peut se transformer en un autre piège de liquidité.
Ne tradez pas le titre.
Surveillez les flux. Surveillez les niveaux. Surveillez où le BTC bouge réellement.
Le marché vous le dit généralement avant que le graphique ne le fasse.$BTC
{spot}(BTCUSDT)
#BTC☀
Attendez-vous un creux à 64K $ pour le Bitcoin ? Regardez un aperçu des achats et de la demande institutionnels.
La partie intéressante ne se limite pas au récit : les données montrent désormais une scission entre la liquidité des bourses et la demande institutionnelle.
Des données récentes indiquent que les ETF BTC au comptant aux États-Unis ont attiré 433 M$ le 18 septembre, après encore 159,5 M$ le 17 septembre.
TFTC +1
En même temps, les adresses d’échanges suivies détiennent environ 1,65 M BTC, tandis que les portefeuilles liés à Binance représentent environ 490K BTC dans les avoirs retracés.
Et Polymarket affiche actuellement une probabilité de marché de 82 % pour que le BTC touche 85K $ en 2026, tandis que le marché de septembre montre 80 % pour 82,5K $.
Mon avis :
82K–85K est la zone clé maintenant.
Si le BTC franchit et s’y maintient avec une demande au comptant qui continue, 90K devient la prochaine cible psychologique.
Mais si les entrées des ETF s’inversent et que les soldes sur les bourses continuent d’augmenter, la cassure peut se transformer en un autre piège de liquidité.
Ne tradez pas le titre.
Surveillez les flux. Surveillez les niveaux. Surveillez où le BTC bouge réellement.
Le marché vous le dit généralement avant que le graphique ne le fasse.$BTC
Attendez-vous un creux à 64K $ pour le Bitcoin ? Regardez un aperçu des achats et de la demande institutionnels.
La partie intéressante ne se limite pas au récit : les données montrent désormais une scission entre la liquidité des bourses et la demande institutionnelle.
Des données récentes indiquent que les ETF BTC au comptant aux États-Unis ont attiré 433 M$ le 18 septembre, après encore 159,5 M$ le 17 septembre.
TFTC +1
En même temps, les adresses d’échanges suivies détiennent environ 1,65 M BTC, tandis que les portefeuilles liés à Binance représentent environ 490K BTC dans les avoirs retracés.
Et Polymarket affiche actuellement une probabilité de marché de 82 % pour que le BTC touche 85K $ en 2026, tandis que le marché de septembre montre 80 % pour 82,5K $.
Mon avis :
82K–85K est la zone clé maintenant.
Si le BTC franchit et s’y maintient avec une demande au comptant qui continue, 90K devient la prochaine cible psychologique.
Mais si les entrées des ETF s’inversent et que les soldes sur les bourses continuent d’augmenter, la cassure peut se transformer en un autre piège de liquidité.
Ne tradez pas le titre.
Surveillez les flux. Surveillez les niveaux. Surveillez où le BTC bouge réellement.
Le marché vous le dit généralement avant que le graphique ne le fasse.$BTC
1
67
$TRUMP ALERTE EN CHAÎNE
L’équipe du Meme de Trump vient de déplacer encore 8,73M $TRUMP (~17,99M$) vers la garde de BitGo.
Cela porte le total sur 2 semaines à ~31M TRUMP, d’une valeur d’environ 70,64M$.
Mais voici la partie importante :
⚠️ La garde BitGo ≠ vente confirmée.
Donc je surveille le prochain mouvement de portefeuille, et je ne suppose pas simplement un dump.
📉 Impact sur le prix si la vente suit :
Une grande quantité de l’offre liée à une équipe entrant dans la liquidité du marché pourrait augmenter la pression de vente et affaiblir le support. Si des dépôts d’exchange apparaissent ensuite, le risque d’un mouvement plus brutal augmente.
📊 Niveaux techniques à surveiller :
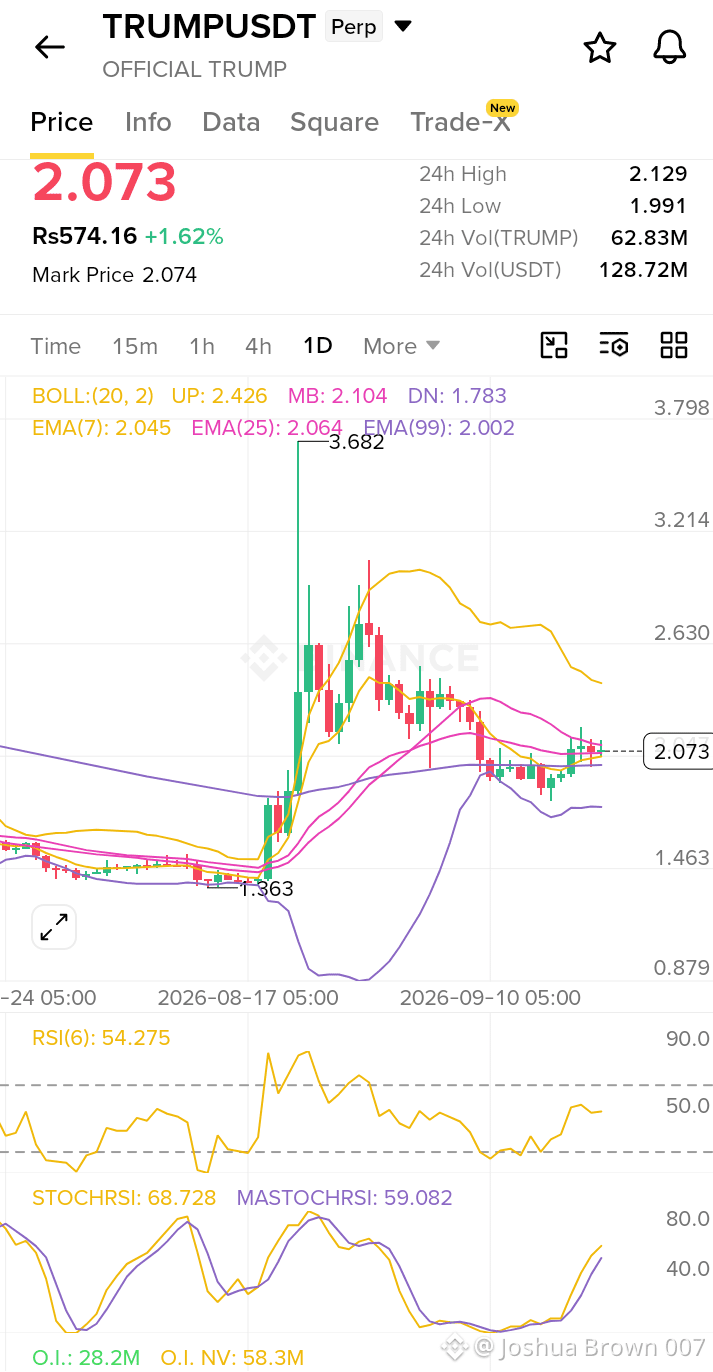
Les informations actuelles situent $TRUMP autour de 2,05$, avec une résistance proche de 2,14$ et un support autour de 1,96$. Le prix est aussi près de la zone des moyennes mobiles 50/200 EMA, ce qui en fait une zone clé pour la confirmation.
Ma méthode : ne pas paniquer-vendre. Ne pas acheter aveuglément la baisse.
À surveiller : → BitGo → transferts vers les exchanges
→ Volume au comptant
→ Support à 1,96$
→ Cassure à 2,14$
→ Sorties/entrées de fonds (portefeuilles)
Si 1,96$ se casse avec un volume fort, la pression à la baisse peut s’accélérer.
Si 2,14$ est repris avec un volume spot solide, le marché peut absorber l’offre.
Flux on-chain d’abord. Confirmation du prix ensuite.
{future}(TRUMPUSDT)
{future}(MELANIAUSDT)
{future}(WLFIUSDT)
#TrumpCrypto #XRPExchangeReservesHitSevenYearLow #trumpcoin
$TRUMP ALERTE EN CHAÎNE
L’équipe du Meme de Trump vient de déplacer encore 8,73M $TRUMP (~17,99M$) vers la garde de BitGo.
Cela porte le total sur 2 semaines à ~31M TRUMP, d’une valeur d’environ 70,64M$.
Mais voici la partie importante :
⚠️ La garde BitGo ≠ vente confirmée.
Donc je surveille le prochain mouvement de portefeuille, et je ne suppose pas simplement un dump.
📉 Impact sur le prix si la vente suit :
Une grande quantité de l’offre liée à une équipe entrant dans la liquidité du marché pourrait augmenter la pression de vente et affaiblir le support. Si des dépôts d’exchange apparaissent ensuite, le risque d’un mouvement plus brutal augmente.
📊 Niveaux techniques à surveiller :
Les informations actuelles situent $TRUMP autour de 2,05$, avec une résistance proche de 2,14$ et un support autour de 1,96$. Le prix est aussi près de la zone des moyennes mobiles 50/200 EMA, ce qui en fait une zone clé pour la confirmation.
Ma méthode : ne pas paniquer-vendre. Ne pas acheter aveuglément la baisse.
À surveiller : → BitGo → transferts vers les exchanges
→ Volume au comptant
→ Support à 1,96$
→ Cassure à 2,14$
→ Sorties/entrées de fonds (portefeuilles)
Si 1,96$ se casse avec un volume fort, la pression à la baisse peut s’accélérer.
Si 2,14$ est repris avec un volume spot solide, le marché peut absorber l’offre.
Flux on-chain d’abord. Confirmation du prix ensuite.
#TrumpCrypto #XRPExchangeReservesHitSevenYearLow #trumpcoin
L’équipe du Meme de Trump vient de déplacer encore 8,73M $TRUMP (~17,99M$) vers la garde de BitGo.
Cela porte le total sur 2 semaines à ~31M TRUMP, d’une valeur d’environ 70,64M$.
Mais voici la partie importante :
⚠️ La garde BitGo ≠ vente confirmée.
Donc je surveille le prochain mouvement de portefeuille, et je ne suppose pas simplement un dump.
📉 Impact sur le prix si la vente suit :
Une grande quantité de l’offre liée à une équipe entrant dans la liquidité du marché pourrait augmenter la pression de vente et affaiblir le support. Si des dépôts d’exchange apparaissent ensuite, le risque d’un mouvement plus brutal augmente.
📊 Niveaux techniques à surveiller :
Les informations actuelles situent $TRUMP autour de 2,05$, avec une résistance proche de 2,14$ et un support autour de 1,96$. Le prix est aussi près de la zone des moyennes mobiles 50/200 EMA, ce qui en fait une zone clé pour la confirmation.
Ma méthode : ne pas paniquer-vendre. Ne pas acheter aveuglément la baisse.
À surveiller : → BitGo → transferts vers les exchanges
→ Volume au comptant
→ Support à 1,96$
→ Cassure à 2,14$
→ Sorties/entrées de fonds (portefeuilles)
Si 1,96$ se casse avec un volume fort, la pression à la baisse peut s’accélérer.
Si 2,14$ est repris avec un volume spot solide, le marché peut absorber l’offre.
Flux on-chain d’abord. Confirmation du prix ensuite.
#TrumpCrypto #XRPExchangeReservesHitSevenYearLow #trumpcoin

1
670
Article
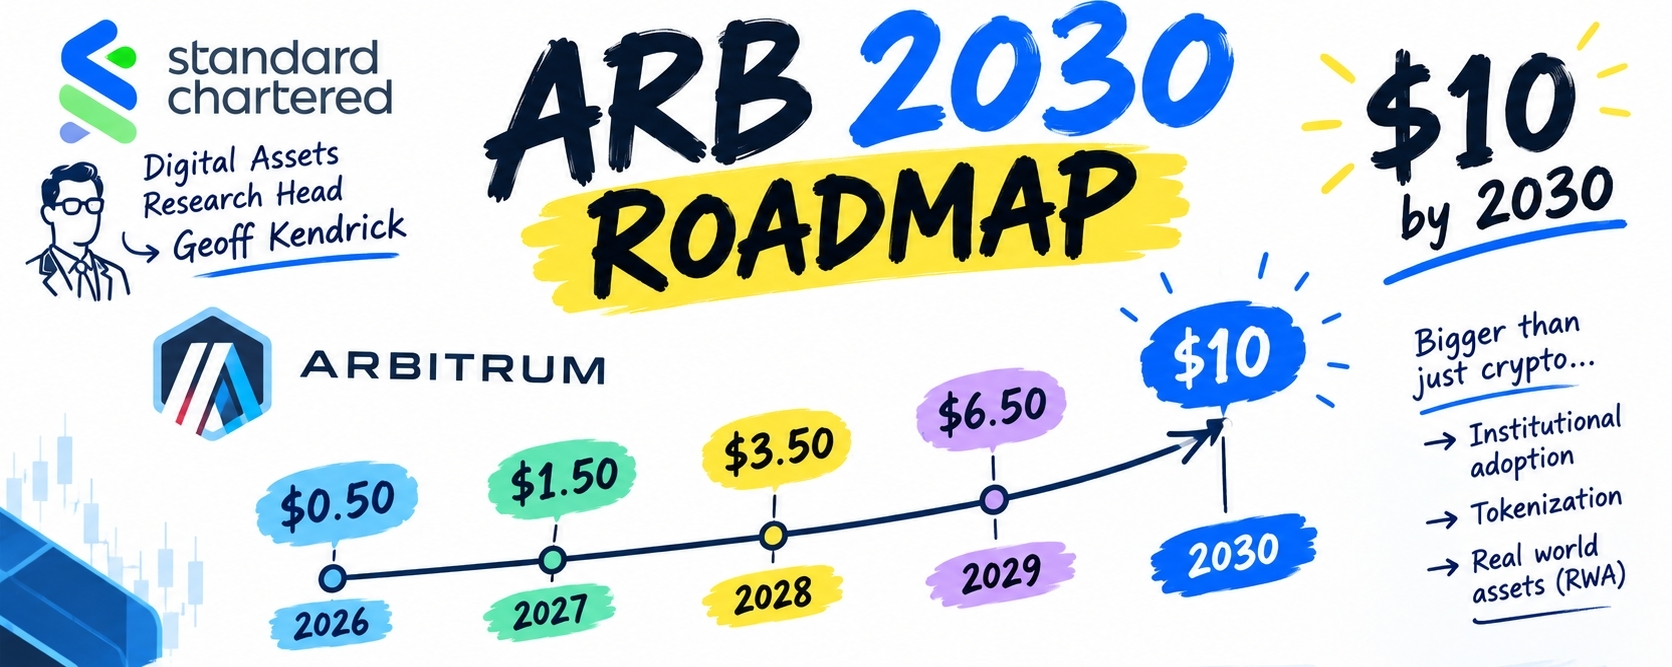
Feuille de route ARB 2030 par le responsable de la recherche sur les actifs numériques de Standard Chartered,Geoff KendrickLe responsable de la recherche sur les actifs numériques de Standard Chartered, Geoff Kendrick, vient de publier une énorme prévision de prix à long terme de 10 $ pour l’Arbitrum (ARB) d’ici la fin de 2030. En s’appuyant sur un prix de référence de base de 0,14 $, la banque a décrit une trajectoire en escalier agressive :
Cible 2026 : 0,50 $
Cible 2027 : 1,50 $
Cible 2028 : 3,50 $
Cible 2029 : 6,50 $
Cible 2030 : 10,00 $
La Défiante
Même si une projection de croissance de 70x de la part d’une grande banque mondiale semble être un jeu d’enfant, il faut combler l’écart entre la théorie institutionnelle et les données froides et concrètes du graphique.
Feuille de route ARB 2030 par le responsable de la recherche sur les actifs numériques de Standard Chartered,Geoff Kendrick
Le responsable de la recherche sur les actifs numériques de Standard Chartered, Geoff Kendrick, vient de publier une énorme prévision de prix à long terme de 10 $ pour l’Arbitrum (ARB) d’ici la fin de 2030. En s’appuyant sur un prix de référence de base de 0,14 $, la banque a décrit une trajectoire en escalier agressive :
Cible 2026 : 0,50 $
Cible 2027 : 1,50 $
Cible 2028 : 3,50 $
Cible 2029 : 6,50 $
Cible 2030 : 10,00 $
La Défiante
Même si une projection de croissance de 70x de la part d’une grande banque mondiale semble être un jeu d’enfant, il faut combler l’écart entre la théorie institutionnelle et les données froides et concrètes du graphique.
Cible 2026 : 0,50 $
Cible 2027 : 1,50 $
Cible 2028 : 3,50 $
Cible 2029 : 6,50 $
Cible 2030 : 10,00 $
La Défiante
Même si une projection de croissance de 70x de la part d’une grande banque mondiale semble être un jeu d’enfant, il faut combler l’écart entre la théorie institutionnelle et les données froides et concrètes du graphique.
2
16
19.8k
$CELR Configuration de trading sur une bougie de 1 H
si clôture au-dessus de 0.0042 LONG
TP 0.0045 et 0.0050
SL 0.0037
si clôture 1 H en dessous de 0.003097 Short
Un pic soudain du volume de vente qui casse la résistance de 0.0030.
{future}(CELRUSDT)
$CELR Configuration de trading sur une bougie de 1 H
si clôture au-dessus de 0.0042 LONG
TP 0.0045 et 0.0050
SL 0.0037
si clôture 1 H en dessous de 0.003097 Short
Un pic soudain du volume de vente qui casse la résistance de 0.0030.
si clôture au-dessus de 0.0042 LONG
TP 0.0045 et 0.0050
SL 0.0037
si clôture 1 H en dessous de 0.003097 Short
Un pic soudain du volume de vente qui casse la résistance de 0.0030.
1
99
#Binance
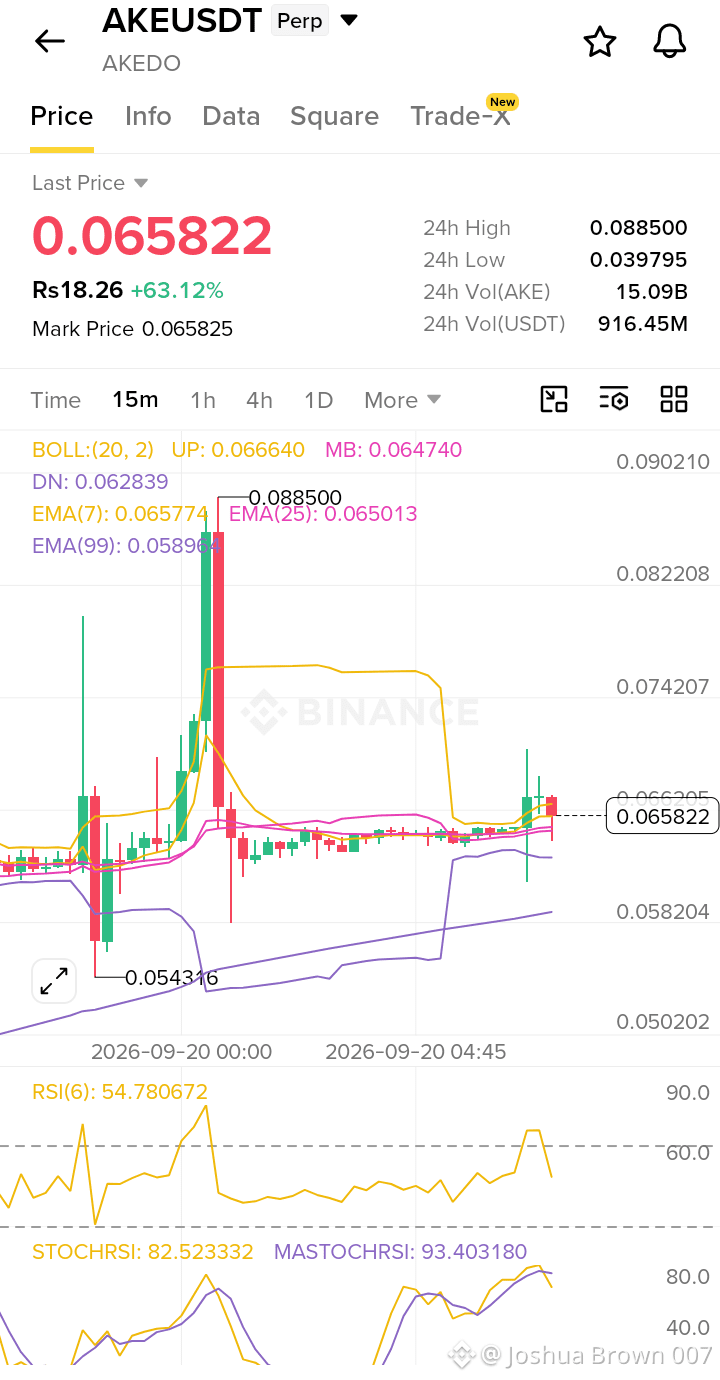
AKEUSDT $AKE ressemble à une arnaque classique « pump and dump » piège actuellement. Si vous êtes un trader de détail, vous devez rester loin de celle-ci et éviter de jeter votre argent durement gagné dans un navire qui coule.
Voici exactement ce que révèle le graphique :
La grosse mèche : Cette énorme pointe verticale rouge suivie d’une longue traîne en haut est un signal d’alerte majeur. Elle montre que des initiés et des acheteurs précoces ont fait grimper le prix jusqu’à 0.088500, puis ont immédiatement largué leurs grosses positions sur les acheteurs tardifs, forçant ensuite le prix à redescendre directement.
Le volume piégé : Regardez le volume colossal sur 24 heures qui s’élève à 15.09B AKE. Une énorme quantité de liquidités a circulé sur ce token en très peu de temps : c’est exactement comme les créateurs et les baleines quittent leurs positions, tout en laissant les traders du quotidien avec le sac.
Euphorie artificielle : Voir un token monter de +63.12% dans la journée peut sembler séduisant, mais c’est extrêmement trompeur. Le mouvement des prix s’est déjà nettement aplati après la chute, ce qui indique que l’élan artificiel initial est en train de s’éteindre.
Quand des tokens bougent comme ça, les traders de détail perdent presque toujours. Le jeu est complètement truqué par les personnes qui contrôlent l’offre. Ne laissez pas le FOMO (peur de rater une opportunité) vous faire prendre de mauvaises décisions : protégez votre capital et cherchez des projets qui ont de la substance.
Les gars, ne soyez pas avides, ce n’est pas une seule paire pour trader sur Binance😁
{future}(AKEUSDT)
{future}(ONEUSDT)
{future}(BANKUSDT)
#Binance
AKEUSDT $AKE ressemble à une arnaque classique « pump and dump » piège actuellement. Si vous êtes un trader de détail, vous devez rester loin de celle-ci et éviter de jeter votre argent durement gagné dans un navire qui coule.
Voici exactement ce que révèle le graphique :
La grosse mèche : Cette énorme pointe verticale rouge suivie d’une longue traîne en haut est un signal d’alerte majeur. Elle montre que des initiés et des acheteurs précoces ont fait grimper le prix jusqu’à 0.088500, puis ont immédiatement largué leurs grosses positions sur les acheteurs tardifs, forçant ensuite le prix à redescendre directement.
Le volume piégé : Regardez le volume colossal sur 24 heures qui s’élève à 15.09B AKE. Une énorme quantité de liquidités a circulé sur ce token en très peu de temps : c’est exactement comme les créateurs et les baleines quittent leurs positions, tout en laissant les traders du quotidien avec le sac.
Euphorie artificielle : Voir un token monter de +63.12% dans la journée peut sembler séduisant, mais c’est extrêmement trompeur. Le mouvement des prix s’est déjà nettement aplati après la chute, ce qui indique que l’élan artificiel initial est en train de s’éteindre.
Quand des tokens bougent comme ça, les traders de détail perdent presque toujours. Le jeu est complètement truqué par les personnes qui contrôlent l’offre. Ne laissez pas le FOMO (peur de rater une opportunité) vous faire prendre de mauvaises décisions : protégez votre capital et cherchez des projets qui ont de la substance.
Les gars, ne soyez pas avides, ce n’est pas une seule paire pour trader sur Binance😁
AKEUSDT $AKE ressemble à une arnaque classique « pump and dump » piège actuellement. Si vous êtes un trader de détail, vous devez rester loin de celle-ci et éviter de jeter votre argent durement gagné dans un navire qui coule.
Voici exactement ce que révèle le graphique :
La grosse mèche : Cette énorme pointe verticale rouge suivie d’une longue traîne en haut est un signal d’alerte majeur. Elle montre que des initiés et des acheteurs précoces ont fait grimper le prix jusqu’à 0.088500, puis ont immédiatement largué leurs grosses positions sur les acheteurs tardifs, forçant ensuite le prix à redescendre directement.
Le volume piégé : Regardez le volume colossal sur 24 heures qui s’élève à 15.09B AKE. Une énorme quantité de liquidités a circulé sur ce token en très peu de temps : c’est exactement comme les créateurs et les baleines quittent leurs positions, tout en laissant les traders du quotidien avec le sac.
Euphorie artificielle : Voir un token monter de +63.12% dans la journée peut sembler séduisant, mais c’est extrêmement trompeur. Le mouvement des prix s’est déjà nettement aplati après la chute, ce qui indique que l’élan artificiel initial est en train de s’éteindre.
Quand des tokens bougent comme ça, les traders de détail perdent presque toujours. Le jeu est complètement truqué par les personnes qui contrôlent l’offre. Ne laissez pas le FOMO (peur de rater une opportunité) vous faire prendre de mauvaises décisions : protégez votre capital et cherchez des projets qui ont de la substance.
Les gars, ne soyez pas avides, ce n’est pas une seule paire pour trader sur Binance😁
1
479
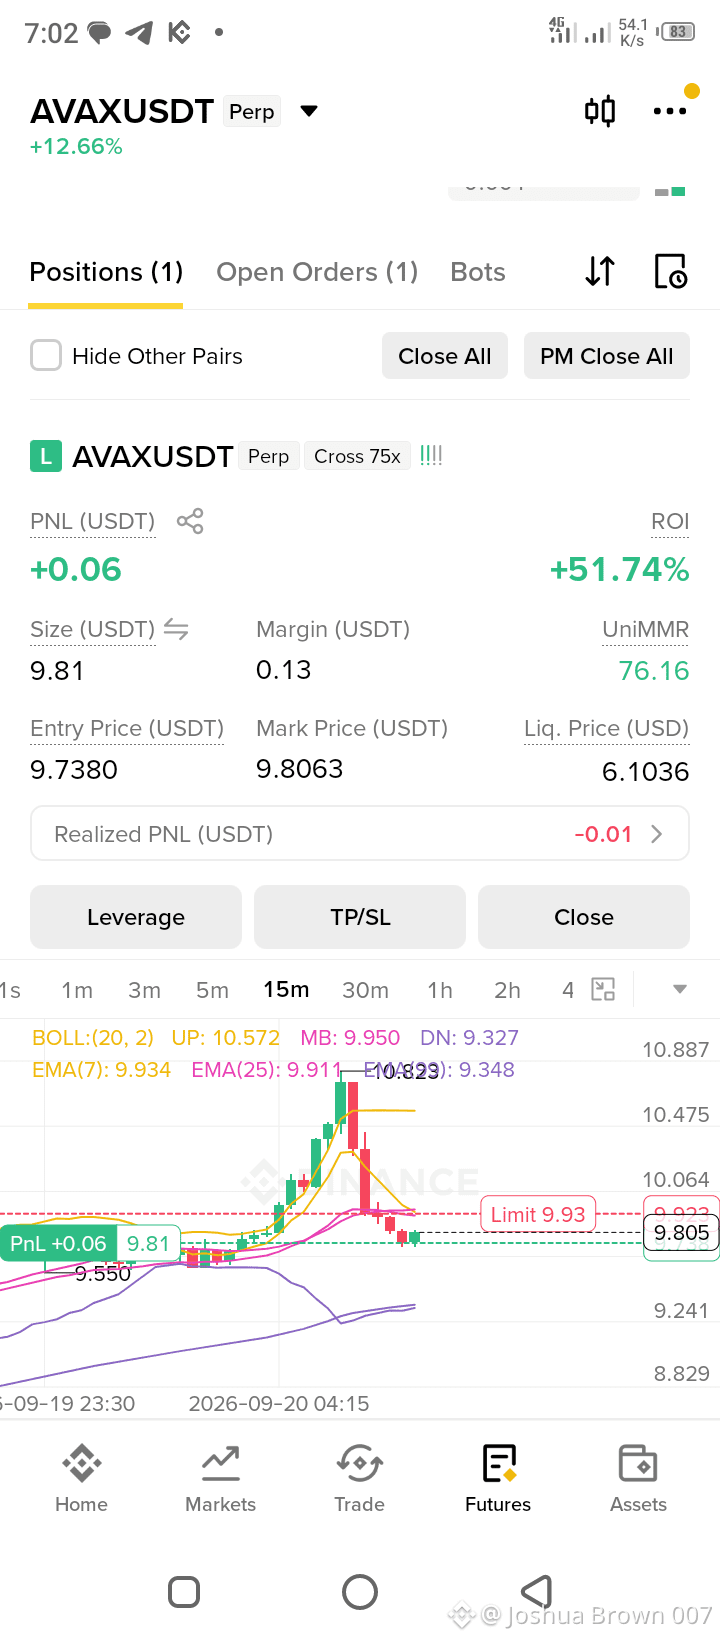
#AVAX Scalp long
Marché d’entrée
SL 9.64
TP 9.923
TP 10.01
Rupture à la baisse. Si le prix casse en dessous de 9.70 avec un volume élevé, entrer en position short lors du re-test de 9.70, en visant 9.40. SL à 9.85.
$AVAIL
{future}(AVAXUSDT)
#AVAX Scalp long
Marché d’entrée
SL 9.64
TP 9.923
TP 10.01
Rupture à la baisse. Si le prix casse en dessous de 9.70 avec un volume élevé, entrer en position short lors du re-test de 9.70, en visant 9.40. SL à 9.85.
$AVAIL
Marché d’entrée
SL 9.64
TP 9.923
TP 10.01
Rupture à la baisse. Si le prix casse en dessous de 9.70 avec un volume élevé, entrer en position short lors du re-test de 9.70, en visant 9.40. SL à 9.85.
$AVAIL
1
147
Connectez-vous pour découvrir plus de contenu
Rejoignez la communauté mondiale des adeptes de cryptomonnaies sur Binance Square
⚡️ Suviez les dernières informations importantes sur les cryptomonnaies.
💬 Jugé digne de confiance par la plus grande plateforme d’échange de cryptomonnaies au monde.
👍 Découvrez les connaissances que partagent les créateurs vérifiés.
Adresse e-mail/Nº de téléphone