

#altcoinwatch
altcoinwatch
6.3M vues
16,415 mentions
Populaire
Récents

Voir la traduction
EVAA Jumps Nearly 20% as Buyers Defend the Higher Low
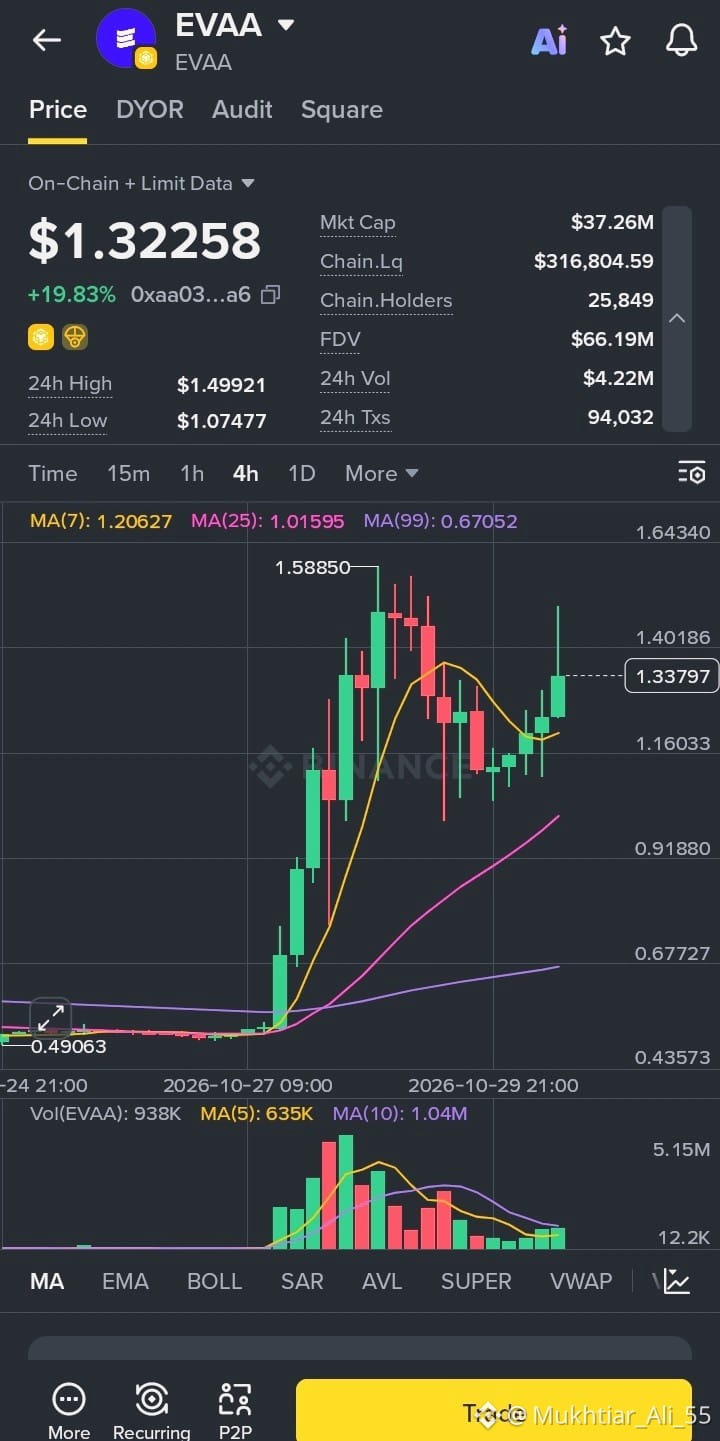
EVAA is posting a strong rebound today, trading at 1.32258 (+19.83%) after bouncing from a 24h low of 1.07477 and reaching a high of 1.49921.
Here’s a quick look at the numbers:
📊 Market Cap: 37.26M
💧 24h Volume: 4.22M
👥 Holders: 25,849 on-chain
🔥 24h Transactions: 94,032
🏷️ FDV: 66.19M
On the 4H chart, price is trading well above the MA(7) at 1.20627, MA(25) at 1.01595 and MA(99) at 0.67052, which keeps the broader structure bullish. After the run toward the 1.5885 peak, EVAA corrected, formed a higher low near 1.07, and has now pushed back up with a series of green candles. The long upper wick on the latest candle shows some selling pressure near 1.45, so that area is worth watching.
The key resistance zone sits between 1.49 and 1.59, where the 24h high and the previous peak are located. A clean break above it could set up another leg higher. If the move fades, the MA(7) near 1.21 is the first support, followed by the recent low around 1.07.
Volume has cooled significantly since the initial surge, so a pickup in buying activity would help confirm the continuation. Liquidity is also quite thin at around 317K, so price can swing sharply in either direction.
For now, I’m watching whether EVAA can hold above 1.20 and challenge the 1.49 resistance.
#EVAA #EvaaProtocol #CryptoTrading #BinanceAlpha #AltcoinWatch
$EVAA
{future}(EVAAUSDT)
EVAA Jumps Nearly 20% as Buyers Defend the Higher Low
EVAA is posting a strong rebound today, trading at 1.32258 (+19.83%) after bouncing from a 24h low of 1.07477 and reaching a high of 1.49921.
Here’s a quick look at the numbers:
📊 Market Cap: 37.26M
💧 24h Volume: 4.22M
👥 Holders: 25,849 on-chain
🔥 24h Transactions: 94,032
🏷️ FDV: 66.19M
On the 4H chart, price is trading well above the MA(7) at 1.20627, MA(25) at 1.01595 and MA(99) at 0.67052, which keeps the broader structure bullish. After the run toward the 1.5885 peak, EVAA corrected, formed a higher low near 1.07, and has now pushed back up with a series of green candles. The long upper wick on the latest candle shows some selling pressure near 1.45, so that area is worth watching.
The key resistance zone sits between 1.49 and 1.59, where the 24h high and the previous peak are located. A clean break above it could set up another leg higher. If the move fades, the MA(7) near 1.21 is the first support, followed by the recent low around 1.07.
Volume has cooled significantly since the initial surge, so a pickup in buying activity would help confirm the continuation. Liquidity is also quite thin at around 317K, so price can swing sharply in either direction.
For now, I’m watching whether EVAA can hold above 1.20 and challenge the 1.49 resistance.
#EVAA #EvaaProtocol #CryptoTrading #BinanceAlpha #AltcoinWatch
$EVAA
6

Voir la traduction
DeFi infrastructure and decentralized exchanges remain active areas to follow.
$SAFE — Safe provides smart-account infrastructure for managing digital assets.
$CVC — Civic focuses on identity verification and digital identity solutions.
$DODO — DODO is a decentralized exchange protocol designed to support on-chain liquidity.
#SAFE #CVC #DODO #DeFi #AltcoinWatch
$SAFE — Safe provides smart-account infrastructure for managing digital assets.
$CVC — Civic focuses on identity verification and digital identity solutions.
$DODO — DODO is a decentralized exchange protocol designed to support on-chain liquidity.
#SAFE #CVC #DODO #DeFi #AltcoinWatch
Voir la traduction
PHAROS Slides 6% as Sellers Push Price Below All Key Moving Averages
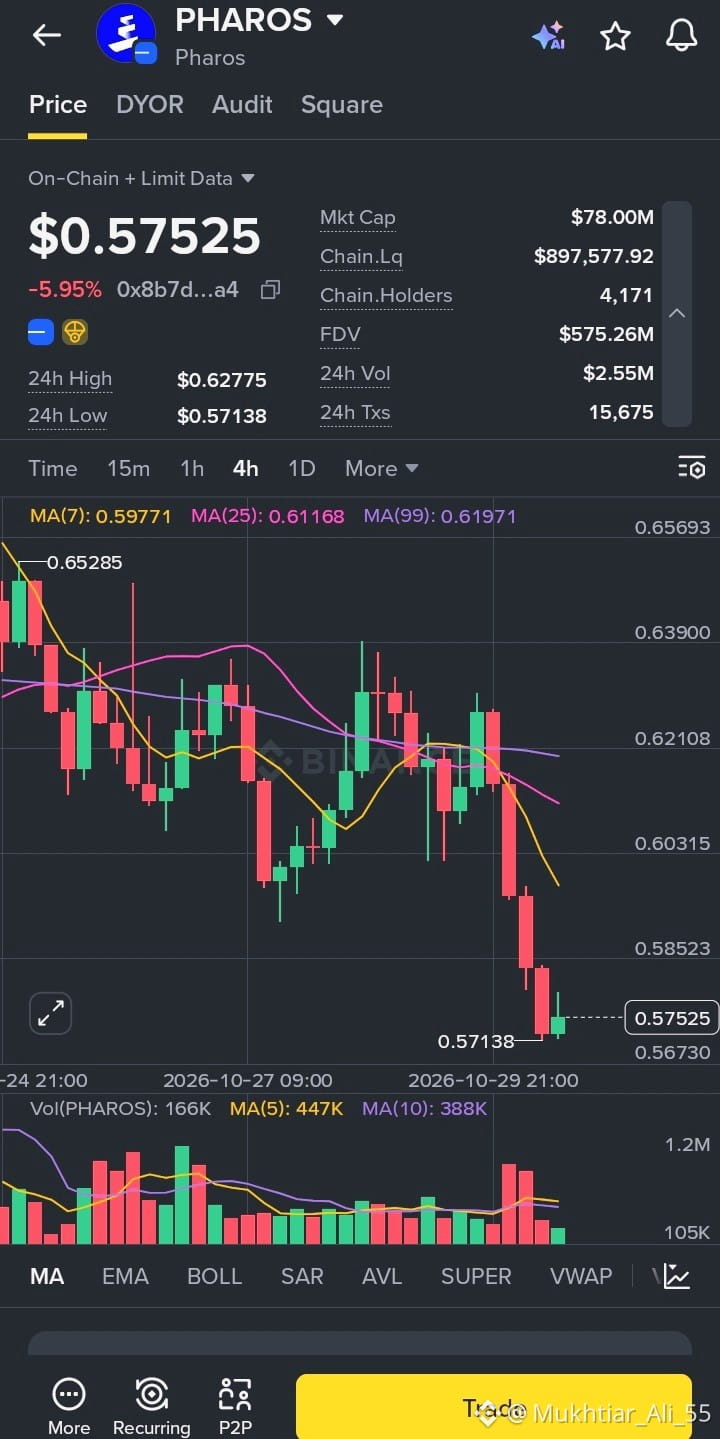
PHAROS is under pressure today, trading at 0.57525 (-5.95%) after reaching a 24h high of 0.62775 and sliding to a low of 0.57138.
Here’s a quick look at the numbers:
📊 Market Cap: 78.00M
💧 24h Volume: 2.55M
👥 Holders: 4,171 on-chain
🔥 24h Transactions: 15,675
🏷️ FDV: 575.26M
On the 4H chart, price has dropped below the MA(7) at 0.59771, the MA(25) at 0.61168 and the MA(99) at 0.61971, all of which now sit overhead as resistance. The sharp series of red candles after the rejection near 0.62 shows strong selling pressure, and the bearish structure remains intact for now. The latest small green candle near 0.5714 is the first hint of a bounce, but it’s too early to call it a reversal.
The first level to watch is the 0.5977 zone around the MA(7), followed by the 0.61 to 0.62 area where the MA(25) and MA(99) are clustered. On the downside, 0.5714 is the immediate support, and a break below it could open the door to further downside.
Volume picked up during the drop and has since started to fade, so a rise in buying volume would be needed to confirm any recovery. Liquidity is also thin at around 897K relative to the 78M market cap, so price can swing sharply in either direction.
For now, I’m watching whether PHAROS can hold above 0.5714 and reclaim 0.5977 before drawing any bigger conclusions.
#PHAROS #PharosNetwork #CryptoTrading #BinanceAlpha #AltcoinWatch
$PHAROS
{future}(PHAROSUSDT)
PHAROS Slides 6% as Sellers Push Price Below All Key Moving Averages
PHAROS is under pressure today, trading at 0.57525 (-5.95%) after reaching a 24h high of 0.62775 and sliding to a low of 0.57138.
Here’s a quick look at the numbers:
📊 Market Cap: 78.00M
💧 24h Volume: 2.55M
👥 Holders: 4,171 on-chain
🔥 24h Transactions: 15,675
🏷️ FDV: 575.26M
On the 4H chart, price has dropped below the MA(7) at 0.59771, the MA(25) at 0.61168 and the MA(99) at 0.61971, all of which now sit overhead as resistance. The sharp series of red candles after the rejection near 0.62 shows strong selling pressure, and the bearish structure remains intact for now. The latest small green candle near 0.5714 is the first hint of a bounce, but it’s too early to call it a reversal.
The first level to watch is the 0.5977 zone around the MA(7), followed by the 0.61 to 0.62 area where the MA(25) and MA(99) are clustered. On the downside, 0.5714 is the immediate support, and a break below it could open the door to further downside.
Volume picked up during the drop and has since started to fade, so a rise in buying volume would be needed to confirm any recovery. Liquidity is also thin at around 897K relative to the 78M market cap, so price can swing sharply in either direction.
For now, I’m watching whether PHAROS can hold above 0.5714 and reclaim 0.5977 before drawing any bigger conclusions.
#PHAROS #PharosNetwork #CryptoTrading #BinanceAlpha #AltcoinWatch
$PHAROS
3
Voir la traduction
BTW (Bitway) Drops 14% as Price Slips Below Key Moving Averages
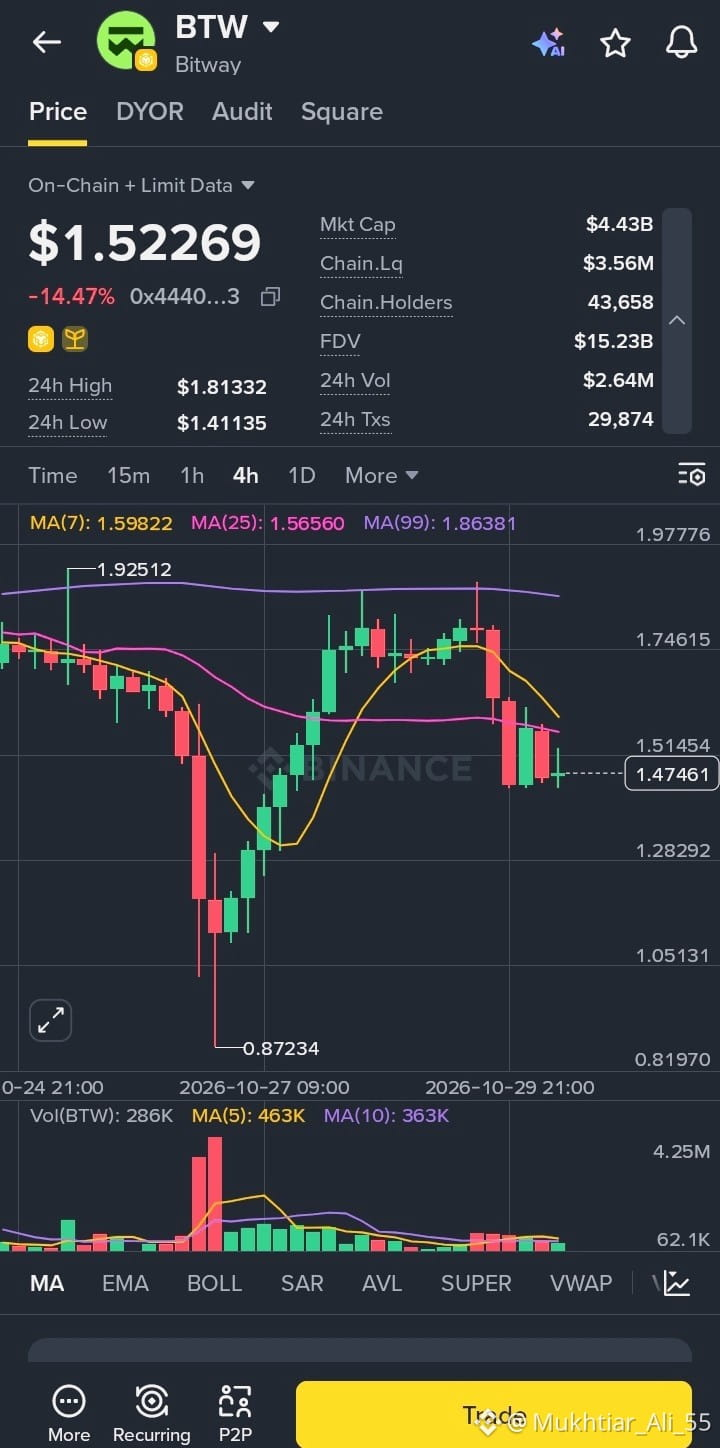
BTW is under pressure today, trading at 1.52269 (-14.47%) after touching a 24h high of 1.81332 and dipping to a low of 1.41135.
Here’s a quick look at the numbers:
📊 Market Cap: 4.43B
💧 24h Volume: 2.64M
👥 Holders: 43,658 on-chain
🔥 24h Transactions: 29,874
🏷️ FDV: 15.23B
On the 4H chart, price has fallen below both the MA(7) at 1.59822 and the MA(25) at 1.56560, which are now sitting overhead as short-term resistance. The MA(99) at 1.86381 is well above current levels, and the recent rejection near the 1.80 area shows sellers defending that zone. After the sharp recovery from the 0.87234 low, the move has stalled and started to roll over.
The first level to watch is the 1.56 to 1.60 zone, where the two moving averages overlap. A reclaim of that area would be an early sign that buyers are returning. On the downside, 1.41 is the immediate support, and a break below it could open the door to a deeper retest of the lower range.
Volume has been fading compared to the earlier spike, which suggests the bounce lacked strong follow-through. Liquidity is also thin at around 3.56M relative to the 4.43B market cap, so price can move sharply in either direction.
For now, I’m watching whether BTW can hold above 1.41 and win back the 1.60 level before drawing any bigger conclusions.
#BTW #Bitway #CryptoTrading #BinanceAlpha #AltcoinWatch
$BTW
{future}(BTWUSDT)
BTW (Bitway) Drops 14% as Price Slips Below Key Moving Averages
BTW is under pressure today, trading at 1.52269 (-14.47%) after touching a 24h high of 1.81332 and dipping to a low of 1.41135.
Here’s a quick look at the numbers:
📊 Market Cap: 4.43B
💧 24h Volume: 2.64M
👥 Holders: 43,658 on-chain
🔥 24h Transactions: 29,874
🏷️ FDV: 15.23B
On the 4H chart, price has fallen below both the MA(7) at 1.59822 and the MA(25) at 1.56560, which are now sitting overhead as short-term resistance. The MA(99) at 1.86381 is well above current levels, and the recent rejection near the 1.80 area shows sellers defending that zone. After the sharp recovery from the 0.87234 low, the move has stalled and started to roll over.
The first level to watch is the 1.56 to 1.60 zone, where the two moving averages overlap. A reclaim of that area would be an early sign that buyers are returning. On the downside, 1.41 is the immediate support, and a break below it could open the door to a deeper retest of the lower range.
Volume has been fading compared to the earlier spike, which suggests the bounce lacked strong follow-through. Liquidity is also thin at around 3.56M relative to the 4.43B market cap, so price can move sharply in either direction.
For now, I’m watching whether BTW can hold above 1.41 and win back the 1.60 level before drawing any bigger conclusions.
#BTW #Bitway #CryptoTrading #BinanceAlpha #AltcoinWatch
$BTW
7
Voir la traduction
CAP Climbs 10% as Price Reclaims Key Moving Averages
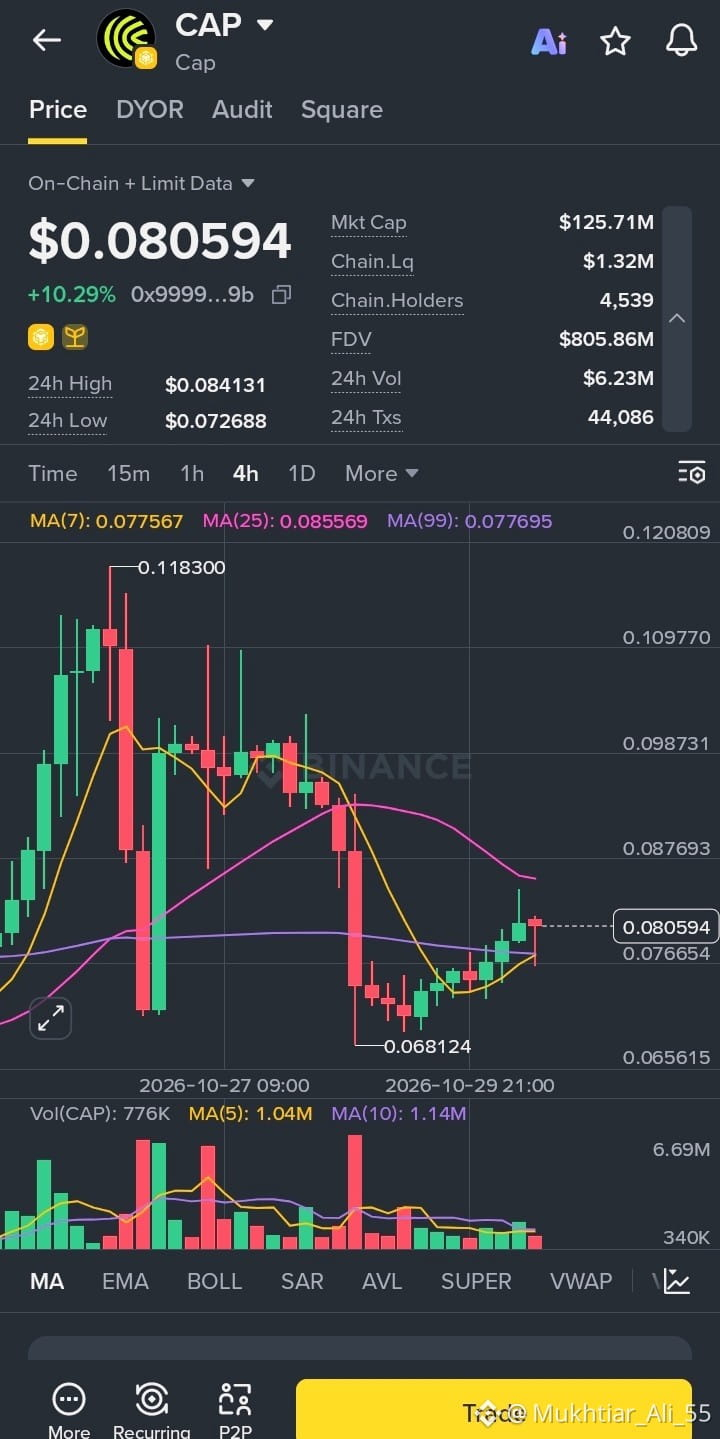
CAP is bouncing back today, trading at 0.080594 (+10.29%) after finding support at a 24h low of 0.072688 and reaching a high of 0.084131.
Here’s a quick look at the numbers:
📊 Market Cap: 125.71M
💧 24h Volume: 6.23M
👥 Holders: 4,539 on-chain
🔥 24h Transactions: 44,086
🏷️ FDV: 805.86M
On the 4H chart, price has pushed back above the MA(7) at 0.077567 and the MA(99) at 0.077695, which is an encouraging sign after the pullback from the 0.1183 peak and the dip to 0.068124. The higher lows forming on the recent candles suggest buyers are slowly regaining control.
The next hurdle is the MA(25) at 0.085569, which sits just above the 24h high of 0.084131. A clean break and hold above that area could open the door to a stronger recovery. If the bounce fades, the 0.0777 zone, where the MA(7) and MA(99) overlap, is the first support to watch, followed by the recent low near 0.0727.
Volume has been declining compared to the earlier spikes, so a pickup in buying activity would help confirm the move. Liquidity is also thin at around 1.32M, so price can swing sharply in either direction.
For now, I’m watching whether CAP can hold above 0.0777 and make a push toward 0.0855.
#CAP #CapToken #CryptoTrading #BinanceAlpha #AltcoinWatch
$CAP
{future}(CAPUSDT)
CAP Climbs 10% as Price Reclaims Key Moving Averages
CAP is bouncing back today, trading at 0.080594 (+10.29%) after finding support at a 24h low of 0.072688 and reaching a high of 0.084131.
Here’s a quick look at the numbers:
📊 Market Cap: 125.71M
💧 24h Volume: 6.23M
👥 Holders: 4,539 on-chain
🔥 24h Transactions: 44,086
🏷️ FDV: 805.86M
On the 4H chart, price has pushed back above the MA(7) at 0.077567 and the MA(99) at 0.077695, which is an encouraging sign after the pullback from the 0.1183 peak and the dip to 0.068124. The higher lows forming on the recent candles suggest buyers are slowly regaining control.
The next hurdle is the MA(25) at 0.085569, which sits just above the 24h high of 0.084131. A clean break and hold above that area could open the door to a stronger recovery. If the bounce fades, the 0.0777 zone, where the MA(7) and MA(99) overlap, is the first support to watch, followed by the recent low near 0.0727.
Volume has been declining compared to the earlier spikes, so a pickup in buying activity would help confirm the move. Liquidity is also thin at around 1.32M, so price can swing sharply in either direction.
For now, I’m watching whether CAP can hold above 0.0777 and make a push toward 0.0855.
#CAP #CapToken #CryptoTrading #BinanceAlpha #AltcoinWatch
$CAP
5
Voir la traduction
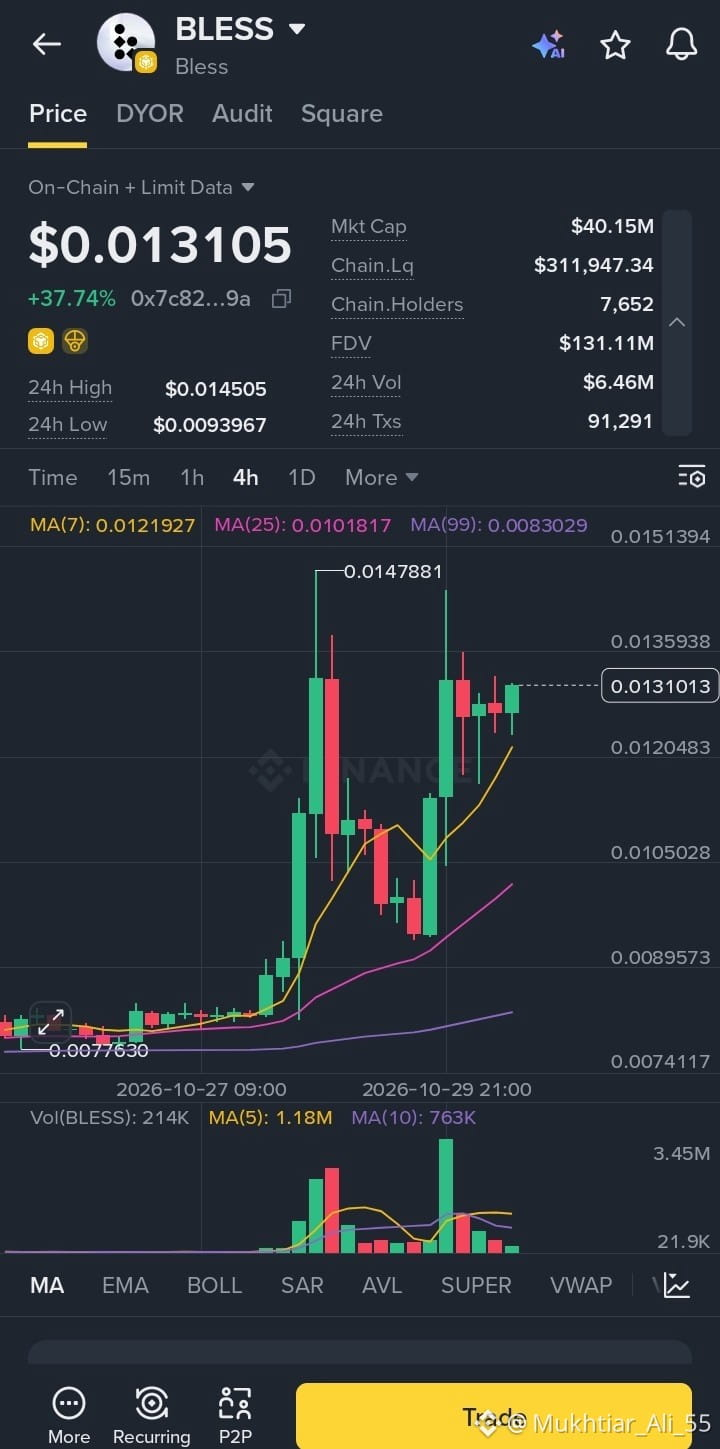
BLESS Rallies Over 37% as Buyers Hold the Higher Ground
BLESS is one of the stronger movers today, trading at 0.013105 (+37.74%) after bouncing from a 24h low of 0.0093967 and touching a high of 0.014505.
Here’s a quick look at the numbers:
📊 Market Cap: 40.15M
💧 24h Volume: 6.46M
👥 Holders: 7,652 on-chain
🔥 24h Transactions: 91,291
🏷️ FDV: 131.11M
On the 4H chart, price is trading comfortably above the MA(7) at 0.0121927, MA(25) at 0.0101817 and MA(99) at 0.0083029, which keeps the short-term structure bullish. After the first spike toward 0.0147881, BLESS pulled back, built a higher low, and pushed up again, which is a healthy pattern for a trend trying to continue.
The 0.0145 to 0.0148 zone is the key resistance to watch. A clean break above it could open the way for another leg higher. If price slips instead, the MA(7) near 0.0122 is the first support, followed by the MA(25) around 0.0102. Volume has cooled since the second spike, so fresh buying volume would help confirm the next move. Liquidity is also quite thin at around 312K, so price can swing sharply in both directions.
For now, I’m watching how BLESS handles the resistance zone before drawing any bigger conclusions.
#BLESS #BlessNetwork #CryptoTrading #BinanceAlpha #AltcoinWatch
$BLESS
{future}(BLESSUSDT)
BLESS Rallies Over 37% as Buyers Hold the Higher Ground
BLESS is one of the stronger movers today, trading at 0.013105 (+37.74%) after bouncing from a 24h low of 0.0093967 and touching a high of 0.014505.
Here’s a quick look at the numbers:
📊 Market Cap: 40.15M
💧 24h Volume: 6.46M
👥 Holders: 7,652 on-chain
🔥 24h Transactions: 91,291
🏷️ FDV: 131.11M
On the 4H chart, price is trading comfortably above the MA(7) at 0.0121927, MA(25) at 0.0101817 and MA(99) at 0.0083029, which keeps the short-term structure bullish. After the first spike toward 0.0147881, BLESS pulled back, built a higher low, and pushed up again, which is a healthy pattern for a trend trying to continue.
The 0.0145 to 0.0148 zone is the key resistance to watch. A clean break above it could open the way for another leg higher. If price slips instead, the MA(7) near 0.0122 is the first support, followed by the MA(25) around 0.0102. Volume has cooled since the second spike, so fresh buying volume would help confirm the next move. Liquidity is also quite thin at around 312K, so price can swing sharply in both directions.
For now, I’m watching how BLESS handles the resistance zone before drawing any bigger conclusions.
#BLESS #BlessNetwork #CryptoTrading #BinanceAlpha #AltcoinWatch
$BLESS
29
Voir la traduction
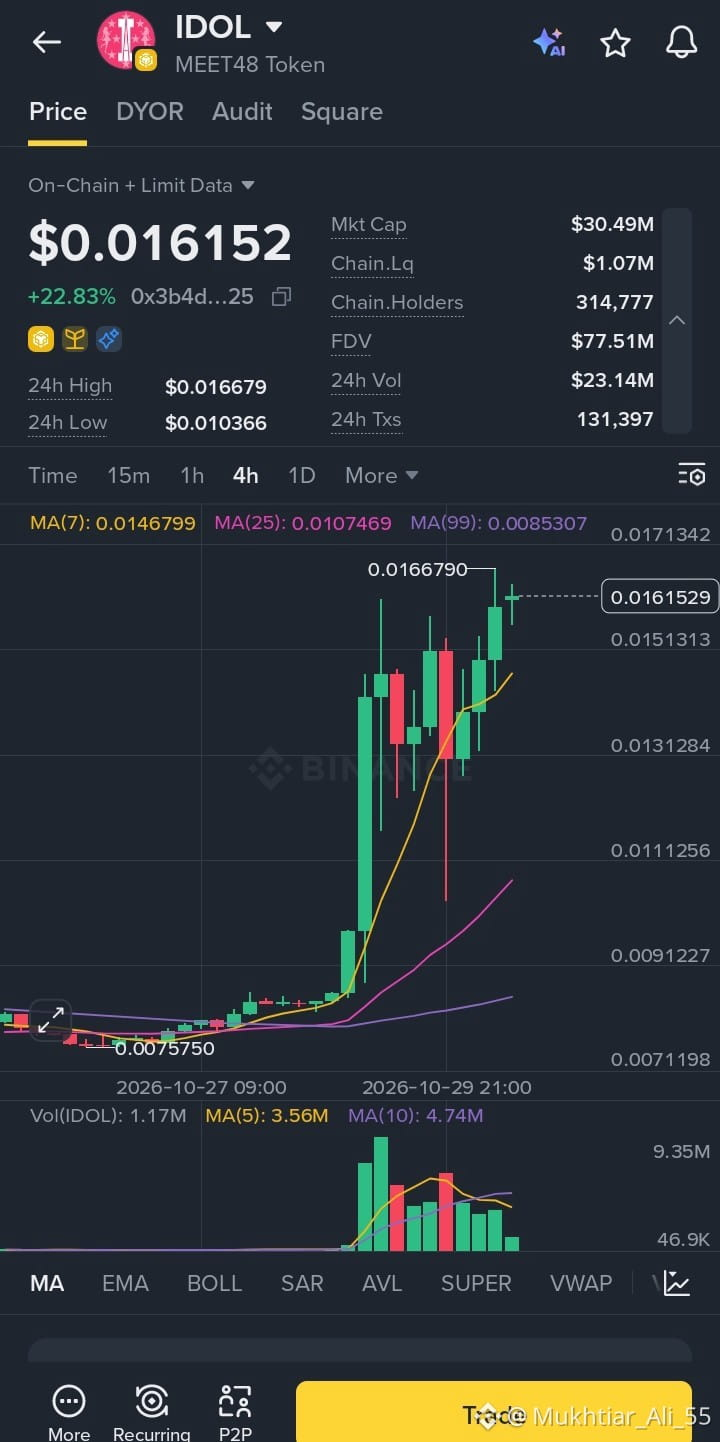
IDOL (MEET48 Token) Surges Over 22% as Momentum Builds
IDOL has put in a strong move over the last 24 hours, trading at 0.016152 (+22.83%) after bouncing from a 24h low of 0.010366 and reaching a high of 0.016679.
Here’s what stands out on the chart:
📊 Market Cap: 30.49M
💧 24h Volume: 23.14M, which is a lot of activity relative to the market cap
👥 Holders: 314,777 on-chain
🔥 24h Transactions: 131,397
On the 4H timeframe, price has climbed well above the MA(7), MA(25) and MA(99), a clear sign of bullish structure after a long stretch of sideways movement near 0.0075. The jump was backed by a spike in volume, which adds some weight to the breakout.
That said, a rally this sharp often invites a cooldown. The 0.0166 area is the level to watch, and a clean break above it could open the door to further upside. On the other hand, a drop back toward the MA(7) near 0.0147 would be a normal retest. Liquidity is also relatively thin at 1.07M, so volatility can swing both ways.
I’m keeping IDOL on my watchlist and waiting to see how it handles this resistance zone.
#IDOL #MEET48 #CryptoTrading #BinanceAlpha #AltcoinWatch
$IDOL
{future}(IDOLUSDT)
IDOL (MEET48 Token) Surges Over 22% as Momentum Builds
IDOL has put in a strong move over the last 24 hours, trading at 0.016152 (+22.83%) after bouncing from a 24h low of 0.010366 and reaching a high of 0.016679.
Here’s what stands out on the chart:
📊 Market Cap: 30.49M
💧 24h Volume: 23.14M, which is a lot of activity relative to the market cap
👥 Holders: 314,777 on-chain
🔥 24h Transactions: 131,397
On the 4H timeframe, price has climbed well above the MA(7), MA(25) and MA(99), a clear sign of bullish structure after a long stretch of sideways movement near 0.0075. The jump was backed by a spike in volume, which adds some weight to the breakout.
That said, a rally this sharp often invites a cooldown. The 0.0166 area is the level to watch, and a clean break above it could open the door to further upside. On the other hand, a drop back toward the MA(7) near 0.0147 would be a normal retest. Liquidity is also relatively thin at 1.07M, so volatility can swing both ways.
I’m keeping IDOL on my watchlist and waiting to see how it handles this resistance zone.
#IDOL #MEET48 #CryptoTrading #BinanceAlpha #AltcoinWatch
$IDOL
45
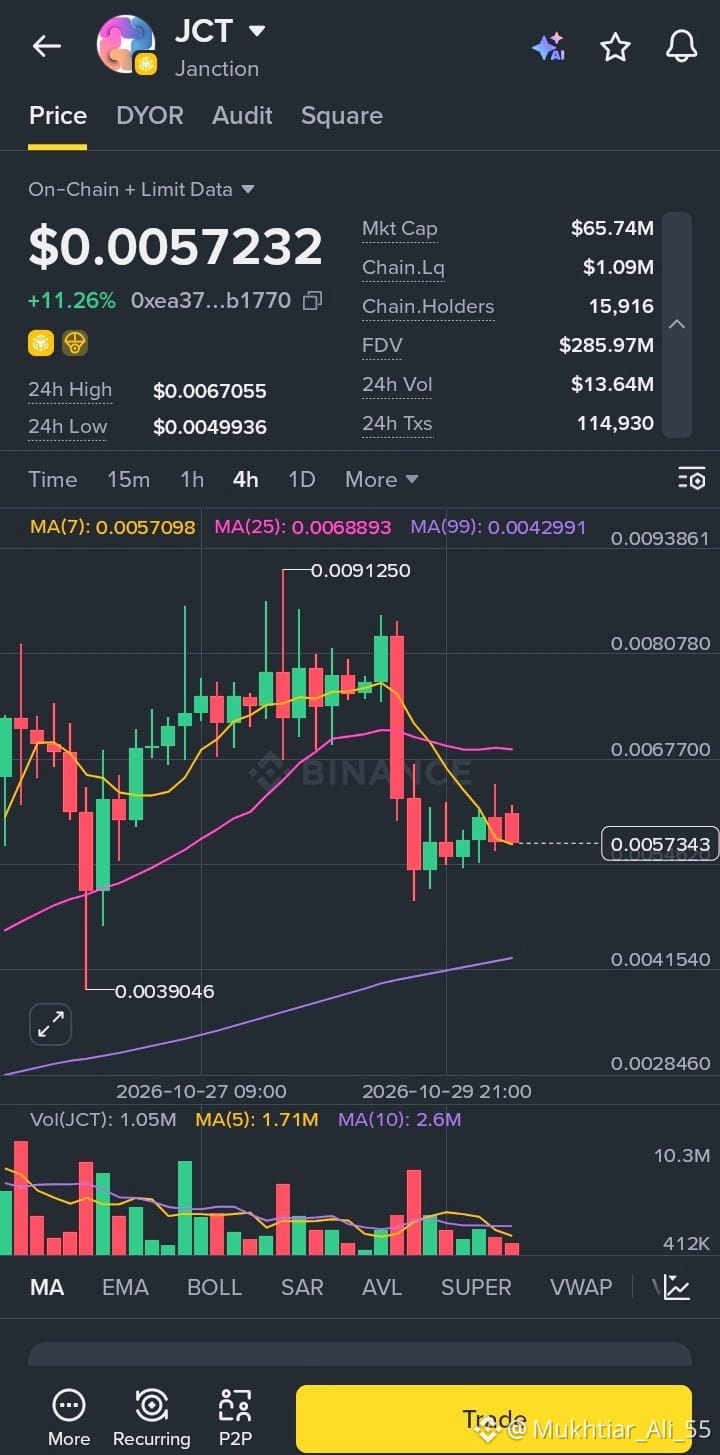
JCT (Janction) rebondit de 11 % alors que le cours teste une moyenne mobile clé
JCT affiche une belle reprise au cours des dernières 24 heures, s’échangeant à 0.0057232 (+11.26 %) après avoir rebondi depuis un plus bas sur 24 h de 0.0049936 et atteint un plus haut de 0.0067055.
Voici un aperçu rapide des chiffres :
📊 Capitalisation boursière : 65.74M
💧 Volume sur 24 h : 13.64M
👥 Détenteurs : 15,916 on-chain
🔥 Transactions sur 24 h : 114,930
🏷️ Valorisation entièrement diluée : 285.97M
Sur le graphique en 4 h, le cours se situe juste autour de la MA(7), à 0.0057098, ce qui en fait un niveau clé à surveiller. La MA(25), à 0.0068893, se trouve au-dessus et constitue la prochaine résistance, près de la zone des 0.0067 où le plus haut récent sur 24 h a été atteint. Après la forte chute depuis le sommet de 0.0091, les petites bougies vertes suggèrent que les acheteurs reviennent progressivement, mais la tendance ne s’est pas encore complètement inversée.
À la baisse, la MA(99), proche de 0.0042991, représente le principal support à garder à l’esprit si ce rebond s’essouffle. Le volume s’est également tassé par rapport au pic précédent ; une hausse du volume acheteur aiderait donc à confirmer toute progression. La liquidité est faible, à 1.09M, ce qui peut entraîner de fortes fluctuations du cours dans les deux sens.
Pour l’instant, je surveille si JCT peut se maintenir au-dessus de la MA(7) et progresser vers 0.0067. Une nette cassure au-dessus de cette zone serait le premier signe de vigueur.
#JCT #Janction #CryptoTrading #BinanceAlpha #AltcoinWatch
$JCT
{future}(JCTUSDT)
JCT (Janction) rebondit de 11 % alors que le cours teste une moyenne mobile clé
JCT affiche une belle reprise au cours des dernières 24 heures, s’échangeant à 0.0057232 (+11.26 %) après avoir rebondi depuis un plus bas sur 24 h de 0.0049936 et atteint un plus haut de 0.0067055.
Voici un aperçu rapide des chiffres :
📊 Capitalisation boursière : 65.74M
💧 Volume sur 24 h : 13.64M
👥 Détenteurs : 15,916 on-chain
🔥 Transactions sur 24 h : 114,930
🏷️ Valorisation entièrement diluée : 285.97M
Sur le graphique en 4 h, le cours se situe juste autour de la MA(7), à 0.0057098, ce qui en fait un niveau clé à surveiller. La MA(25), à 0.0068893, se trouve au-dessus et constitue la prochaine résistance, près de la zone des 0.0067 où le plus haut récent sur 24 h a été atteint. Après la forte chute depuis le sommet de 0.0091, les petites bougies vertes suggèrent que les acheteurs reviennent progressivement, mais la tendance ne s’est pas encore complètement inversée.
À la baisse, la MA(99), proche de 0.0042991, représente le principal support à garder à l’esprit si ce rebond s’essouffle. Le volume s’est également tassé par rapport au pic précédent ; une hausse du volume acheteur aiderait donc à confirmer toute progression. La liquidité est faible, à 1.09M, ce qui peut entraîner de fortes fluctuations du cours dans les deux sens.
Pour l’instant, je surveille si JCT peut se maintenir au-dessus de la MA(7) et progresser vers 0.0067. Une nette cassure au-dessus de cette zone serait le premier signe de vigueur.
#JCT #Janction #CryptoTrading #BinanceAlpha #AltcoinWatch
$JCT
38

·
--
🌅 POINT SUR LE MARCHÉ DES CRYPTOMONNAIES : LA PEUR S’INTENSIFIE, MAIS LES OPPORTUNITÉS RESTENT À SURVEILLER !
Le marché des cryptomonnaies entame vendredi sous forte pression, les investisseurs réagissant à de nouvelles préoccupations en matière de sécurité et à l’incertitude générale des marchés.
Le Bitcoin est tombé à son plus bas niveau depuis six semaines, autour de 77 646 $, tandis que l’Ethereum a lui aussi subi une nouvelle pression vendeuse. Par ailleurs, les informations concernant l’enquête de sécurité en cours chez Binance ont ajouté une nouvelle dose d’incertitude sur le marché.
🔎 Liste de surveillance des altcoins
🔹 $NEAR : Les jetons liés à l’IA subissent une pression vendeuse, NEAR figurant parmi les baisses notables.
🔹 $RAY : La faiblesse des actifs liés à la DeFi devient plus visible, les traders réduisant leur exposition au risque.
🔹 $TRX : A fait preuve d’une résilience relative par rapport à plusieurs grands altcoins lors de la précédente séance de marché.
📊 Que devraient surveiller les traders aujourd’hui ?
• La capacité du Bitcoin à se stabiliser après son récent repli. • La poursuite éventuelle de la sous-performance des altcoins. • Les nouvelles concernant la sécurité des plateformes d’échange et la confiance du marché. • Le retour éventuel des acheteurs, avec des volumes plus importants.
💡 Mon point de vue sur le marché : Le moment est venu de se concentrer sur la structure du marché, les volumes et la gestion du risque, plutôt que de courir après les mouvements soudains des prix. Une reprise doit être confirmée, et pas seulement espérée.
❓ **Qu’en pensez-vous ? S’agit-il d’une correction temporaire du marché, ou pourrait-on assister à une nouvelle baisse avant une reprise ?
Partagez votre avis ci-dessous !**
#CryptoMarket #MarketAnalysis #AltcoinWatch #CryptoNews #BinanceSquare
{future}(NEARUSDT)
{future}(RAYSOLUSDT)
{future}(TRXUSDT)
🌅 POINT SUR LE MARCHÉ DES CRYPTOMONNAIES : LA PEUR S’INTENSIFIE, MAIS LES OPPORTUNITÉS RESTENT À SURVEILLER !
Le marché des cryptomonnaies entame vendredi sous forte pression, les investisseurs réagissant à de nouvelles préoccupations en matière de sécurité et à l’incertitude générale des marchés.
Le Bitcoin est tombé à son plus bas niveau depuis six semaines, autour de 77 646 $, tandis que l’Ethereum a lui aussi subi une nouvelle pression vendeuse. Par ailleurs, les informations concernant l’enquête de sécurité en cours chez Binance ont ajouté une nouvelle dose d’incertitude sur le marché.
🔎 Liste de surveillance des altcoins
🔹 $NEAR : Les jetons liés à l’IA subissent une pression vendeuse, NEAR figurant parmi les baisses notables.
🔹 $RAY : La faiblesse des actifs liés à la DeFi devient plus visible, les traders réduisant leur exposition au risque.
🔹 $TRX : A fait preuve d’une résilience relative par rapport à plusieurs grands altcoins lors de la précédente séance de marché.
📊 Que devraient surveiller les traders aujourd’hui ?
• La capacité du Bitcoin à se stabiliser après son récent repli. • La poursuite éventuelle de la sous-performance des altcoins. • Les nouvelles concernant la sécurité des plateformes d’échange et la confiance du marché. • Le retour éventuel des acheteurs, avec des volumes plus importants.
💡 Mon point de vue sur le marché : Le moment est venu de se concentrer sur la structure du marché, les volumes et la gestion du risque, plutôt que de courir après les mouvements soudains des prix. Une reprise doit être confirmée, et pas seulement espérée.
❓ **Qu’en pensez-vous ? S’agit-il d’une correction temporaire du marché, ou pourrait-on assister à une nouvelle baisse avant une reprise ?
Partagez votre avis ci-dessous !**
#CryptoMarket #MarketAnalysis #AltcoinWatch #CryptoNews #BinanceSquare

1
1
229
Voir la traduction
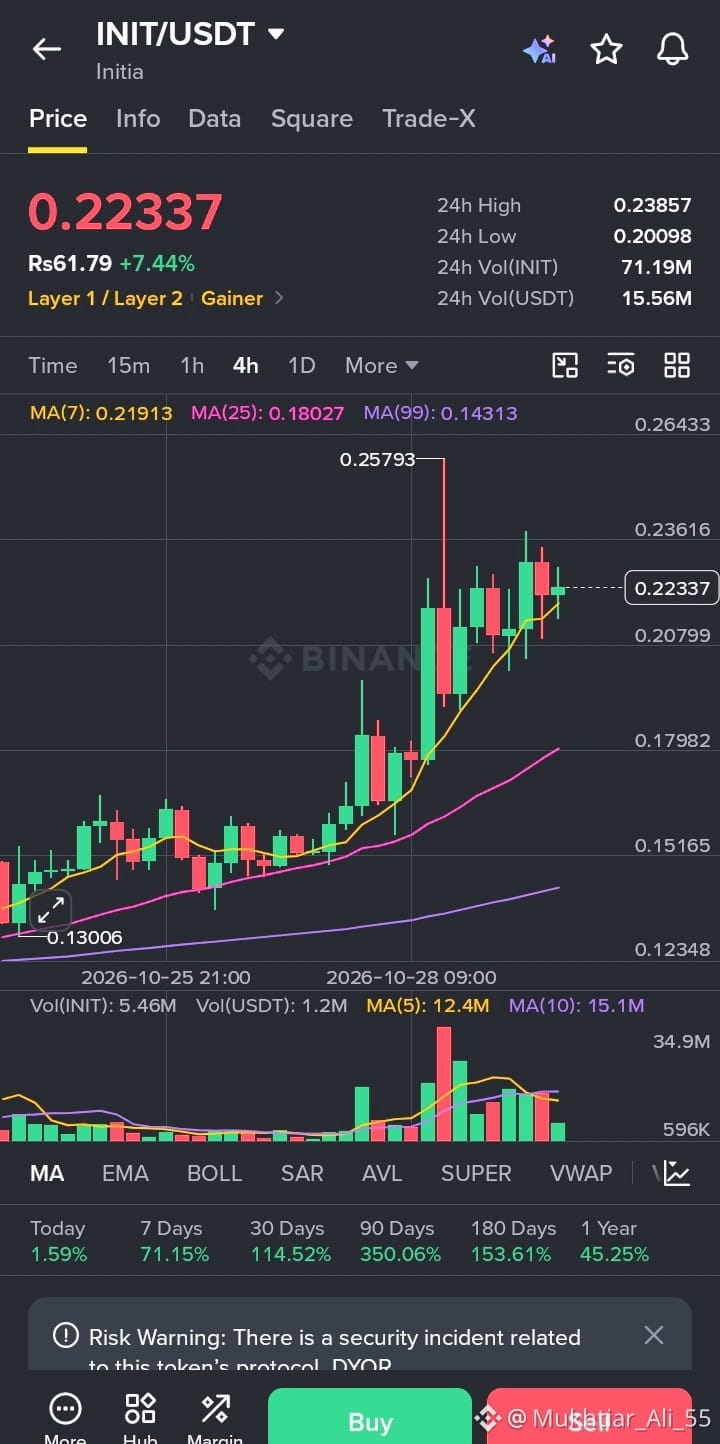
Initia (INIT) Rises 7% in 24 Hours: Here’s What the Chart Shows
INIT is showing up on the Binance gainers list today, and the chart is worth a closer look.
Current snapshot (INIT/USDT):
💰 Price: 0.22337 USDT
📈 24h change: +7.44%
🔺 24h high: 0.23857
🔻 24h low: 0.20098
📊 24h volume: 71.19M INIT (about 15.56M USDT)
What stands out on the 4H chart:
The price climbed steadily from around 0.130, then accelerated with a big green candle that spiked to 0.25793 before sellers pushed it back down. Since then it has been consolidating between roughly 0.208 and 0.236, and the latest candle is holding near 0.22337. Volume peaked at 34.9M on the breakout and has cooled off since, which is normal after a sharp move.
Price is now above the MA(7) at 0.21913, MA(25) at 0.18027 and MA(99) at 0.14313, with all three averages sloping upward. That points to a strong trend, but the long upper wick near 0.25793 shows heavy selling pressure at that level.
Important note:
Binance is displaying a risk warning on this token about a security incident related to its protocol. Check the latest official updates before making any decision.
My take:
Strong trends can continue, but price can also pull back after a fast run. Many traders wait for a retest of support, such as the MA(7) area, before making decisions, and use stop losses to manage risk.
#INIT #Initia #Binance #CryptoMarket #AltcoinWatch
$INIT
{spot}(INITUSDT)
Initia (INIT) Rises 7% in 24 Hours: Here’s What the Chart Shows
INIT is showing up on the Binance gainers list today, and the chart is worth a closer look.
Current snapshot (INIT/USDT):
💰 Price: 0.22337 USDT
📈 24h change: +7.44%
🔺 24h high: 0.23857
🔻 24h low: 0.20098
📊 24h volume: 71.19M INIT (about 15.56M USDT)
What stands out on the 4H chart:
The price climbed steadily from around 0.130, then accelerated with a big green candle that spiked to 0.25793 before sellers pushed it back down. Since then it has been consolidating between roughly 0.208 and 0.236, and the latest candle is holding near 0.22337. Volume peaked at 34.9M on the breakout and has cooled off since, which is normal after a sharp move.
Price is now above the MA(7) at 0.21913, MA(25) at 0.18027 and MA(99) at 0.14313, with all three averages sloping upward. That points to a strong trend, but the long upper wick near 0.25793 shows heavy selling pressure at that level.
Important note:
Binance is displaying a risk warning on this token about a security incident related to its protocol. Check the latest official updates before making any decision.
My take:
Strong trends can continue, but price can also pull back after a fast run. Many traders wait for a retest of support, such as the MA(7) area, before making decisions, and use stop losses to manage risk.
#INIT #Initia #Binance #CryptoMarket #AltcoinWatch
$INIT
5
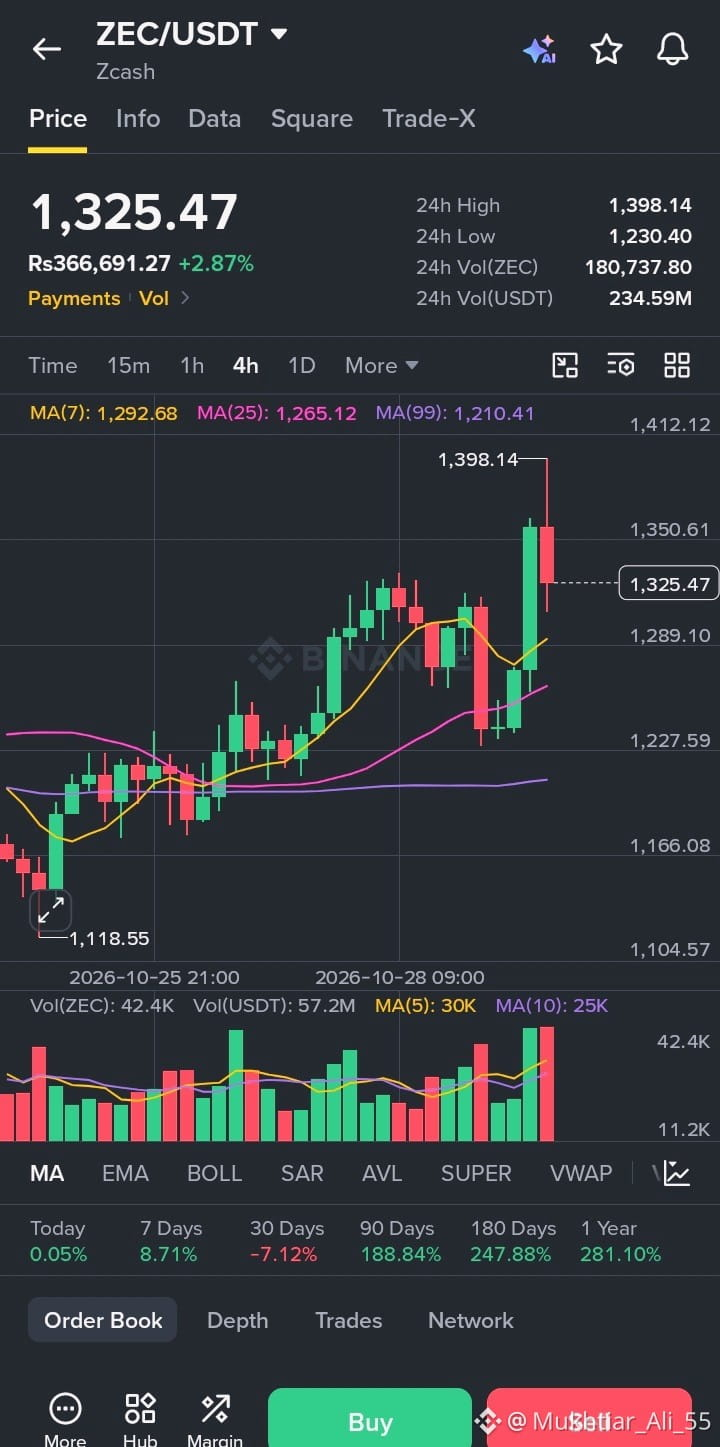
Zcash (ZEC) se maintient au-dessus de 1 300 après une hausse de 2,87 % : voici ce que montre le graphique
ZEC affiche une forte activité sur Binance aujourd’hui, et le graphique mérite un examen plus attentif.
Aperçu actuel (ZEC/USDT) :
💰 Prix : 1 325.47 USDT
📈 Variation sur 24 h : +2.87 %
🔺 Plus haut sur 24 h : 1 398.14
🔻 Plus bas sur 24 h : 1 230.40
📊 Volume sur 24 h : 180,737.80 ZEC (environ 234.59M USDT)
Ce qui ressort sur le graphique en 4 h :
Le prix progresse régulièrement en formant des paliers depuis environ 1,118, avec des creux de plus en plus hauts. Après un repli vers 1,230, les acheteurs sont revenus et une forte bougie verte l’a propulsé à 1,398.14. Les vendeurs sont apparus au sommet, et la dernière bougie est retombée à 1,325.47. Le volume des deux dernières bougies a atteint 42.4K, bien au-dessus de la moyenne récente : ce mouvement s’accompagne donc d’une réelle activité.
Le prix se situe désormais au-dessus de la MM(7) à 1,292.68, de la MM(25) à 1,265.12 et de la MM(99) à 1,210.41, les trois moyennes étant orientées à la hausse. Cela indique une tendance saine, même si la longue mèche supérieure près de 1,398 témoigne d’une pression vendeuse à ce niveau.
Mon avis :
Une telle tendance peut se poursuivre, mais le prix peut aussi se consolider ou se replier après une forte poussée vers un nouveau sommet. De nombreux traders attendent un nouveau test d’un niveau de support, comme la zone de la MM(7), avant de prendre une décision, et utilisent des ordres stop-loss pour gérer le risque.
#ZEC #Zcash #Binance #CryptoMarket #AltcoinWatch
$ZEC
{spot}(ZECUSDT)
Zcash (ZEC) se maintient au-dessus de 1 300 après une hausse de 2,87 % : voici ce que montre le graphique
ZEC affiche une forte activité sur Binance aujourd’hui, et le graphique mérite un examen plus attentif.
Aperçu actuel (ZEC/USDT) :
💰 Prix : 1 325.47 USDT
📈 Variation sur 24 h : +2.87 %
🔺 Plus haut sur 24 h : 1 398.14
🔻 Plus bas sur 24 h : 1 230.40
📊 Volume sur 24 h : 180,737.80 ZEC (environ 234.59M USDT)
Ce qui ressort sur le graphique en 4 h :
Le prix progresse régulièrement en formant des paliers depuis environ 1,118, avec des creux de plus en plus hauts. Après un repli vers 1,230, les acheteurs sont revenus et une forte bougie verte l’a propulsé à 1,398.14. Les vendeurs sont apparus au sommet, et la dernière bougie est retombée à 1,325.47. Le volume des deux dernières bougies a atteint 42.4K, bien au-dessus de la moyenne récente : ce mouvement s’accompagne donc d’une réelle activité.
Le prix se situe désormais au-dessus de la MM(7) à 1,292.68, de la MM(25) à 1,265.12 et de la MM(99) à 1,210.41, les trois moyennes étant orientées à la hausse. Cela indique une tendance saine, même si la longue mèche supérieure près de 1,398 témoigne d’une pression vendeuse à ce niveau.
Mon avis :
Une telle tendance peut se poursuivre, mais le prix peut aussi se consolider ou se replier après une forte poussée vers un nouveau sommet. De nombreux traders attendent un nouveau test d’un niveau de support, comme la zone de la MM(7), avant de prendre une décision, et utilisent des ordres stop-loss pour gérer le risque.
#ZEC #Zcash #Binance #CryptoMarket #AltcoinWatch
$ZEC
5
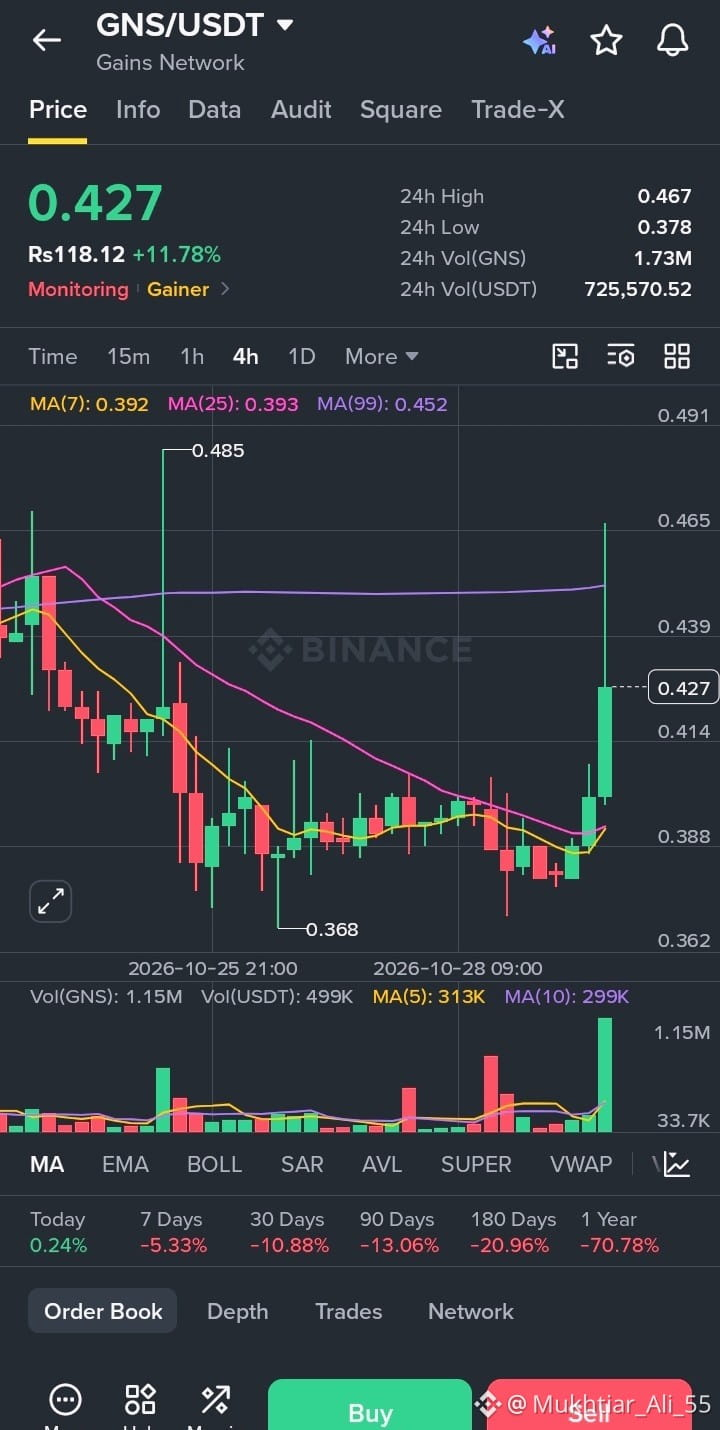
Gains Network (GNS) gagne 11 % en 24 heures : voici ce que montre le graphique
GNS figure aujourd’hui dans la liste des plus fortes hausses de Binance, et ce mouvement mérite qu’on s’y attarde.
Aperçu actuel (GNS/USDT) :
💰 Prix : 0.427 USDT
📈 Variation sur 24 h : +11.78 %
🔺 Plus haut sur 24 h : 0.467
🔻 Plus bas sur 24 h : 0.378
📊 Volume sur 24 h : 1.73M GNS (environ 725.57K USDT)
Ce qui ressort sur le graphique en 4 h :
Le prix a baissé pendant plusieurs jours, puis a évolué latéralement entre environ 0.368 et 0.410, avant qu’une forte bougie verte ne le propulse à 0.465, puis qu’il se stabilise près de 0.427. Le volume a grimpé à 1.15M sur cette bougie, bien au-dessus de la moyenne récente : ce mouvement a donc été soutenu par une participation réelle.
Le prix se situe désormais au-dessus de la MA(7) à 0.392 et de la MA(25) à 0.393, mais reste sous la MA(99) à 0.452. De nombreux traders surveillent de près la reconquête de ce niveau. La longue mèche supérieure près de 0.465 montre également qu’il y a eu une pression vendeuse à ce niveau.
Mon avis :
Les rebonds de ce type peuvent se poursuivre, mais ils peuvent aussi s’essouffler lorsque les premiers acheteurs prennent leurs bénéfices, surtout si la tendance à plus long terme reste baissière. De nombreux traders attendent une consolidation ou un nouveau test du support avant de prendre une décision, et utilisent des ordres stop-loss pour gérer le risque.
#GNS #GainsNetwork #Binance #CryptoMarket #AltcoinWatch
$GNS
{spot}(GNSUSDT)
Gains Network (GNS) gagne 11 % en 24 heures : voici ce que montre le graphique
GNS figure aujourd’hui dans la liste des plus fortes hausses de Binance, et ce mouvement mérite qu’on s’y attarde.
Aperçu actuel (GNS/USDT) :
💰 Prix : 0.427 USDT
📈 Variation sur 24 h : +11.78 %
🔺 Plus haut sur 24 h : 0.467
🔻 Plus bas sur 24 h : 0.378
📊 Volume sur 24 h : 1.73M GNS (environ 725.57K USDT)
Ce qui ressort sur le graphique en 4 h :
Le prix a baissé pendant plusieurs jours, puis a évolué latéralement entre environ 0.368 et 0.410, avant qu’une forte bougie verte ne le propulse à 0.465, puis qu’il se stabilise près de 0.427. Le volume a grimpé à 1.15M sur cette bougie, bien au-dessus de la moyenne récente : ce mouvement a donc été soutenu par une participation réelle.
Le prix se situe désormais au-dessus de la MA(7) à 0.392 et de la MA(25) à 0.393, mais reste sous la MA(99) à 0.452. De nombreux traders surveillent de près la reconquête de ce niveau. La longue mèche supérieure près de 0.465 montre également qu’il y a eu une pression vendeuse à ce niveau.
Mon avis :
Les rebonds de ce type peuvent se poursuivre, mais ils peuvent aussi s’essouffler lorsque les premiers acheteurs prennent leurs bénéfices, surtout si la tendance à plus long terme reste baissière. De nombreux traders attendent une consolidation ou un nouveau test du support avant de prendre une décision, et utilisent des ordres stop-loss pour gérer le risque.
#GNS #GainsNetwork #Binance #CryptoMarket #AltcoinWatch
$GNS
8
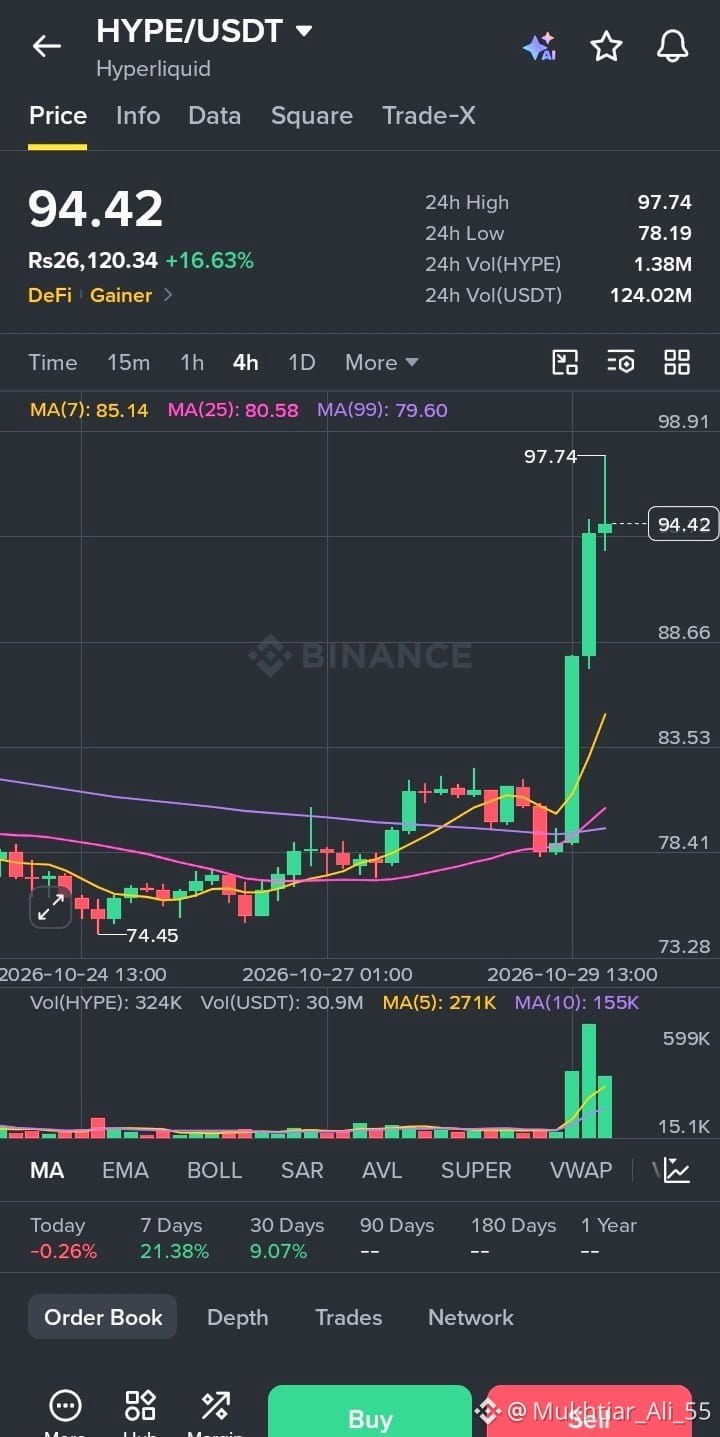
Hyperliquid (HYPE) grimpe de 16 % en 24 heures : voici ce que montre le graphique
HYPE figure aujourd’hui parmi les plus fortes hausses sur Binance, et ce mouvement mérite qu’on s’y intéresse de plus près.
Aperçu actuel (HYPE/USDT) :
💰 Prix : 94.42 USDT
📈 Variation sur 24 h : +16.63 %
🔺 Plus haut sur 24 h : 97.74
🔻 Plus bas sur 24 h : 78.19
📊 Volume sur 24 h : 1.38M HYPE (environ 124.02M USDT)
Ce qui ressort du graphique en 4 h :
Le cours a évolué latéralement pendant plusieurs jours entre environ 74 et 83, puis une série de fortes bougies vertes l’a propulsé jusqu’à 97.74, avant un repli à 94.42. Le volume a atteint 599K sur la plus grande bougie, bien au-dessus de la moyenne récente : ce mouvement a donc été soutenu par une réelle participation du marché.
Le cours se situe désormais bien au-dessus de la MA(7) à 85.14, de la MA(25) à 80.58 et de la MA(99) à 79.60. Cela témoigne d’un fort momentum à court terme, mais signifie aussi que le cours s’est éloigné de ses moyennes. La petite mèche supérieure près de 97.74 indique une certaine pression vendeuse à ce niveau.
Mon avis :
Une tendance aussi forte peut se poursuivre, mais elle peut aussi s’inverser à mesure que les premiers acheteurs prennent leurs bénéfices. De nombreux traders attendent une consolidation ou un nouveau test du support avant de prendre une décision, et utilisent des ordres stop-loss pour gérer le risque.
#HYPE #Hyperliquid #Binance #CryptoMarket #AltcoinWatch
$HYPE
{spot}(HYPEUSDT)
Hyperliquid (HYPE) grimpe de 16 % en 24 heures : voici ce que montre le graphique
HYPE figure aujourd’hui parmi les plus fortes hausses sur Binance, et ce mouvement mérite qu’on s’y intéresse de plus près.
Aperçu actuel (HYPE/USDT) :
💰 Prix : 94.42 USDT
📈 Variation sur 24 h : +16.63 %
🔺 Plus haut sur 24 h : 97.74
🔻 Plus bas sur 24 h : 78.19
📊 Volume sur 24 h : 1.38M HYPE (environ 124.02M USDT)
Ce qui ressort du graphique en 4 h :
Le cours a évolué latéralement pendant plusieurs jours entre environ 74 et 83, puis une série de fortes bougies vertes l’a propulsé jusqu’à 97.74, avant un repli à 94.42. Le volume a atteint 599K sur la plus grande bougie, bien au-dessus de la moyenne récente : ce mouvement a donc été soutenu par une réelle participation du marché.
Le cours se situe désormais bien au-dessus de la MA(7) à 85.14, de la MA(25) à 80.58 et de la MA(99) à 79.60. Cela témoigne d’un fort momentum à court terme, mais signifie aussi que le cours s’est éloigné de ses moyennes. La petite mèche supérieure près de 97.74 indique une certaine pression vendeuse à ce niveau.
Mon avis :
Une tendance aussi forte peut se poursuivre, mais elle peut aussi s’inverser à mesure que les premiers acheteurs prennent leurs bénéfices. De nombreux traders attendent une consolidation ou un nouveau test du support avant de prendre une décision, et utilisent des ordres stop-loss pour gérer le risque.
#HYPE #Hyperliquid #Binance #CryptoMarket #AltcoinWatch
$HYPE
6
Voir la traduction
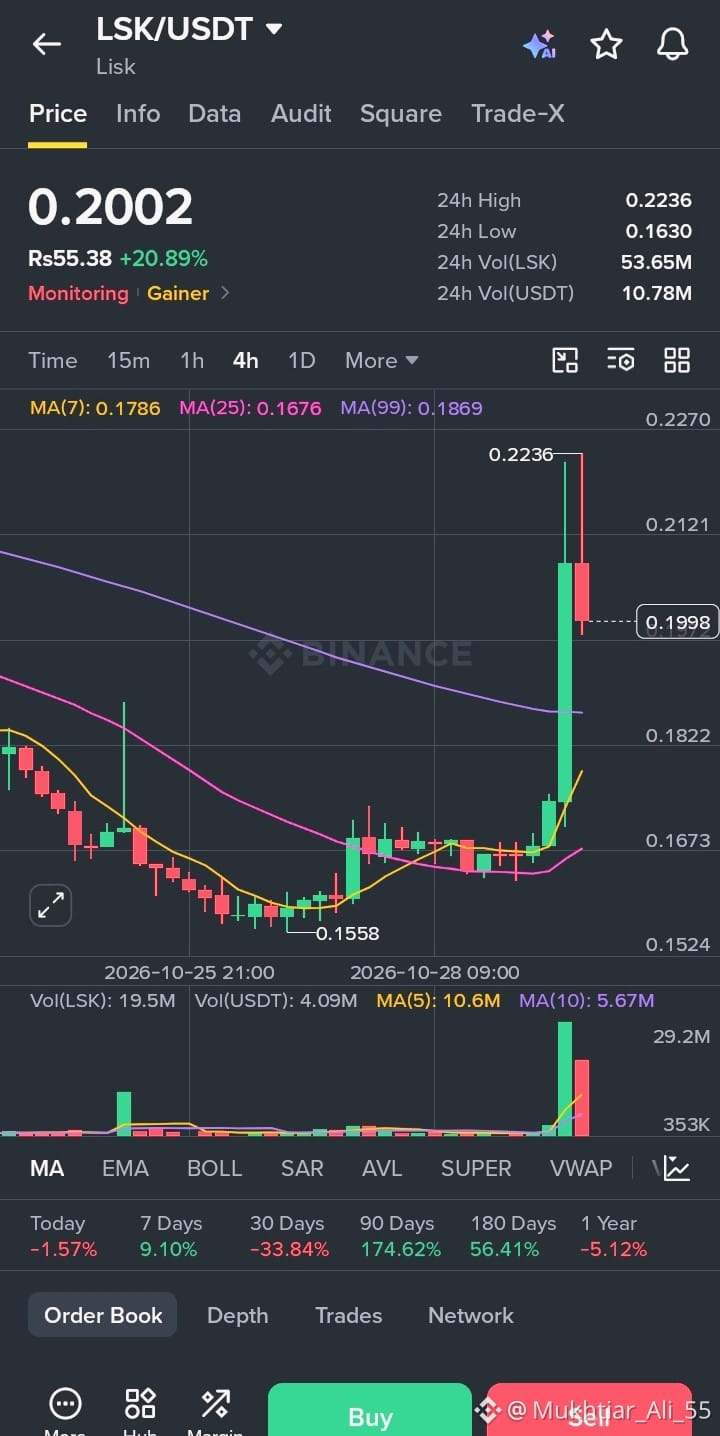
Lisk (LSK) Surges 20% in 24 Hours: Here’s What the Chart Shows
LSK is showing up on the Binance gainers list today, and the move is worth a closer look.
Current snapshot (LSK/USDT):
💰 Price: 0.2002 USDT
📈 24h change: +20.89%
🔺 24h high: 0.2236
🔻 24h low: 0.1630
📊 24h volume: 53.65M LSK (about 10.78M USDT)
What stands out on the 4H chart:
The price spent several days drifting lower and then moving sideways around 0.155 to 0.170, before a strong green candle pushed it up to 0.2236. Sellers stepped in at the top, and the next candle pulled back toward 0.1998. Volume spiked to 29.2M on the breakout candle, far above the recent average, so this move had real participation behind it.
Price is now above the MA(7) at 0.1786, MA(25) at 0.1676 and the MA(99) at 0.1869. Reclaiming the MA(99) is something many traders watch closely, but the long upper wick near 0.2236 also shows there was selling pressure at that level.
My take:
Breakouts like this can follow through, but they can also retrace as early buyers take profit. Many traders wait for consolidation or a retest of support before making decisions, and use stop losses to manage risk.
#LSK #Lisk #Binance #CryptoMarket #AltcoinWatch
$LSK
{spot}(LSKUSDT)
Lisk (LSK) Surges 20% in 24 Hours: Here’s What the Chart Shows
LSK is showing up on the Binance gainers list today, and the move is worth a closer look.
Current snapshot (LSK/USDT):
💰 Price: 0.2002 USDT
📈 24h change: +20.89%
🔺 24h high: 0.2236
🔻 24h low: 0.1630
📊 24h volume: 53.65M LSK (about 10.78M USDT)
What stands out on the 4H chart:
The price spent several days drifting lower and then moving sideways around 0.155 to 0.170, before a strong green candle pushed it up to 0.2236. Sellers stepped in at the top, and the next candle pulled back toward 0.1998. Volume spiked to 29.2M on the breakout candle, far above the recent average, so this move had real participation behind it.
Price is now above the MA(7) at 0.1786, MA(25) at 0.1676 and the MA(99) at 0.1869. Reclaiming the MA(99) is something many traders watch closely, but the long upper wick near 0.2236 also shows there was selling pressure at that level.
My take:
Breakouts like this can follow through, but they can also retrace as early buyers take profit. Many traders wait for consolidation or a retest of support before making decisions, and use stop losses to manage risk.
#LSK #Lisk #Binance #CryptoMarket #AltcoinWatch
$LSK
4
Voir la traduction
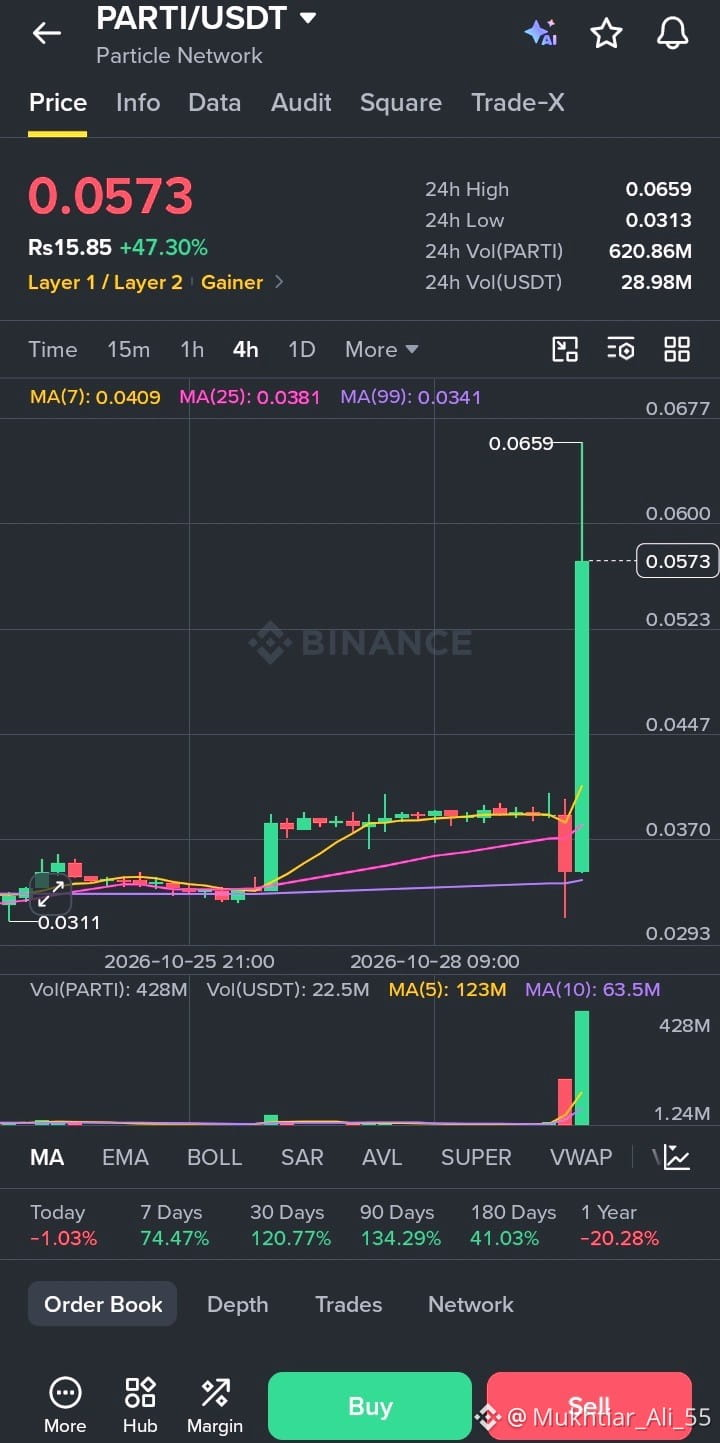
Particle Network (PARTI) Jumps 47% in 24 Hours: Here’s What the Chart Shows
PARTI is one of the top gainers on Binance today, and the numbers are worth a closer look.
Current snapshot (PARTI/USDT):
💰 Price: 0.0573 USDT
📈 24h change: +47.30%
🔺 24h high: 0.0659
🔻 24h low: 0.0313
📊 24h volume: 620.86M PARTI (about 28.98M USDT)
What stands out on the 4H chart:
The price spent days moving sideways between roughly 0.031 and 0.039, then a single huge green candle pushed it up to 0.0659 before pulling back to 0.0573. Volume jumped to 428M on that candle, far above the recent average, so this move had real participation behind it.
Price is now well above the MA(7) at 0.0409, MA(25) at 0.0381 and MA(99) at 0.0341. That shows strong short term momentum, but it also means price is stretched far from its averages.
My take:
Sharp vertical moves like this can continue, but they can also retrace quickly, especially after a long upper wick like the one at 0.0659. Many traders wait for consolidation or a retest of support before making decisions, and use stop losses to manage risk.
#PARTI #ParticleNetwork #Binance #CryptoMarket #AltcoinWatch
$PARTI
{spot}(PARTIUSDT)
Particle Network (PARTI) Jumps 47% in 24 Hours: Here’s What the Chart Shows
PARTI is one of the top gainers on Binance today, and the numbers are worth a closer look.
Current snapshot (PARTI/USDT):
💰 Price: 0.0573 USDT
📈 24h change: +47.30%
🔺 24h high: 0.0659
🔻 24h low: 0.0313
📊 24h volume: 620.86M PARTI (about 28.98M USDT)
What stands out on the 4H chart:
The price spent days moving sideways between roughly 0.031 and 0.039, then a single huge green candle pushed it up to 0.0659 before pulling back to 0.0573. Volume jumped to 428M on that candle, far above the recent average, so this move had real participation behind it.
Price is now well above the MA(7) at 0.0409, MA(25) at 0.0381 and MA(99) at 0.0341. That shows strong short term momentum, but it also means price is stretched far from its averages.
My take:
Sharp vertical moves like this can continue, but they can also retrace quickly, especially after a long upper wick like the one at 0.0659. Many traders wait for consolidation or a retest of support before making decisions, and use stop losses to manage risk.
#PARTI #ParticleNetwork #Binance #CryptoMarket #AltcoinWatch
$PARTI
10

·
--
🚨🔥 $AIN /USDT — UN SHORT SQUEEZE POURRAIT-IL SE PRODUIRE ?
$AIN traders, le marché devient intéressant ! 👀📊
Les dernières données sur les contrats à terme montrent :
💰 Le prix oscille autour de 0,143–0,146 $
📉 Le prix a baissé au cours des dernières 24 heures
⚡ Le taux de financement reste positif
📊 L’intérêt ouvert a diminué
Voici le hic : les positions vendeuses ont également subi des liquidations. Cela signifie qu’un mouvement soudain dans un sens ou dans l’autre pourrait prendre au dépourvu les traders trop confiants.
🟢 SURVEILLANCE HAUSSIÈRE
Une cassure confirmée au-dessus de 0,1547 pourrait mettre 0,1590 en ligne de mire.
🔴 SURVEILLANCE BAISSIÈRE
Une cassure sous 0,1419 pourrait exposer le cours à 0,1356.
🧠 LA STRATÉGIE :
Ne faites pas de prédictions à l’aveugle. Observez l’évolution du prix, le volume et les confirmations avant de prendre une décision.
💬 DONNEZ-NOUS VOTRE AVIS !
$AIN peut-il provoquer un short squeeze, ou les vendeurs prendront-ils le contrôle ?
🟢 SHORT SQUEEZE
🔴 BAISSE SUPPLÉMENTAIRE
Commentez ci-dessous 👇
❤️ J’aime | 🔁 Partager | ➕ Suivre pour plus d’actualités sur le marché des cryptos !
#AIN #AINUSDT #ShortSqueeze #CryptoTrading #AltcoinWatch #BinanceSquare #MarketSentiment #TradeSmart
80
·
--
🚨 $AIN /USDT — LE PROCHAIN GRAND MOUVEMENT ? 👀
$AIN est à un point critique ! 📉🔥
Après une forte hausse, la volatilité reste élevée. Les acheteurs défendront-ils le support, ou les vendeurs feront-ils baisser le prix ?
📊 NIVEAUX CLÉS À SURVEILLER
🟢 Signal haussier : franchir et se maintenir au-dessus de 0,1540 $
🎯 À surveiller : 0,1590 $ → 0,1630 $
🔴 Signal baissier : passer sous 0,1410 $
🎯 À surveiller : 0,1350 $ → 0,1270 $
⚠️ Le taux de financement des contrats à terme est élevé : le trading avec effet de levier peut donc coûter cher. N'entrez pas en position simplement parce qu'une bougie semble prometteuse !
🧠 La patience vaut mieux que la peur de rater une occasion. Attendez une confirmation.
💬 UNE QUESTION POUR LES TRADERS AIN :
Qu'est-ce qui compte le plus en ce moment ?
🟢 CONFIRMATION DE LA CASSURE À LA HAUSSE
🔴 CASSURE DU SUPPORT
Donnez votre avis en commentaire ! 👇
❤️ J'aime | 🔁 Partager | ➕ Suivre pour plus d'actualités sur le marché des cryptos.
#AIN #AINUSDT #CryptoAnalysis #AltcoinWatch #BinanceSquare #PriceAction #CryptoTrading #RiskManagement
91
·
--
🚨🔥 $AIN /USDT — ALERTE DE CHANGEMENT DE TENDANCE !
⚡ $AIN se prépare-t-il à rebondir une nouvelle fois, ou ne s’agit-il que d’un rebond temporaire ?
📊 🟢 CONFIGURATION HAUSSIÈRE
Déclencheur d’entrée : franchissement et maintien au-dessus de $0.1540
🎯 TP1 : $0.1590
🎯 TP2 : $0.1627
🔴 CONFIGURATION BAISSIÈRE
Déclencheur d’entrée : passage sous $0.1410
🎯 TP1 : $0.1362
🎯 TP2 : $0.1270
🧠 LES POINTS IMPORTANTS
• Un taux de financement positif signifie que les positions longues rémunèrent les positions courtes.
• L’intérêt ouvert a récemment diminué.
• Une cassure nécessite un volume important et une clôture de bougie confirmée.
⚠️ N’entrez pas entre les niveaux de déclenchement simplement parce que le prix bouge. Il s’agit de scénarios conditionnels, pas de profits garantis. Définissez votre risque avant de trader.
💬 COMMUNAUTÉ AIN — QUELLE EST VOTRE PROCHAINE ÉTAPE ?
🚀 REPRISE ou 📉 NOUVELLE BAISSE ?
#AIN #AINUSDT #CryptoMomentum #AltcoinWatch #MarketBreakout #FuturesInsights #PriceAction #TradeSmart
83

·
--
Voir la traduction
📊 THREE NAMES FOR YOUR RESEARCH LIST!
Injective ($INJ ) focuses on financial applications, Sei ($SEI ) targets trading-oriented blockchain infrastructure, and Celestia ($TIA ) develops modular data availability technology. Strong narratives are interesting, but execution matters most.
#Injective #SEİ #Celestia #CryptoResearch #AltcoinWatch
1
25

·
--
💥 $KAT EST EN HAUSSE — LA TENDANCE VA-T-ELLE SE POURSUIVRE ?
Prix actuel : $0.00457
Variation sur 24 h : +6.78 %
Katana affiche une évolution positive, le KAT ayant gagné près de 7 % lors du dernier point sur le marché.
• Les acheteurs poussent actuellement le prix à la hausse.
• Surveillez une hausse du volume et la poursuite de l’intérêt des acheteurs.
• Si la tendance s’essouffle, une correction des prix pourrait suivre.
Mon avis : $KAT mérite qu’on s’y intéresse, mais le prochain mouvement compte davantage que le pourcentage journalier. Attendez une confirmation plutôt que d’acheter sous le coup de l’enthousiasme.
#KAT #Katana #CryptoUpdate #AltcoinWatch
1
419
Connectez-vous pour découvrir plus de contenu
Rejoignez la communauté mondiale des adeptes de cryptomonnaies sur Binance Square
⚡️ Suviez les dernières informations importantes sur les cryptomonnaies.
💬 Jugé digne de confiance par la plus grande plateforme d’échange de cryptomonnaies au monde.
👍 Découvrez les connaissances que partagent les créateurs vérifiés.
Adresse e-mail/Nº de téléphone
Sujets d’actualité
1
#UniswapA16zSeekDeFiExemptionFromIllinoisCryptoTax
22,332 vues
715 mentions
2
#HKDollarStablecoinHKDAPToLaunchOnSolana
16,702 vues
449 mentions
3
#$1.5BInLeveragedCryptoBetsLiquidated
36,356 vues
240 mentions
4
#TrezorSaysCryptoBilisSoldWalletMayContainMaliciousComponents
2,483 vues
65 mentions
5
#KOSPIFalls3.53%BackBelow6000
60,479 vues
1,073 mentions
6
#AmazonSharesFallAbout7%InPremarketTrading
27,314 vues
573 mentions
7
#USMidtermElections
236,649 vues
2,334 mentions
8
#StrategySTRCReaches$99.95ForFirstTimeIn165Days
23,199 vues
93 mentions
9
#BinanceWillListPredictPREDICT
90,029 vues
1,374 mentions
10
#SwitzerlandFirstSpotBitcoinETFExpectedToTradeInNovember
3,049 vues
107 mentions