

Crypto Signals and Analysis
73 Publications
Crypto Signals and Analysis
Signaler
Bloquer l’utilisateur
Crypto trading signals and market analysis. We identify key levels, clear entry points, and defined targets with a disciplined focus on risk management.
Ouvert au trading
Trade régulièrement
3.4 an(s)
2 Suivis
39 Abonnés
56 J’aime
Publications
Portefeuille
$LTC Holds Gains as Crypto Goes Quiet at the Asian Open: Bitcoin Stuck at 81K 📰
🕒 Updated: Oct 29, 00:52 UTC
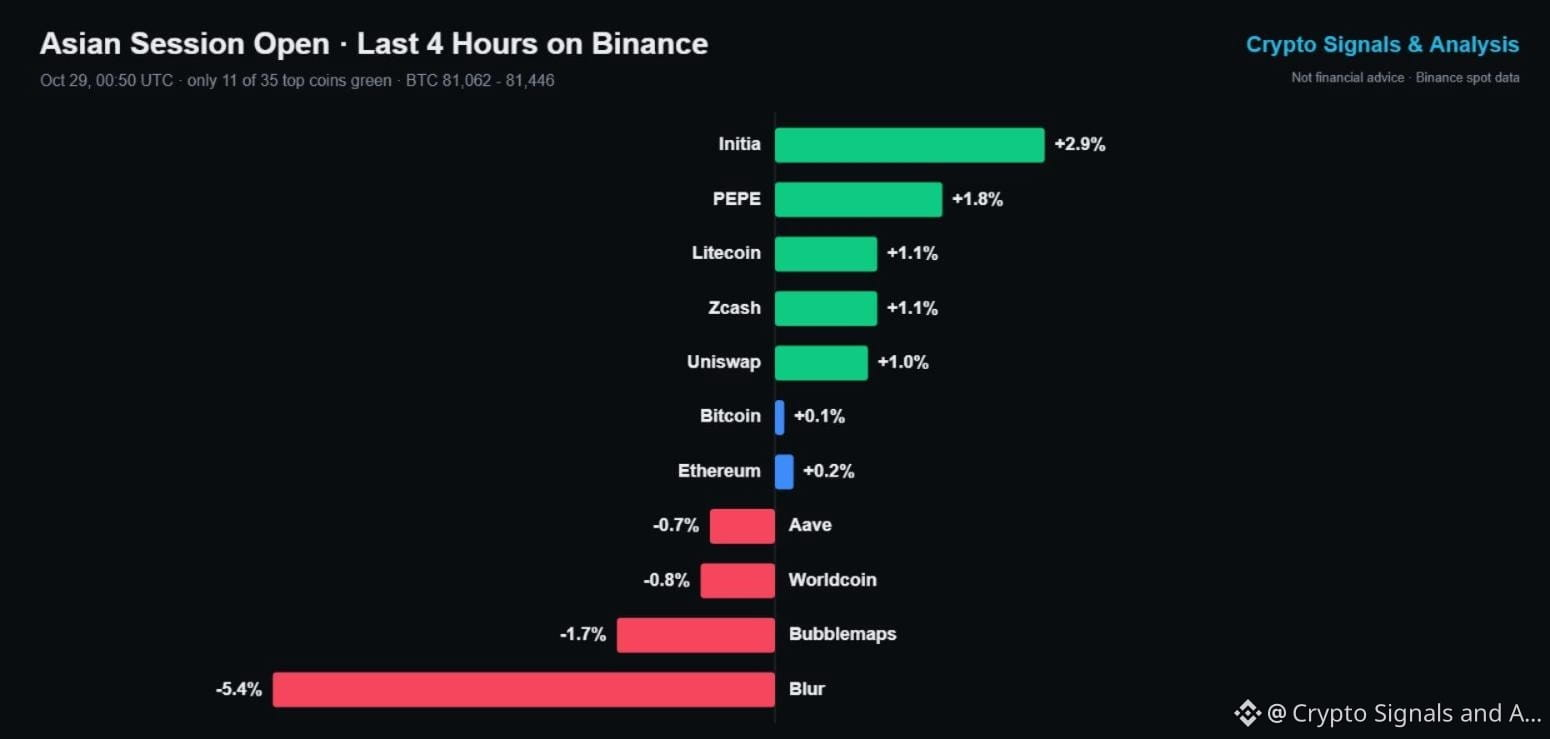
Yesterday's altcoin bounce is losing steam. Over the last 4 hours only 11 of the 35 most-traded coins on Binance are green, and Bitcoin has moved just 0.5% (81,062 - 81,446).
📰 WHAT'S MOVING NOW
🟢 Initia (+2.9%) and PEPE (+1.8%) are still pushing after their big Oct 28 runs.
🟢 Litecoin (+1.1%) keeps grinding higher and is now near 59.4, up 4-5% over the past day.
🔴 Blur (-5.4%) is giving back part of yesterday's 16% pump.
🟠 Bitcoin and Ethereum are flat, with Ethereum near 2,357.
👀 WHAT TO WATCH
Low-volume Asian hours often set up the next big move. If Bitcoin breaks out of its 80,400 - 81,800 range, small caps usually follow in the same direction. Until then, expect pumps like Blur's to fade.
💡 Bottom line: quiet market, tight ranges. Patience beats chasing tonight.
👉 Tap $LTC
to open the live chart. NFA
🔥 NEW TO BINANCE?
✅ No Binance account yet? Sign up with referral code SQUAREGINOS and get a 10% kickback on your Futures trading fees.
👇👇👇
{spot}(LTCUSDT)
[Sign up on Binance here (10% Futures fee kickback)](https://www.binance.com/join?ref=SQUAREGINOS)
━━━━━━━━━━
Are you trading the Asian session or waiting for the breakout? 👇
Follow Crypto Signals and Analysis for live market updates.
#cryptosignals #Litecoin #FOMCWatch
⚠️ Crypto is volatile: risk only what you can afford to lose.
$LTC Holds Gains as Crypto Goes Quiet at the Asian Open: Bitcoin Stuck at 81K 📰
🕒 Updated: Oct 29, 00:52 UTC
Yesterday's altcoin bounce is losing steam. Over the last 4 hours only 11 of the 35 most-traded coins on Binance are green, and Bitcoin has moved just 0.5% (81,062 - 81,446).
📰 WHAT'S MOVING NOW
🟢 Initia (+2.9%) and PEPE (+1.8%) are still pushing after their big Oct 28 runs.
🟢 Litecoin (+1.1%) keeps grinding higher and is now near 59.4, up 4-5% over the past day.
🔴 Blur (-5.4%) is giving back part of yesterday's 16% pump.
🟠 Bitcoin and Ethereum are flat, with Ethereum near 2,357.
👀 WHAT TO WATCH
Low-volume Asian hours often set up the next big move. If Bitcoin breaks out of its 80,400 - 81,800 range, small caps usually follow in the same direction. Until then, expect pumps like Blur's to fade.
💡 Bottom line: quiet market, tight ranges. Patience beats chasing tonight.
👉 Tap $LTC
to open the live chart. NFA
🔥 NEW TO BINANCE?
✅ No Binance account yet? Sign up with referral code SQUAREGINOS and get a 10% kickback on your Futures trading fees.
👇👇👇
Sign up on Binance here (10% Futures fee kickback)
━━━━━━━━━━
Are you trading the Asian session or waiting for the breakout? 👇
Follow Crypto Signals and Analysis for live market updates.
#cryptosignals #Litecoin #FOMCWatch
⚠️ Crypto is volatile: risk only what you can afford to lose.
29
·
--
Haussier
$DOGE Price Prediction Today (Oct 29): Dogecoin Crypto Signal & Technical Analysis 📊
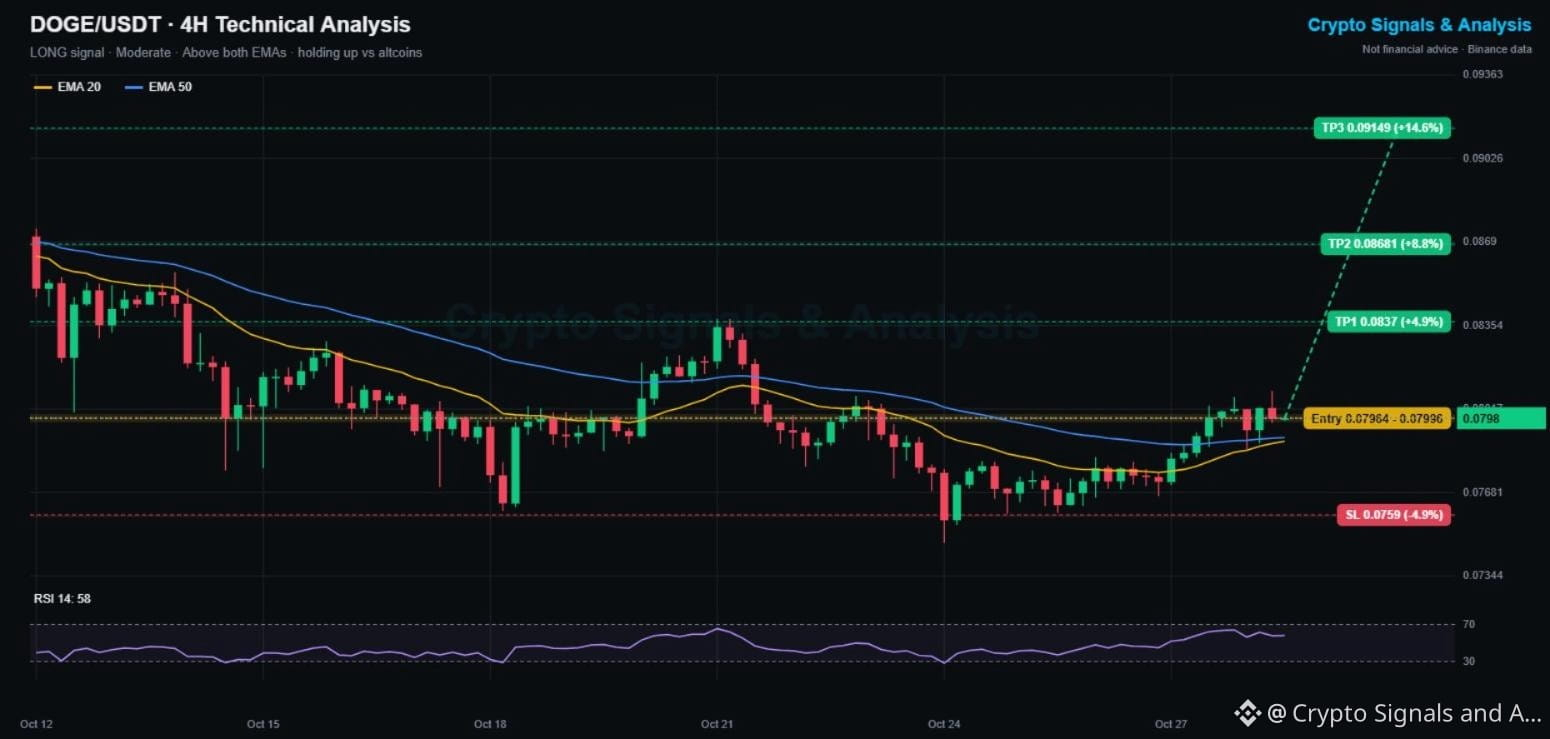
🟢 LONG | Entry 0.07964 - 0.07996 | TP1 0.0837 | SL 0.0759
👉 Tap $DOGE to place your trade fast
🕒 Updated: Oct 29, 00:35 UTC · price 0.0798
Dogecoin is almost flat on the week (-0.7%) while most large altcoins are down 5-10%. Since the Oct 24 low at 0.0748 it has made higher lows and is now trading above both 4H moving averages.
📌 DOGECOIN TRADING SIGNAL (Moderate, 4/5 signals agree)
Entry: 0.07964 - 0.07996
Take profit 1: 0.0837 (+4.9%)
Take profit 2: 0.0868 (+8.8%)
Take profit 3: 0.0915 (+14.6%)
Stop loss: 0.0759 (-4.9%)
📊 DOGE TECHNICAL ANALYSIS (4H CHART)
Price is above the EMA20 (0.0789) and EMA50 (0.0790), and the EMA20 is rising. RSI 58 favors buyers. The weak spot: 0.0809 rejected price twice in the last day.
🔑 KEY LEVELS
Support: 0.0789 (EMAs), then 0.0760
Resistance: 0.0809, then 0.0837 (Oct 21 high)
📈 Bullish scenario: a 4H close above 0.0809 opens TP1 at 0.0837.
📉 Bearish scenario: losing the EMAs puts 0.0760 back in play. A close under 0.0759 cancels this signal.
💡 Bottom line: relative strength is on Dogecoin's side. The trigger is a clean break of 0.0809.
👉 Tap $DOGE
to open the live chart. NFA
🔥 NEW TO BINANCE?
✅ No Binance account yet? Sign up with referral code SQUAREGINOS and get a 10% kickback on your Futures trading fees.
👇👇👇
{spot}(DOGEUSDT)
[Sign up on Binance here (10% Futures fee kickback)](https://www.binance.com/join?ref=SQUAREGINOS)
━━━━━━━━━━
Does Dogecoin finally break 0.081 this week? 👇
Follow Crypto Signals and Analysis for daily signals.
#cryptosignals #DOGE #FOMCWatch
⚠️ Crypto is volatile: risk only what you can afford to lose.
$DOGE Price Prediction Today (Oct 29): Dogecoin Crypto Signal & Technical Analysis 📊
🟢 LONG | Entry 0.07964 - 0.07996 | TP1 0.0837 | SL 0.0759
👉 Tap $DOGE to place your trade fast
🕒 Updated: Oct 29, 00:35 UTC · price 0.0798
Dogecoin is almost flat on the week (-0.7%) while most large altcoins are down 5-10%. Since the Oct 24 low at 0.0748 it has made higher lows and is now trading above both 4H moving averages.
📌 DOGECOIN TRADING SIGNAL (Moderate, 4/5 signals agree)
Entry: 0.07964 - 0.07996
Take profit 1: 0.0837 (+4.9%)
Take profit 2: 0.0868 (+8.8%)
Take profit 3: 0.0915 (+14.6%)
Stop loss: 0.0759 (-4.9%)
📊 DOGE TECHNICAL ANALYSIS (4H CHART)
Price is above the EMA20 (0.0789) and EMA50 (0.0790), and the EMA20 is rising. RSI 58 favors buyers. The weak spot: 0.0809 rejected price twice in the last day.
🔑 KEY LEVELS
Support: 0.0789 (EMAs), then 0.0760
Resistance: 0.0809, then 0.0837 (Oct 21 high)
📈 Bullish scenario: a 4H close above 0.0809 opens TP1 at 0.0837.
📉 Bearish scenario: losing the EMAs puts 0.0760 back in play. A close under 0.0759 cancels this signal.
💡 Bottom line: relative strength is on Dogecoin's side. The trigger is a clean break of 0.0809.
👉 Tap $DOGE
to open the live chart. NFA
🔥 NEW TO BINANCE?
✅ No Binance account yet? Sign up with referral code SQUAREGINOS and get a 10% kickback on your Futures trading fees.
👇👇👇
Sign up on Binance here (10% Futures fee kickback)
━━━━━━━━━━
Does Dogecoin finally break 0.081 this week? 👇
Follow Crypto Signals and Analysis for daily signals.
#cryptosignals #DOGE #FOMCWatch
⚠️ Crypto is volatile: risk only what you can afford to lose.
13
·
--
Baissier
$ADA Price Prediction Today (Oct 29): Cardano Crypto Signal & Technical Analysis 📊
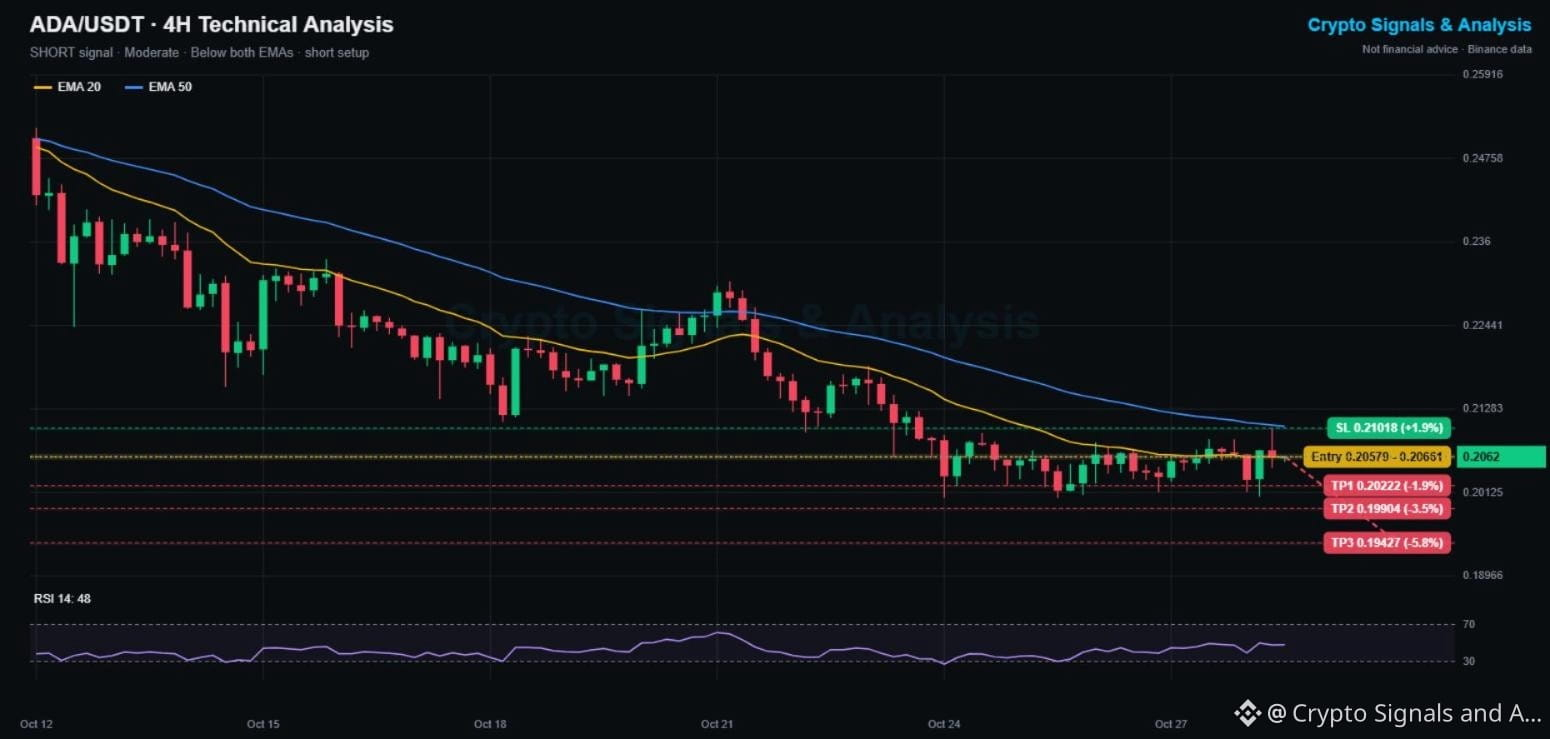
🔴 SHORT | Entry 0.2058 - 0.2066 | TP1 0.2022 | SL 0.2102
👉 Tap $ADA to place your trade fast
🕒 Updated: Oct 29, 00:18 UTC · price 0.2062
Cardano missed yesterday's altcoin bounce: it closed Oct 28 slightly red (-0.5%) and is down 6.6% on the week. Its last push to 0.2101 was rejected right under the 4H EMA50.
📌 CARDANO TRADING SIGNAL (Moderate, 3/5 signals agree)
Entry: 0.2058 - 0.2066
Take profit 1: 0.2022 (-1.9%)
Take profit 2: 0.1990 (-3.5%)
Take profit 3: 0.1943 (-5.8%)
Stop loss: 0.2102 (+1.9%)
📊 ADA TECHNICAL ANALYSIS (4H CHART)
Price sits on the EMA20 (0.2062) and below the falling EMA50 (0.2104). RSI 48 is neutral. One check is bullish: the EMA20 has flattened and ticked up, so this is a range short with a tight stop, not a strong trend trade.
🔑 KEY LEVELS
Support: 0.2005 (2-week low), then 0.1990
Resistance: 0.2101, then 0.2104 (EMA50)
📉 Bearish scenario: a 4H close under 0.2005 opens TP2 and TP3.
📈 Bullish scenario: a close above 0.2102 cancels this signal and breaks the downtrend.
💡 Bottom line: 0.2005 - 0.2101 is the box. Trade the edges, not the middle.
👉 Tap $ADA
to open the live chart. NFA
🔥 NEW TO BINANCE?
✅ No Binance account yet? Sign up with referral code SQUAREGINOS and get a 10% kickback on your Futures trading fees.
👇👇👇
{spot}(ADAUSDT)
[Sign up on Binance here (10% Futures fee kickback)](https://www.binance.com/join?ref=SQUAREGINOS)
━━━━━━━━━━
Does Cardano break 0.2005 or 0.2101 first? 👇
Follow Crypto Signals and Analysis for daily signals.
#cryptosignals #Cardano #FOMCWatch
⚠️ Crypto is volatile: risk only what you can afford to lose.
$ADA Price Prediction Today (Oct 29): Cardano Crypto Signal & Technical Analysis 📊
🔴 SHORT | Entry 0.2058 - 0.2066 | TP1 0.2022 | SL 0.2102
👉 Tap $ADA to place your trade fast
🕒 Updated: Oct 29, 00:18 UTC · price 0.2062
Cardano missed yesterday's altcoin bounce: it closed Oct 28 slightly red (-0.5%) and is down 6.6% on the week. Its last push to 0.2101 was rejected right under the 4H EMA50.
📌 CARDANO TRADING SIGNAL (Moderate, 3/5 signals agree)
Entry: 0.2058 - 0.2066
Take profit 1: 0.2022 (-1.9%)
Take profit 2: 0.1990 (-3.5%)
Take profit 3: 0.1943 (-5.8%)
Stop loss: 0.2102 (+1.9%)
📊 ADA TECHNICAL ANALYSIS (4H CHART)
Price sits on the EMA20 (0.2062) and below the falling EMA50 (0.2104). RSI 48 is neutral. One check is bullish: the EMA20 has flattened and ticked up, so this is a range short with a tight stop, not a strong trend trade.
🔑 KEY LEVELS
Support: 0.2005 (2-week low), then 0.1990
Resistance: 0.2101, then 0.2104 (EMA50)
📉 Bearish scenario: a 4H close under 0.2005 opens TP2 and TP3.
📈 Bullish scenario: a close above 0.2102 cancels this signal and breaks the downtrend.
💡 Bottom line: 0.2005 - 0.2101 is the box. Trade the edges, not the middle.
👉 Tap $ADA
to open the live chart. NFA
🔥 NEW TO BINANCE?
✅ No Binance account yet? Sign up with referral code SQUAREGINOS and get a 10% kickback on your Futures trading fees.
👇👇👇
Sign up on Binance here (10% Futures fee kickback)
━━━━━━━━━━
Does Cardano break 0.2005 or 0.2101 first? 👇
Follow Crypto Signals and Analysis for daily signals.
#cryptosignals #Cardano #FOMCWatch
⚠️ Crypto is volatile: risk only what you can afford to lose.
14
·
--
Haussier
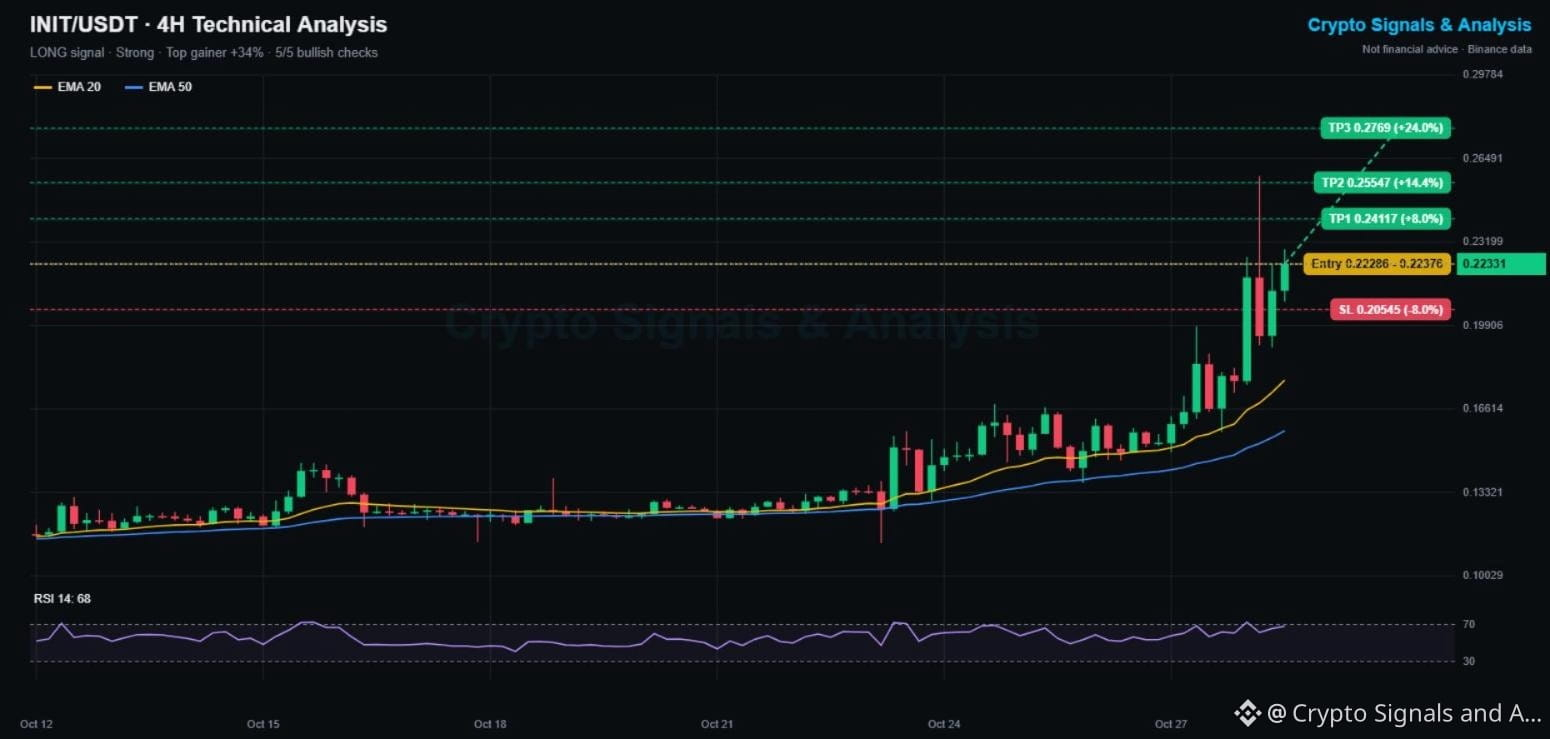
$INIT Price Prediction Today (Oct 29): Initia Crypto Signal & Technical Analysis 📊
🟢 LONG | Entry 0.2229 - 0.2238 | TP1 0.2412 | SL 0.2055
👉 Tap $INIT to place your trade fast
🕒 Updated: Oct 29, 00:01 UTC · price 0.2233
Initia was Binance's top gainer of Oct 28: +34% in 24 hours and +75% in 7 days. It spiked to 0.258, pulled back to about 0.20, and buyers stepped in again. Trend traders are watching for the next leg.
📌 INITIA TRADING SIGNAL (Strong, 5/5 signals agree)
Entry: 0.2229 - 0.2238
Take profit 1: 0.2412 (+8.0%)
Take profit 2: 0.2555 (+14.4%)
Take profit 3: 0.2769 (+24.0%)
Stop loss: 0.2055 (-8.0%)
📊 INIT TECHNICAL ANALYSIS (4H CHART)
All 5 checks are bullish: price far above the EMA20 (0.1775) and EMA50 (0.1576), both rising, RSI 68 and a huge weekly gain. The risk: price is 25% above the EMA20, so pullbacks can be sharp.
🔑 KEY LEVELS
Support: 0.20 (pullback low), then 0.178 (EMA20)
Resistance: 0.241, then 0.258 (spike high)
📈 Bullish scenario: a 4H close above 0.241 opens a retest of 0.258.
📉 Bearish scenario: losing 0.20 means the pump is fading. A close under 0.2055 cancels this signal.
💡 Bottom line: strongest chart on Binance, but extended. Use small size and respect the stop.
👉 Tap $INIT
to open the live chart. NFA
🔥 NEW TO BINANCE?
✅ No Binance account yet? Sign up with referral code SQUAREGINOS and get a 10% kickback on your Futures trading fees.
👇👇👇
{spot}(INITUSDT)
[Sign up on Binance here (10% Futures fee kickback)](https://www.binance.com/join?ref=SQUAREGINOS)
━━━━━━━━━━
Can Initia break 0.258, or is the top in? 👇
Follow Crypto Signals and Analysis for daily signals.
#cryptosignals #Initia #FOMCWatch
⚠️ Crypto is volatile: risk only what you can afford to lose.
$INIT Price Prediction Today (Oct 29): Initia Crypto Signal & Technical Analysis 📊
🟢 LONG | Entry 0.2229 - 0.2238 | TP1 0.2412 | SL 0.2055
👉 Tap $INIT to place your trade fast
🕒 Updated: Oct 29, 00:01 UTC · price 0.2233
Initia was Binance's top gainer of Oct 28: +34% in 24 hours and +75% in 7 days. It spiked to 0.258, pulled back to about 0.20, and buyers stepped in again. Trend traders are watching for the next leg.
📌 INITIA TRADING SIGNAL (Strong, 5/5 signals agree)
Entry: 0.2229 - 0.2238
Take profit 1: 0.2412 (+8.0%)
Take profit 2: 0.2555 (+14.4%)
Take profit 3: 0.2769 (+24.0%)
Stop loss: 0.2055 (-8.0%)
📊 INIT TECHNICAL ANALYSIS (4H CHART)
All 5 checks are bullish: price far above the EMA20 (0.1775) and EMA50 (0.1576), both rising, RSI 68 and a huge weekly gain. The risk: price is 25% above the EMA20, so pullbacks can be sharp.
🔑 KEY LEVELS
Support: 0.20 (pullback low), then 0.178 (EMA20)
Resistance: 0.241, then 0.258 (spike high)
📈 Bullish scenario: a 4H close above 0.241 opens a retest of 0.258.
📉 Bearish scenario: losing 0.20 means the pump is fading. A close under 0.2055 cancels this signal.
💡 Bottom line: strongest chart on Binance, but extended. Use small size and respect the stop.
👉 Tap $INIT
to open the live chart. NFA
🔥 NEW TO BINANCE?
✅ No Binance account yet? Sign up with referral code SQUAREGINOS and get a 10% kickback on your Futures trading fees.
👇👇👇
Sign up on Binance here (10% Futures fee kickback)
━━━━━━━━━━
Can Initia break 0.258, or is the top in? 👇
Follow Crypto Signals and Analysis for daily signals.
#cryptosignals #Initia #FOMCWatch
⚠️ Crypto is volatile: risk only what you can afford to lose.
8
·
--
Haussier
$SHELL and Initia Top the Oct 28 Crypto Wrap: Altcoins Bounce, Bitcoin Stays Flat 📰
🕒 Updated: Oct 28, 23:45 UTC
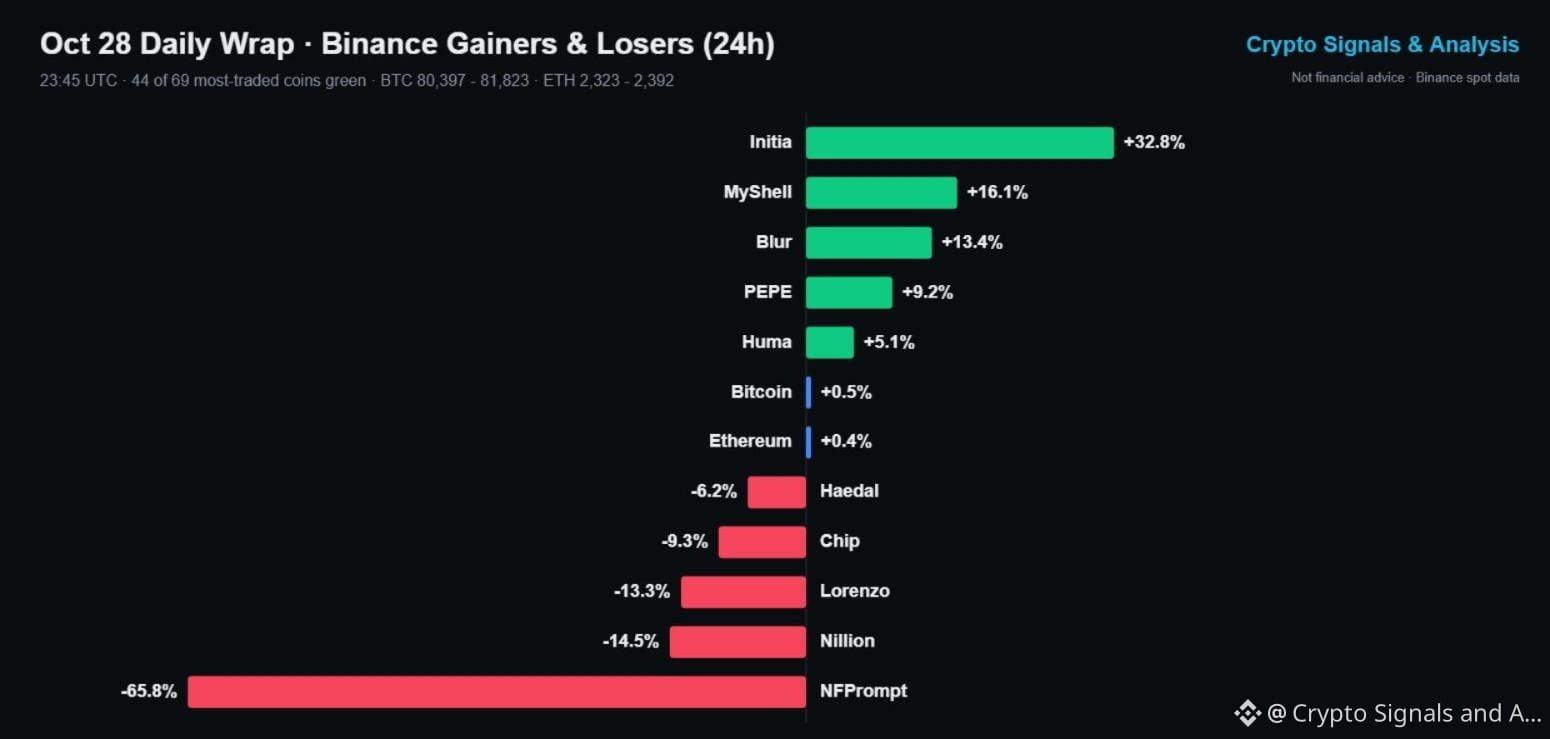
The day after the Fed hold was quiet for Bitcoin and busy for altcoins. 44 of the 69 most-traded coins on Binance spot closed the day green.
📰 TODAY IN 4 POINTS
🟠 Bitcoin moved less than 2% all day (80,397 - 81,823) and is up 0.5%. Ethereum is up 0.4% at 2,360.
🟢 Initia (+32.8%) was the top gainer. MyShell (+16.1%), Blur (+13.4%) and PEPE (+9.2%) followed.
🔴 Losers were concentrated in small caps: NFPrompt -65.8%, Nillion -14.5%, Lorenzo -13.3%.
📊 Volume stayed on the majors: Bitcoin about 1.06B USDT and Ethereum 420M on spot.
👀 WHAT TO WATCH FOR OCT 29
Bitcoin's tight range is the key. A break above 81,823 would likely pull more money into altcoins; a drop under 80,397 would cool the small-cap rally fast. After a day like this, the big gainers often give back part of the move, so watch whether Initia and MyShell hold their gains during the Asian session.
💡 Bottom line: rotation, not a new trend. Take profits into strength and keep stops tight on small caps.
👉 Tap $SHELL
to open the live chart. NFA
🔥 TRADE WITH LOWER FEES
✅ Get a 10% kickback on your Binance Futures trading fees
👇👇👇
{spot}(SHELLUSDT)
[Claim your 10% Futures fee kickback here](https://www.binance.com/join?ref=SQUAREGINOS)
━━━━━━━━━━
Bitcoin breakout or breakdown first on Oct 29? 👇
Follow Crypto Signals and Analysis for daily market wraps.
#cryptosignals #altcoins #FOMCWatch
⚠️ Crypto is volatile: risk only what you can afford to lose.
$SHELL and Initia Top the Oct 28 Crypto Wrap: Altcoins Bounce, Bitcoin Stays Flat 📰
🕒 Updated: Oct 28, 23:45 UTC
The day after the Fed hold was quiet for Bitcoin and busy for altcoins. 44 of the 69 most-traded coins on Binance spot closed the day green.
📰 TODAY IN 4 POINTS
🟠 Bitcoin moved less than 2% all day (80,397 - 81,823) and is up 0.5%. Ethereum is up 0.4% at 2,360.
🟢 Initia (+32.8%) was the top gainer. MyShell (+16.1%), Blur (+13.4%) and PEPE (+9.2%) followed.
🔴 Losers were concentrated in small caps: NFPrompt -65.8%, Nillion -14.5%, Lorenzo -13.3%.
📊 Volume stayed on the majors: Bitcoin about 1.06B USDT and Ethereum 420M on spot.
👀 WHAT TO WATCH FOR OCT 29
Bitcoin's tight range is the key. A break above 81,823 would likely pull more money into altcoins; a drop under 80,397 would cool the small-cap rally fast. After a day like this, the big gainers often give back part of the move, so watch whether Initia and MyShell hold their gains during the Asian session.
💡 Bottom line: rotation, not a new trend. Take profits into strength and keep stops tight on small caps.
👉 Tap $SHELL
to open the live chart. NFA
🔥 TRADE WITH LOWER FEES
✅ Get a 10% kickback on your Binance Futures trading fees
👇👇👇
Claim your 10% Futures fee kickback here
━━━━━━━━━━
Bitcoin breakout or breakdown first on Oct 29? 👇
Follow Crypto Signals and Analysis for daily market wraps.
#cryptosignals #altcoins #FOMCWatch
⚠️ Crypto is volatile: risk only what you can afford to lose.
89
·
--
Haussier
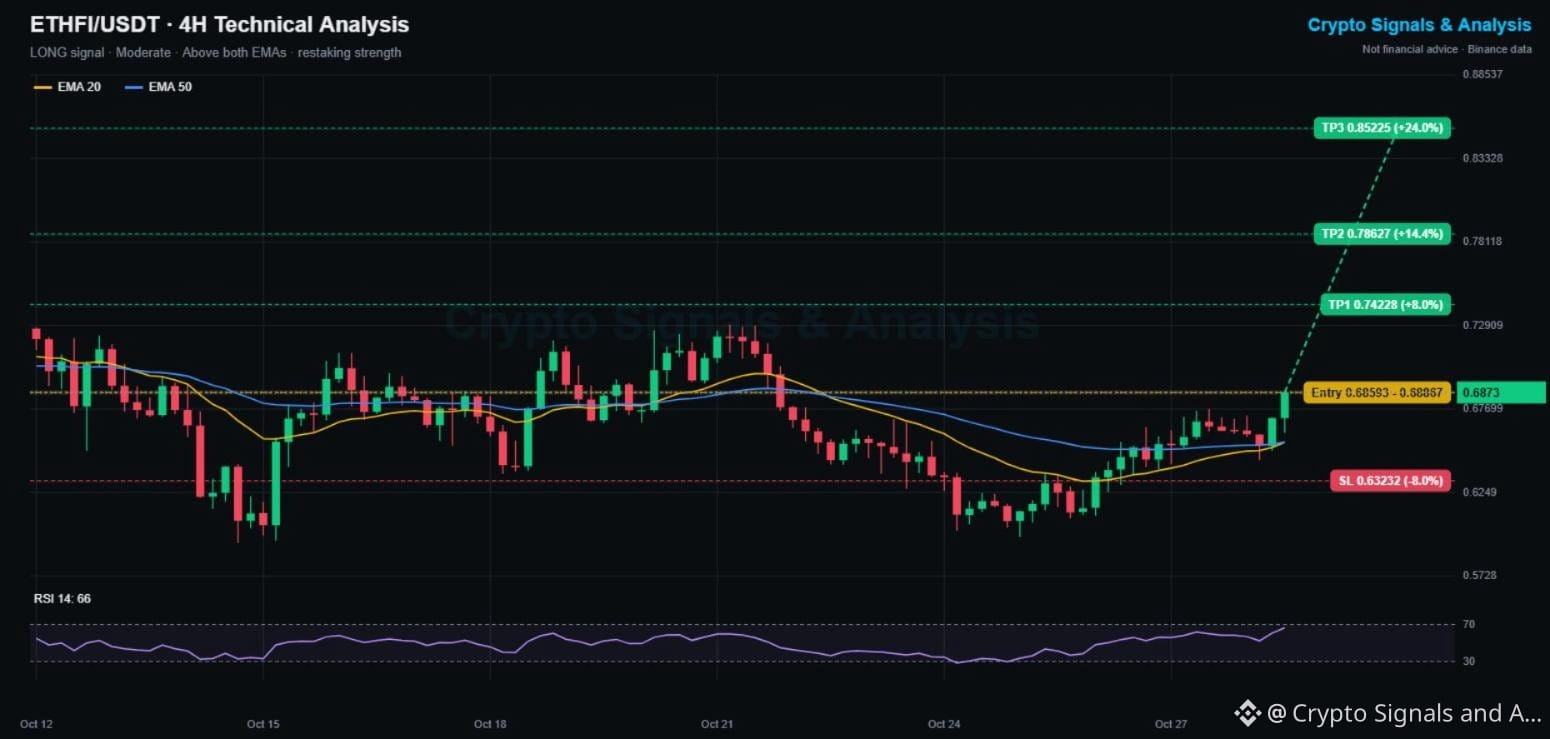
$ETHFI Price Prediction Today (Oct 28, Night Update): ether.fi Crypto Signal & Technical Analysis 📊
🟢 LONG | Entry 0.6859 - 0.6887 | TP1 0.7423 | SL 0.6323
👉 Tap $ETHFI to place your trade fast
🕒 Updated: Oct 28, 23:26 UTC · price 0.6873
ether.fi is up 3.2% today and just broke to a 3-day high at 0.6874. The restaking token has climbed steadily from the 0.594 low on Oct 24 and is now one of the stronger DeFi charts on Binance.
📌 ETHER.FI TRADING SIGNAL (Moderate, 4/5 signals agree)
Entry: 0.6859 - 0.6887
Take profit 1: 0.7423 (+8.0%)
Take profit 2: 0.7863 (+14.4%)
Take profit 3: 0.8523 (+24.0%)
Stop loss: 0.6323 (-8.0%)
📊 ETHFI TECHNICAL ANALYSIS (4H CHART)
Price is above the EMA20 (0.6563) and EMA50 (0.6563), which just crossed, with the EMA20 turning up. RSI 66 shows strong momentum but leaves little room before overbought, so a retest of 0.675 - 0.68 is possible.
🔑 KEY LEVELS
Support: 0.675, then 0.656 (EMAs)
Resistance: 0.70, then 0.73 (Oct 21 high)
📈 Bullish scenario: holding above 0.6874 targets 0.73 and TP1.
📉 Bearish scenario: falling back under the EMAs means a fake breakout. A close under 0.6323 cancels this signal.
💡 Bottom line: trend just flipped up. A dip toward 0.68 is a cleaner entry than chasing.
👉 Tap $ETHFI
to open the live chart. NFA
🔥 TRADE WITH LOWER FEES
✅ Get a 10% kickback on your Binance Futures trading fees
👇👇👇
{spot}(ETHFIUSDT)
[Claim your 10% Futures fee kickback here](https://www.binance.com/join?ref=SQUAREGINOS)
━━━━━━━━━━
Are restaking tokens about to lead the next DeFi move? 👇
Follow Crypto Signals and Analysis for daily signals.
#cryptosignals #DeFi #FOMCWatch
⚠️ Crypto is volatile: risk only what you can afford to lose.
$ETHFI Price Prediction Today (Oct 28, Night Update): ether.fi Crypto Signal & Technical Analysis 📊
🟢 LONG | Entry 0.6859 - 0.6887 | TP1 0.7423 | SL 0.6323
👉 Tap $ETHFI to place your trade fast
🕒 Updated: Oct 28, 23:26 UTC · price 0.6873
ether.fi is up 3.2% today and just broke to a 3-day high at 0.6874. The restaking token has climbed steadily from the 0.594 low on Oct 24 and is now one of the stronger DeFi charts on Binance.
📌 ETHER.FI TRADING SIGNAL (Moderate, 4/5 signals agree)
Entry: 0.6859 - 0.6887
Take profit 1: 0.7423 (+8.0%)
Take profit 2: 0.7863 (+14.4%)
Take profit 3: 0.8523 (+24.0%)
Stop loss: 0.6323 (-8.0%)
📊 ETHFI TECHNICAL ANALYSIS (4H CHART)
Price is above the EMA20 (0.6563) and EMA50 (0.6563), which just crossed, with the EMA20 turning up. RSI 66 shows strong momentum but leaves little room before overbought, so a retest of 0.675 - 0.68 is possible.
🔑 KEY LEVELS
Support: 0.675, then 0.656 (EMAs)
Resistance: 0.70, then 0.73 (Oct 21 high)
📈 Bullish scenario: holding above 0.6874 targets 0.73 and TP1.
📉 Bearish scenario: falling back under the EMAs means a fake breakout. A close under 0.6323 cancels this signal.
💡 Bottom line: trend just flipped up. A dip toward 0.68 is a cleaner entry than chasing.
👉 Tap $ETHFI
to open the live chart. NFA
🔥 TRADE WITH LOWER FEES
✅ Get a 10% kickback on your Binance Futures trading fees
👇👇👇
Claim your 10% Futures fee kickback here
━━━━━━━━━━
Are restaking tokens about to lead the next DeFi move? 👇
Follow Crypto Signals and Analysis for daily signals.
#cryptosignals #DeFi #FOMCWatch
⚠️ Crypto is volatile: risk only what you can afford to lose.
24
·
--
Baissier
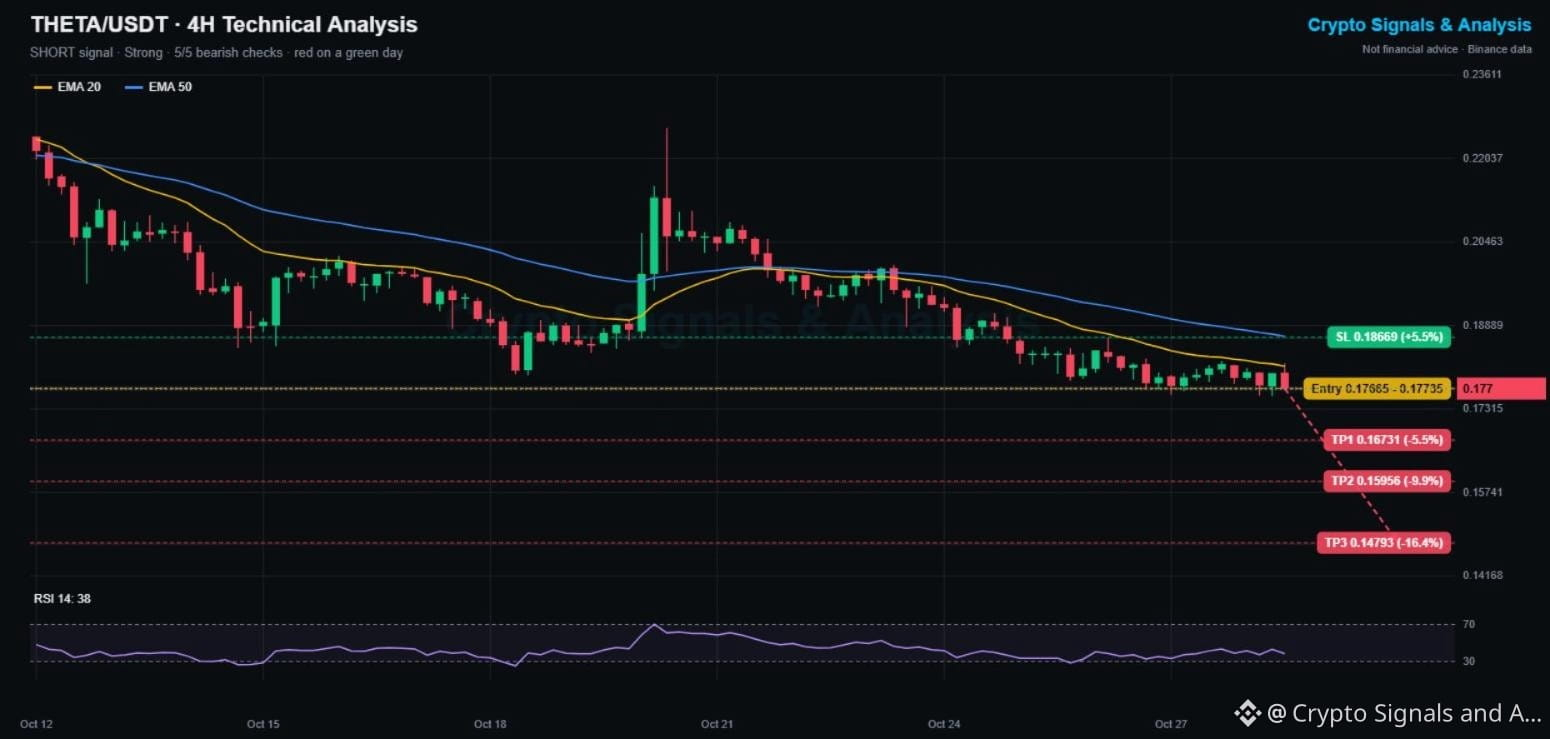
$THETA Price Prediction Today (Oct 28, Night Update): Theta Network Crypto Signal & Technical Analysis 📊
🔴 SHORT | Entry 0.1767 - 0.1774 | TP1 0.1673 | SL 0.1867
👉 Tap $THETA to place your trade fast
🕒 Updated: Oct 28, 23:10 UTC · price 0.177
Theta Network is one of the few large coins in the red tonight (-2.1%) while most of the market bounces. It is down 12.5% this week and just printed its lowest level in 17 days at 0.1756.
📌 THETA NETWORK TRADING SIGNAL (Strong, 5/5 signals agree)
Entry: 0.1767 - 0.1774
Take profit 1: 0.1673 (-5.5%)
Take profit 2: 0.1596 (-9.9%)
Take profit 3: 0.1479 (-16.4%)
Stop loss: 0.1867 (+5.5%)
📊 THETA TECHNICAL ANALYSIS (4H CHART)
Price is below the EMA20 (0.1812) and EMA50 (0.1869), both sloping down. RSI 38 shows strong selling, but it is getting close to oversold, so a short bounce is possible before the next leg.
🔑 KEY LEVELS
Support: 0.1756 (17-day low), then 0.167
Resistance: 0.1812 (EMA20), then 0.1865
📉 Bearish scenario: a 4H close under 0.1756 opens TP1 at 0.1673.
📈 Bullish scenario: reclaiming 0.1812 slows the drop. A close above 0.1867 cancels this signal.
💡 Bottom line: weakest chart on a green day. Better entries come on bounces into the EMA20.
👉 Tap $THETA
to open the live chart. NFA
🔥 TRADE WITH LOWER FEES
✅ Get a 10% kickback on your Binance Futures trading fees
👇👇👇
{spot}(THETAUSDT)
[Claim your 10% Futures fee kickback here](https://www.binance.com/join?ref=SQUAREGINOS)
━━━━━━━━━━
Capitulation soon or more pain for Theta Network? 👇
Follow Crypto Signals and Analysis for daily signals.
#cryptosignals #THETA #FOMCWatch
⚠️ Crypto is volatile: risk only what you can afford to lose.
$THETA Price Prediction Today (Oct 28, Night Update): Theta Network Crypto Signal & Technical Analysis 📊
🔴 SHORT | Entry 0.1767 - 0.1774 | TP1 0.1673 | SL 0.1867
👉 Tap $THETA to place your trade fast
🕒 Updated: Oct 28, 23:10 UTC · price 0.177
Theta Network is one of the few large coins in the red tonight (-2.1%) while most of the market bounces. It is down 12.5% this week and just printed its lowest level in 17 days at 0.1756.
📌 THETA NETWORK TRADING SIGNAL (Strong, 5/5 signals agree)
Entry: 0.1767 - 0.1774
Take profit 1: 0.1673 (-5.5%)
Take profit 2: 0.1596 (-9.9%)
Take profit 3: 0.1479 (-16.4%)
Stop loss: 0.1867 (+5.5%)
📊 THETA TECHNICAL ANALYSIS (4H CHART)
Price is below the EMA20 (0.1812) and EMA50 (0.1869), both sloping down. RSI 38 shows strong selling, but it is getting close to oversold, so a short bounce is possible before the next leg.
🔑 KEY LEVELS
Support: 0.1756 (17-day low), then 0.167
Resistance: 0.1812 (EMA20), then 0.1865
📉 Bearish scenario: a 4H close under 0.1756 opens TP1 at 0.1673.
📈 Bullish scenario: reclaiming 0.1812 slows the drop. A close above 0.1867 cancels this signal.
💡 Bottom line: weakest chart on a green day. Better entries come on bounces into the EMA20.
👉 Tap $THETA
to open the live chart. NFA
🔥 TRADE WITH LOWER FEES
✅ Get a 10% kickback on your Binance Futures trading fees
👇👇👇
Claim your 10% Futures fee kickback here
━━━━━━━━━━
Capitulation soon or more pain for Theta Network? 👇
Follow Crypto Signals and Analysis for daily signals.
#cryptosignals #THETA #FOMCWatch
⚠️ Crypto is volatile: risk only what you can afford to lose.
6
·
--
Haussier
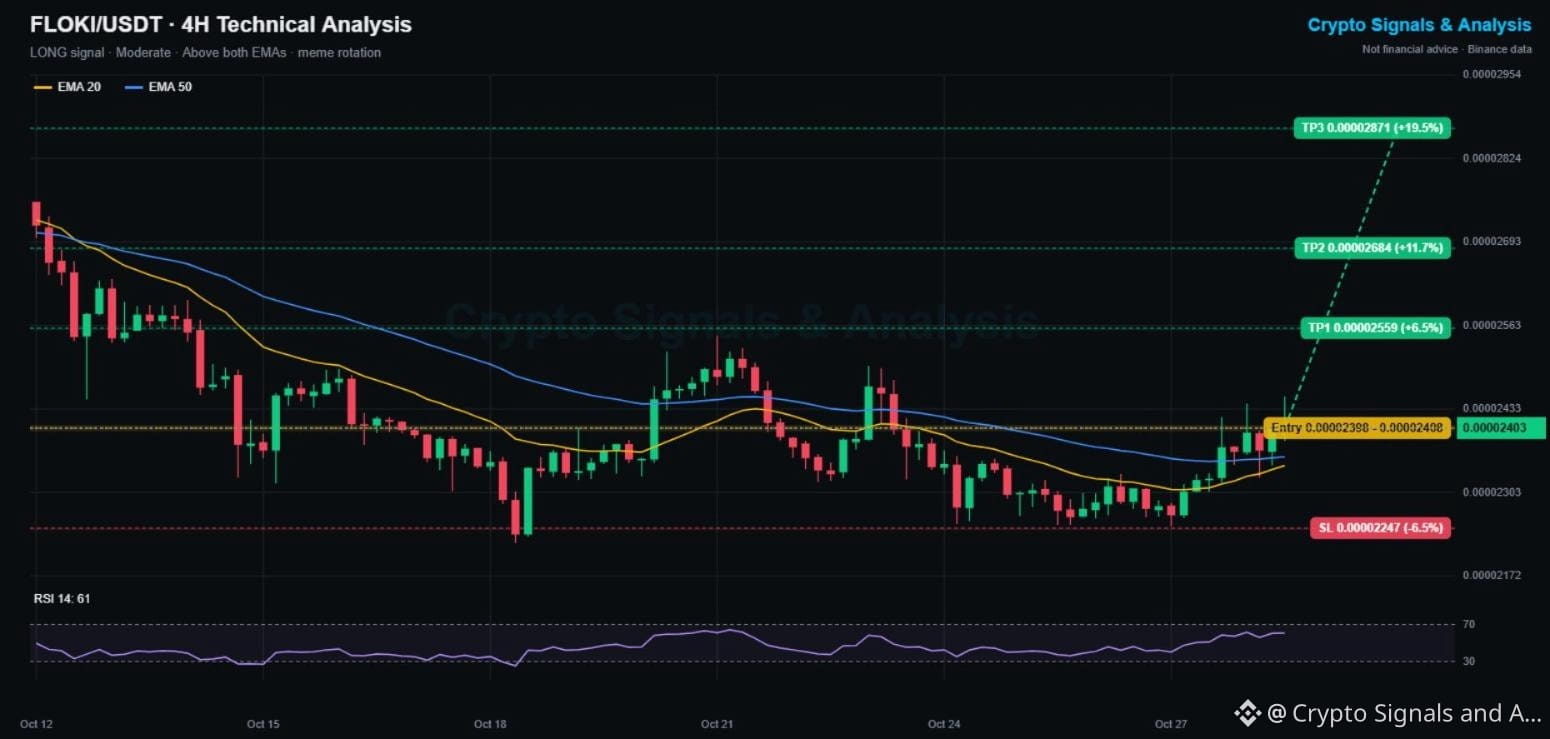
$FLOKI Price Prediction Today (Oct 28, Night Update): Floki Crypto Signal & Technical Analysis 📊
🟢 LONG | Entry 0.00002398 - 0.00002408 | TP1 0.00002559 | SL 0.00002247
👉 Tap $FLOKI to place your trade fast
🕒 Updated: Oct 28, 22:52 UTC · price 0.00002403
Meme coins are leading tonight's bounce (PEPE +11%), and Floki is following: +3.4% today and almost flat on the week (-2.4%), much stronger than most altcoins. It just broke above both 4H moving averages for the first time since Oct 22.
📌 FLOKI TRADING SIGNAL (Moderate, 4/5 signals agree)
Entry: 0.00002398 - 0.00002408
Take profit 1: 0.00002559 (+6.5%)
Take profit 2: 0.00002684 (+11.7%)
Take profit 3: 0.00002871 (+19.5%)
Stop loss: 0.00002247 (-6.5%)
📊 FLOKI TECHNICAL ANALYSIS (4H CHART)
Price is above the EMA20 (0.00002344) and EMA50 (0.00002358), and the EMA20 is turning up. RSI 61 shows buyers in control without being overbought.
🔑 KEY LEVELS
Support: 0.0000235 (EMAs), then 0.0000225
Resistance: 0.0000245, then 0.0000256
📈 Bullish scenario: a 4H close above 0.0000245 opens TP1.
📉 Bearish scenario: losing the EMAs sends it back to the range. A close under 0.00002247 cancels this signal.
💡 Bottom line: relative strength plus meme rotation. Let 0.0000245 break to confirm.
👉 Tap $FLOKI
to open the live chart. NFA
🔥 TRADE WITH LOWER FEES
✅ Get a 10% kickback on your Binance Futures trading fees
👇👇👇
{spot}(FLOKIUSDT)
[Claim your 10% Futures fee kickback here](https://www.binance.com/join?ref=SQUAREGINOS)
━━━━━━━━━━
Which meme runs next: PEPE, BONK or Floki? 👇
Follow Crypto Signals and Analysis for daily signals.
#cryptosignals #memecoin #FOMCWatch
⚠️ Crypto is volatile: risk only what you can afford to lose.
$FLOKI Price Prediction Today (Oct 28, Night Update): Floki Crypto Signal & Technical Analysis 📊
🟢 LONG | Entry 0.00002398 - 0.00002408 | TP1 0.00002559 | SL 0.00002247
👉 Tap $FLOKI to place your trade fast
🕒 Updated: Oct 28, 22:52 UTC · price 0.00002403
Meme coins are leading tonight's bounce (PEPE +11%), and Floki is following: +3.4% today and almost flat on the week (-2.4%), much stronger than most altcoins. It just broke above both 4H moving averages for the first time since Oct 22.
📌 FLOKI TRADING SIGNAL (Moderate, 4/5 signals agree)
Entry: 0.00002398 - 0.00002408
Take profit 1: 0.00002559 (+6.5%)
Take profit 2: 0.00002684 (+11.7%)
Take profit 3: 0.00002871 (+19.5%)
Stop loss: 0.00002247 (-6.5%)
📊 FLOKI TECHNICAL ANALYSIS (4H CHART)
Price is above the EMA20 (0.00002344) and EMA50 (0.00002358), and the EMA20 is turning up. RSI 61 shows buyers in control without being overbought.
🔑 KEY LEVELS
Support: 0.0000235 (EMAs), then 0.0000225
Resistance: 0.0000245, then 0.0000256
📈 Bullish scenario: a 4H close above 0.0000245 opens TP1.
📉 Bearish scenario: losing the EMAs sends it back to the range. A close under 0.00002247 cancels this signal.
💡 Bottom line: relative strength plus meme rotation. Let 0.0000245 break to confirm.
👉 Tap $FLOKI
to open the live chart. NFA
🔥 TRADE WITH LOWER FEES
✅ Get a 10% kickback on your Binance Futures trading fees
👇👇👇
Claim your 10% Futures fee kickback here
━━━━━━━━━━
Which meme runs next: PEPE, BONK or Floki? 👇
Follow Crypto Signals and Analysis for daily signals.
#cryptosignals #memecoin #FOMCWatch
⚠️ Crypto is volatile: risk only what you can afford to lose.
32
·
--
Haussier
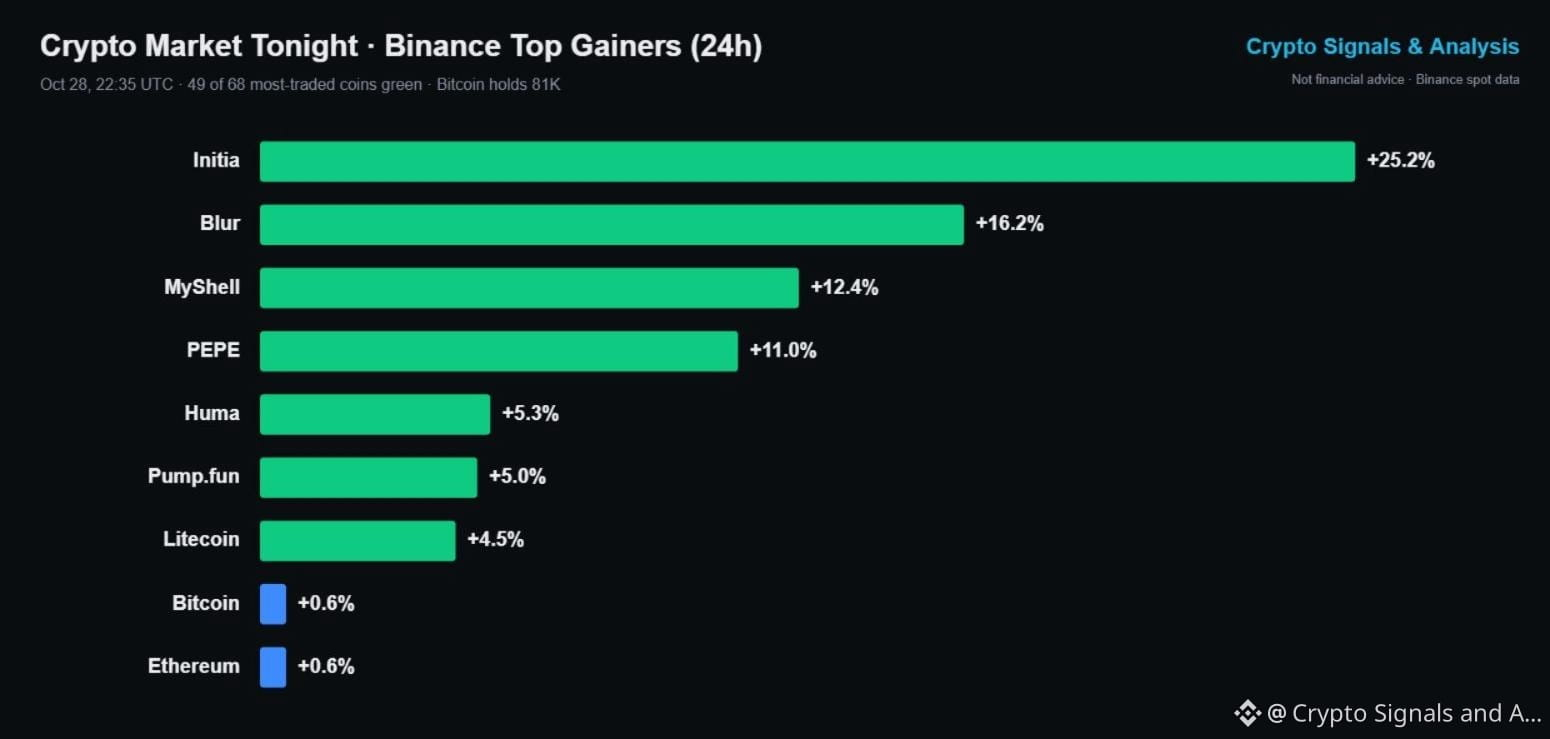
$BLUR and Initia Lead Binance Gainers Tonight as Bitcoin Holds 81K 📰
🕒 Updated: Oct 28, 22:35 UTC
The altcoin bounce kept going into the night after the Fed hold. 49 of the 68 most-traded coins on Binance spot are green over 24 hours, while Bitcoin and Ethereum barely moved (+0.6% each).
📰 WHAT HAPPENED TODAY
🟢 Initia is the top gainer, +25.2% to 0.2156.
🟢 Blur is up 16.2% to 0.00853 after a 60% slide since mid-October.
🟢 MyShell (+12.4%) and PEPE (+11.0%) round out the top 4.
🟠 Bitcoin is stuck in a tight 80,397 - 81,823 range, so the money is rotating into small caps.
✅ OUR BLUR CALL
This morning we posted a Blur long from 0.00836 with TP1 at 0.00903. Price reached 0.00905 tonight, so TP1 was tagged, and the stop at 0.00769 was never hit.
👀 WHAT TO WATCH
Blur's 4H RSI is 66, close to overbought, and 0.0091 has rejected price three times today. A clean break above it would be the next leg; a drop under 0.0082 would mean the pump is cooling off.
💡 Bottom line: small caps are hot while Bitcoin rests. Rallies like this fade fast, so lock in profits on the way up.
👉 Tap $BLUR
to open the live chart. NFA
🔥 TRADE WITH LOWER FEES
✅ Get a 10% kickback on your Binance Futures trading fees
👇👇👇
{spot}(BLURUSDT)
[Claim your 10% Futures fee kickback here](https://www.binance.com/join?ref=SQUAREGINOS)
━━━━━━━━━━
Which small cap are you watching tonight? 👇
Follow Crypto Signals and Analysis for daily market updates.
#cryptosignals #BLUR #FOMCWatch
⚠️ Crypto is volatile: risk only what you can afford to lose.
$BLUR and Initia Lead Binance Gainers Tonight as Bitcoin Holds 81K 📰
🕒 Updated: Oct 28, 22:35 UTC
The altcoin bounce kept going into the night after the Fed hold. 49 of the 68 most-traded coins on Binance spot are green over 24 hours, while Bitcoin and Ethereum barely moved (+0.6% each).
📰 WHAT HAPPENED TODAY
🟢 Initia is the top gainer, +25.2% to 0.2156.
🟢 Blur is up 16.2% to 0.00853 after a 60% slide since mid-October.
🟢 MyShell (+12.4%) and PEPE (+11.0%) round out the top 4.
🟠 Bitcoin is stuck in a tight 80,397 - 81,823 range, so the money is rotating into small caps.
✅ OUR BLUR CALL
This morning we posted a Blur long from 0.00836 with TP1 at 0.00903. Price reached 0.00905 tonight, so TP1 was tagged, and the stop at 0.00769 was never hit.
👀 WHAT TO WATCH
Blur's 4H RSI is 66, close to overbought, and 0.0091 has rejected price three times today. A clean break above it would be the next leg; a drop under 0.0082 would mean the pump is cooling off.
💡 Bottom line: small caps are hot while Bitcoin rests. Rallies like this fade fast, so lock in profits on the way up.
👉 Tap $BLUR
to open the live chart. NFA
🔥 TRADE WITH LOWER FEES
✅ Get a 10% kickback on your Binance Futures trading fees
👇👇👇
Claim your 10% Futures fee kickback here
━━━━━━━━━━
Which small cap are you watching tonight? 👇
Follow Crypto Signals and Analysis for daily market updates.
#cryptosignals #BLUR #FOMCWatch
⚠️ Crypto is volatile: risk only what you can afford to lose.
266
·
--
Baissier
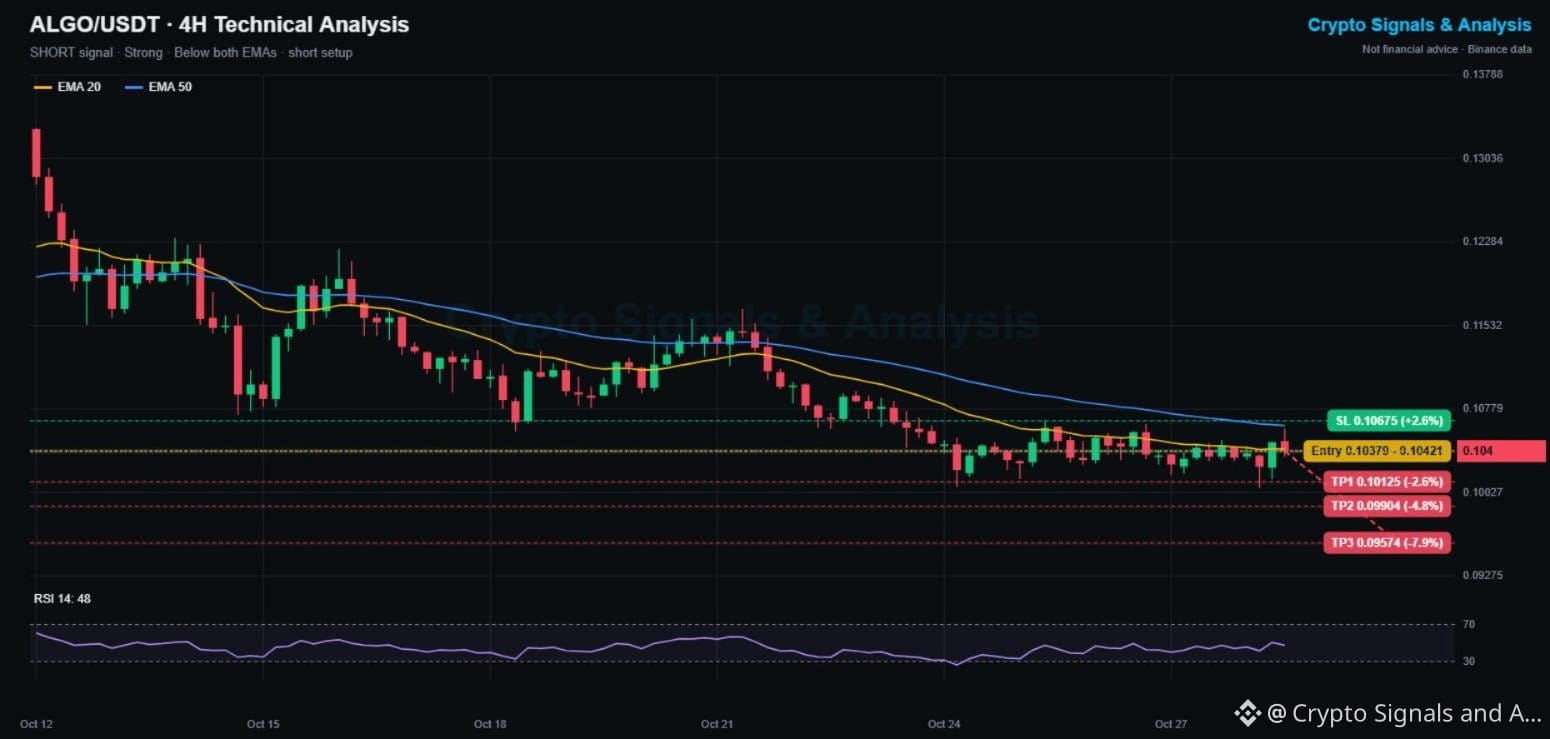
$ALGO Price Prediction Today (Oct 28, Night Update): Algorand Crypto Signal & Technical Analysis 📊
🔴 SHORT | Entry 0.1038 - 0.1042 | TP1 0.1013 | SL 0.1068
👉 Tap $ALGO to place your trade fast
🕒 Updated: Oct 28, 22:18 UTC · price 0.104
Algorand is down 8.2% this week and has made lower highs since the Oct 21 peak near 0.115. Tonight's bounce tagged the falling 4H EMA20 and was sold right away.
📌 ALGORAND TRADING SIGNAL (Strong, 4/5 signals agree)
Entry: 0.1038 - 0.1042
Take profit 1: 0.1013 (-2.6%)
Take profit 2: 0.0990 (-4.8%)
Take profit 3: 0.0957 (-7.9%)
Stop loss: 0.1068 (+2.6%)
📊 ALGO TECHNICAL ANALYSIS (4H CHART)
Price is below the EMA20 (0.1042) and EMA50 (0.1063), and the EMA20 is sloping down. RSI 48 is neutral, so the trend does the work here, not momentum.
🔑 KEY LEVELS
Support: 0.1007 (Oct 24 low), then 0.0990
Resistance: 0.1042 (EMA20), then 0.1067
📉 Bearish scenario: a 4H close under 0.1007 opens TP2 and TP3.
📈 Bullish scenario: a close above 0.1068 cancels this signal and flips the EMA50.
💡 Bottom line: tight range, clear invalidation. Short the rejection, not the breakdown.
👉 Tap $ALGO
to open the live chart. NFA
🔥 TRADE WITH LOWER FEES
✅ Get a 10% kickback on your Binance Futures trading fees
👇👇👇
{spot}(ALGOUSDT)
[Claim your 10% Futures fee kickback here](https://www.binance.com/join?ref=SQUAREGINOS)
━━━━━━━━━━
Does Algorand lose 0.10 this week? Yes or no 👇
Follow Crypto Signals and Analysis for daily signals.
#cryptosignals #Algorand #FOMCWatch
⚠️ Crypto is volatile: risk only what you can afford to lose.
$ALGO Price Prediction Today (Oct 28, Night Update): Algorand Crypto Signal & Technical Analysis 📊
🔴 SHORT | Entry 0.1038 - 0.1042 | TP1 0.1013 | SL 0.1068
👉 Tap $ALGO to place your trade fast
🕒 Updated: Oct 28, 22:18 UTC · price 0.104
Algorand is down 8.2% this week and has made lower highs since the Oct 21 peak near 0.115. Tonight's bounce tagged the falling 4H EMA20 and was sold right away.
📌 ALGORAND TRADING SIGNAL (Strong, 4/5 signals agree)
Entry: 0.1038 - 0.1042
Take profit 1: 0.1013 (-2.6%)
Take profit 2: 0.0990 (-4.8%)
Take profit 3: 0.0957 (-7.9%)
Stop loss: 0.1068 (+2.6%)
📊 ALGO TECHNICAL ANALYSIS (4H CHART)
Price is below the EMA20 (0.1042) and EMA50 (0.1063), and the EMA20 is sloping down. RSI 48 is neutral, so the trend does the work here, not momentum.
🔑 KEY LEVELS
Support: 0.1007 (Oct 24 low), then 0.0990
Resistance: 0.1042 (EMA20), then 0.1067
📉 Bearish scenario: a 4H close under 0.1007 opens TP2 and TP3.
📈 Bullish scenario: a close above 0.1068 cancels this signal and flips the EMA50.
💡 Bottom line: tight range, clear invalidation. Short the rejection, not the breakdown.
👉 Tap $ALGO
to open the live chart. NFA
🔥 TRADE WITH LOWER FEES
✅ Get a 10% kickback on your Binance Futures trading fees
👇👇👇
Claim your 10% Futures fee kickback here
━━━━━━━━━━
Does Algorand lose 0.10 this week? Yes or no 👇
Follow Crypto Signals and Analysis for daily signals.
#cryptosignals #Algorand #FOMCWatch
⚠️ Crypto is volatile: risk only what you can afford to lose.
29
·
--
Haussier
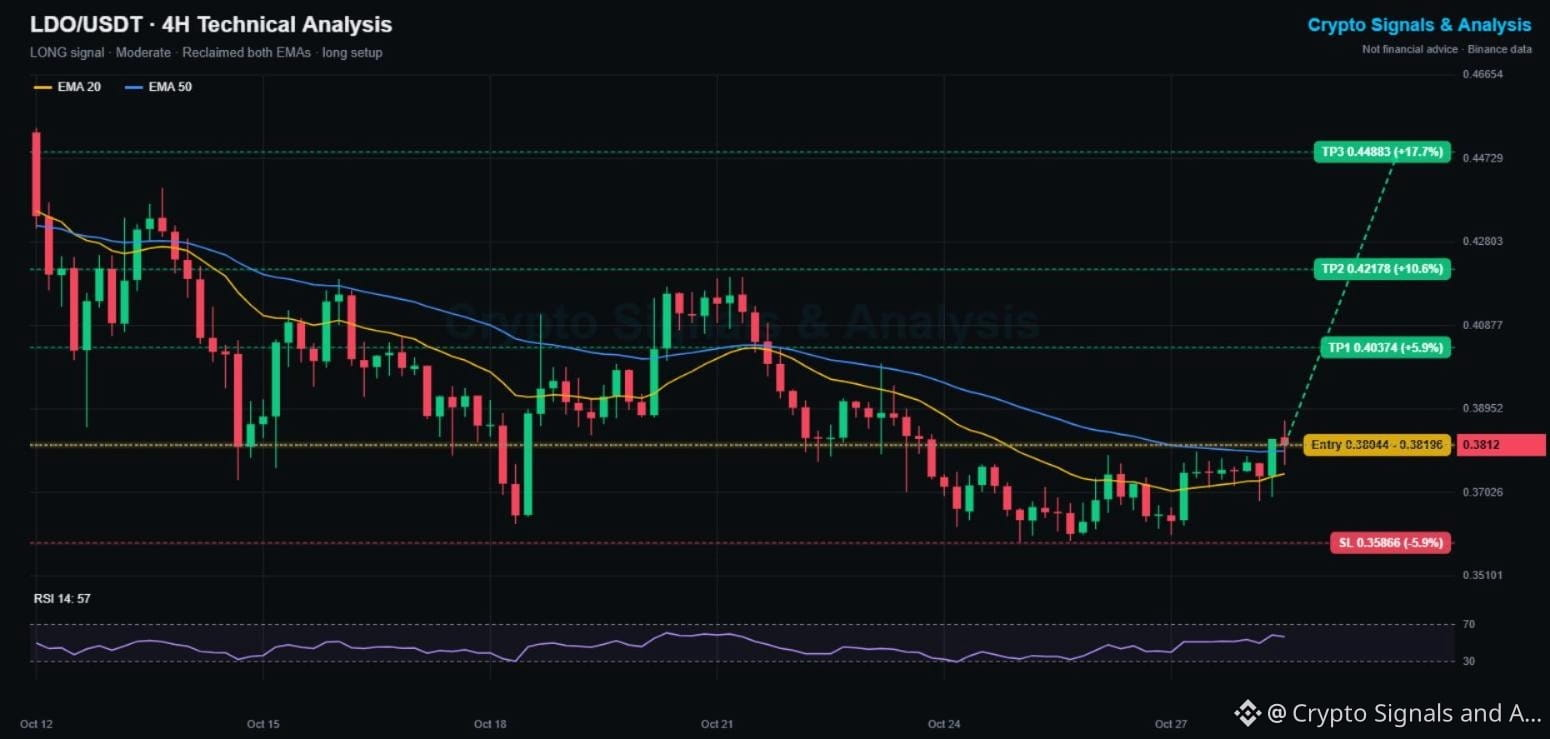
$LDO Price Prediction Today (Oct 28, Night Update): Lido DAO Crypto Signal & Technical Analysis 📊
🟢 LONG | Entry 0.3804 - 0.3820 | TP1 0.4037 | SL 0.3587
👉 Tap $LDO to place your trade fast
🕒 Updated: Oct 28, 22:03 UTC · price 0.3812
Lido DAO built a double bottom at 0.359 (Oct 25 and Oct 27) and has now pushed back above both 4H moving averages for the first time since Oct 21. Ethereum staking names are following ETH higher tonight.
📌 LIDO DAO TRADING SIGNAL (Moderate, 4/5 signals agree)
Entry: 0.3804 - 0.3820
Take profit 1: 0.4037 (+5.9%)
Take profit 2: 0.4218 (+10.6%)
Take profit 3: 0.4488 (+17.7%)
Stop loss: 0.3587 (-5.9%)
📊 LDO TECHNICAL ANALYSIS (4H CHART)
Price is above the EMA20 (0.3746) and EMA50 (0.3799), and the EMA20 has turned up. RSI 57 favors buyers. The one bearish check: still down 5.9% on the week.
🔑 KEY LEVELS
Support: 0.3799 (EMA50), then 0.359 (double bottom)
Resistance: 0.3868, then 0.404 and 0.42
📈 Bullish scenario: a 4H close above 0.3868 opens TP1 at 0.4037.
📉 Bearish scenario: losing 0.375 sends it back to the range. A close under 0.3587 cancels this signal.
💡 Bottom line: clean reversal structure with a clear invalidation. Let 0.3868 confirm.
👉 Tap $LDO
to open the live chart. NFA
🔥 TRADE WITH LOWER FEES
✅ Get a 10% kickback on your Binance Futures trading fees
👇👇👇
{spot}(LDOUSDT)
[Claim your 10% Futures fee kickback here](https://www.binance.com/join?ref=SQUAREGINOS)
━━━━━━━━━━
Double bottom confirmed or one more retest first? 👇
Follow Crypto Signals and Analysis for daily signals.
#cryptosignals #LDO #FOMCWatch
⚠️ Crypto is volatile: risk only what you can afford to lose.
$LDO Price Prediction Today (Oct 28, Night Update): Lido DAO Crypto Signal & Technical Analysis 📊
🟢 LONG | Entry 0.3804 - 0.3820 | TP1 0.4037 | SL 0.3587
👉 Tap $LDO to place your trade fast
🕒 Updated: Oct 28, 22:03 UTC · price 0.3812
Lido DAO built a double bottom at 0.359 (Oct 25 and Oct 27) and has now pushed back above both 4H moving averages for the first time since Oct 21. Ethereum staking names are following ETH higher tonight.
📌 LIDO DAO TRADING SIGNAL (Moderate, 4/5 signals agree)
Entry: 0.3804 - 0.3820
Take profit 1: 0.4037 (+5.9%)
Take profit 2: 0.4218 (+10.6%)
Take profit 3: 0.4488 (+17.7%)
Stop loss: 0.3587 (-5.9%)
📊 LDO TECHNICAL ANALYSIS (4H CHART)
Price is above the EMA20 (0.3746) and EMA50 (0.3799), and the EMA20 has turned up. RSI 57 favors buyers. The one bearish check: still down 5.9% on the week.
🔑 KEY LEVELS
Support: 0.3799 (EMA50), then 0.359 (double bottom)
Resistance: 0.3868, then 0.404 and 0.42
📈 Bullish scenario: a 4H close above 0.3868 opens TP1 at 0.4037.
📉 Bearish scenario: losing 0.375 sends it back to the range. A close under 0.3587 cancels this signal.
💡 Bottom line: clean reversal structure with a clear invalidation. Let 0.3868 confirm.
👉 Tap $LDO
to open the live chart. NFA
🔥 TRADE WITH LOWER FEES
✅ Get a 10% kickback on your Binance Futures trading fees
👇👇👇
Claim your 10% Futures fee kickback here
━━━━━━━━━━
Double bottom confirmed or one more retest first? 👇
Follow Crypto Signals and Analysis for daily signals.
#cryptosignals #LDO #FOMCWatch
⚠️ Crypto is volatile: risk only what you can afford to lose.
1
35
·
--
Baissier
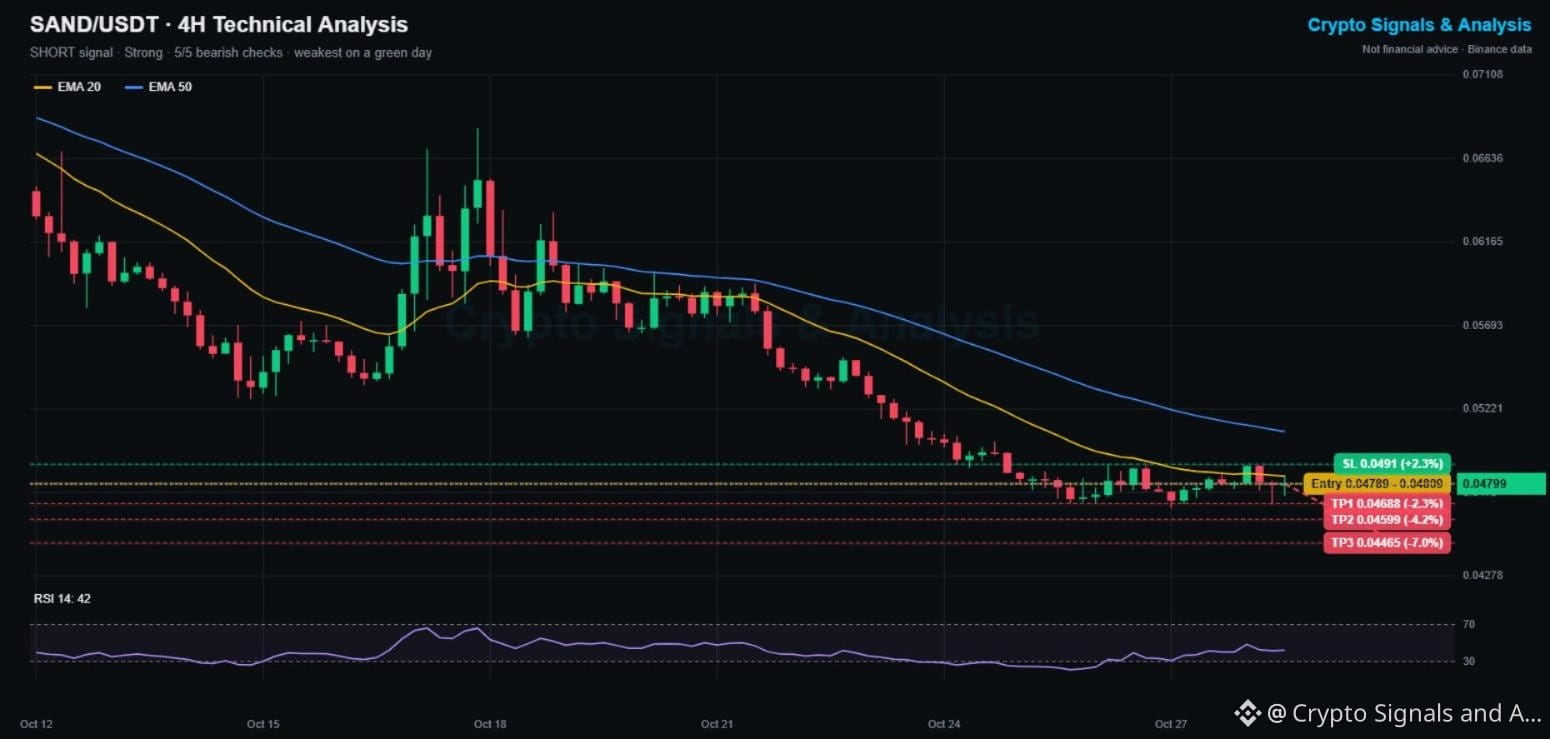
$SAND Price Prediction Today (Oct 28, Night Update): The Sandbox Crypto Signal & Technical Analysis 📊
🔴 SHORT | Entry 0.04789 - 0.04809 | TP1 0.04688 | SL 0.0491
👉 Tap $SAND to place your trade fast
🕒 Updated: Oct 28, 21:45 UTC · price 0.04799
While most altcoins are green tonight, The Sandbox is red (-0.5%) and down 16.9% this week. It has slid from 0.068 on Oct 18 to a fresh low at 0.04662 and still can't hold above its 4H EMA20.
📌 THE SANDBOX TRADING SIGNAL (Strong, 5/5 signals agree)
Entry: 0.04789 - 0.04809
Take profit 1: 0.04688 (-2.3%)
Take profit 2: 0.04599 (-4.2%)
Take profit 3: 0.04465 (-7.0%)
Stop loss: 0.0491 (+2.3%)
📊 SAND TECHNICAL ANALYSIS (4H CHART)
Price is below the EMA20 (0.04842) and EMA50 (0.05094), both sloping down. RSI 42. Price has gone sideways near the lows for 3 days, so this is a tight-stop trade: a break of 0.04662 is what sends it lower.
🔑 KEY LEVELS
Support: 0.04662, then 0.0446
Resistance: 0.04842 (EMA20), then 0.0491
📉 Bearish scenario: a 4H close under 0.04662 opens TP2 and TP3.
📈 Bullish scenario: a close above 0.0491 cancels this signal and points to the EMA50 near 0.051.
💡 Bottom line: trend is down, but the range is tight. Small size, strict stop.
👉 Tap $SAND
to open the live chart. NFA
🔥 TRADE WITH LOWER FEES
✅ Get a 10% kickback on your Binance Futures trading fees
👇👇👇
{spot}(SANDUSDT)
[Claim your 10% Futures fee kickback here](https://www.binance.com/join?ref=SQUAREGINOS)
━━━━━━━━━━
Are metaverse coins done, or is this the bottom zone? 👇
Follow Crypto Signals and Analysis for daily signals.
#cryptosignals #SAND #FOMCWatch
⚠️ Crypto is volatile: risk only what you can afford to lose.
$SAND Price Prediction Today (Oct 28, Night Update): The Sandbox Crypto Signal & Technical Analysis 📊
🔴 SHORT | Entry 0.04789 - 0.04809 | TP1 0.04688 | SL 0.0491
👉 Tap $SAND to place your trade fast
🕒 Updated: Oct 28, 21:45 UTC · price 0.04799
While most altcoins are green tonight, The Sandbox is red (-0.5%) and down 16.9% this week. It has slid from 0.068 on Oct 18 to a fresh low at 0.04662 and still can't hold above its 4H EMA20.
📌 THE SANDBOX TRADING SIGNAL (Strong, 5/5 signals agree)
Entry: 0.04789 - 0.04809
Take profit 1: 0.04688 (-2.3%)
Take profit 2: 0.04599 (-4.2%)
Take profit 3: 0.04465 (-7.0%)
Stop loss: 0.0491 (+2.3%)
📊 SAND TECHNICAL ANALYSIS (4H CHART)
Price is below the EMA20 (0.04842) and EMA50 (0.05094), both sloping down. RSI 42. Price has gone sideways near the lows for 3 days, so this is a tight-stop trade: a break of 0.04662 is what sends it lower.
🔑 KEY LEVELS
Support: 0.04662, then 0.0446
Resistance: 0.04842 (EMA20), then 0.0491
📉 Bearish scenario: a 4H close under 0.04662 opens TP2 and TP3.
📈 Bullish scenario: a close above 0.0491 cancels this signal and points to the EMA50 near 0.051.
💡 Bottom line: trend is down, but the range is tight. Small size, strict stop.
👉 Tap $SAND
to open the live chart. NFA
🔥 TRADE WITH LOWER FEES
✅ Get a 10% kickback on your Binance Futures trading fees
👇👇👇
Claim your 10% Futures fee kickback here
━━━━━━━━━━
Are metaverse coins done, or is this the bottom zone? 👇
Follow Crypto Signals and Analysis for daily signals.
#cryptosignals #SAND #FOMCWatch
⚠️ Crypto is volatile: risk only what you can afford to lose.
62
·
--
Haussier
$NEAR Price Prediction Today (Oct 28, Night Update): 39 of 49 Top Coins Green After the Fed, NEAR Signal Update 📰
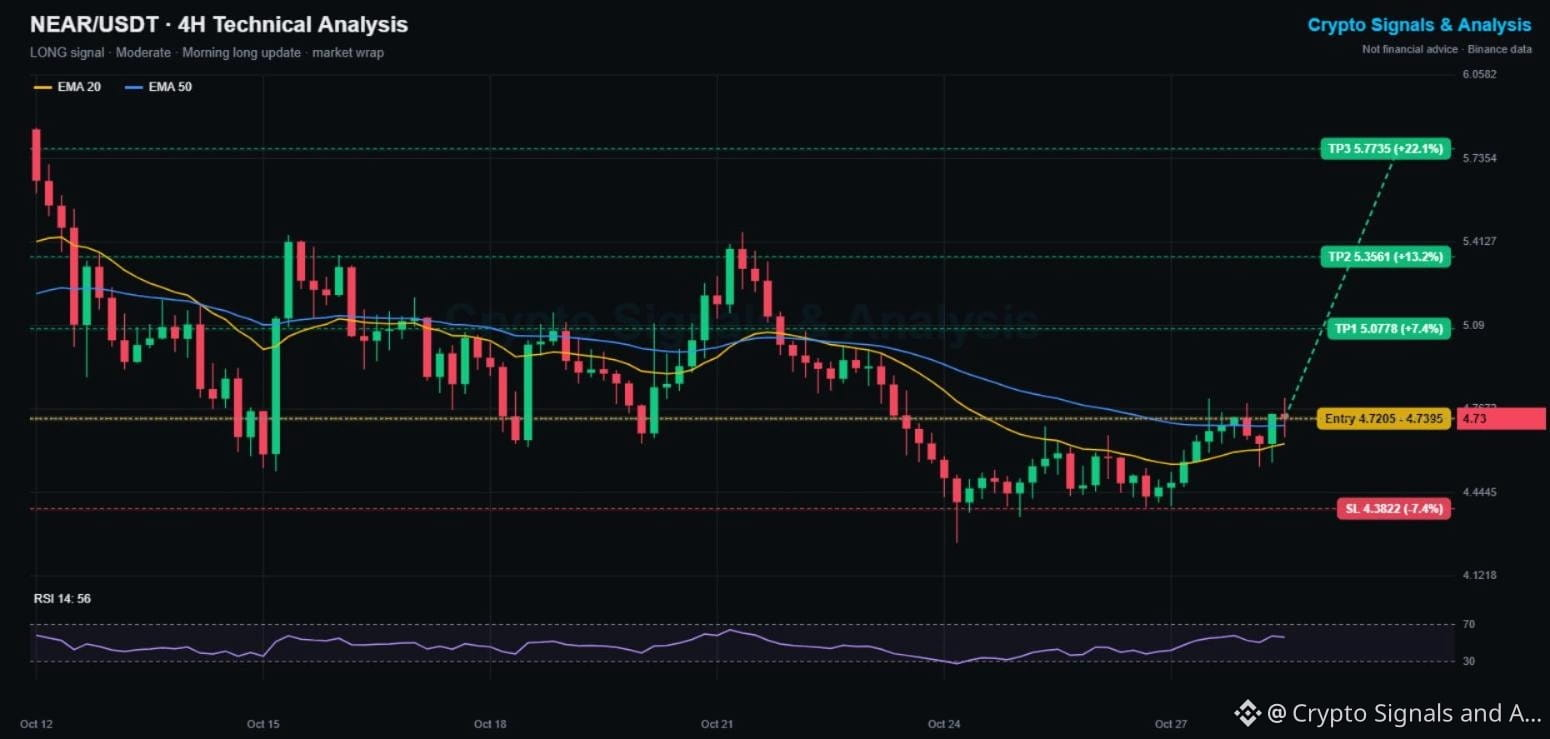
🟢 LONG | Entry 4.7205 - 4.7395 | TP1 5.0778 | SL 4.3822
👉 Tap $NEAR to place your trade fast
🕒 Updated: Oct 28, 21:30 UTC · price 4.73
📰 MARKET WRAP
The day after the Fed hold, 39 of the 49 most traded coins on Binance spot are green. Bitcoin is up 0.9% near 81,350 and Ethereum 1.0%. Initia (+22.8%) and PEPE (+12.9%) lead the gainers. NEAR Protocol is the 8th most traded coin today with about 85M USDT in volume.
⏳ MORNING NEAR SIGNAL UPDATE
This morning's long from 4.614 is still open and in profit (+2.5%). The high so far is 4.81, just short of TP1 at 4.882. The low was 4.544, well above the 4.346 stop.
📌 NEW NEAR SETUP (Moderate, 4/5 signals agree)
Entry: 4.7205 - 4.7395
Take profit 1: 5.0778 (+7.4%)
Take profit 2: 5.3561 (+13.2%)
Take profit 3: 5.7735 (+22.1%)
Stop loss: 4.3822 (-7.4%)
📊 4H CHART
Price is back above the EMA20 (4.633) and EMA50 (4.704), and the EMA20 is turning up. RSI 56. The weak spot: still down 10% on the week.
🔑 KEY LEVELS
Support: 4.70 (EMA50), then 4.39
Resistance: 4.81, then 5.08
💡 Bottom line: a 4H close above 4.81 confirms the breakout. Losing 4.70 means wait.
👉 Tap $NEAR
to open the live chart. NFA
🔥 TRADE WITH LOWER FEES
✅ Get a 10% kickback on your Binance Futures trading fees
👇👇👇
{spot}(NEARUSDT)
[Claim your 10% Futures fee kickback here](https://www.binance.com/join?ref=SQUAREGINOS)
━━━━━━━━━━
Is this a real altcoin recovery or just a relief bounce? 👇
Follow Crypto Signals and Analysis for daily signals.
#cryptosignals #NEAR #FOMCWatch
⚠️ Crypto is volatile: risk only what you can afford to lose.
$NEAR Price Prediction Today (Oct 28, Night Update): 39 of 49 Top Coins Green After the Fed, NEAR Signal Update 📰
🟢 LONG | Entry 4.7205 - 4.7395 | TP1 5.0778 | SL 4.3822
👉 Tap $NEAR to place your trade fast
🕒 Updated: Oct 28, 21:30 UTC · price 4.73
📰 MARKET WRAP
The day after the Fed hold, 39 of the 49 most traded coins on Binance spot are green. Bitcoin is up 0.9% near 81,350 and Ethereum 1.0%. Initia (+22.8%) and PEPE (+12.9%) lead the gainers. NEAR Protocol is the 8th most traded coin today with about 85M USDT in volume.
⏳ MORNING NEAR SIGNAL UPDATE
This morning's long from 4.614 is still open and in profit (+2.5%). The high so far is 4.81, just short of TP1 at 4.882. The low was 4.544, well above the 4.346 stop.
📌 NEW NEAR SETUP (Moderate, 4/5 signals agree)
Entry: 4.7205 - 4.7395
Take profit 1: 5.0778 (+7.4%)
Take profit 2: 5.3561 (+13.2%)
Take profit 3: 5.7735 (+22.1%)
Stop loss: 4.3822 (-7.4%)
📊 4H CHART
Price is back above the EMA20 (4.633) and EMA50 (4.704), and the EMA20 is turning up. RSI 56. The weak spot: still down 10% on the week.
🔑 KEY LEVELS
Support: 4.70 (EMA50), then 4.39
Resistance: 4.81, then 5.08
💡 Bottom line: a 4H close above 4.81 confirms the breakout. Losing 4.70 means wait.
👉 Tap $NEAR
to open the live chart. NFA
🔥 TRADE WITH LOWER FEES
✅ Get a 10% kickback on your Binance Futures trading fees
👇👇👇
Claim your 10% Futures fee kickback here
━━━━━━━━━━
Is this a real altcoin recovery or just a relief bounce? 👇
Follow Crypto Signals and Analysis for daily signals.
#cryptosignals #NEAR #FOMCWatch
⚠️ Crypto is volatile: risk only what you can afford to lose.
145
·
--
Baissier
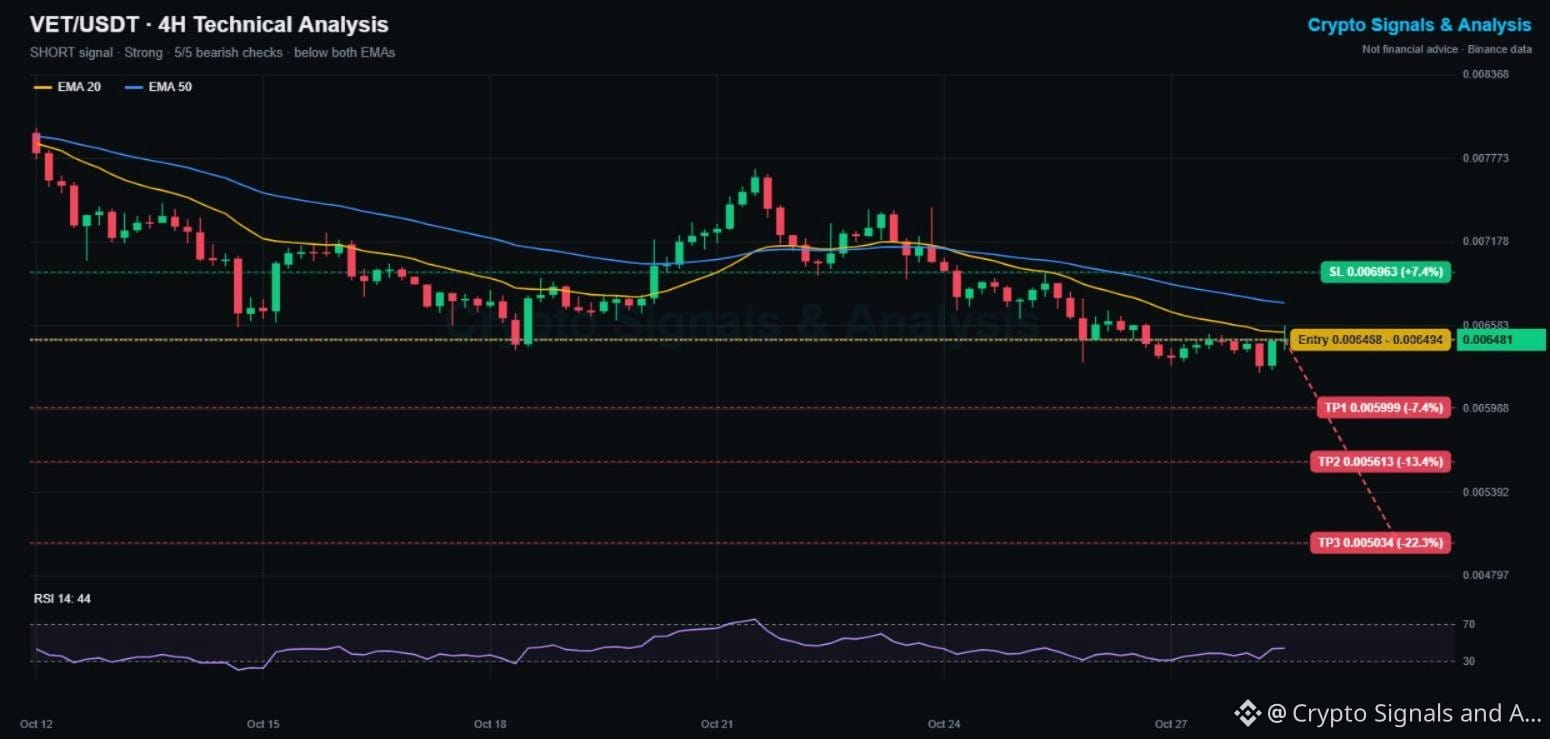
$VET Price Prediction Today (Oct 28, Evening Update): VeChain Crypto Signal & Technical Analysis 📊
🔴 SHORT | Entry 0.006468 - 0.006494 | TP1 0.005999 | SL 0.006963
👉 Tap $VET to place your trade fast
🕒 Updated: Oct 28, 21:10 UTC · price 0.006481
VeChain is down 15.2% this week and printed a fresh 2-week low at 0.006247 yesterday. Tonight's bounce is running straight into the falling 4H EMA20, the same line that has capped it since Oct 24.
📌 VECHAIN TRADING SIGNAL (Strong, 5/5 signals agree)
Entry: 0.006468 - 0.006494
Take profit 1: 0.005999 (-7.4%)
Take profit 2: 0.005613 (-13.4%)
Take profit 3: 0.005034 (-22.3%)
Stop loss: 0.006963 (+7.4%)
📊 VET TECHNICAL ANALYSIS (4H CHART)
Price is below the EMA20 (0.006534) and EMA50 (0.006743), both sloping down. RSI at 44 keeps sellers in control. Lower highs since the Oct 21 peak near 0.0078 define the trend.
🔑 KEY LEVELS
Support: 0.006247 (2-week low), then 0.0060
Resistance: 0.006534 (EMA20), then 0.006743
📉 Bearish scenario: losing 0.006247 opens TP1 near 0.0060.
📈 Bullish scenario: a 4H close above the EMA50 flips the bias. A close above 0.006963 cancels this signal.
💡 Bottom line: rejection at the EMA20 is the trigger. Wait for it, keep the stop.
👉 Tap $VET
to open the live chart. NFA
🔥 TRADE WITH LOWER FEES
✅ Get a 10% kickback on your Binance Futures trading fees
👇👇👇
{spot}(VETUSDT)
[Claim your 10% Futures fee kickback here](https://www.binance.com/join?ref=SQUAREGINOS)
━━━━━━━━━━
Does VeChain hold 0.006247 or break lower? 👇
Follow Crypto Signals and Analysis for daily signals.
#cryptosignals #VeChain #FOMCWatch
⚠️ Crypto is volatile: risk only what you can afford to lose.
$VET Price Prediction Today (Oct 28, Evening Update): VeChain Crypto Signal & Technical Analysis 📊
🔴 SHORT | Entry 0.006468 - 0.006494 | TP1 0.005999 | SL 0.006963
👉 Tap $VET to place your trade fast
🕒 Updated: Oct 28, 21:10 UTC · price 0.006481
VeChain is down 15.2% this week and printed a fresh 2-week low at 0.006247 yesterday. Tonight's bounce is running straight into the falling 4H EMA20, the same line that has capped it since Oct 24.
📌 VECHAIN TRADING SIGNAL (Strong, 5/5 signals agree)
Entry: 0.006468 - 0.006494
Take profit 1: 0.005999 (-7.4%)
Take profit 2: 0.005613 (-13.4%)
Take profit 3: 0.005034 (-22.3%)
Stop loss: 0.006963 (+7.4%)
📊 VET TECHNICAL ANALYSIS (4H CHART)
Price is below the EMA20 (0.006534) and EMA50 (0.006743), both sloping down. RSI at 44 keeps sellers in control. Lower highs since the Oct 21 peak near 0.0078 define the trend.
🔑 KEY LEVELS
Support: 0.006247 (2-week low), then 0.0060
Resistance: 0.006534 (EMA20), then 0.006743
📉 Bearish scenario: losing 0.006247 opens TP1 near 0.0060.
📈 Bullish scenario: a 4H close above the EMA50 flips the bias. A close above 0.006963 cancels this signal.
💡 Bottom line: rejection at the EMA20 is the trigger. Wait for it, keep the stop.
👉 Tap $VET
to open the live chart. NFA
🔥 TRADE WITH LOWER FEES
✅ Get a 10% kickback on your Binance Futures trading fees
👇👇👇
Claim your 10% Futures fee kickback here
━━━━━━━━━━
Does VeChain hold 0.006247 or break lower? 👇
Follow Crypto Signals and Analysis for daily signals.
#cryptosignals #VeChain #FOMCWatch
⚠️ Crypto is volatile: risk only what you can afford to lose.
23
·
--
Haussier
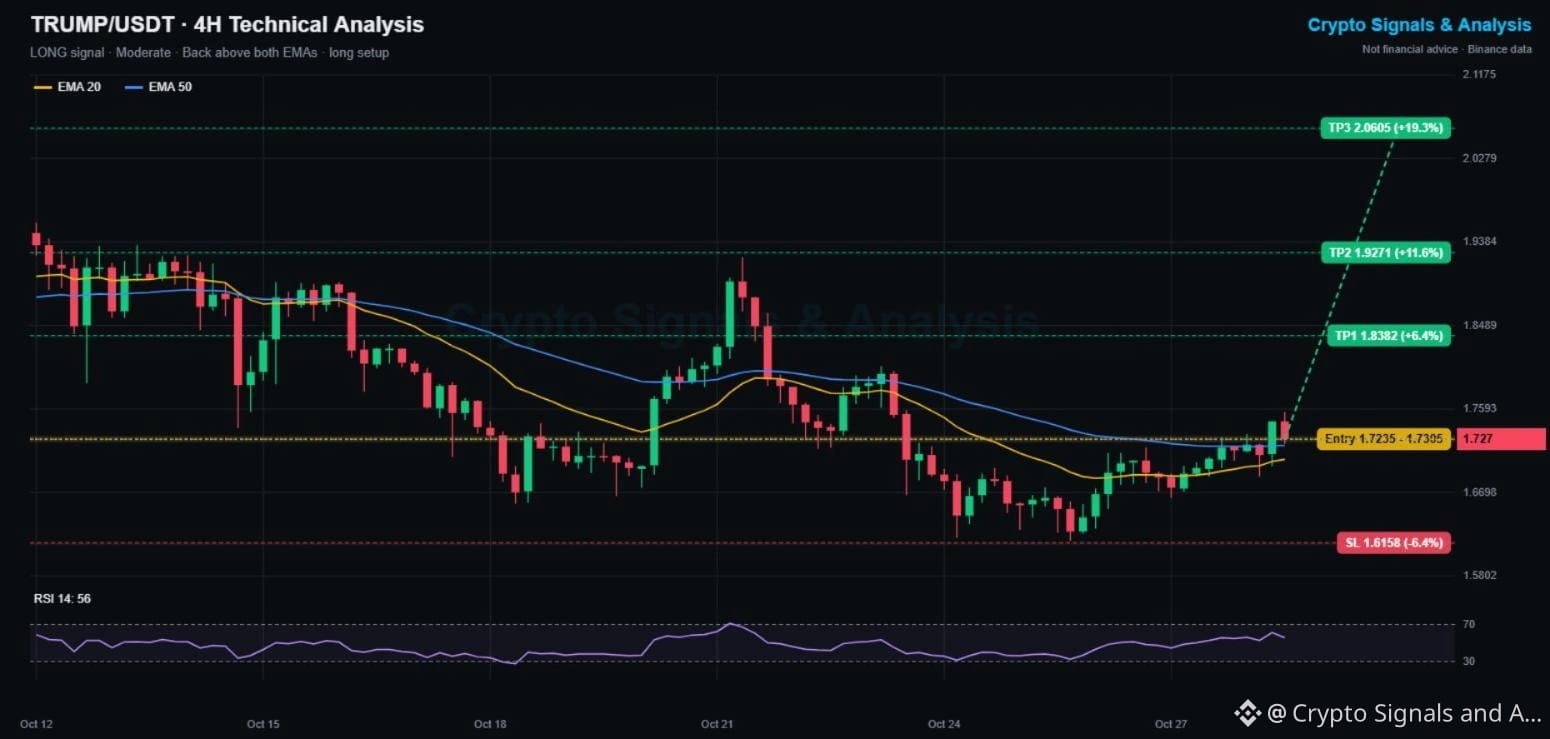
$TRUMP Price Prediction Today (Oct 28, Evening Update): Official Trump Crypto Signal & Technical Analysis 📊
🟢 LONG | Entry 1.7235 - 1.7305 | TP1 1.8382 | SL 1.6158
👉 Tap $TRUMP to place your trade fast
🕒 Updated: Oct 28, 20:52 UTC · price 1.727
Official Trump bounced off 1.618 (its lowest level in over two weeks) and just reclaimed both 4H moving averages. With memes leading tonight, this is its first real trend shift since Oct 22.
📌 OFFICIAL TRUMP TRADING SIGNAL (Moderate, 4/5 signals agree)
Entry: 1.7235 - 1.7305
Take profit 1: 1.8382 (+6.4%)
Take profit 2: 1.9271 (+11.6%)
Take profit 3: 2.0605 (+19.3%)
Stop loss: 1.6158 (-6.4%)
📊 TRUMP TECHNICAL ANALYSIS (4H CHART)
Price is above the EMA20 (1.705) and EMA50 (1.720), and the EMA20 has turned up. RSI at 56 favors buyers. The one bearish check: it is still down 6.5% on the week, so this is an early reversal, not a confirmed trend.
🔑 KEY LEVELS
Support: 1.705 (EMA20), then 1.618
Resistance: 1.756, then 1.84 and 1.93
📈 Bullish scenario: a 4H close above 1.756 opens TP1 at 1.838.
📉 Bearish scenario: losing 1.70 puts the 1.618 low back in play. A close under 1.6158 cancels this signal.
💡 Bottom line: good risk/reward off a fresh low, but size small until 1.756 breaks.
👉 Tap $TRUMP
to open the live chart. NFA
🔥 TRADE WITH LOWER FEES
✅ Get a 10% kickback on your Binance Futures trading fees
👇👇👇
{spot}(TRUMPUSDT)
[Claim your 10% Futures fee kickback here](https://www.binance.com/join?ref=SQUAREGINOS)
━━━━━━━━━━
Real reversal or just a dead-cat bounce? Vote below 👇
Follow Crypto Signals and Analysis for daily signals.
#cryptosignals #TRUMP #FOMCWatch
⚠️ Crypto is volatile: risk only what you can afford to lose.
$TRUMP Price Prediction Today (Oct 28, Evening Update): Official Trump Crypto Signal & Technical Analysis 📊
🟢 LONG | Entry 1.7235 - 1.7305 | TP1 1.8382 | SL 1.6158
👉 Tap $TRUMP to place your trade fast
🕒 Updated: Oct 28, 20:52 UTC · price 1.727
Official Trump bounced off 1.618 (its lowest level in over two weeks) and just reclaimed both 4H moving averages. With memes leading tonight, this is its first real trend shift since Oct 22.
📌 OFFICIAL TRUMP TRADING SIGNAL (Moderate, 4/5 signals agree)
Entry: 1.7235 - 1.7305
Take profit 1: 1.8382 (+6.4%)
Take profit 2: 1.9271 (+11.6%)
Take profit 3: 2.0605 (+19.3%)
Stop loss: 1.6158 (-6.4%)
📊 TRUMP TECHNICAL ANALYSIS (4H CHART)
Price is above the EMA20 (1.705) and EMA50 (1.720), and the EMA20 has turned up. RSI at 56 favors buyers. The one bearish check: it is still down 6.5% on the week, so this is an early reversal, not a confirmed trend.
🔑 KEY LEVELS
Support: 1.705 (EMA20), then 1.618
Resistance: 1.756, then 1.84 and 1.93
📈 Bullish scenario: a 4H close above 1.756 opens TP1 at 1.838.
📉 Bearish scenario: losing 1.70 puts the 1.618 low back in play. A close under 1.6158 cancels this signal.
💡 Bottom line: good risk/reward off a fresh low, but size small until 1.756 breaks.
👉 Tap $TRUMP
to open the live chart. NFA
🔥 TRADE WITH LOWER FEES
✅ Get a 10% kickback on your Binance Futures trading fees
👇👇👇
Claim your 10% Futures fee kickback here
━━━━━━━━━━
Real reversal or just a dead-cat bounce? Vote below 👇
Follow Crypto Signals and Analysis for daily signals.
#cryptosignals #TRUMP #FOMCWatch
⚠️ Crypto is volatile: risk only what you can afford to lose.
219
·
--
Baissier
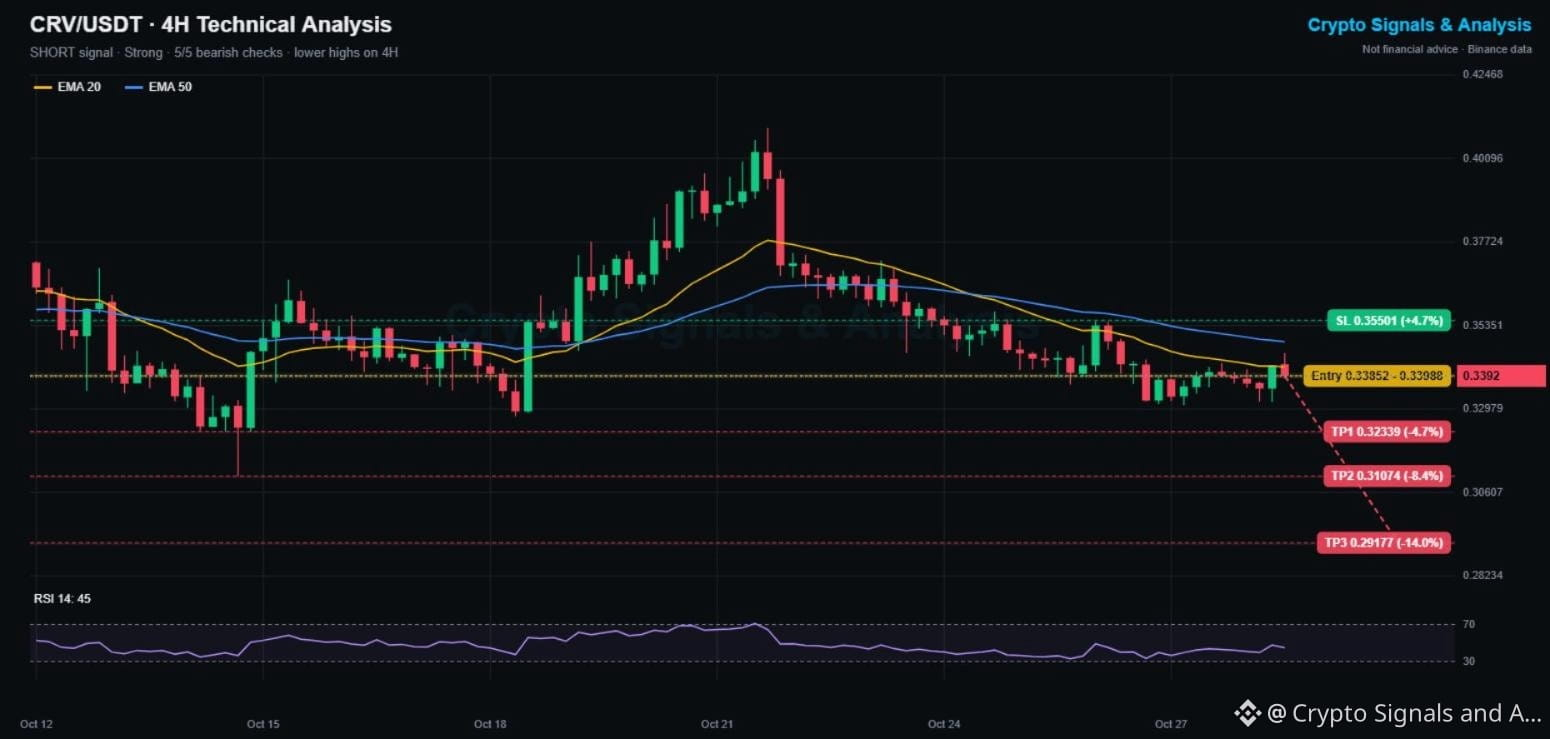
$CRV Price Prediction Today (Oct 28, Evening Update): Curve DAO Crypto Signal & Technical Analysis 📊
🔴 SHORT | Entry 0.3385 - 0.3399 | TP1 0.3234 | SL 0.3550
👉 Tap $CRV to place your trade fast
🕒 Updated: Oct 28, 20:35 UTC · price 0.3392
Curve DAO is one of the weakest large DeFi tokens this week: down 15.8% in 7 days and flat today while memes rally. Since the Oct 21 rejection near 0.41, every 4H bounce has made a lower high.
📌 CURVE DAO TRADING SIGNAL (Strong, 5/5 signals agree)
Entry: 0.3385 - 0.3399
Take profit 1: 0.3234 (-4.7%)
Take profit 2: 0.3107 (-8.4%)
Take profit 3: 0.2918 (-14.0%)
Stop loss: 0.3550 (+4.7%)
📊 CRV TECHNICAL ANALYSIS (4H CHART)
Price is below the EMA20 (0.3417) and EMA50 (0.3489), and both are sloping down. RSI at 45 shows sellers in control without being oversold. The latest bounce died right at the EMA20.
🔑 KEY LEVELS
Support: 0.331, then 0.311 (Oct 18 low)
Resistance: 0.342 (EMA20), then 0.355
📉 Bearish scenario: a 4H close under 0.331 opens TP1 and the 0.311 low.
📈 Bullish scenario: reclaiming 0.349 (EMA50) flips the bias. A close above 0.3550 cancels this signal.
💡 Bottom line: trend, momentum and weekly change all point down. Respect the stop.
👉 Tap $CRV
to open the live chart. NFA
🔥 TRADE WITH LOWER FEES
✅ Get a 10% kickback on your Binance Futures trading fees
👇👇👇
{spot}(CRVUSDT)
[Claim your 10% Futures fee kickback here](https://www.binance.com/join?ref=SQUAREGINOS)
━━━━━━━━━━
Is DeFi bleeding out, or is Curve DAO close to a bottom? 👇
Follow Crypto Signals and Analysis for daily signals.
#cryptosignals #CRV #FOMCWatch
⚠️ Crypto is volatile: risk only what you can afford to lose.
$CRV Price Prediction Today (Oct 28, Evening Update): Curve DAO Crypto Signal & Technical Analysis 📊
🔴 SHORT | Entry 0.3385 - 0.3399 | TP1 0.3234 | SL 0.3550
👉 Tap $CRV to place your trade fast
🕒 Updated: Oct 28, 20:35 UTC · price 0.3392
Curve DAO is one of the weakest large DeFi tokens this week: down 15.8% in 7 days and flat today while memes rally. Since the Oct 21 rejection near 0.41, every 4H bounce has made a lower high.
📌 CURVE DAO TRADING SIGNAL (Strong, 5/5 signals agree)
Entry: 0.3385 - 0.3399
Take profit 1: 0.3234 (-4.7%)
Take profit 2: 0.3107 (-8.4%)
Take profit 3: 0.2918 (-14.0%)
Stop loss: 0.3550 (+4.7%)
📊 CRV TECHNICAL ANALYSIS (4H CHART)
Price is below the EMA20 (0.3417) and EMA50 (0.3489), and both are sloping down. RSI at 45 shows sellers in control without being oversold. The latest bounce died right at the EMA20.
🔑 KEY LEVELS
Support: 0.331, then 0.311 (Oct 18 low)
Resistance: 0.342 (EMA20), then 0.355
📉 Bearish scenario: a 4H close under 0.331 opens TP1 and the 0.311 low.
📈 Bullish scenario: reclaiming 0.349 (EMA50) flips the bias. A close above 0.3550 cancels this signal.
💡 Bottom line: trend, momentum and weekly change all point down. Respect the stop.
👉 Tap $CRV
to open the live chart. NFA
🔥 TRADE WITH LOWER FEES
✅ Get a 10% kickback on your Binance Futures trading fees
👇👇👇
Claim your 10% Futures fee kickback here
━━━━━━━━━━
Is DeFi bleeding out, or is Curve DAO close to a bottom? 👇
Follow Crypto Signals and Analysis for daily signals.
#cryptosignals #CRV #FOMCWatch
⚠️ Crypto is volatile: risk only what you can afford to lose.
43
·
--
Haussier
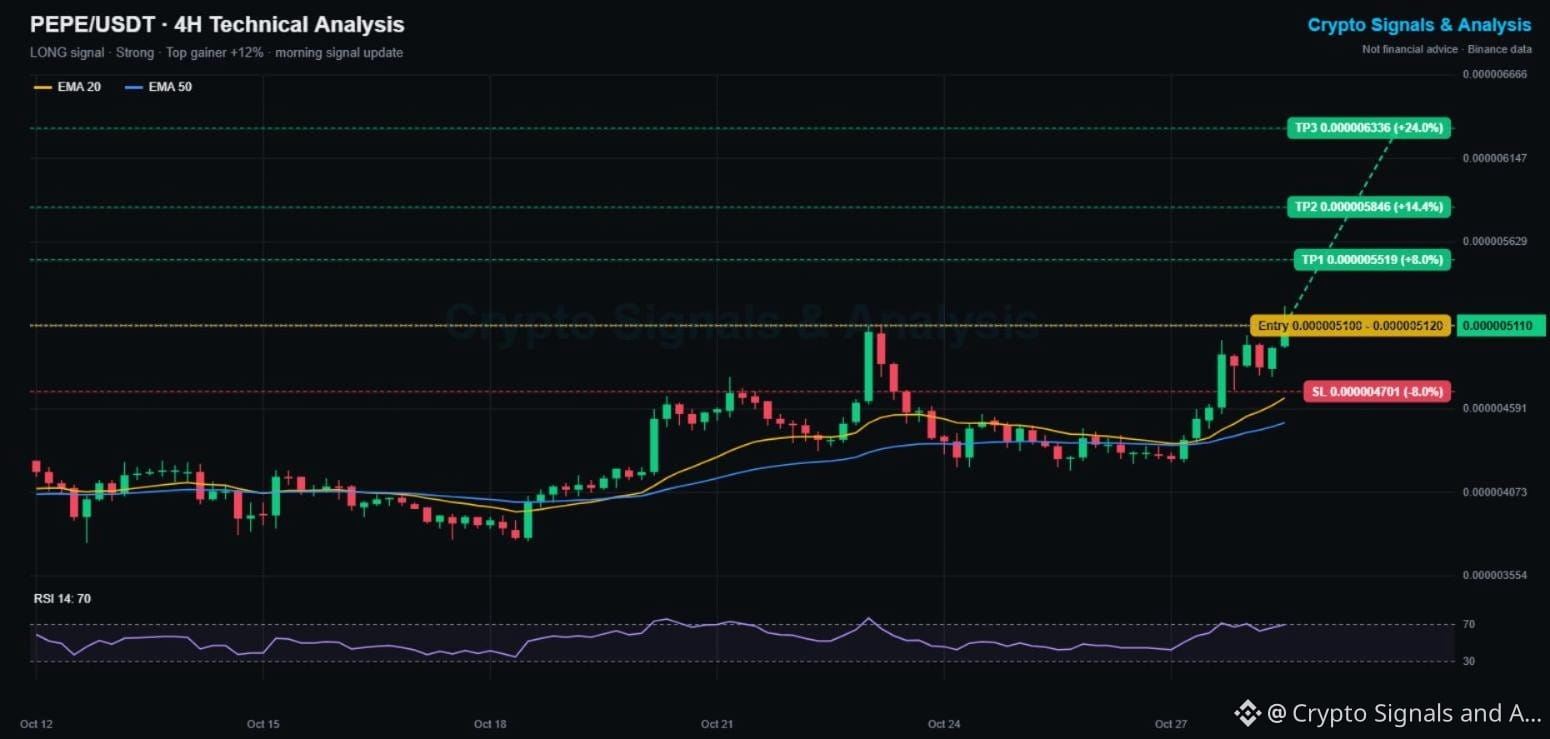
$PEPE Price Prediction Today (Oct 28, Evening Update): PEPE Leads Binance Gainers +12%, Morning Signal Hits TP1 🚀
🟢 LONG | Entry 0.00000510 - 0.00000512 | TP1 0.00000552 | SL 0.00000470
👉 Tap $PEPE to place your trade fast
🕒 Updated: Oct 28, 20:20 UTC · price 0.00000511
📰 MARKET UPDATE
PEPE is the top gainer among high-volume coins on Binance spot tonight: +12.4% in 24 hours on about 102M USDT volume. Bitcoin is up only 0.6% after the Fed hold, so memes are leading this bounce.
✅ MORNING SIGNAL RESULT
This morning we posted a PEPE long from 0.00000484. In the last hour price tagged 0.00000523, which was TP1 (+8%). The stop at 0.00000445 was never touched. TP2 and TP3 are still open.
📌 NEW PEPE SETUP (Strong, 5/5 signals agree)
Entry: 0.00000510 - 0.00000512
Take profit 1: 0.00000552 (+8%)
Take profit 2: 0.00000585 (+14%)
Take profit 3: 0.00000634 (+24%)
Stop loss: 0.00000470 (-8%)
📊 4H CHART
Price is far above the EMA20 (0.00000466) and EMA50 (0.00000451). RSI is 70, so momentum is strong but stretched. Chasing here is riskier than this morning; a dip to 0.00000497 - 0.00000500 would be a better fill.
🔑 KEY LEVELS
Support: 0.00000500, then 0.00000470
Resistance: 0.00000523 (today's high), then 0.00000552
💡 Bottom line: trend is up, but take partial profit at targets and keep the stop.
👉 Tap $PEPE
to open the live chart. NFA
🔥 TRADE WITH LOWER FEES
✅ Get a 10% kickback on your Binance Futures trading fees
👇👇👇
{spot}(PEPEUSDT)
[Claim your 10% Futures fee kickback here](https://www.binance.com/join?ref=SQUAREGINOS)
━━━━━━━━━━
Did you catch the PEPE move or are you waiting for a dip? 👇
Follow Crypto Signals and Analysis for daily signals.
#cryptosignals #PEPE #FOMCWatch
⚠️ Crypto is volatile: risk only what you can afford to lose.
$PEPE Price Prediction Today (Oct 28, Evening Update): PEPE Leads Binance Gainers +12%, Morning Signal Hits TP1 🚀
🟢 LONG | Entry 0.00000510 - 0.00000512 | TP1 0.00000552 | SL 0.00000470
👉 Tap $PEPE to place your trade fast
🕒 Updated: Oct 28, 20:20 UTC · price 0.00000511
📰 MARKET UPDATE
PEPE is the top gainer among high-volume coins on Binance spot tonight: +12.4% in 24 hours on about 102M USDT volume. Bitcoin is up only 0.6% after the Fed hold, so memes are leading this bounce.
✅ MORNING SIGNAL RESULT
This morning we posted a PEPE long from 0.00000484. In the last hour price tagged 0.00000523, which was TP1 (+8%). The stop at 0.00000445 was never touched. TP2 and TP3 are still open.
📌 NEW PEPE SETUP (Strong, 5/5 signals agree)
Entry: 0.00000510 - 0.00000512
Take profit 1: 0.00000552 (+8%)
Take profit 2: 0.00000585 (+14%)
Take profit 3: 0.00000634 (+24%)
Stop loss: 0.00000470 (-8%)
📊 4H CHART
Price is far above the EMA20 (0.00000466) and EMA50 (0.00000451). RSI is 70, so momentum is strong but stretched. Chasing here is riskier than this morning; a dip to 0.00000497 - 0.00000500 would be a better fill.
🔑 KEY LEVELS
Support: 0.00000500, then 0.00000470
Resistance: 0.00000523 (today's high), then 0.00000552
💡 Bottom line: trend is up, but take partial profit at targets and keep the stop.
👉 Tap $PEPE
to open the live chart. NFA
🔥 TRADE WITH LOWER FEES
✅ Get a 10% kickback on your Binance Futures trading fees
👇👇👇
Claim your 10% Futures fee kickback here
━━━━━━━━━━
Did you catch the PEPE move or are you waiting for a dip? 👇
Follow Crypto Signals and Analysis for daily signals.
#cryptosignals #PEPE #FOMCWatch
⚠️ Crypto is volatile: risk only what you can afford to lose.
48
·
--
Baissier
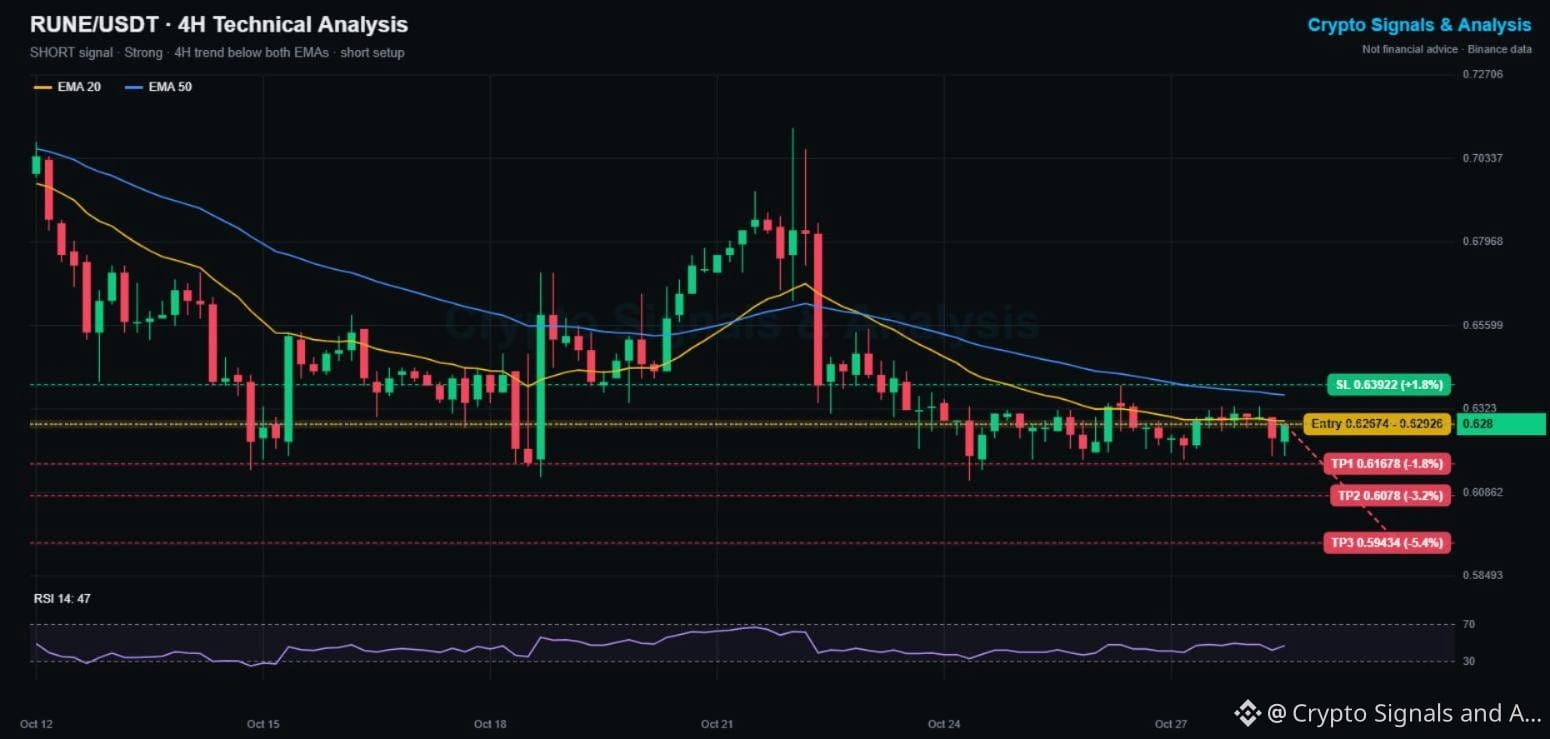
$RUNE Price Prediction Today (Oct 28, Evening Update): THORChain Crypto Signal & Technical Analysis 📊
🔴 SHORT | Entry 0.6267 - 0.6293 | TP1 0.6168 | SL 0.6392
👉 Tap $RUNE to place your trade fast
🕒 Updated: Oct 28, 20:00 UTC · price 0.628
While Bitcoin bounced after the Fed hold, THORChain did not join in. It is down 8.5% this week and keeps getting rejected under its 4H moving averages.
📌 THORCHAIN TRADING SIGNAL (Strong, 4/5 signals agree)
Entry: 0.6267 - 0.6293
Take profit 1: 0.6168 (-1.8%)
Take profit 2: 0.6078 (-3.2%)
Take profit 3: 0.5943 (-5.4%)
Stop loss: 0.6392 (+1.8%)
📊 RUNE TECHNICAL ANALYSIS (4H CHART)
Price sits below the EMA20 (0.6289) and the EMA50 (0.6363), and the EMA20 is sloping down. Every bounce since Oct 23 has stalled near 0.639. RSI at 47 leaves room to fall before oversold.
🔑 KEY LEVELS
Support: 0.618, then 0.612 (100-candle low)
Resistance: 0.636 (EMA50), then 0.639
📉 Bearish scenario: a 4H close under 0.618 opens TP2 and a retest of 0.612.
📈 Bullish scenario: reclaiming the EMA50 flips the bias. A close above 0.6392 cancels this signal.
💡 Bottom line: weak relative strength on a green day is a warning sign. Tight stop, small size.
👉 Tap $RUNE
to open the live chart. NFA
🔥 TRADE WITH LOWER FEES
✅ Get a 10% kickback on your Binance Futures trading fees
👇👇👇
{spot}(RUNEUSDT)
[Claim your 10% Futures fee kickback here](https://www.binance.com/join?ref=SQUAREGINOS)
━━━━━━━━━━
Does THORChain lose 0.618 this week, or bounce first? 👇
Follow Crypto Signals and Analysis for daily signals.
#cryptosignals #RUNE #FOMCWatch
⚠️ Crypto is volatile: risk only what you can afford to lose.
$RUNE Price Prediction Today (Oct 28, Evening Update): THORChain Crypto Signal & Technical Analysis 📊
🔴 SHORT | Entry 0.6267 - 0.6293 | TP1 0.6168 | SL 0.6392
👉 Tap $RUNE to place your trade fast
🕒 Updated: Oct 28, 20:00 UTC · price 0.628
While Bitcoin bounced after the Fed hold, THORChain did not join in. It is down 8.5% this week and keeps getting rejected under its 4H moving averages.
📌 THORCHAIN TRADING SIGNAL (Strong, 4/5 signals agree)
Entry: 0.6267 - 0.6293
Take profit 1: 0.6168 (-1.8%)
Take profit 2: 0.6078 (-3.2%)
Take profit 3: 0.5943 (-5.4%)
Stop loss: 0.6392 (+1.8%)
📊 RUNE TECHNICAL ANALYSIS (4H CHART)
Price sits below the EMA20 (0.6289) and the EMA50 (0.6363), and the EMA20 is sloping down. Every bounce since Oct 23 has stalled near 0.639. RSI at 47 leaves room to fall before oversold.
🔑 KEY LEVELS
Support: 0.618, then 0.612 (100-candle low)
Resistance: 0.636 (EMA50), then 0.639
📉 Bearish scenario: a 4H close under 0.618 opens TP2 and a retest of 0.612.
📈 Bullish scenario: reclaiming the EMA50 flips the bias. A close above 0.6392 cancels this signal.
💡 Bottom line: weak relative strength on a green day is a warning sign. Tight stop, small size.
👉 Tap $RUNE
to open the live chart. NFA
🔥 TRADE WITH LOWER FEES
✅ Get a 10% kickback on your Binance Futures trading fees
👇👇👇
Claim your 10% Futures fee kickback here
━━━━━━━━━━
Does THORChain lose 0.618 this week, or bounce first? 👇
Follow Crypto Signals and Analysis for daily signals.
#cryptosignals #RUNE #FOMCWatch
⚠️ Crypto is volatile: risk only what you can afford to lose.
21
·
--
Haussier
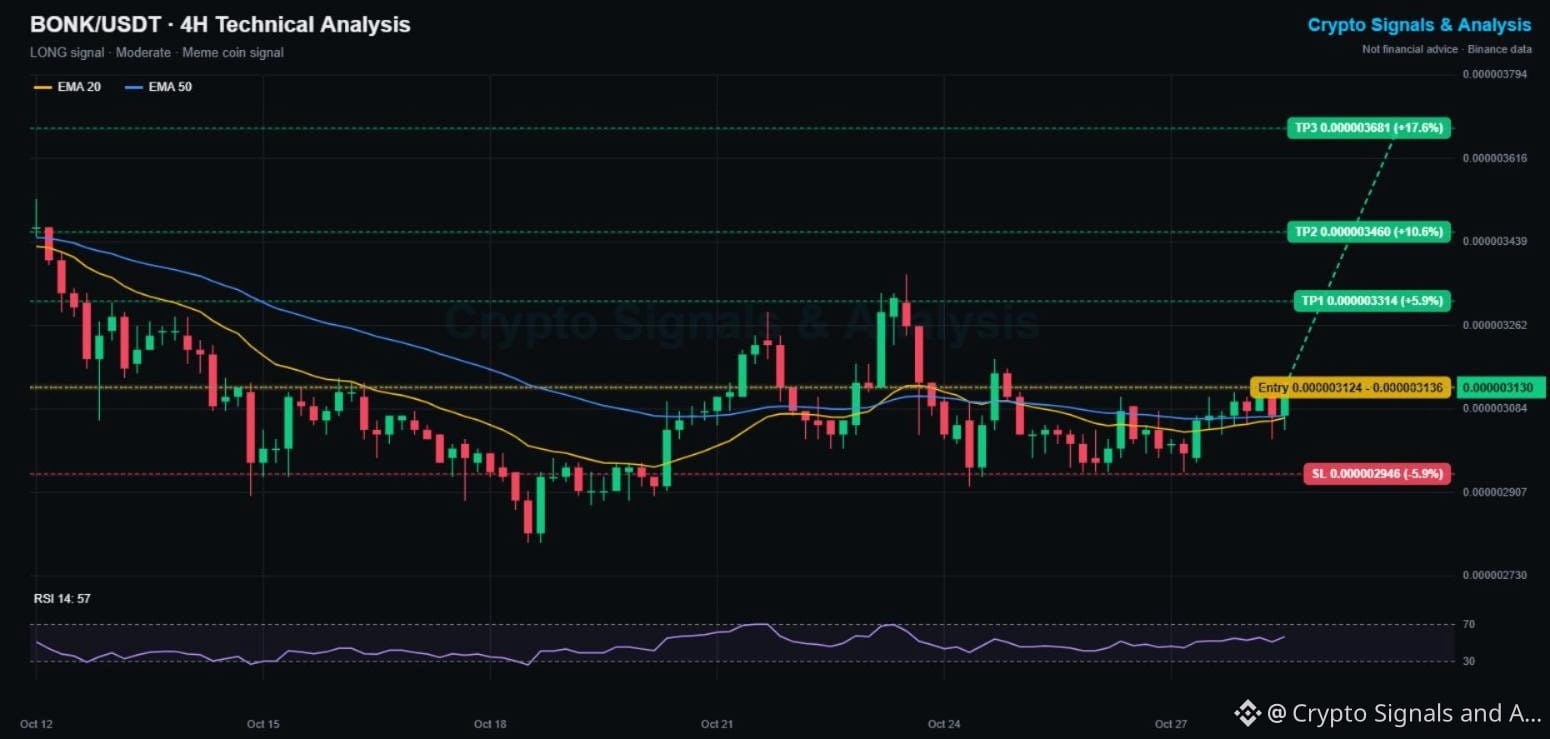
$BONK Price Prediction Today (Oct 28, Evening Update): Bonk Crypto Signal & Technical Analysis 📊
🟢 LONG | Entry 0.000003124 - 0.000003136 | TP1 0.000003314 | SL 0.000002946
👉 Tap $BONK to place your trade fast
🕒 Updated: Oct 28, 19:40 UTC · price 0.000003130
Bonk is up 2% today and just tagged a new 5-day high as meme coins bounce after the Fed hold. It held the 0.00000295 floor all week and is now sitting on top of both 4H EMAs.
📌 BONK TRADING SIGNAL (Moderate, 4/5 signals agree)
Entry: 0.000003124 - 0.000003136
Take profit 1: 0.000003314 (+5.9%)
Take profit 2: 0.000003460 (+10.6%)
Take profit 3: 0.000003681 (+17.6%)
Stop loss: 0.000002946 (-5.9%)
📊 BONK TECHNICAL ANALYSIS (4H CHART)
Price holds above the EMA20 (0.000003065) and EMA50 (0.000003070), and the EMA20 is sloping up. RSI at 57 favors buyers. The Oct 23 spike to 0.00000330 is the first real resistance, close to TP1.
🔑 KEY LEVELS
Support: 0.00000307 (EMAs), then 0.00000295
Resistance: 0.00000314, then 0.00000330
📈 Bullish scenario: a 4H close above 0.00000314 opens TP1 and the 0.00000346 zone.
📉 Bearish scenario: losing the EMAs sends Bonk back to its range. A close under 0.000002946 cancels this signal.
💡 Bottom line: Solana memes are waking up, and Bonk has the cleanest chart of the group.
👉 Tap $BONK
to open the live chart. NFA
🔥 TRADE WITH LOWER FEES
✅ Get a 10% kickback on your Binance Futures trading fees
👇👇👇
{spot}(BONKUSDT)
[Claim your 10% Futures fee kickback here](https://www.binance.com/join?ref=SQUAREGINOS)
━━━━━━━━━━
Best Solana meme right now: BONK, WIF or something new? 👇
Follow Crypto Signals and Analysis for daily signals.
#cryptosignals #BONK #FOMCWatch
⚠️ Crypto is volatile: risk only what you can afford to lose.
$BONK Price Prediction Today (Oct 28, Evening Update): Bonk Crypto Signal & Technical Analysis 📊
🟢 LONG | Entry 0.000003124 - 0.000003136 | TP1 0.000003314 | SL 0.000002946
👉 Tap $BONK to place your trade fast
🕒 Updated: Oct 28, 19:40 UTC · price 0.000003130
Bonk is up 2% today and just tagged a new 5-day high as meme coins bounce after the Fed hold. It held the 0.00000295 floor all week and is now sitting on top of both 4H EMAs.
📌 BONK TRADING SIGNAL (Moderate, 4/5 signals agree)
Entry: 0.000003124 - 0.000003136
Take profit 1: 0.000003314 (+5.9%)
Take profit 2: 0.000003460 (+10.6%)
Take profit 3: 0.000003681 (+17.6%)
Stop loss: 0.000002946 (-5.9%)
📊 BONK TECHNICAL ANALYSIS (4H CHART)
Price holds above the EMA20 (0.000003065) and EMA50 (0.000003070), and the EMA20 is sloping up. RSI at 57 favors buyers. The Oct 23 spike to 0.00000330 is the first real resistance, close to TP1.
🔑 KEY LEVELS
Support: 0.00000307 (EMAs), then 0.00000295
Resistance: 0.00000314, then 0.00000330
📈 Bullish scenario: a 4H close above 0.00000314 opens TP1 and the 0.00000346 zone.
📉 Bearish scenario: losing the EMAs sends Bonk back to its range. A close under 0.000002946 cancels this signal.
💡 Bottom line: Solana memes are waking up, and Bonk has the cleanest chart of the group.
👉 Tap $BONK
to open the live chart. NFA
🔥 TRADE WITH LOWER FEES
✅ Get a 10% kickback on your Binance Futures trading fees
👇👇👇
Claim your 10% Futures fee kickback here
━━━━━━━━━━
Best Solana meme right now: BONK, WIF or something new? 👇
Follow Crypto Signals and Analysis for daily signals.
#cryptosignals #BONK #FOMCWatch
⚠️ Crypto is volatile: risk only what you can afford to lose.
1
39
·
--
Haussier
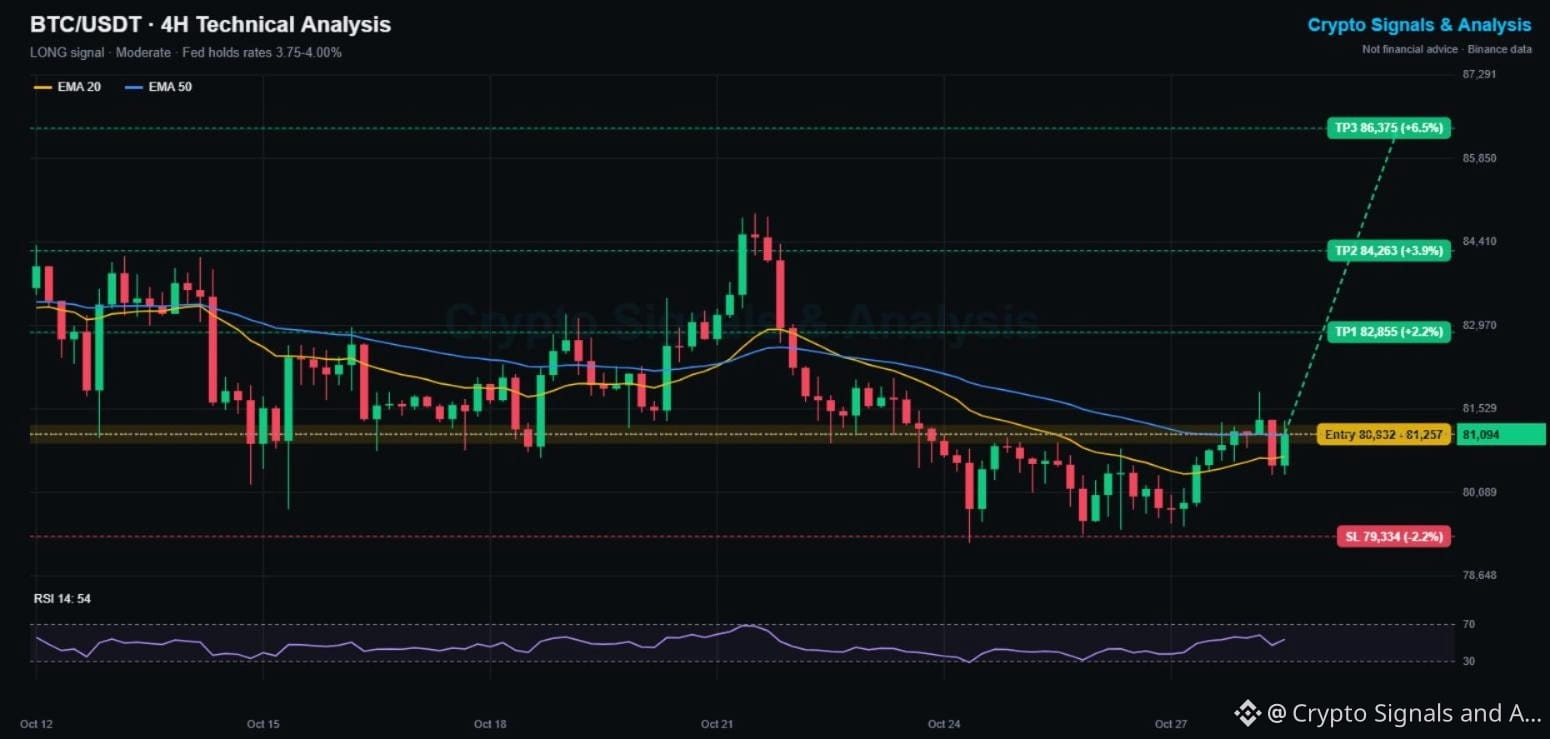
$BTC Price Prediction After the Fed (Oct 28, Evening Update): Fed Holds Rates, Bitcoin Signal Flips 🏛️
🟢 LONG | Entry 80,932 - 81,257 | TP1 82,855 | SL 79,334
👉 Tap $BTC to place your trade fast
🕒 Updated: Oct 28, 19:25 UTC · price 81,094
The Fed kept rates unchanged at 3.75% to 4.00% today, as markets expected The statement said inflation "remains elevated" while activity is expanding. Bitcoin's first reaction: a bounce back above 81K.
🔄 UPDATE ON THIS MORNING'S SIGNAL
Our 15:00 short (entry 80,400 to 80,722) did not reach TP1 at 79,274, and price climbed to 81,327 instead. The stop at 81,848 was not hit. We close that idea and follow the new trend.
📌 NEW BITCOIN SIGNAL (Moderate, 3/5 signals agree)
Entry: 80,932 - 81,257
Take profit 1: 82,855 (+2.2%)
Take profit 2: 84,263 (+3.9%)
Take profit 3: 86,375 (+6.5%)
Stop loss: 79,334 (-2.2%)
📊 BTC TECHNICAL ANALYSIS (4H CHART)
Price is back above the EMA20 (80,711) and just over the EMA50 (81,076), and the EMA20 is turning up. RSI at 54 leaves room to run. The weekly trend is still down (-4%), so the 81,800 high from earlier today is the line buyers need to break.
🔑 KEY LEVELS
Support: 80,711 (EMA20), then 79,370
Resistance: 81,823, then 82,900
📈 Bullish scenario: a 4H close above 81,823 confirms the post-Fed breakout toward TP1 and TP2.
📉 Bearish scenario: losing 80,700 means the Fed bounce failed. A close under 79,334 cancels this signal.
💡 Bottom line: no surprise from the Fed, and the market took it as a relief.
👉 Tap $BTC
to open the live chart. NFA
🔥 TRADE WITH LOWER FEES
✅ Get a 10% kickback on your Binance Futures trading fees
👇👇👇
{spot}(BTCUSDT)
[Claim your 10% Futures fee kickback here](https://www.binance.com/join?ref=SQUAREGINOS)
━━━━━━━━━━
Fed held rates. Is Bitcoin going to 85K or back to 79K first? 👇
Follow Crypto Signals and Analysis for daily signals.
#cryptosignals #FOMCWatch #BTC
⚠️ Crypto is volatile: risk only what you can afford to lose.
$BTC Price Prediction After the Fed (Oct 28, Evening Update): Fed Holds Rates, Bitcoin Signal Flips 🏛️
🟢 LONG | Entry 80,932 - 81,257 | TP1 82,855 | SL 79,334
👉 Tap $BTC to place your trade fast
🕒 Updated: Oct 28, 19:25 UTC · price 81,094
The Fed kept rates unchanged at 3.75% to 4.00% today, as markets expected The statement said inflation "remains elevated" while activity is expanding. Bitcoin's first reaction: a bounce back above 81K.
🔄 UPDATE ON THIS MORNING'S SIGNAL
Our 15:00 short (entry 80,400 to 80,722) did not reach TP1 at 79,274, and price climbed to 81,327 instead. The stop at 81,848 was not hit. We close that idea and follow the new trend.
📌 NEW BITCOIN SIGNAL (Moderate, 3/5 signals agree)
Entry: 80,932 - 81,257
Take profit 1: 82,855 (+2.2%)
Take profit 2: 84,263 (+3.9%)
Take profit 3: 86,375 (+6.5%)
Stop loss: 79,334 (-2.2%)
📊 BTC TECHNICAL ANALYSIS (4H CHART)
Price is back above the EMA20 (80,711) and just over the EMA50 (81,076), and the EMA20 is turning up. RSI at 54 leaves room to run. The weekly trend is still down (-4%), so the 81,800 high from earlier today is the line buyers need to break.
🔑 KEY LEVELS
Support: 80,711 (EMA20), then 79,370
Resistance: 81,823, then 82,900
📈 Bullish scenario: a 4H close above 81,823 confirms the post-Fed breakout toward TP1 and TP2.
📉 Bearish scenario: losing 80,700 means the Fed bounce failed. A close under 79,334 cancels this signal.
💡 Bottom line: no surprise from the Fed, and the market took it as a relief.
👉 Tap $BTC
to open the live chart. NFA
🔥 TRADE WITH LOWER FEES
✅ Get a 10% kickback on your Binance Futures trading fees
👇👇👇
Claim your 10% Futures fee kickback here
━━━━━━━━━━
Fed held rates. Is Bitcoin going to 85K or back to 79K first? 👇
Follow Crypto Signals and Analysis for daily signals.
#cryptosignals #FOMCWatch #BTC
⚠️ Crypto is volatile: risk only what you can afford to lose.
36
Connectez-vous pour découvrir plus de contenu
Rejoignez la communauté mondiale des adeptes de cryptomonnaies sur Binance Square
⚡️ Suviez les dernières informations importantes sur les cryptomonnaies.
💬 Jugé digne de confiance par la plus grande plateforme d’échange de cryptomonnaies au monde.
👍 Découvrez les connaissances que partagent les créateurs vérifiés.
Adresse e-mail/Nº de téléphone