

Aadi 11
476 Publications

Aadi 11
Signaler
Bloquer l’utilisateur
Ouvert au trading
Trade régulièrement
4.7 an(s)
72 Suivis
58 Abonnés
350 J’aime
Publications
Portefeuille
Tous
Citations
Vidéos
·
--
BITCOIN
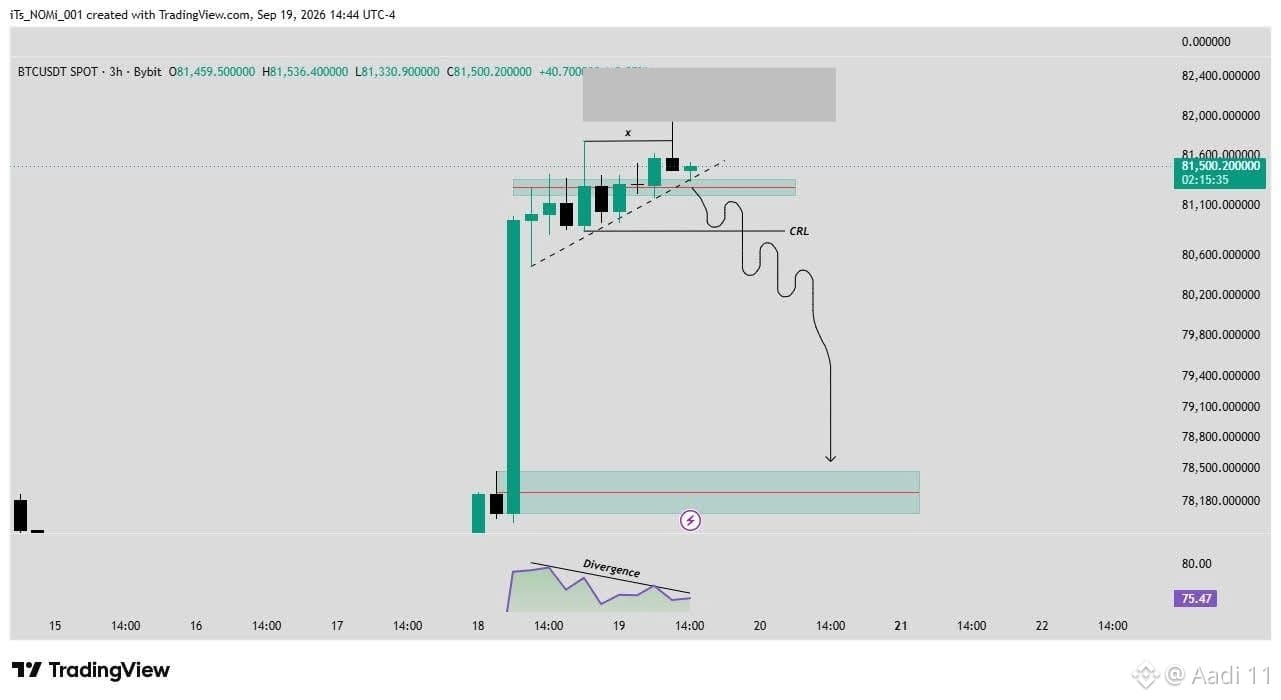
Btc is looking week here.
And we are opening some risky shorts here in our premium group.
TPS will be 80k 79k 78k ++.
And if market once again go upside and tap the liquidity+ inducement above 83k then it will be good and will open more shorts above 83k.
This is my simple next plan and according to this plan will share all trades in premium.
I shared you my proper plan now its depend upon you how you excute the trades.$BTC #BOJRaisesRatesTo31YearHigh
{future}(BTCUSDT)
$AKE
BITCOIN
Btc is looking week here.
And we are opening some risky shorts here in our premium group.
TPS will be 80k 79k 78k ++.
And if market once again go upside and tap the liquidity+ inducement above 83k then it will be good and will open more shorts above 83k.
This is my simple next plan and according to this plan will share all trades in premium.
I shared you my proper plan now its depend upon you how you excute the trades.$BTC #BOJRaisesRatesTo31YearHigh
$AKE
Btc is looking week here.
And we are opening some risky shorts here in our premium group.
TPS will be 80k 79k 78k ++.
And if market once again go upside and tap the liquidity+ inducement above 83k then it will be good and will open more shorts above 83k.
This is my simple next plan and according to this plan will share all trades in premium.
I shared you my proper plan now its depend upon you how you excute the trades.$BTC #BOJRaisesRatesTo31YearHigh
$AKE
324
·
--
U.S. seizes $61 million in crypto from Iranian oil sales on Binance
U.S. seizes $61 million in crypto from Iranian oil sales on Binance

1
1
·
--
Treasury Sanctions Crypto Exchange Behind Iran's Bitcoin Tolls on Hormuz ShipsThe U.S. Treasury has sanctioned BitBank, naming the Iranian exchange it says carried the Bitcoin that shipping companies paid for safe passage through the Strait of Hormuz.
Since June, the Office of Foreign Assets Control said, the Hormuz Safe Marine Services Authority has used BitBank to pass the payments it collects on to the Iranian regime. That authority was the body charging vessels in Bitcoin for transit rights, a scheme Treasury designated in July.Between June and July, Treasury says, BitBank was used to move "hundreds of millions of dollars' worth of Bitcoin" to the Islamic Revolutionary Guard Corps.
BitBank is controlled by Babak Zanjani, an Iranian financier OFAC designated in January. Sentenced to death in Iran in 2016 for embezzling from the National Iranian Oil Company, he had his sentence commuted in 2024 and resurfaced last year backing regime-linked ventures. Treasury says he has been advertising BitBank on his social media accounts since at least 2024.
Four more designations
The action also covers Pishtaz Simorgh Electronic Trade Company, which built BitBank's software and is a subsidiary of the already-designated Dot One Value Creation Group, along with three Dot One executives: Hossein Ali Zaker Hossein, Mohammad Mahdi Zaker Hossein and Seyed Adel Heidari.
Treasury describes the first as involved in most of Zanjani's sanctions evasion, including oil exports, and says he has brokered digital asset transactions that ended up with the IRGC.
US Can Now Sanction Anyone Operating in Iran's Crypto Sector
All five were designated under Executive Order 13902, which the administration extended in August to cover anyone operating in Iran's digital asset sector. It is the authority Treasury has been using since to work through the network, including the crypto exchanges it designated for laundering Iranian funds.
"Efforts to finance the Iranian regime using cryptocurrencies are not beyond OFAC's reach," said Treasury Secretary Scott Bessent. "If you support the Iranian regime, the Department of the Treasury will sanction you."
The designations fall under Operation Economic Outcast, the campaign Bessent announced on August 24 and dubbed Economic D-Day, which Treasury says is aimed at severing Iran's remaining economic lifelines with help from the EU, the UK and Gulf partners.
U.S. assets belonging to the five are blocked, as are any entities they own half or more of, and non-U.S. firms dealing with them risk secondary sanctions.
Traders do not expect the pressure to lift soon. On Myriad, a prediction market developed by Decrypt's parent company Dastan, the odds of Washington announcing an end to its naval blockade of Iranian shipping by September 30 have fallen to 10%, down 30 points. Even a December 31 deadline is only a 60% shot.#BTCBreaks80K #BuffettStepsDownAsBerkshireChairman
Treasury Sanctions Crypto Exchange Behind Iran's Bitcoin Tolls on Hormuz Ships
The U.S. Treasury has sanctioned BitBank, naming the Iranian exchange it says carried the Bitcoin that shipping companies paid for safe passage through the Strait of Hormuz.
Since June, the Office of Foreign Assets Control said, the Hormuz Safe Marine Services Authority has used BitBank to pass the payments it collects on to the Iranian regime. That authority was the body charging vessels in Bitcoin for transit rights, a scheme Treasury designated in July.Between June and July, Treasury says, BitBank was used to move "hundreds of millions of dollars' worth of Bitcoin" to the Islamic Revolutionary Guard Corps.
BitBank is controlled by Babak Zanjani, an Iranian financier OFAC designated in January. Sentenced to death in Iran in 2016 for embezzling from the National Iranian Oil Company, he had his sentence commuted in 2024 and resurfaced last year backing regime-linked ventures. Treasury says he has been advertising BitBank on his social media accounts since at least 2024.
Four more designations
The action also covers Pishtaz Simorgh Electronic Trade Company, which built BitBank's software and is a subsidiary of the already-designated Dot One Value Creation Group, along with three Dot One executives: Hossein Ali Zaker Hossein, Mohammad Mahdi Zaker Hossein and Seyed Adel Heidari.
Treasury describes the first as involved in most of Zanjani's sanctions evasion, including oil exports, and says he has brokered digital asset transactions that ended up with the IRGC.
US Can Now Sanction Anyone Operating in Iran's Crypto Sector
All five were designated under Executive Order 13902, which the administration extended in August to cover anyone operating in Iran's digital asset sector. It is the authority Treasury has been using since to work through the network, including the crypto exchanges it designated for laundering Iranian funds.
"Efforts to finance the Iranian regime using cryptocurrencies are not beyond OFAC's reach," said Treasury Secretary Scott Bessent. "If you support the Iranian regime, the Department of the Treasury will sanction you."
The designations fall under Operation Economic Outcast, the campaign Bessent announced on August 24 and dubbed Economic D-Day, which Treasury says is aimed at severing Iran's remaining economic lifelines with help from the EU, the UK and Gulf partners.
U.S. assets belonging to the five are blocked, as are any entities they own half or more of, and non-U.S. firms dealing with them risk secondary sanctions.
Traders do not expect the pressure to lift soon. On Myriad, a prediction market developed by Decrypt's parent company Dastan, the odds of Washington announcing an end to its naval blockade of Iranian shipping by September 30 have fallen to 10%, down 30 points. Even a December 31 deadline is only a 60% shot.#BTCBreaks80K #BuffettStepsDownAsBerkshireChairman
Since June, the Office of Foreign Assets Control said, the Hormuz Safe Marine Services Authority has used BitBank to pass the payments it collects on to the Iranian regime. That authority was the body charging vessels in Bitcoin for transit rights, a scheme Treasury designated in July.Between June and July, Treasury says, BitBank was used to move "hundreds of millions of dollars' worth of Bitcoin" to the Islamic Revolutionary Guard Corps.
BitBank is controlled by Babak Zanjani, an Iranian financier OFAC designated in January. Sentenced to death in Iran in 2016 for embezzling from the National Iranian Oil Company, he had his sentence commuted in 2024 and resurfaced last year backing regime-linked ventures. Treasury says he has been advertising BitBank on his social media accounts since at least 2024.
Four more designations
The action also covers Pishtaz Simorgh Electronic Trade Company, which built BitBank's software and is a subsidiary of the already-designated Dot One Value Creation Group, along with three Dot One executives: Hossein Ali Zaker Hossein, Mohammad Mahdi Zaker Hossein and Seyed Adel Heidari.
Treasury describes the first as involved in most of Zanjani's sanctions evasion, including oil exports, and says he has brokered digital asset transactions that ended up with the IRGC.
US Can Now Sanction Anyone Operating in Iran's Crypto Sector
All five were designated under Executive Order 13902, which the administration extended in August to cover anyone operating in Iran's digital asset sector. It is the authority Treasury has been using since to work through the network, including the crypto exchanges it designated for laundering Iranian funds.
"Efforts to finance the Iranian regime using cryptocurrencies are not beyond OFAC's reach," said Treasury Secretary Scott Bessent. "If you support the Iranian regime, the Department of the Treasury will sanction you."
The designations fall under Operation Economic Outcast, the campaign Bessent announced on August 24 and dubbed Economic D-Day, which Treasury says is aimed at severing Iran's remaining economic lifelines with help from the EU, the UK and Gulf partners.
U.S. assets belonging to the five are blocked, as are any entities they own half or more of, and non-U.S. firms dealing with them risk secondary sanctions.
Traders do not expect the pressure to lift soon. On Myriad, a prediction market developed by Decrypt's parent company Dastan, the odds of Washington announcing an end to its naval blockade of Iranian shipping by September 30 have fallen to 10%, down 30 points. Even a December 31 deadline is only a 60% shot.#BTCBreaks80K #BuffettStepsDownAsBerkshireChairman
1
59
·
--
Article
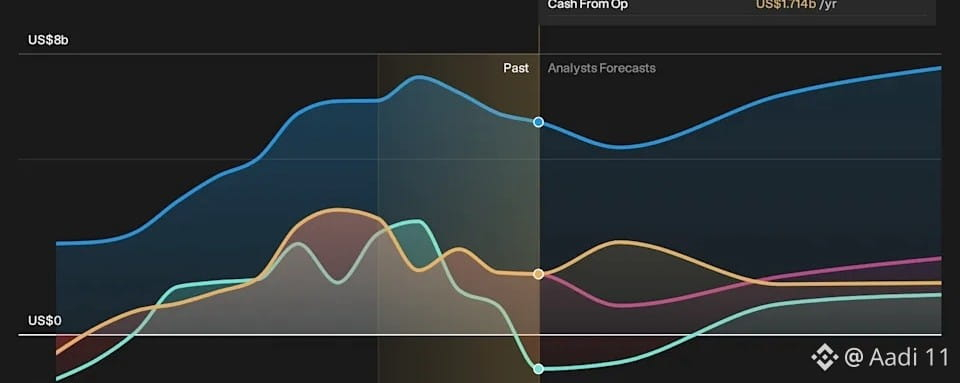
Coinbase (COIN) Says Custom AI Agents Drove Most Trading Activity Last WeekCoinbase Global (NasdaqGS:COIN) reported that its agentic trading stack powered most crypto transaction flows over the past week.Management highlighted Grok as a leading AI agent on the platform, driving a large share of AI agent-driven trading volumes.Developer-built custom interfaces using Coinbase for Agents and the x402 payment protocol accounted for the majority of notional market activity.The rise of Coinbase's agent-driven trading workflows, led by Grok and custom agents, needs to be weighed against our other findings. We have also flagged 1 warning sign for Coinbase Global.
What Coinbase's AI agents signal for the core Narrative
This shift to agentic trading puts Coinbase closer to the version of the Narrative that leans on higher margin services instead of pure retail volumes. Grok and custom agents using Coinbase for Agents and x402 plug directly into the payment stack built around USDC, Base and APIs, which the Narrative flags as a key catalyst for more recurring subscription and service income. At the same time, heavier machine driven flows do not remove existing risks around fee pressure, cybersecurity costs or competition from decentralized venues. They just rewire where and how orders reach Coinbase's rails.#BTCBreaks80K #BOJRaisesRatesTo31YearHigh
Coinbase (COIN) Says Custom AI Agents Drove Most Trading Activity Last Week
Coinbase Global (NasdaqGS:COIN) reported that its agentic trading stack powered most crypto transaction flows over the past week.Management highlighted Grok as a leading AI agent on the platform, driving a large share of AI agent-driven trading volumes.Developer-built custom interfaces using Coinbase for Agents and the x402 payment protocol accounted for the majority of notional market activity.The rise of Coinbase's agent-driven trading workflows, led by Grok and custom agents, needs to be weighed against our other findings. We have also flagged 1 warning sign for Coinbase Global.
What Coinbase's AI agents signal for the core Narrative
This shift to agentic trading puts Coinbase closer to the version of the Narrative that leans on higher margin services instead of pure retail volumes. Grok and custom agents using Coinbase for Agents and x402 plug directly into the payment stack built around USDC, Base and APIs, which the Narrative flags as a key catalyst for more recurring subscription and service income. At the same time, heavier machine driven flows do not remove existing risks around fee pressure, cybersecurity costs or competition from decentralized venues. They just rewire where and how orders reach Coinbase's rails.#BTCBreaks80K #BOJRaisesRatesTo31YearHigh
What Coinbase's AI agents signal for the core Narrative
This shift to agentic trading puts Coinbase closer to the version of the Narrative that leans on higher margin services instead of pure retail volumes. Grok and custom agents using Coinbase for Agents and x402 plug directly into the payment stack built around USDC, Base and APIs, which the Narrative flags as a key catalyst for more recurring subscription and service income. At the same time, heavier machine driven flows do not remove existing risks around fee pressure, cybersecurity costs or competition from decentralized venues. They just rewire where and how orders reach Coinbase's rails.#BTCBreaks80K #BOJRaisesRatesTo31YearHigh
1
114
·
--

Article
PancakeSwap (CAKE) 3.6% Drop: Routine Volatility, No CatalystWhat Likely Drove The Move
Size And Pattern Of The Move Look Routine
CAKE’s latest snapshot shows:
Price about $2.32 with a 24h move of roughly -3.6%.
Over the last 24 hours, intraday points ranged from about $2.45 at the high to about $2.33 at the low, so the full swing was under 5%.
24h trading volume around $57.7 million, which is not unusually high and does not signal a panic event or blow off top.
For a token at this price level, a 3–4% daily change with no volume spike is typical short term noise rather than a structurally important move. In other words, the price path looks like gentle mean reversion after a prior runup, not a sharp reaction to new information.
By itself, a 3.5 percentage point move in CAKE on normal volume is well within usual daily volatility and does not require a special catalyst to occur.
Takeaway
The available evidence points to CAKE’s roughly -3.6% 24h move being routine volatility and short term underperformance in an otherwise strong market, with no identifiable new PancakeSwap specific catalyst behind it.
Confidence: High, because CAKE specific news and social feeds over the last 24 hours show no concrete events, and the price/volume profile matches normal day to day fluctuation.$CAKE
{future}(CAKEUSDT)
#BTCBreaks80K #BOJRaisesRatesTo31YearHigh
PancakeSwap (CAKE) 3.6% Drop: Routine Volatility, No Catalyst
What Likely Drove The Move
Size And Pattern Of The Move Look Routine
CAKE’s latest snapshot shows:
Price about $2.32 with a 24h move of roughly -3.6%.
Over the last 24 hours, intraday points ranged from about $2.45 at the high to about $2.33 at the low, so the full swing was under 5%.
24h trading volume around $57.7 million, which is not unusually high and does not signal a panic event or blow off top.
For a token at this price level, a 3–4% daily change with no volume spike is typical short term noise rather than a structurally important move. In other words, the price path looks like gentle mean reversion after a prior runup, not a sharp reaction to new information.
By itself, a 3.5 percentage point move in CAKE on normal volume is well within usual daily volatility and does not require a special catalyst to occur.
Takeaway
The available evidence points to CAKE’s roughly -3.6% 24h move being routine volatility and short term underperformance in an otherwise strong market, with no identifiable new PancakeSwap specific catalyst behind it.
Confidence: High, because CAKE specific news and social feeds over the last 24 hours show no concrete events, and the price/volume profile matches normal day to day fluctuation.$CAKE
#BTCBreaks80K #BOJRaisesRatesTo31YearHigh
Size And Pattern Of The Move Look Routine
CAKE’s latest snapshot shows:
Price about $2.32 with a 24h move of roughly -3.6%.
Over the last 24 hours, intraday points ranged from about $2.45 at the high to about $2.33 at the low, so the full swing was under 5%.
24h trading volume around $57.7 million, which is not unusually high and does not signal a panic event or blow off top.
For a token at this price level, a 3–4% daily change with no volume spike is typical short term noise rather than a structurally important move. In other words, the price path looks like gentle mean reversion after a prior runup, not a sharp reaction to new information.
By itself, a 3.5 percentage point move in CAKE on normal volume is well within usual daily volatility and does not require a special catalyst to occur.
Takeaway
The available evidence points to CAKE’s roughly -3.6% 24h move being routine volatility and short term underperformance in an otherwise strong market, with no identifiable new PancakeSwap specific catalyst behind it.
Confidence: High, because CAKE specific news and social feeds over the last 24 hours show no concrete events, and the price/volume profile matches normal day to day fluctuation.$CAKE
#BTCBreaks80K #BOJRaisesRatesTo31YearHigh
1
442
·
--
Russia Opens Crypto Futures as Pepeto, BNB, and DOGE Draw Trader AttentionThe crypto news today keeps stacking up and the market is paying close attention. Russia just locked in September 22 for five new crypto futures on its largest stock exchange, per CoinEdition. Bitcoin held above $80,000 the same week after a Fed rate hike, per CoinGecko.
Total volume has passed 600 billion rubles. The same week, the Fed raised rates for the first time since 2023, and BTC still gained 5.9% that day. The crypto news today says one thing: the money is coming in from all sides, and it is not slowing down.
#BTCBreaks80K
Russia Opens Crypto Futures as Pepeto, BNB, and DOGE Draw Trader Attention
The crypto news today keeps stacking up and the market is paying close attention. Russia just locked in September 22 for five new crypto futures on its largest stock exchange, per CoinEdition. Bitcoin held above $80,000 the same week after a Fed rate hike, per CoinGecko.
Total volume has passed 600 billion rubles. The same week, the Fed raised rates for the first time since 2023, and BTC still gained 5.9% that day. The crypto news today says one thing: the money is coming in from all sides, and it is not slowing down.
#BTCBreaks80K
Total volume has passed 600 billion rubles. The same week, the Fed raised rates for the first time since 2023, and BTC still gained 5.9% that day. The crypto news today says one thing: the money is coming in from all sides, and it is not slowing down.
#BTCBreaks80K
4
3
448
·
--
Coinbase Global said Friday that it has sought regulatory approval to list perpetual futures tied to individual large-cap U.S. stocks.
Perpetual futures, known as “perps,” are speculative derivative contracts that never expire, allowing traders to pile on leverage that amplifies their potential gains and losses.Coinbase Files to List U.S. Single-Stock Perpetual Futures#BTCBreaks80K #HKCompletesFirstHKDStablecoinUseCase $AAPL.US
Coinbase Global said Friday that it has sought regulatory approval to list perpetual futures tied to individual large-cap U.S. stocks.
Perpetual futures, known as “perps,” are speculative derivative contracts that never expire, allowing traders to pile on leverage that amplifies their potential gains and losses.Coinbase Files to List U.S. Single-Stock Perpetual Futures#BTCBreaks80K #HKCompletesFirstHKDStablecoinUseCase $AAPL.US
Perpetual futures, known as “perps,” are speculative derivative contracts that never expire, allowing traders to pile on leverage that amplifies their potential gains and losses.Coinbase Files to List U.S. Single-Stock Perpetual Futures#BTCBreaks80K #HKCompletesFirstHKDStablecoinUseCase $AAPL.US
1000PEPE-3,35%
AAPLUS-0,19%
72
·
--
BTC Daily Update — Fed Hiked, Bitcoin Is Still Losing Ground
Yesterday’s Fed decision did nothing to improve Bitcoin’s structure.
The Fed raised rates by 25bps to 3.75%–4.00% — its first hike in three years and the bigger message was the guidance. 16 of 18 policymakers still see at least one more hike this year.
That is a hawkish backdrop, not the easier liquidity environment Bitcoin bulls would have wanted.
Now back to the chart.
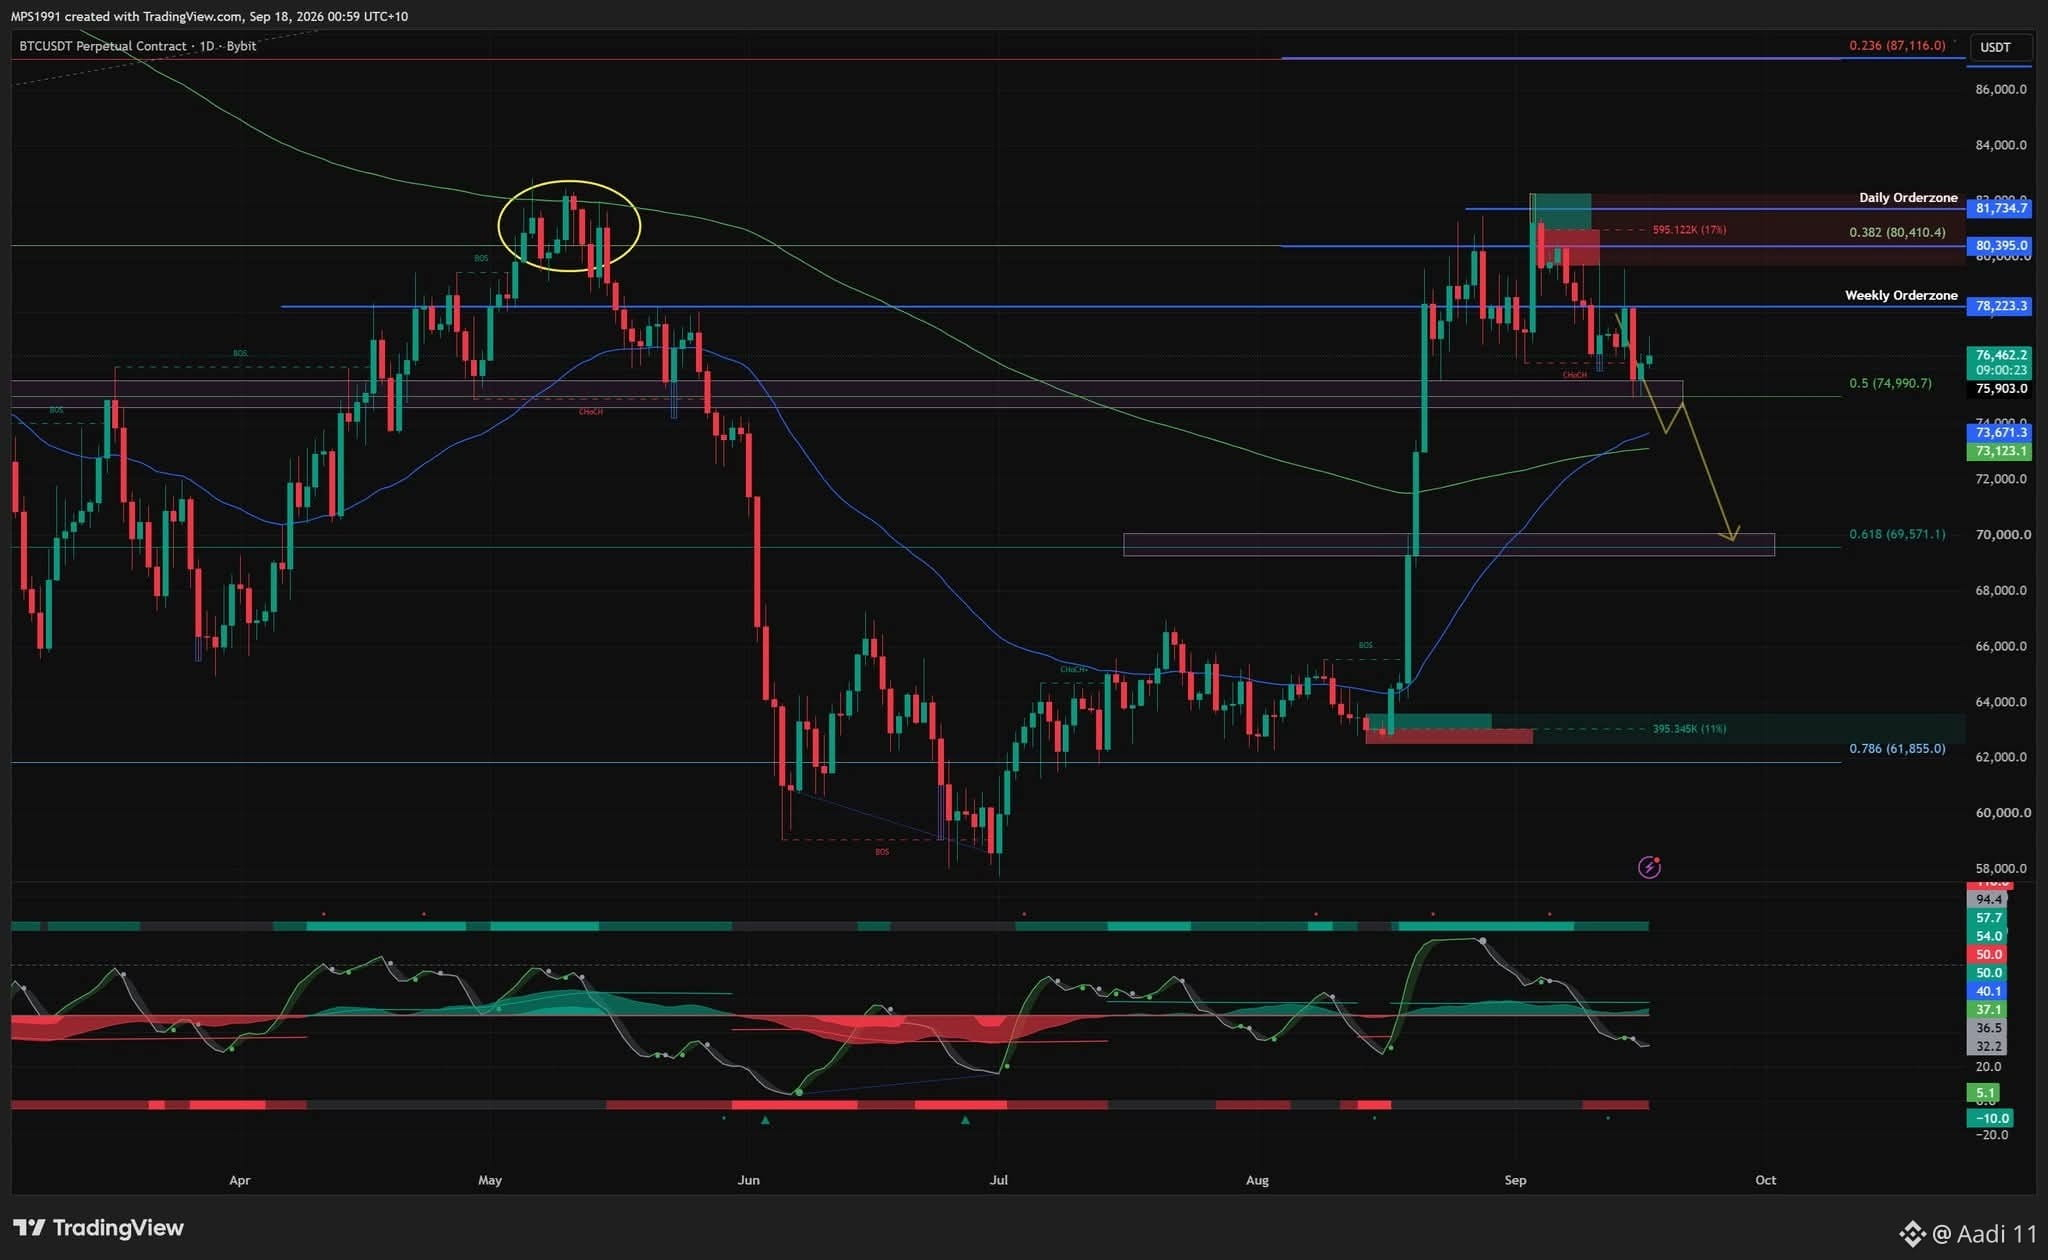
Bitcoin has already lost the 78.2k weekly orderzone and is trading around 76.5k.
The next level I’m watching is 75k.
If 75k holds, then Bitcoin has room to bounce back toward 78.2k. That would be the first area bulls need to reclaim before I start looking back toward 80.4k and the daily orderzone around 81.7k.
But if 75k breaks, then the next support area is around 73k to 73.5k.
Lose that and the 0.618 Fib around 69.5k becomes the next major level on my roadmap.
Momentum is still weak as well, so I’m not seeing anything yet that makes me want to ignore those lower levels.
And we are not finished with macro this week.
The BOJ decision is tomorrow, with markets expecting another hike to around 1.25% and further tightening still on the table. That gives Bitcoin another potential volatility event almost immediately after the Fed.
Key levels I’m watching:
• Current area: 76.5k
• Immediate support: 75k
• Next support: 73k to 73.5k
• Major downside level: 69.5k
• Weekly reclaim: 78.2k
• Next upside level: 80.4k
• Daily orderzone: 81.7k
For me, the roadmap is still straightforward.
Hold 75k and Bitcoin gets another chance to reclaim the range.
Lose it, and 73k becomes the next test.
Lose that, and 69.5k is where my attention goes next.
Fed done.
BOJ next.
The dominoes are still moving.
#SECGrantsInnovationExemptionForTokenizedStocks #BOJHikesRatesTo31YearHigh $BTC
{future}(BTCUSDT)
BTC Daily Update — Fed Hiked, Bitcoin Is Still Losing Ground
Yesterday’s Fed decision did nothing to improve Bitcoin’s structure.
The Fed raised rates by 25bps to 3.75%–4.00% — its first hike in three years and the bigger message was the guidance. 16 of 18 policymakers still see at least one more hike this year.
That is a hawkish backdrop, not the easier liquidity environment Bitcoin bulls would have wanted.
Now back to the chart.
Bitcoin has already lost the 78.2k weekly orderzone and is trading around 76.5k.
The next level I’m watching is 75k.
If 75k holds, then Bitcoin has room to bounce back toward 78.2k. That would be the first area bulls need to reclaim before I start looking back toward 80.4k and the daily orderzone around 81.7k.
But if 75k breaks, then the next support area is around 73k to 73.5k.
Lose that and the 0.618 Fib around 69.5k becomes the next major level on my roadmap.
Momentum is still weak as well, so I’m not seeing anything yet that makes me want to ignore those lower levels.
And we are not finished with macro this week.
The BOJ decision is tomorrow, with markets expecting another hike to around 1.25% and further tightening still on the table. That gives Bitcoin another potential volatility event almost immediately after the Fed.
Key levels I’m watching:
• Current area: 76.5k
• Immediate support: 75k
• Next support: 73k to 73.5k
• Major downside level: 69.5k
• Weekly reclaim: 78.2k
• Next upside level: 80.4k
• Daily orderzone: 81.7k
For me, the roadmap is still straightforward.
Hold 75k and Bitcoin gets another chance to reclaim the range.
Lose it, and 73k becomes the next test.
Lose that, and 69.5k is where my attention goes next.
Fed done.
BOJ next.
The dominoes are still moving.
#SECGrantsInnovationExemptionForTokenizedStocks #BOJHikesRatesTo31YearHigh $BTC
Yesterday’s Fed decision did nothing to improve Bitcoin’s structure.
The Fed raised rates by 25bps to 3.75%–4.00% — its first hike in three years and the bigger message was the guidance. 16 of 18 policymakers still see at least one more hike this year.
That is a hawkish backdrop, not the easier liquidity environment Bitcoin bulls would have wanted.
Now back to the chart.
Bitcoin has already lost the 78.2k weekly orderzone and is trading around 76.5k.
The next level I’m watching is 75k.
If 75k holds, then Bitcoin has room to bounce back toward 78.2k. That would be the first area bulls need to reclaim before I start looking back toward 80.4k and the daily orderzone around 81.7k.
But if 75k breaks, then the next support area is around 73k to 73.5k.
Lose that and the 0.618 Fib around 69.5k becomes the next major level on my roadmap.
Momentum is still weak as well, so I’m not seeing anything yet that makes me want to ignore those lower levels.
And we are not finished with macro this week.
The BOJ decision is tomorrow, with markets expecting another hike to around 1.25% and further tightening still on the table. That gives Bitcoin another potential volatility event almost immediately after the Fed.
Key levels I’m watching:
• Current area: 76.5k
• Immediate support: 75k
• Next support: 73k to 73.5k
• Major downside level: 69.5k
• Weekly reclaim: 78.2k
• Next upside level: 80.4k
• Daily orderzone: 81.7k
For me, the roadmap is still straightforward.
Hold 75k and Bitcoin gets another chance to reclaim the range.
Lose it, and 73k becomes the next test.
Lose that, and 69.5k is where my attention goes next.
Fed done.
BOJ next.
The dominoes are still moving.
#SECGrantsInnovationExemptionForTokenizedStocks #BOJHikesRatesTo31YearHigh $BTC
5
·
--
Technical outlook: Arbitrum rally eyes further upside
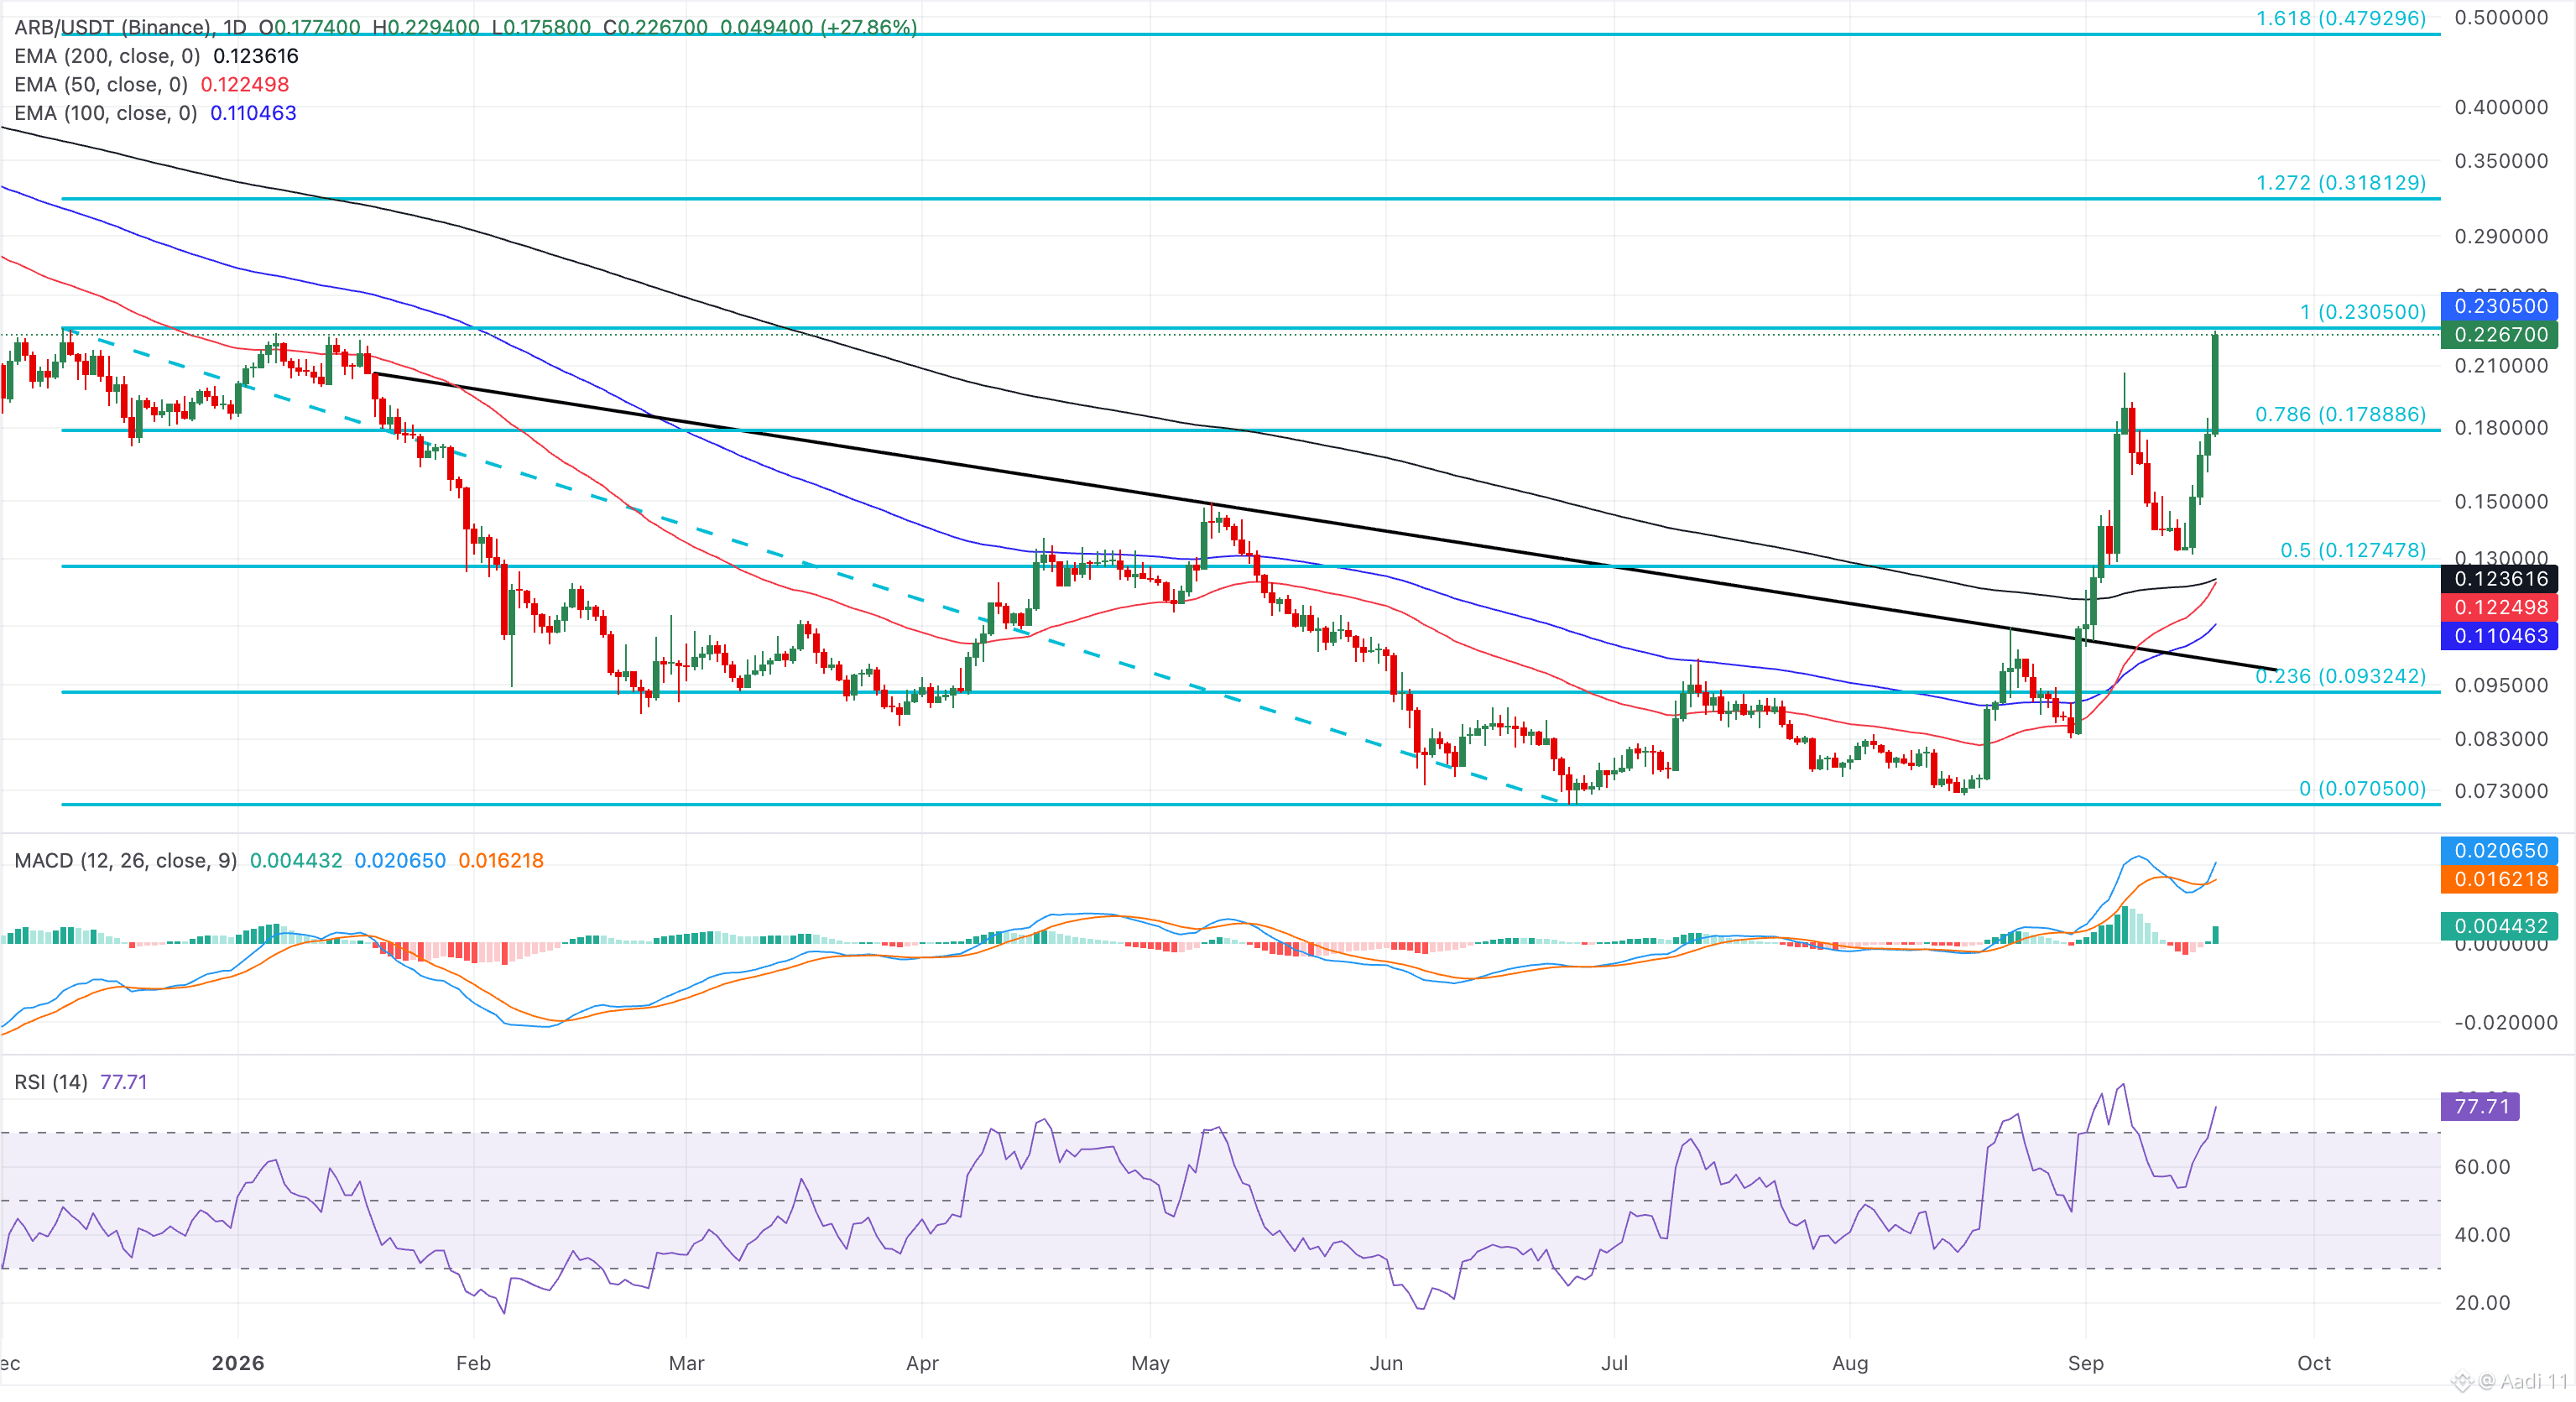
Arbitrum continues its steady upward rise for the fourth consecutive day, with gains totaling over 70% so far this week. ARB retains a clear bullish near-term bias above the 50-, 100-, and 200-day Exponential Moving Averages (EMAs) at $0.1224, $0.1104, and $0.1236, respectively.
The advance is now pressing into the upper end of the Fibonacci range from $0.2305 to $0.0705, with overhead supply emerging just below the Fibonacci cycle high at the 100% retracement level of $0.2305. A confirmed breakout above this level could target the 127.2% Fibonacci extension level at $0.3181.
Momentum remains constructive, with the Moving Average Convergence Divergence (MACD) crossing above its signal line, while the Relative Strength Index (RSI) rises to 78, flagging overbought conditions.
On the downside, initial support is seen at the 78.6% Fibonacci retracement at $0.1788, ahead of a deeper corrective floor at the 50% retracement level at $0.1274.
$ARB
{future}(ARBUSDT)
#ParadigmDisclosesZECHolding
Technical outlook: Arbitrum rally eyes further upside
Arbitrum continues its steady upward rise for the fourth consecutive day, with gains totaling over 70% so far this week. ARB retains a clear bullish near-term bias above the 50-, 100-, and 200-day Exponential Moving Averages (EMAs) at $0.1224, $0.1104, and $0.1236, respectively.
The advance is now pressing into the upper end of the Fibonacci range from $0.2305 to $0.0705, with overhead supply emerging just below the Fibonacci cycle high at the 100% retracement level of $0.2305. A confirmed breakout above this level could target the 127.2% Fibonacci extension level at $0.3181.
Momentum remains constructive, with the Moving Average Convergence Divergence (MACD) crossing above its signal line, while the Relative Strength Index (RSI) rises to 78, flagging overbought conditions.
On the downside, initial support is seen at the 78.6% Fibonacci retracement at $0.1788, ahead of a deeper corrective floor at the 50% retracement level at $0.1274.
$ARB
#ParadigmDisclosesZECHolding
Arbitrum continues its steady upward rise for the fourth consecutive day, with gains totaling over 70% so far this week. ARB retains a clear bullish near-term bias above the 50-, 100-, and 200-day Exponential Moving Averages (EMAs) at $0.1224, $0.1104, and $0.1236, respectively.
The advance is now pressing into the upper end of the Fibonacci range from $0.2305 to $0.0705, with overhead supply emerging just below the Fibonacci cycle high at the 100% retracement level of $0.2305. A confirmed breakout above this level could target the 127.2% Fibonacci extension level at $0.3181.
Momentum remains constructive, with the Moving Average Convergence Divergence (MACD) crossing above its signal line, while the Relative Strength Index (RSI) rises to 78, flagging overbought conditions.
On the downside, initial support is seen at the 78.6% Fibonacci retracement at $0.1788, ahead of a deeper corrective floor at the 50% retracement level at $0.1274.
$ARB
#ParadigmDisclosesZECHolding
1
138
·
--
Gold Price Forecast: Acceptance above $4,400 is critical for XAU/USD buyers
Gold price technical analysis: Daily chart
Chart Analysis XAU/USD
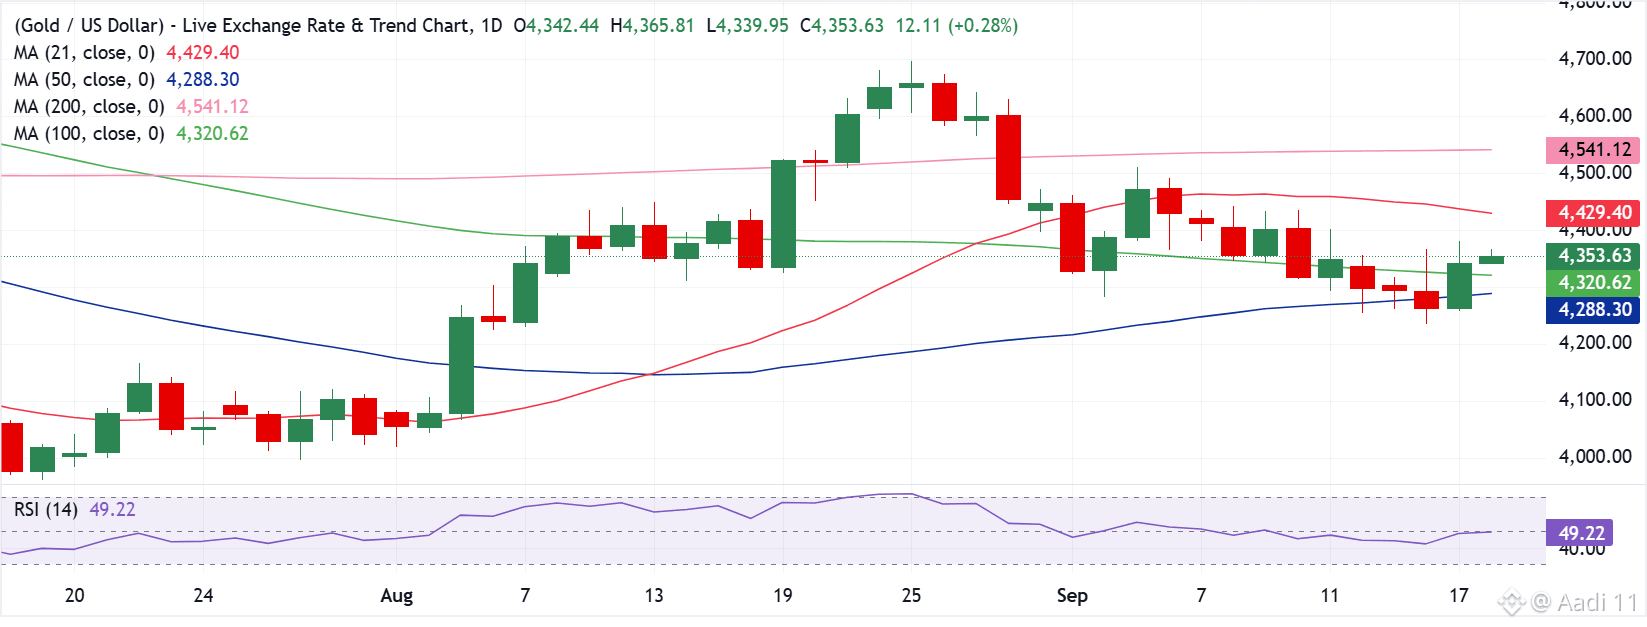
In the daily chart, XAU/USD trades at $4,353.63. The metal is pivoting in a neutral near-term tone, holding above the 50-day and 100-day simple moving averages (SMAs) at $4,288.30 and $4,320.62, which suggest underlying demand on dips, but still trading below the 21-day SMA at $4,429.40 and the longer-term 200-day SMA at $4,541.12 that cap the topside. The Relative Strength Index (14) stands near 49, hinting at balanced momentum after the recent pullback from record highs.
On the downside, initial support is seen close to the current area around $4,353.63, ahead of the 100-day SMA at $4,320.62 and the 50-day SMA at $4,288.30, where buyers are likely to defend the broader bullish structure. On the topside, immediate resistance emerges at the 21-day SMA at $4,429.40, with a more significant barrier at the 200-day SMA near $4,541.12; a daily close above the shorter average would open the way for a retest of the latter, while failure to clear $4,429.40 keeps XAU/USD confined in a consolidative range.
$XAU #ParadigmDisclosesZECHolding
{future}(XAUUSDT)
#write2earn🌐💹
Gold Price Forecast: Acceptance above $4,400 is critical for XAU/USD buyers
Gold price technical analysis: Daily chart
Chart Analysis XAU/USD
In the daily chart, XAU/USD trades at $4,353.63. The metal is pivoting in a neutral near-term tone, holding above the 50-day and 100-day simple moving averages (SMAs) at $4,288.30 and $4,320.62, which suggest underlying demand on dips, but still trading below the 21-day SMA at $4,429.40 and the longer-term 200-day SMA at $4,541.12 that cap the topside. The Relative Strength Index (14) stands near 49, hinting at balanced momentum after the recent pullback from record highs.
On the downside, initial support is seen close to the current area around $4,353.63, ahead of the 100-day SMA at $4,320.62 and the 50-day SMA at $4,288.30, where buyers are likely to defend the broader bullish structure. On the topside, immediate resistance emerges at the 21-day SMA at $4,429.40, with a more significant barrier at the 200-day SMA near $4,541.12; a daily close above the shorter average would open the way for a retest of the latter, while failure to clear $4,429.40 keeps XAU/USD confined in a consolidative range.
$XAU #ParadigmDisclosesZECHolding
#write2earn🌐💹
Gold price technical analysis: Daily chart
Chart Analysis XAU/USD
In the daily chart, XAU/USD trades at $4,353.63. The metal is pivoting in a neutral near-term tone, holding above the 50-day and 100-day simple moving averages (SMAs) at $4,288.30 and $4,320.62, which suggest underlying demand on dips, but still trading below the 21-day SMA at $4,429.40 and the longer-term 200-day SMA at $4,541.12 that cap the topside. The Relative Strength Index (14) stands near 49, hinting at balanced momentum after the recent pullback from record highs.
On the downside, initial support is seen close to the current area around $4,353.63, ahead of the 100-day SMA at $4,320.62 and the 50-day SMA at $4,288.30, where buyers are likely to defend the broader bullish structure. On the topside, immediate resistance emerges at the 21-day SMA at $4,429.40, with a more significant barrier at the 200-day SMA near $4,541.12; a daily close above the shorter average would open the way for a retest of the latter, while failure to clear $4,429.40 keeps XAU/USD confined in a consolidative range.
$XAU #ParadigmDisclosesZECHolding
#write2earn🌐💹
61
·
--
Clarity Act failure may hamper U.S. crypto as industry seeks legal clarity elsewhereThe U.S. Senate's failure to advance the Clarity Act on Tuesday leaves the crypto industry in the world's largest economy without an overarching federal framework and with the roles of the Securities and Exchange Commission (SEC) and Commodity Futures Trading Commission (CFTC) shrouded in ambiguity.
“The true losers are the American public and the domestic tech ecosystem,” said Stefan Muehlbauer, head of U.S. government affairs at blockchain security firm CertiK. The winners are overseas crypto hubs, grey-market operators and international jurisdictions like Asia and Europe that are rapidly expanding their market share under clear, established rules, he said.#ParadigmDisclosesZECHolding
Clarity Act failure may hamper U.S. crypto as industry seeks legal clarity elsewhere
The U.S. Senate's failure to advance the Clarity Act on Tuesday leaves the crypto industry in the world's largest economy without an overarching federal framework and with the roles of the Securities and Exchange Commission (SEC) and Commodity Futures Trading Commission (CFTC) shrouded in ambiguity.
“The true losers are the American public and the domestic tech ecosystem,” said Stefan Muehlbauer, head of U.S. government affairs at blockchain security firm CertiK. The winners are overseas crypto hubs, grey-market operators and international jurisdictions like Asia and Europe that are rapidly expanding their market share under clear, established rules, he said.#ParadigmDisclosesZECHolding
“The true losers are the American public and the domestic tech ecosystem,” said Stefan Muehlbauer, head of U.S. government affairs at blockchain security firm CertiK. The winners are overseas crypto hubs, grey-market operators and international jurisdictions like Asia and Europe that are rapidly expanding their market share under clear, established rules, he said.#ParadigmDisclosesZECHolding
57
·
--

Article
AI Helps Hackers Open a New Front in Crypto’s Cybercrime WaveOpen-source artificial intelligence is making it easier for hackers to hide malicious code on blockchains, opening a new front in a crypto industry already grappling with rising cybercrime.
Instances of malware instructions written into on-chain transactions and smart contracts are up 440% in less than a year, averaging 11 cases per day, blockchain analytics firm Chainalysis said in a report published on Thursday. Such cases averaged two per day prior to the release in the middle of last year of powerful Chinese open-source AI models with no restrictions on generating malicious code, according to the report.
A malware attack uses malicious software planted on a computer or network to steal information, passwords or funds. In the attacks documented by the report, hackers use a blockchain to leave instructions for that software, telling it where to send information, a technique known as "blockchain dead drop". This can make an attack harder to stop because information recorded on a blockchain cannot be easily removed.
State-backed groups — including those linked to North Korea and Iran — now account for the majority of this activity, the report said.
The findings add to evidence of generative AI contributing to a boom in cyber threats, by spotting more software vulnerabilities and allowing cybercriminals to carry out more attacks. In crypto, the number of hacks rose roughly 150% to 207 in the first half of the year, according to blockchain intelligence firm TRM Labs.
Blockchains are typically not involved in the initial infection of a machine, which often happens through conventional means such as supply-chain attacks or malicious downloads, Eric Jardine, head of research at Chainalysis, said in response to questions over email. The firm has not tracked how many attacks were successful, or how much money was lost.
Hiding malware on a blockchain is not new, Chainalysis said, but powerful new open-source AI models are allowing hackers to carry out attacks on a larger scale, while growing involvement by state actors is making them more sophisticated.
Worsening the threat, open-source AI models can be run independently, allowing hackers to modify them or remove safeguards against cybercrime.
"This gives malicious developers greater control over the model and more privacy," said Vitaly Kamluk, founder of cybersecurity consultancy TitanHex.
By contrast, companies such as OpenAI and Alphabet Inc.'s Google can block access to their AI services when they detect abuse.
The transparency of blockchains cuts both ways, though. Every update attackers post is permanently recorded, letting investigators map their infrastructure and connect campaigns that would otherwise look unrelated, according to Chainalysis.#USWeeklyJoblessClaimsFallTo196K #ParadigmDisclosesZECHolding
AI Helps Hackers Open a New Front in Crypto’s Cybercrime Wave
Open-source artificial intelligence is making it easier for hackers to hide malicious code on blockchains, opening a new front in a crypto industry already grappling with rising cybercrime.
Instances of malware instructions written into on-chain transactions and smart contracts are up 440% in less than a year, averaging 11 cases per day, blockchain analytics firm Chainalysis said in a report published on Thursday. Such cases averaged two per day prior to the release in the middle of last year of powerful Chinese open-source AI models with no restrictions on generating malicious code, according to the report.
A malware attack uses malicious software planted on a computer or network to steal information, passwords or funds. In the attacks documented by the report, hackers use a blockchain to leave instructions for that software, telling it where to send information, a technique known as "blockchain dead drop". This can make an attack harder to stop because information recorded on a blockchain cannot be easily removed.
State-backed groups — including those linked to North Korea and Iran — now account for the majority of this activity, the report said.
The findings add to evidence of generative AI contributing to a boom in cyber threats, by spotting more software vulnerabilities and allowing cybercriminals to carry out more attacks. In crypto, the number of hacks rose roughly 150% to 207 in the first half of the year, according to blockchain intelligence firm TRM Labs.
Blockchains are typically not involved in the initial infection of a machine, which often happens through conventional means such as supply-chain attacks or malicious downloads, Eric Jardine, head of research at Chainalysis, said in response to questions over email. The firm has not tracked how many attacks were successful, or how much money was lost.
Hiding malware on a blockchain is not new, Chainalysis said, but powerful new open-source AI models are allowing hackers to carry out attacks on a larger scale, while growing involvement by state actors is making them more sophisticated.
Worsening the threat, open-source AI models can be run independently, allowing hackers to modify them or remove safeguards against cybercrime.
"This gives malicious developers greater control over the model and more privacy," said Vitaly Kamluk, founder of cybersecurity consultancy TitanHex.
By contrast, companies such as OpenAI and Alphabet Inc.'s Google can block access to their AI services when they detect abuse.
The transparency of blockchains cuts both ways, though. Every update attackers post is permanently recorded, letting investigators map their infrastructure and connect campaigns that would otherwise look unrelated, according to Chainalysis.#USWeeklyJoblessClaimsFallTo196K #ParadigmDisclosesZECHolding
Instances of malware instructions written into on-chain transactions and smart contracts are up 440% in less than a year, averaging 11 cases per day, blockchain analytics firm Chainalysis said in a report published on Thursday. Such cases averaged two per day prior to the release in the middle of last year of powerful Chinese open-source AI models with no restrictions on generating malicious code, according to the report.
A malware attack uses malicious software planted on a computer or network to steal information, passwords or funds. In the attacks documented by the report, hackers use a blockchain to leave instructions for that software, telling it where to send information, a technique known as "blockchain dead drop". This can make an attack harder to stop because information recorded on a blockchain cannot be easily removed.
State-backed groups — including those linked to North Korea and Iran — now account for the majority of this activity, the report said.
The findings add to evidence of generative AI contributing to a boom in cyber threats, by spotting more software vulnerabilities and allowing cybercriminals to carry out more attacks. In crypto, the number of hacks rose roughly 150% to 207 in the first half of the year, according to blockchain intelligence firm TRM Labs.
Blockchains are typically not involved in the initial infection of a machine, which often happens through conventional means such as supply-chain attacks or malicious downloads, Eric Jardine, head of research at Chainalysis, said in response to questions over email. The firm has not tracked how many attacks were successful, or how much money was lost.
Hiding malware on a blockchain is not new, Chainalysis said, but powerful new open-source AI models are allowing hackers to carry out attacks on a larger scale, while growing involvement by state actors is making them more sophisticated.
Worsening the threat, open-source AI models can be run independently, allowing hackers to modify them or remove safeguards against cybercrime.
"This gives malicious developers greater control over the model and more privacy," said Vitaly Kamluk, founder of cybersecurity consultancy TitanHex.
By contrast, companies such as OpenAI and Alphabet Inc.'s Google can block access to their AI services when they detect abuse.
The transparency of blockchains cuts both ways, though. Every update attackers post is permanently recorded, letting investigators map their infrastructure and connect campaigns that would otherwise look unrelated, according to Chainalysis.#USWeeklyJoblessClaimsFallTo196K #ParadigmDisclosesZECHolding
1
2
·
--
Why Banks Suddenly Want Stablecoins, and Why It May Matter for You
For most of their first decade, stablecoins lived inside crypto, sitting on exchanges as dry powder between trades. Supply rose from $27 billion at the end of 2020 to more than $300 billion today.
A significant portion of that growth now occurs outside the order book. Cross-border flows into the US alone total nearly $127 billion a month, and businesses settled $226 billion in B2B payments in stablecoins last year, according to Artemis Analytics.
The expansion has caught the attention of the institutions it threatened. Banking groups pressed Congress to stop crypto firms from paying rewards on stablecoin balances, arguing that a token paying interest is a deposit in disguise.
The lobbying has not deterred new entrants. Visa, BlackRock, Google, and DoorDash have lined up behind Open USD, a stablecoin set to launch this year, in a market that Tether and Circle still dominate.
So banks have begun asking a different question: whether they need a coin of their own, if only to defend the ground they already hold.#ParadigmDisclosesZECHolding $NVDA.US
Why Banks Suddenly Want Stablecoins, and Why It May Matter for You
For most of their first decade, stablecoins lived inside crypto, sitting on exchanges as dry powder between trades. Supply rose from $27 billion at the end of 2020 to more than $300 billion today.
A significant portion of that growth now occurs outside the order book. Cross-border flows into the US alone total nearly $127 billion a month, and businesses settled $226 billion in B2B payments in stablecoins last year, according to Artemis Analytics.
The expansion has caught the attention of the institutions it threatened. Banking groups pressed Congress to stop crypto firms from paying rewards on stablecoin balances, arguing that a token paying interest is a deposit in disguise.
The lobbying has not deterred new entrants. Visa, BlackRock, Google, and DoorDash have lined up behind Open USD, a stablecoin set to launch this year, in a market that Tether and Circle still dominate.
So banks have begun asking a different question: whether they need a coin of their own, if only to defend the ground they already hold.#ParadigmDisclosesZECHolding $NVDA.US
For most of their first decade, stablecoins lived inside crypto, sitting on exchanges as dry powder between trades. Supply rose from $27 billion at the end of 2020 to more than $300 billion today.
A significant portion of that growth now occurs outside the order book. Cross-border flows into the US alone total nearly $127 billion a month, and businesses settled $226 billion in B2B payments in stablecoins last year, according to Artemis Analytics.
The expansion has caught the attention of the institutions it threatened. Banking groups pressed Congress to stop crypto firms from paying rewards on stablecoin balances, arguing that a token paying interest is a deposit in disguise.
The lobbying has not deterred new entrants. Visa, BlackRock, Google, and DoorDash have lined up behind Open USD, a stablecoin set to launch this year, in a market that Tether and Circle still dominate.
So banks have begun asking a different question: whether they need a coin of their own, if only to defend the ground they already hold.#ParadigmDisclosesZECHolding $NVDA.US
NVDAUS-0,54%
1
67
·
--
Visa built the "operating system" for banks (VSP)
In July, Visa introduced the Visa Stablecoin Platform (VSP). Think of it as a plug-and-play stablecoin toolkit for traditional banks and fintechs.
Instead of traditional institutions sweating over managing private keys, setting up multi-sig wallets, or figuring out how to mint and burn tokens, Visa handed them a slick "Wallet-as-a-Service." Starting with Open USD, an upcoming token, Visa will also support the popular USDC (CRYPTO: USDC) coin later this year. Banks can now hold, move, and settle stablecoins using the same enterprise-grade security tools they're already comfortable with. It's in beta testing for now, pending the Open USD launch.#ParadigmDisclosesZECHolding $AAPL.US
Visa built the "operating system" for banks (VSP)
In July, Visa introduced the Visa Stablecoin Platform (VSP). Think of it as a plug-and-play stablecoin toolkit for traditional banks and fintechs.
Instead of traditional institutions sweating over managing private keys, setting up multi-sig wallets, or figuring out how to mint and burn tokens, Visa handed them a slick "Wallet-as-a-Service." Starting with Open USD, an upcoming token, Visa will also support the popular USDC (CRYPTO: USDC) coin later this year. Banks can now hold, move, and settle stablecoins using the same enterprise-grade security tools they're already comfortable with. It's in beta testing for now, pending the Open USD launch.#ParadigmDisclosesZECHolding $AAPL.US
In July, Visa introduced the Visa Stablecoin Platform (VSP). Think of it as a plug-and-play stablecoin toolkit for traditional banks and fintechs.
Instead of traditional institutions sweating over managing private keys, setting up multi-sig wallets, or figuring out how to mint and burn tokens, Visa handed them a slick "Wallet-as-a-Service." Starting with Open USD, an upcoming token, Visa will also support the popular USDC (CRYPTO: USDC) coin later this year. Banks can now hold, move, and settle stablecoins using the same enterprise-grade security tools they're already comfortable with. It's in beta testing for now, pending the Open USD launch.#ParadigmDisclosesZECHolding $AAPL.US

USDC+0,00%
AAPLUS-0,19%
80
·
--
Gold Price Forecast: XAU/USD defends key $4,280 support ahead of Fed verdict
$XAU #FedRateWatch
{future}(XAUUSDT)
. Gold briefly regains $4,300 early Wednesday, replicating Tuesday’s Asian bounce.
. US Dollar consolidates at two-week highs as Treasury yields retreat and focus shifts to Fed.
. Gold defends key 50-day SMA at $4,280, while 100-day SMA near $4,330 caps upside amid bearish RSI.
Gold stays on edge as Fed risk lingers, but geopolitical support remains
Strategists at ING observe that “much of the hawkish Fed risk appears to be priced in,” but caution that gold “could remain vulnerable if policymakers signal rates will stay higher for longer.” At the same time, they argue that “persistent geopolitical risks and concerns over the economic impact of elevated energy prices should continue to provide underlying support,” leaving the metal caught between tighter Fed expectations and ongoing safe-haven demand.
Gold price technical analysis: Daily chart
Chart Analysis XAU/USD
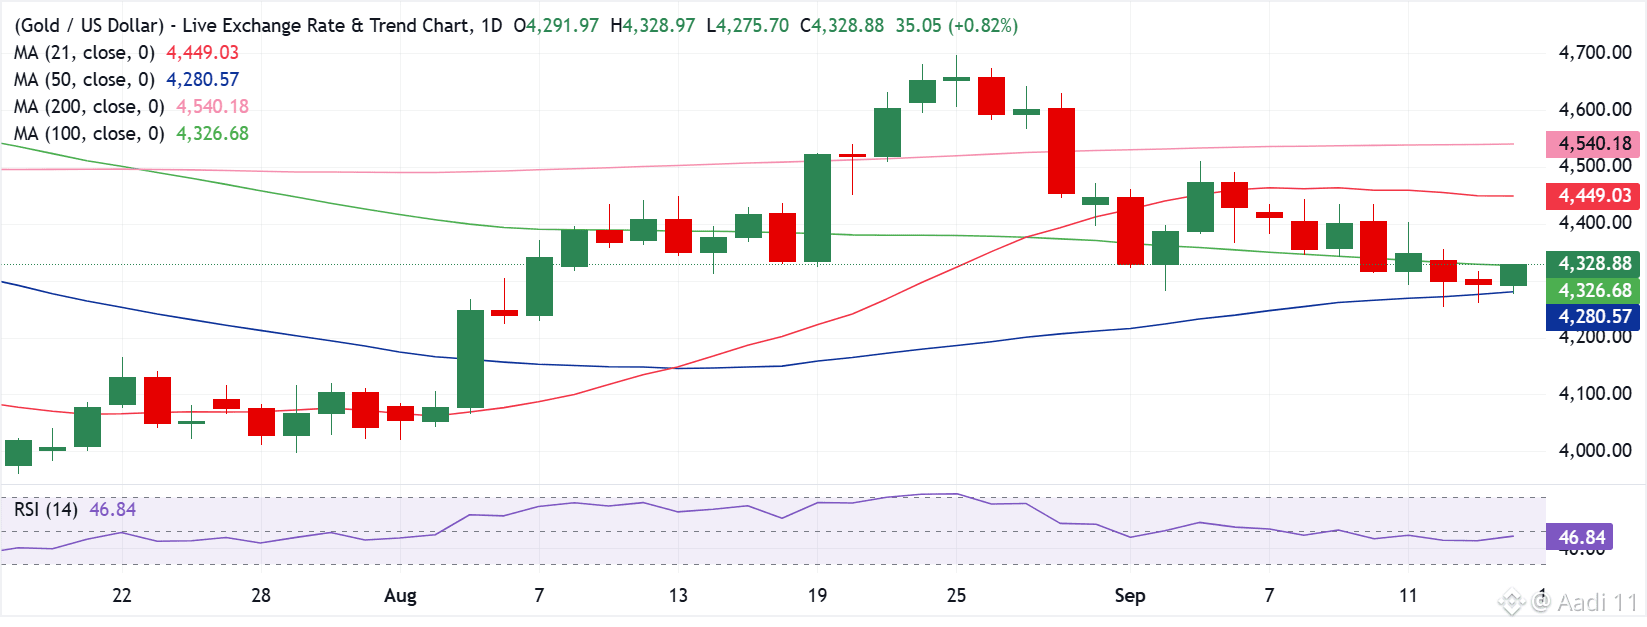
In the daily chart, XAU/USD trades at $4,328.88, holding just around the 100-day simple moving average (SMA) near $4,330 while remaining capped by the 21-day SMA near $4,449.03. This configuration, with price lodged between medium- and short-term averages and the Relative Strength Index (RSI) hovering around a neutral 47, suggests a consolidative bias as bulls and bears await a clearer directional break.
On the topside, initial resistance appears at the 21-day SMA near $4,449, with the longer-term 200-day SMA around $4,540 acting as a more significant barrier if buyers regain control. On the downside, immediate support is provided by the nearby 100-day SMA at $4,327, followed by the 50-day SMA around $4,281, where a break lower would hint at a deeper corrective phase toward earlier lows.
Gold Price Forecast: XAU/USD defends key $4,280 support ahead of Fed verdict
$XAU #FedRateWatch
. Gold briefly regains $4,300 early Wednesday, replicating Tuesday’s Asian bounce.
. US Dollar consolidates at two-week highs as Treasury yields retreat and focus shifts to Fed.
. Gold defends key 50-day SMA at $4,280, while 100-day SMA near $4,330 caps upside amid bearish RSI.
Gold stays on edge as Fed risk lingers, but geopolitical support remains
Strategists at ING observe that “much of the hawkish Fed risk appears to be priced in,” but caution that gold “could remain vulnerable if policymakers signal rates will stay higher for longer.” At the same time, they argue that “persistent geopolitical risks and concerns over the economic impact of elevated energy prices should continue to provide underlying support,” leaving the metal caught between tighter Fed expectations and ongoing safe-haven demand.
Gold price technical analysis: Daily chart
Chart Analysis XAU/USD
In the daily chart, XAU/USD trades at $4,328.88, holding just around the 100-day simple moving average (SMA) near $4,330 while remaining capped by the 21-day SMA near $4,449.03. This configuration, with price lodged between medium- and short-term averages and the Relative Strength Index (RSI) hovering around a neutral 47, suggests a consolidative bias as bulls and bears await a clearer directional break.
On the topside, initial resistance appears at the 21-day SMA near $4,449, with the longer-term 200-day SMA around $4,540 acting as a more significant barrier if buyers regain control. On the downside, immediate support is provided by the nearby 100-day SMA at $4,327, followed by the 50-day SMA around $4,281, where a break lower would hint at a deeper corrective phase toward earlier lows.
$XAU #FedRateWatch
. Gold briefly regains $4,300 early Wednesday, replicating Tuesday’s Asian bounce.
. US Dollar consolidates at two-week highs as Treasury yields retreat and focus shifts to Fed.
. Gold defends key 50-day SMA at $4,280, while 100-day SMA near $4,330 caps upside amid bearish RSI.
Gold stays on edge as Fed risk lingers, but geopolitical support remains
Strategists at ING observe that “much of the hawkish Fed risk appears to be priced in,” but caution that gold “could remain vulnerable if policymakers signal rates will stay higher for longer.” At the same time, they argue that “persistent geopolitical risks and concerns over the economic impact of elevated energy prices should continue to provide underlying support,” leaving the metal caught between tighter Fed expectations and ongoing safe-haven demand.
Gold price technical analysis: Daily chart
Chart Analysis XAU/USD
In the daily chart, XAU/USD trades at $4,328.88, holding just around the 100-day simple moving average (SMA) near $4,330 while remaining capped by the 21-day SMA near $4,449.03. This configuration, with price lodged between medium- and short-term averages and the Relative Strength Index (RSI) hovering around a neutral 47, suggests a consolidative bias as bulls and bears await a clearer directional break.
On the topside, initial resistance appears at the 21-day SMA near $4,449, with the longer-term 200-day SMA around $4,540 acting as a more significant barrier if buyers regain control. On the downside, immediate support is provided by the nearby 100-day SMA at $4,327, followed by the 50-day SMA around $4,281, where a break lower would hint at a deeper corrective phase toward earlier lows.
1
139
·
--
Article
All eyes on the FOMC meetingIn focus today
In the US, the main event of the week will be the FOMC meeting tonight. Previously this week we revised our call now expecting a 25bp rate hike at the meeting. Given the current market pricing (90% probability of a hike), and the fact that we have long argued rate hikes are eventually on the horizon in any case, tightening now likely represents the path of least resistance. We do not think the decision is a completely done deal, and we believe there will be 2-3 dissenters in favour of a hold. We still expect the FOMC to publish its updated economic projections and 'dots', even if Warsh opts out from submitting his personal views again. In the afternoon US retail sales for August is released too.
In the UK
The August CPI inflation print will be released today. Headline inflation is expected to rise from 2.9% in July, driven by motor fuel and airfares. Food prices have followed a normal seasonal pattern over the summer, though higher energy prices pose an upside risk. Services inflation has been trending lower alongside wage growth. It stood at 3.4% in July and remains the key focus for the MPC, with the hawkish minority viewing it as too sticky to justify keeping rates on hold.
In Sweden
The Labour Force Survey (LFS) for August is published. The July outcome was strong: unemployment fell to 8.6% while labour force participation increased. Our forecast is that the labour market will continue to improve, but it is worth keeping in mind that the Labour Force Survey is volatile and that individual monthly outcomes should be interpreted with caution.
Economic and market news
What happened yesterday
In the euro area, the German ZEW index in September showed a markedly better assessment of the current situation, but expectations for future growth disappointed. The assessment of the current situation rose to -47.1 (cons: -52.1, prior: -61.1), which is the highest level in three and a half years. The rebound in German growth is especially due to the significant fiscal easing and a rise in manufacturing orders. However, expectations for future growth disappointed, as they remained at 34.7 (cons: 40.0, prior: 34.2). This likely reflects the recent tightening in financial conditions and higher energy costs. The impact of these factors will likely take some months to affect growth, given the lag lengths in German retail energy and rate pricing, which the September ZEW survey reflects well.
In the UK
payroll employment fell by 26,000 in August, compared with consensus expectations of a 5,000 decline, while revisions to June and July payrolls also pointed lower. The unemployment rate held steady at 4.9% in July, in line with expectations, and average weekly earnings rose by 3.9%, also matching consensus and marking the softest reading since the three months to February. Regular earnings growth averaged 6.3% in the public sector and 2.9% in the private sector, slightly above the 2.8% expected. Overall, this is another dovish data signal for the Bank of England, and the FX market appeared to read it that way, with GBP weaker.
Equities:
Equities closed lower across regions yesterday as oil gained another 4%. Oil has now risen in ten of the past eleven sessions, advancing almost 30% over that period. Unsurprisingly, Energy was the only sector in positive territory.
The more revealing signal came from the rest of the market. Excluding Energy, this was not a conventional defensive rotation. Instead, the selling was concentrated in the consumer complex, with consumer discretionary leading the decline but consumer staples also under pressure. Investors increasingly view consumers as the main casualty of higher energy prices and are reducing exposure accordingly. Despite the broader equity market still being up more than 10% year to date, consumer discretionary is the worst performing sector and is down more than 5%. Importantly, neither consumer discretionary nor consumer staples has experienced the largest earnings downgrades. The underperformance therefore reflects investors demanding a higher risk premium in the consumer sectors rather than merely responding to weaker earnings estimates.
Oil is easing from its highs this morning, supporting Asian equities, while European and US futures are marginally higher.
FI and FX:
Broad USD remained on a strong footing yesterday and EUR/USD declined modestly, as risk sentiment continued to sour. Safe-haven CHF also rose, while cyclicals NZD, SEK and AUD underperformed. USD/JPY has retraced some of its recent decline and traded up to 155 yesterday as markets await further clues from both the Fed tonight, and Bank of Japan on Friday. The EUR swap curve twist steepened yesterday, as pressure remains on the long end with global long-end yields continuing to set new decade highs. All focus will be on the FOMC meeting later this evening.
#FedRateWatch
#ClarityActOddsHalveOnPolymarket
All eyes on the FOMC meeting
In focus today
In the US, the main event of the week will be the FOMC meeting tonight. Previously this week we revised our call now expecting a 25bp rate hike at the meeting. Given the current market pricing (90% probability of a hike), and the fact that we have long argued rate hikes are eventually on the horizon in any case, tightening now likely represents the path of least resistance. We do not think the decision is a completely done deal, and we believe there will be 2-3 dissenters in favour of a hold. We still expect the FOMC to publish its updated economic projections and 'dots', even if Warsh opts out from submitting his personal views again. In the afternoon US retail sales for August is released too.
In the UK
The August CPI inflation print will be released today. Headline inflation is expected to rise from 2.9% in July, driven by motor fuel and airfares. Food prices have followed a normal seasonal pattern over the summer, though higher energy prices pose an upside risk. Services inflation has been trending lower alongside wage growth. It stood at 3.4% in July and remains the key focus for the MPC, with the hawkish minority viewing it as too sticky to justify keeping rates on hold.
In Sweden
The Labour Force Survey (LFS) for August is published. The July outcome was strong: unemployment fell to 8.6% while labour force participation increased. Our forecast is that the labour market will continue to improve, but it is worth keeping in mind that the Labour Force Survey is volatile and that individual monthly outcomes should be interpreted with caution.
Economic and market news
What happened yesterday
In the euro area, the German ZEW index in September showed a markedly better assessment of the current situation, but expectations for future growth disappointed. The assessment of the current situation rose to -47.1 (cons: -52.1, prior: -61.1), which is the highest level in three and a half years. The rebound in German growth is especially due to the significant fiscal easing and a rise in manufacturing orders. However, expectations for future growth disappointed, as they remained at 34.7 (cons: 40.0, prior: 34.2). This likely reflects the recent tightening in financial conditions and higher energy costs. The impact of these factors will likely take some months to affect growth, given the lag lengths in German retail energy and rate pricing, which the September ZEW survey reflects well.
In the UK
payroll employment fell by 26,000 in August, compared with consensus expectations of a 5,000 decline, while revisions to June and July payrolls also pointed lower. The unemployment rate held steady at 4.9% in July, in line with expectations, and average weekly earnings rose by 3.9%, also matching consensus and marking the softest reading since the three months to February. Regular earnings growth averaged 6.3% in the public sector and 2.9% in the private sector, slightly above the 2.8% expected. Overall, this is another dovish data signal for the Bank of England, and the FX market appeared to read it that way, with GBP weaker.
Equities:
Equities closed lower across regions yesterday as oil gained another 4%. Oil has now risen in ten of the past eleven sessions, advancing almost 30% over that period. Unsurprisingly, Energy was the only sector in positive territory.
The more revealing signal came from the rest of the market. Excluding Energy, this was not a conventional defensive rotation. Instead, the selling was concentrated in the consumer complex, with consumer discretionary leading the decline but consumer staples also under pressure. Investors increasingly view consumers as the main casualty of higher energy prices and are reducing exposure accordingly. Despite the broader equity market still being up more than 10% year to date, consumer discretionary is the worst performing sector and is down more than 5%. Importantly, neither consumer discretionary nor consumer staples has experienced the largest earnings downgrades. The underperformance therefore reflects investors demanding a higher risk premium in the consumer sectors rather than merely responding to weaker earnings estimates.
Oil is easing from its highs this morning, supporting Asian equities, while European and US futures are marginally higher.
FI and FX:
Broad USD remained on a strong footing yesterday and EUR/USD declined modestly, as risk sentiment continued to sour. Safe-haven CHF also rose, while cyclicals NZD, SEK and AUD underperformed. USD/JPY has retraced some of its recent decline and traded up to 155 yesterday as markets await further clues from both the Fed tonight, and Bank of Japan on Friday. The EUR swap curve twist steepened yesterday, as pressure remains on the long end with global long-end yields continuing to set new decade highs. All focus will be on the FOMC meeting later this evening.
#FedRateWatch
#ClarityActOddsHalveOnPolymarket
In the US, the main event of the week will be the FOMC meeting tonight. Previously this week we revised our call now expecting a 25bp rate hike at the meeting. Given the current market pricing (90% probability of a hike), and the fact that we have long argued rate hikes are eventually on the horizon in any case, tightening now likely represents the path of least resistance. We do not think the decision is a completely done deal, and we believe there will be 2-3 dissenters in favour of a hold. We still expect the FOMC to publish its updated economic projections and 'dots', even if Warsh opts out from submitting his personal views again. In the afternoon US retail sales for August is released too.
In the UK
The August CPI inflation print will be released today. Headline inflation is expected to rise from 2.9% in July, driven by motor fuel and airfares. Food prices have followed a normal seasonal pattern over the summer, though higher energy prices pose an upside risk. Services inflation has been trending lower alongside wage growth. It stood at 3.4% in July and remains the key focus for the MPC, with the hawkish minority viewing it as too sticky to justify keeping rates on hold.
In Sweden
The Labour Force Survey (LFS) for August is published. The July outcome was strong: unemployment fell to 8.6% while labour force participation increased. Our forecast is that the labour market will continue to improve, but it is worth keeping in mind that the Labour Force Survey is volatile and that individual monthly outcomes should be interpreted with caution.
Economic and market news
What happened yesterday
In the euro area, the German ZEW index in September showed a markedly better assessment of the current situation, but expectations for future growth disappointed. The assessment of the current situation rose to -47.1 (cons: -52.1, prior: -61.1), which is the highest level in three and a half years. The rebound in German growth is especially due to the significant fiscal easing and a rise in manufacturing orders. However, expectations for future growth disappointed, as they remained at 34.7 (cons: 40.0, prior: 34.2). This likely reflects the recent tightening in financial conditions and higher energy costs. The impact of these factors will likely take some months to affect growth, given the lag lengths in German retail energy and rate pricing, which the September ZEW survey reflects well.
In the UK
payroll employment fell by 26,000 in August, compared with consensus expectations of a 5,000 decline, while revisions to June and July payrolls also pointed lower. The unemployment rate held steady at 4.9% in July, in line with expectations, and average weekly earnings rose by 3.9%, also matching consensus and marking the softest reading since the three months to February. Regular earnings growth averaged 6.3% in the public sector and 2.9% in the private sector, slightly above the 2.8% expected. Overall, this is another dovish data signal for the Bank of England, and the FX market appeared to read it that way, with GBP weaker.
Equities:
Equities closed lower across regions yesterday as oil gained another 4%. Oil has now risen in ten of the past eleven sessions, advancing almost 30% over that period. Unsurprisingly, Energy was the only sector in positive territory.
The more revealing signal came from the rest of the market. Excluding Energy, this was not a conventional defensive rotation. Instead, the selling was concentrated in the consumer complex, with consumer discretionary leading the decline but consumer staples also under pressure. Investors increasingly view consumers as the main casualty of higher energy prices and are reducing exposure accordingly. Despite the broader equity market still being up more than 10% year to date, consumer discretionary is the worst performing sector and is down more than 5%. Importantly, neither consumer discretionary nor consumer staples has experienced the largest earnings downgrades. The underperformance therefore reflects investors demanding a higher risk premium in the consumer sectors rather than merely responding to weaker earnings estimates.
Oil is easing from its highs this morning, supporting Asian equities, while European and US futures are marginally higher.
FI and FX:
Broad USD remained on a strong footing yesterday and EUR/USD declined modestly, as risk sentiment continued to sour. Safe-haven CHF also rose, while cyclicals NZD, SEK and AUD underperformed. USD/JPY has retraced some of its recent decline and traded up to 155 yesterday as markets await further clues from both the Fed tonight, and Bank of Japan on Friday. The EUR swap curve twist steepened yesterday, as pressure remains on the long end with global long-end yields continuing to set new decade highs. All focus will be on the FOMC meeting later this evening.
#FedRateWatch
#ClarityActOddsHalveOnPolymarket
1
4
·
--
Solana transactions just got more than 3 times bigger, giving an edge over Ethereum
Solana has more than tripled the amount of data that can fit inside a transaction, giving developers room for more complex trades, company-wallet approvals and privacy applications.
The network's new Transaction V1 format went live Tuesday at approximately 01:00 UTC, according to the Solana Foundation. It raises the maximum amount of data a single transaction can carry to 4,096 bytes from 1,232 bytes.
It could help Solana sharpen its edge over rival networks such as Ethereum. While Solana has always been faster and cheaper, it previously fell behind in one key area: its transactions were strictly hard-capped at 1,232 bytes.
Ethereum, by contrast, has no rigid protocol size limit, allowing developers to execute massive,>
That became restrictive for company wallets where several people may need to approve a payment, as well as for zero-knowledge proofs, which let applications verify information without revealing the underlying data. Both are among the use cases identified in the upgrade's design proposal.#FedHikeOddsRiseTo89% $SOL
Solana transactions just got more than 3 times bigger, giving an edge over Ethereum
Solana has more than tripled the amount of data that can fit inside a transaction, giving developers room for more complex trades, company-wallet approvals and privacy applications.
The network's new Transaction V1 format went live Tuesday at approximately 01:00 UTC, according to the Solana Foundation. It raises the maximum amount of data a single transaction can carry to 4,096 bytes from 1,232 bytes.
It could help Solana sharpen its edge over rival networks such as Ethereum. While Solana has always been faster and cheaper, it previously fell behind in one key area: its transactions were strictly hard-capped at 1,232 bytes.
Ethereum, by contrast, has no rigid protocol size limit, allowing developers to execute massive,>
That became restrictive for company wallets where several people may need to approve a payment, as well as for zero-knowledge proofs, which let applications verify information without revealing the underlying data. Both are among the use cases identified in the upgrade's design proposal.#FedHikeOddsRiseTo89% $SOL
Solana has more than tripled the amount of data that can fit inside a transaction, giving developers room for more complex trades, company-wallet approvals and privacy applications.
The network's new Transaction V1 format went live Tuesday at approximately 01:00 UTC, according to the Solana Foundation. It raises the maximum amount of data a single transaction can carry to 4,096 bytes from 1,232 bytes.
It could help Solana sharpen its edge over rival networks such as Ethereum. While Solana has always been faster and cheaper, it previously fell behind in one key area: its transactions were strictly hard-capped at 1,232 bytes.
Ethereum, by contrast, has no rigid protocol size limit, allowing developers to execute massive,>
That became restrictive for company wallets where several people may need to approve a payment, as well as for zero-knowledge proofs, which let applications verify information without revealing the underlying data. Both are among the use cases identified in the upgrade's design proposal.#FedHikeOddsRiseTo89% $SOL

47
·
--
Bitcoin Is Holding Firm, Ethereum Is Pulling In Money: Here’s What Crypto Positioning Shows
Bitcoin briefly dropped to $76,700 after the latest inflation data before recovering toward $78,000. According to QCP Capital, this “contained” reaction is a sign that markets have largely absorbed the prospect of a 25-basis-point rate hike.
The firm explained that $BTC’s technical setup remains constructive at current levels, although conviction is still dependent on the broader market response to this week’s events.
Two Very Different Bets
Bitcoin is trading above a major support zone at $75,000 to $76,000 while resistance stands at $80,000 to $82,000. Ethereum is showing a significantly different flow picture. Spot $BTC ETFs recorded $462.7 million in net outflows during the holiday-shortened week. However, Friday’s withdrawal slowed sharply to $13.2 million compared with $282.7 million on Thursday.
Ethereum ETFs, meanwhile, recorded nearly $197 million in net inflows for the week. Friday’s $216.4 million influx helped drive the weekly total higher despite earlier outflows. QCP Capital said that the divergence indicated differentiated positioning between the two crypto assets. Ethereum is facing resistance at $2,500 to $2,550, while support sits at $2,400 to $2,425, and a secondary support zone is located at $2,300 to $2,350.
$BTC $ETH
Bitcoin volatility also remains relatively low. QCP Capital stated that the volatility curve is still upward sloping while the 25-delta risk reversal is around negative 3 volatility points. Puts are therefore moderately more expensive than calls, even as positioning remains well below stressed levels. The firm added that traders are staying hedged rather than taking a strong directional position.#FedHikeOddsRiseTo89%
Bitcoin Is Holding Firm, Ethereum Is Pulling In Money: Here’s What Crypto Positioning Shows
Bitcoin briefly dropped to $76,700 after the latest inflation data before recovering toward $78,000. According to QCP Capital, this “contained” reaction is a sign that markets have largely absorbed the prospect of a 25-basis-point rate hike.
The firm explained that $BTC ’s technical setup remains constructive at current levels, although conviction is still dependent on the broader market response to this week’s events.
Two Very Different Bets
Bitcoin is trading above a major support zone at $75,000 to $76,000 while resistance stands at $80,000 to $82,000. Ethereum is showing a significantly different flow picture. Spot $BTC ETFs recorded $462.7 million in net outflows during the holiday-shortened week. However, Friday’s withdrawal slowed sharply to $13.2 million compared with $282.7 million on Thursday.
Ethereum ETFs, meanwhile, recorded nearly $197 million in net inflows for the week. Friday’s $216.4 million influx helped drive the weekly total higher despite earlier outflows. QCP Capital said that the divergence indicated differentiated positioning between the two crypto assets. Ethereum is facing resistance at $2,500 to $2,550, while support sits at $2,400 to $2,425, and a secondary support zone is located at $2,300 to $2,350.
$BTC $ETH
Bitcoin volatility also remains relatively low. QCP Capital stated that the volatility curve is still upward sloping while the 25-delta risk reversal is around negative 3 volatility points. Puts are therefore moderately more expensive than calls, even as positioning remains well below stressed levels. The firm added that traders are staying hedged rather than taking a strong directional position.#FedHikeOddsRiseTo89%
Bitcoin briefly dropped to $76,700 after the latest inflation data before recovering toward $78,000. According to QCP Capital, this “contained” reaction is a sign that markets have largely absorbed the prospect of a 25-basis-point rate hike.
The firm explained that $BTC ’s technical setup remains constructive at current levels, although conviction is still dependent on the broader market response to this week’s events.
Two Very Different Bets
Bitcoin is trading above a major support zone at $75,000 to $76,000 while resistance stands at $80,000 to $82,000. Ethereum is showing a significantly different flow picture. Spot $BTC ETFs recorded $462.7 million in net outflows during the holiday-shortened week. However, Friday’s withdrawal slowed sharply to $13.2 million compared with $282.7 million on Thursday.
Ethereum ETFs, meanwhile, recorded nearly $197 million in net inflows for the week. Friday’s $216.4 million influx helped drive the weekly total higher despite earlier outflows. QCP Capital said that the divergence indicated differentiated positioning between the two crypto assets. Ethereum is facing resistance at $2,500 to $2,550, while support sits at $2,400 to $2,425, and a secondary support zone is located at $2,300 to $2,350.
$BTC $ETH
Bitcoin volatility also remains relatively low. QCP Capital stated that the volatility curve is still upward sloping while the 25-delta risk reversal is around negative 3 volatility points. Puts are therefore moderately more expensive than calls, even as positioning remains well below stressed levels. The firm added that traders are staying hedged rather than taking a strong directional position.#FedHikeOddsRiseTo89%

1
35
·
--
U.S. House panel shares crypto tax bill ahead of hearing later this week
A U.S. House of Representatives panel is poised to vote on a major crypto tax effort on Wednesday, potentially kicking off the legislative process for crypto taxes.
The House Ways and Means Committee released a 114-page crypto tax bill late Monday ahead of a Wednesday markup hearing, where lawmakers will debate provisions and vote on whether or not to advance the measure. The bill, titled the "Digital Asset Tax Certainty Act," addresses de minimis transactions, gain and loss accounting, transfers, wash sale rules, mining,staking and broker requirements, among others.
The bill follows previous efforts by Representatives Steven Horsford and Max Miller, who introduced various versions of crypto tax legislation over the past year.
The bill would eliminate taxes on de minimis network or transaction fees, meaning any fees below $10, though a person "that engaged in more than 5,000 transfers" over the prior year would be excluded. Eliminating taxes on minor transactions has been a major ask from the crypto industry in recent years, with advocates arguing that cutting the taxes would better enable digital assets for small purchases, such as cups of coffee. Currently,people transacting with digital assets must report the capital gain or loss on those transactions, even if they're small-dollar amounts.
Many of the provisions in the bill address tokenized assets, while another section tries to clarify how ownership might be treated for digital asset disposition purposes.
The bill directs the U.S. Treasury secretary and Internal Revenue Service to develop and publish new rules as needed.
#AvalancheIntegratesIntoUAEPassDigitalVault #FedHikeOddsRiseTo89%
U.S. House panel shares crypto tax bill ahead of hearing later this week
A U.S. House of Representatives panel is poised to vote on a major crypto tax effort on Wednesday, potentially kicking off the legislative process for crypto taxes.
The House Ways and Means Committee released a 114-page crypto tax bill late Monday ahead of a Wednesday markup hearing, where lawmakers will debate provisions and vote on whether or not to advance the measure. The bill, titled the "Digital Asset Tax Certainty Act," addresses de minimis transactions, gain and loss accounting, transfers, wash sale rules, mining,staking and broker requirements, among others.
The bill follows previous efforts by Representatives Steven Horsford and Max Miller, who introduced various versions of crypto tax legislation over the past year.
The bill would eliminate taxes on de minimis network or transaction fees, meaning any fees below $10, though a person "that engaged in more than 5,000 transfers" over the prior year would be excluded. Eliminating taxes on minor transactions has been a major ask from the crypto industry in recent years, with advocates arguing that cutting the taxes would better enable digital assets for small purchases, such as cups of coffee. Currently,people transacting with digital assets must report the capital gain or loss on those transactions, even if they're small-dollar amounts.
Many of the provisions in the bill address tokenized assets, while another section tries to clarify how ownership might be treated for digital asset disposition purposes.
The bill directs the U.S. Treasury secretary and Internal Revenue Service to develop and publish new rules as needed.
#AvalancheIntegratesIntoUAEPassDigitalVault #FedHikeOddsRiseTo89%
A U.S. House of Representatives panel is poised to vote on a major crypto tax effort on Wednesday, potentially kicking off the legislative process for crypto taxes.
The House Ways and Means Committee released a 114-page crypto tax bill late Monday ahead of a Wednesday markup hearing, where lawmakers will debate provisions and vote on whether or not to advance the measure. The bill, titled the "Digital Asset Tax Certainty Act," addresses de minimis transactions, gain and loss accounting, transfers, wash sale rules, mining,staking and broker requirements, among others.
The bill follows previous efforts by Representatives Steven Horsford and Max Miller, who introduced various versions of crypto tax legislation over the past year.
The bill would eliminate taxes on de minimis network or transaction fees, meaning any fees below $10, though a person "that engaged in more than 5,000 transfers" over the prior year would be excluded. Eliminating taxes on minor transactions has been a major ask from the crypto industry in recent years, with advocates arguing that cutting the taxes would better enable digital assets for small purchases, such as cups of coffee. Currently,people transacting with digital assets must report the capital gain or loss on those transactions, even if they're small-dollar amounts.
Many of the provisions in the bill address tokenized assets, while another section tries to clarify how ownership might be treated for digital asset disposition purposes.
The bill directs the U.S. Treasury secretary and Internal Revenue Service to develop and publish new rules as needed.
#AvalancheIntegratesIntoUAEPassDigitalVault #FedHikeOddsRiseTo89%
3
2k
·
--
Ripple and Stellar outlook: Extend gains as derivatives support upside$XRP XRP extends gains on Tuesday after gaining 6% the previous day.$XLM XLM trades above $0.195 after surging over 8% on Monday.Strengthening derivatives metrics support further gains for both altcoins.Ripple and Stellar outlook: Extend gains as derivatives support upside
Ripple (XRP) and Stellar (XLM) extend their gains on Tuesday after surging over 6% and 8%, respectively, on the previous day. In addition, improving derivatives metrics support a bullish bias, signaling further gains for both altcoins.
Strengthening derivatives metrics support upside for XRP and XLM
Derivatives data shows bullish bias among traders. CoinGlass’ long-to-short ratios for XRP and XLM read 1.15 and 1.35, respectively, on Tuesday. A ratio above one indicates bullish sentiment, as traders bet asset prices will rise.
XRP long-to-short ratio chart. Source: Coingalss
XLM long-to-short ratio chart. Source: Coingalss
In addition, the funding rates for both XRP and XLM flipped positive on Monday and September 9, respectively, reading 0.0085% and 0.0095% on Tuesday. These positive rates indicate that long traders are paying shorts and reflect a bullish bias.
XRP funding rates chart. Source: Coinglass
XLM funding rates chart. Source: Coinglass
Some signs of caution
CryptoQuant’s summary data shows cautious signs for both altcoins. XRP’s spot and futures markets show overheating conditions, while the futures market shows sell-side dominance, and retail traders are active. These highlight a bearish, cautious sentiment bias among Ripple traders.
For XLM, spot shows large whale orders; however, in the futures market it also shows sell-side dominance, indicating a negative outlook among Stellar traders.
XLM summary chart. Source: CryptoQuant
XRP technical outlook: Rebound from key support
XRP price trades at $1.42 on Tuesday after surging over 6% the previous day. XRP holds firmly above the 50-day, 100-day, and 200-day Exponential Moving Averages (EMAs), clustered between roughly $1.26 and $1.36, suggesting a constructive medium-term structure and keeping the near-term bias tilted to the upside.
The Relative Strength Index (RSI) hovers just below 60, indicating positive but not overstretched momentum, while the Moving Average Convergence Divergence (MACD) remains marginally negative, hinting that bullish pressure is moderating rather than accelerating.
On the downside, initial support is seen at the 200-day EMA around $1.35, followed by horizontal support near $1.30 and the 50-day EMA at $1.28, with the 100-day EMA further down at $1.25 before a stronger structural floor near $1.00.
On the topside, the next notable resistance comes at the previously defined horizontal barrier around $1.90, and a daily close above this area would be needed to unlock scope for a renewed bullish extension.
XRP/USDT daily chart
XLM technical outlook: Strengthening momentum indicators
XLM price trades at $0.196 on Tuesday after rallying over 8% the previous day. XLM holds above the 50-day, 100-day, and 200-day EMAs clustered between roughly $0.180 and $0.190, suggesting a constructive near-term bias while these averages act as layered support.
The RSI around 61 shows firm but not overstretched bullish momentum, and a slightly positive MACD reading hints that upside pressure is gradually rebuilding after the recent consolidation.
On the downside, immediate support emerges at the 200-day EMA near $0.188, followed by the 100-day EMA and the 50-day EMA, which together form a dense demand band around $0.180. A deeper pullback would expose horizontal support at $0.177 before a more distant floor near $0.142; as long as price holds above this stacked support structure, the broader path of least resistance stays tilted to the upside, even if nearby resistance must now be defined by recent swing highs rather than explicit indicator caps.
XLM/USDT daily chart
#BitcoinReboundsTo$79K
#FedHikeOddsRiseTo89%
Ripple and Stellar outlook: Extend gains as derivatives support upside
$XRP XRP extends gains on Tuesday after gaining 6% the previous day.$XLM XLM trades above $0.195 after surging over 8% on Monday.Strengthening derivatives metrics support further gains for both altcoins.Ripple and Stellar outlook: Extend gains as derivatives support upside
Ripple (XRP) and Stellar (XLM) extend their gains on Tuesday after surging over 6% and 8%, respectively, on the previous day. In addition, improving derivatives metrics support a bullish bias, signaling further gains for both altcoins.
Strengthening derivatives metrics support upside for XRP and XLM
Derivatives data shows bullish bias among traders. CoinGlass’ long-to-short ratios for XRP and XLM read 1.15 and 1.35, respectively, on Tuesday. A ratio above one indicates bullish sentiment, as traders bet asset prices will rise.
XRP long-to-short ratio chart. Source: Coingalss
XLM long-to-short ratio chart. Source: Coingalss
In addition, the funding rates for both XRP and XLM flipped positive on Monday and September 9, respectively, reading 0.0085% and 0.0095% on Tuesday. These positive rates indicate that long traders are paying shorts and reflect a bullish bias.
XRP funding rates chart. Source: Coinglass
XLM funding rates chart. Source: Coinglass
Some signs of caution
CryptoQuant’s summary data shows cautious signs for both altcoins. XRP’s spot and futures markets show overheating conditions, while the futures market shows sell-side dominance, and retail traders are active. These highlight a bearish, cautious sentiment bias among Ripple traders.
For XLM, spot shows large whale orders; however, in the futures market it also shows sell-side dominance, indicating a negative outlook among Stellar traders.
XLM summary chart. Source: CryptoQuant
XRP technical outlook: Rebound from key support
XRP price trades at $1.42 on Tuesday after surging over 6% the previous day. XRP holds firmly above the 50-day, 100-day, and 200-day Exponential Moving Averages (EMAs), clustered between roughly $1.26 and $1.36, suggesting a constructive medium-term structure and keeping the near-term bias tilted to the upside.
The Relative Strength Index (RSI) hovers just below 60, indicating positive but not overstretched momentum, while the Moving Average Convergence Divergence (MACD) remains marginally negative, hinting that bullish pressure is moderating rather than accelerating.
On the downside, initial support is seen at the 200-day EMA around $1.35, followed by horizontal support near $1.30 and the 50-day EMA at $1.28, with the 100-day EMA further down at $1.25 before a stronger structural floor near $1.00.
On the topside, the next notable resistance comes at the previously defined horizontal barrier around $1.90, and a daily close above this area would be needed to unlock scope for a renewed bullish extension.
XRP/USDT daily chart
XLM technical outlook: Strengthening momentum indicators
XLM price trades at $0.196 on Tuesday after rallying over 8% the previous day. XLM holds above the 50-day, 100-day, and 200-day EMAs clustered between roughly $0.180 and $0.190, suggesting a constructive near-term bias while these averages act as layered support.
The RSI around 61 shows firm but not overstretched bullish momentum, and a slightly positive MACD reading hints that upside pressure is gradually rebuilding after the recent consolidation.
On the downside, immediate support emerges at the 200-day EMA near $0.188, followed by the 100-day EMA and the 50-day EMA, which together form a dense demand band around $0.180. A deeper pullback would expose horizontal support at $0.177 before a more distant floor near $0.142; as long as price holds above this stacked support structure, the broader path of least resistance stays tilted to the upside, even if nearby resistance must now be defined by recent swing highs rather than explicit indicator caps.
XLM/USDT daily chart
#BitcoinReboundsTo$79K
#FedHikeOddsRiseTo89%
Ripple (XRP) and Stellar (XLM) extend their gains on Tuesday after surging over 6% and 8%, respectively, on the previous day. In addition, improving derivatives metrics support a bullish bias, signaling further gains for both altcoins.
Strengthening derivatives metrics support upside for XRP and XLM
Derivatives data shows bullish bias among traders. CoinGlass’ long-to-short ratios for XRP and XLM read 1.15 and 1.35, respectively, on Tuesday. A ratio above one indicates bullish sentiment, as traders bet asset prices will rise.
XRP long-to-short ratio chart. Source: Coingalss
XLM long-to-short ratio chart. Source: Coingalss
In addition, the funding rates for both XRP and XLM flipped positive on Monday and September 9, respectively, reading 0.0085% and 0.0095% on Tuesday. These positive rates indicate that long traders are paying shorts and reflect a bullish bias.
XRP funding rates chart. Source: Coinglass
XLM funding rates chart. Source: Coinglass
Some signs of caution
CryptoQuant’s summary data shows cautious signs for both altcoins. XRP’s spot and futures markets show overheating conditions, while the futures market shows sell-side dominance, and retail traders are active. These highlight a bearish, cautious sentiment bias among Ripple traders.
For XLM, spot shows large whale orders; however, in the futures market it also shows sell-side dominance, indicating a negative outlook among Stellar traders.
XLM summary chart. Source: CryptoQuant
XRP technical outlook: Rebound from key support
XRP price trades at $1.42 on Tuesday after surging over 6% the previous day. XRP holds firmly above the 50-day, 100-day, and 200-day Exponential Moving Averages (EMAs), clustered between roughly $1.26 and $1.36, suggesting a constructive medium-term structure and keeping the near-term bias tilted to the upside.
The Relative Strength Index (RSI) hovers just below 60, indicating positive but not overstretched momentum, while the Moving Average Convergence Divergence (MACD) remains marginally negative, hinting that bullish pressure is moderating rather than accelerating.
On the downside, initial support is seen at the 200-day EMA around $1.35, followed by horizontal support near $1.30 and the 50-day EMA at $1.28, with the 100-day EMA further down at $1.25 before a stronger structural floor near $1.00.
On the topside, the next notable resistance comes at the previously defined horizontal barrier around $1.90, and a daily close above this area would be needed to unlock scope for a renewed bullish extension.
XRP/USDT daily chart
XLM technical outlook: Strengthening momentum indicators
XLM price trades at $0.196 on Tuesday after rallying over 8% the previous day. XLM holds above the 50-day, 100-day, and 200-day EMAs clustered between roughly $0.180 and $0.190, suggesting a constructive near-term bias while these averages act as layered support.
The RSI around 61 shows firm but not overstretched bullish momentum, and a slightly positive MACD reading hints that upside pressure is gradually rebuilding after the recent consolidation.
On the downside, immediate support emerges at the 200-day EMA near $0.188, followed by the 100-day EMA and the 50-day EMA, which together form a dense demand band around $0.180. A deeper pullback would expose horizontal support at $0.177 before a more distant floor near $0.142; as long as price holds above this stacked support structure, the broader path of least resistance stays tilted to the upside, even if nearby resistance must now be defined by recent swing highs rather than explicit indicator caps.
XLM/USDT daily chart
#BitcoinReboundsTo$79K
#FedHikeOddsRiseTo89%
1
275
Connectez-vous pour découvrir plus de contenu
Rejoignez la communauté mondiale des adeptes de cryptomonnaies sur Binance Square
⚡️ Suviez les dernières informations importantes sur les cryptomonnaies.
💬 Jugé digne de confiance par la plus grande plateforme d’échange de cryptomonnaies au monde.
👍 Découvrez les connaissances que partagent les créateurs vérifiés.
Adresse e-mail/Nº de téléphone