

#options
options
130,913 vues
827 mentions
Populaire
Récents

·
--
The perp market tells you what the crowd is doing. The options market tells you what institutions are afraid of.
Funding rates and open interest show positioning. Options show priced fear. Three numbers matter:
Implied volatility is the price of insurance. When IV runs hot relative to realized volatility, someone is paying up for protection — and insurance buyers often know something positioning data hasn't shown yet.
Skew shows which tail they fear. Puts rich relative to calls = institutional demand for downside protection. Calls rich = speculative upside chase, usually late-cycle, usually retail-flavored.
Term structure shows when. Short-dated IV spiking while long-dated stays calm = event anxiety. A flat curve that quietly inverts is where the market reprices risk before the headline arrives.
$BTC and $ETH now have options markets deep enough to read as sentiment instruments, not curiosities. $SOL options remain thin — which is itself information: thin options markets make hedging expensive, so forced flows spill directly into spot.
Options don't predict direction. They reveal where hedging demand concentrates — and hedging demand is the most honest signal in crypto, because it's the only one paid for with premium rather than narrative.
#Bitcoin #Ethereum #Crypto #Options #MarketStructure
The perp market tells you what the crowd is doing. The options market tells you what institutions are afraid of.
Funding rates and open interest show positioning. Options show priced fear. Three numbers matter:
Implied volatility is the price of insurance. When IV runs hot relative to realized volatility, someone is paying up for protection — and insurance buyers often know something positioning data hasn't shown yet.
Skew shows which tail they fear. Puts rich relative to calls = institutional demand for downside protection. Calls rich = speculative upside chase, usually late-cycle, usually retail-flavored.
Term structure shows when. Short-dated IV spiking while long-dated stays calm = event anxiety. A flat curve that quietly inverts is where the market reprices risk before the headline arrives.
$BTC and $ETH now have options markets deep enough to read as sentiment instruments, not curiosities. $SOL options remain thin — which is itself information: thin options markets make hedging expensive, so forced flows spill directly into spot.
Options don't predict direction. They reveal where hedging demand concentrates — and hedging demand is the most honest signal in crypto, because it's the only one paid for with premium rather than narrative.
#Bitcoin #Ethereum #Crypto #Options #MarketStructure
Funding rates and open interest show positioning. Options show priced fear. Three numbers matter:
Implied volatility is the price of insurance. When IV runs hot relative to realized volatility, someone is paying up for protection — and insurance buyers often know something positioning data hasn't shown yet.
Skew shows which tail they fear. Puts rich relative to calls = institutional demand for downside protection. Calls rich = speculative upside chase, usually late-cycle, usually retail-flavored.
Term structure shows when. Short-dated IV spiking while long-dated stays calm = event anxiety. A flat curve that quietly inverts is where the market reprices risk before the headline arrives.
$BTC and $ETH now have options markets deep enough to read as sentiment instruments, not curiosities. $SOL options remain thin — which is itself information: thin options markets make hedging expensive, so forced flows spill directly into spot.
Options don't predict direction. They reveal where hedging demand concentrates — and hedging demand is the most honest signal in crypto, because it's the only one paid for with premium rather than narrative.
#Bitcoin #Ethereum #Crypto #Options #MarketStructure
122

·
--
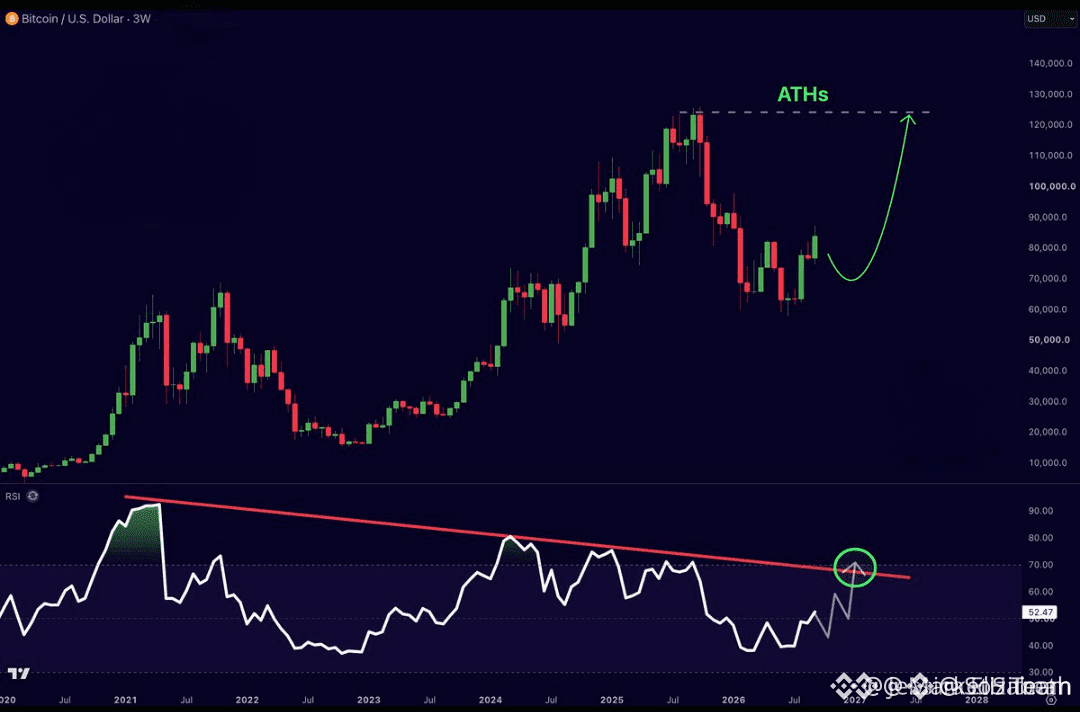
A $90K,$100K call wall with $BTC sitting in the mid-$80Ks looks like the market is already positioning for a big move higher, but that is usually a misread.
Traders keep treating these walls as guaranteed magnets and jump in too early. That is how they get stuck in underwater longs when the expected squeeze never shows up.
A call wall is simply a large cluster of call open interest at those strikes. Dealers who sold the calls would have to buy $BTC to hedge if price got close, which can accelerate a rally. We are still $5K to $15K below $90K, so none of that forced buying is happening yet. The market has not priced in a move to those levels because the options remain too far out of the money. Similar distant walls have failed before when $ETH options stayed quiet and $SOL flows never confirmed, turning the cluster into overhead supply instead of fuel.
What's your take on whether this $BTC wall actually pulls price or just sits there unused?
#Bitcoin #Options #Crypto
A $90K,$100K call wall with $BTC sitting in the mid-$80Ks looks like the market is already positioning for a big move higher, but that is usually a misread.
Traders keep treating these walls as guaranteed magnets and jump in too early. That is how they get stuck in underwater longs when the expected squeeze never shows up.
A call wall is simply a large cluster of call open interest at those strikes. Dealers who sold the calls would have to buy $BTC to hedge if price got close, which can accelerate a rally. We are still $5K to $15K below $90K, so none of that forced buying is happening yet. The market has not priced in a move to those levels because the options remain too far out of the money. Similar distant walls have failed before when $ETH options stayed quiet and $SOL flows never confirmed, turning the cluster into overhead supply instead of fuel.
What's your take on whether this $BTC wall actually pulls price or just sits there unused?
#Bitcoin #Options #Crypto
Traders keep treating these walls as guaranteed magnets and jump in too early. That is how they get stuck in underwater longs when the expected squeeze never shows up.
A call wall is simply a large cluster of call open interest at those strikes. Dealers who sold the calls would have to buy $BTC to hedge if price got close, which can accelerate a rally. We are still $5K to $15K below $90K, so none of that forced buying is happening yet. The market has not priced in a move to those levels because the options remain too far out of the money. Similar distant walls have failed before when $ETH options stayed quiet and $SOL flows never confirmed, turning the cluster into overhead supply instead of fuel.
What's your take on whether this $BTC wall actually pulls price or just sits there unused?
#Bitcoin #Options #Crypto
25

·
--
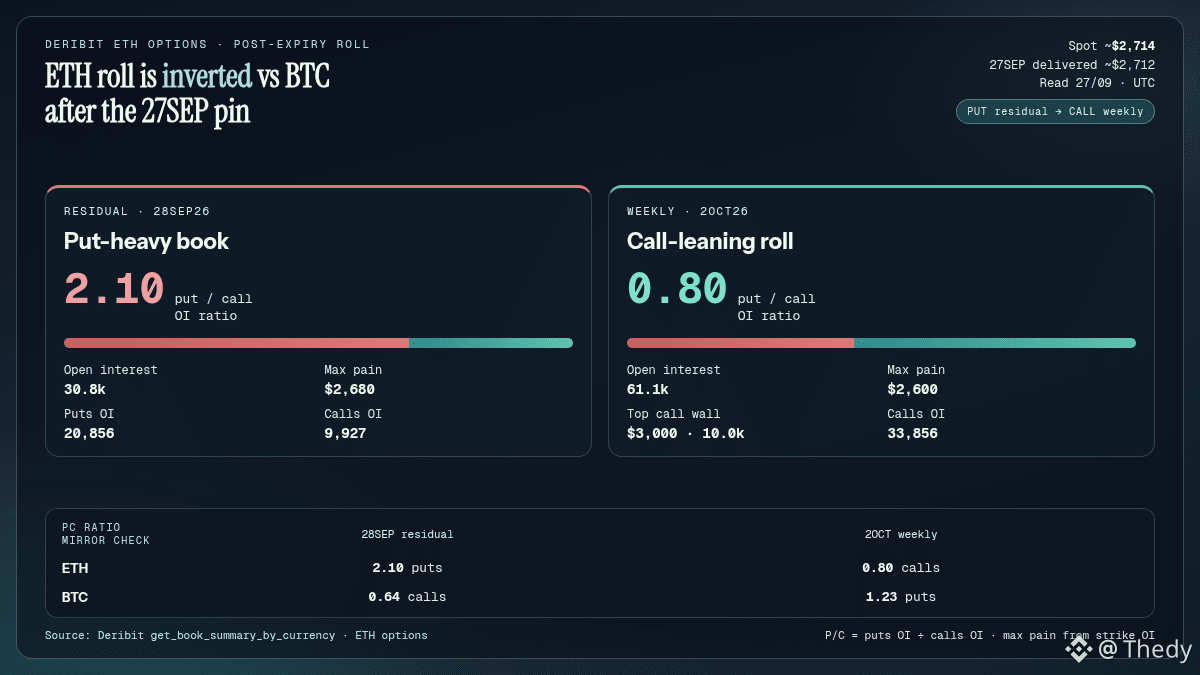
Le roll $ETH sur Deribit ne ressemble pas au roll $BTC. Après le pin 27SEP, le résiduel et le weekly pointent dans des directions opposées.
FAITS (Deribit get_book_summary_by_currency, options ETH, lecture 27/09 UTC) :
• 27SEP26 : expiré / livré ≈ 2 712 (plus dans le book actif)
• Résiduel 28SEP26 : puts ≈ 20 856 / calls ≈ 9 927, put/call ≈ 2,10, OI ≈ 30,8k, max pain ≈ 2 680. Book clairement put-heavy sous le spot (~2 714 Kraken)
• Weekly 2OCT26 : calls ≈ 33 856 / puts ≈ 27 250, put/call ≈ 0,80, OI ≈ 61,1k, max pain ≈ 2 600. Mur d'appels visible à 3 000 (≈ 10,0k OI)
MIROIR BTC (même fenêtre, post précédent) :
• BTC 28SEP put/call ≈ 0,64 (call-leaning) · BTC 2OCT put/call ≈ 1,23 (put-heavy)
• Sur ETH, c'est l'inverse : put résiduel, puis weekly qui rebascule call
INTERPRÉTATION :
Le marché options ETH garde une couverture courte échéance (28SEP) tout en roulant du gamma/call vers le 2OCT. Ce n'est pas un signal directionnel unique. C'est une structure de positionnement : hedge proche, upside plus loin, avec un max pain weekly encore sous le spot.
SCÉNARIOS :
• Tenue au-dessus de ~2 680–2 700 : le put résiduel perd de la valeur, focus passe au mur 3k du 2OCT
• Rejet sous ~2 680 : le book put 28SEP redevient l'aimant court terme
• Invalidation lecture "miroir" : si le PC 2OCT remonte nettement au-dessus de 1,0 avant le weekly
$ETH $BTC
La structure ETH te semble plus hedge défensif, ou déjà un roll vers l'upside 3k ?
#Ethereum #Options #Deribit
Le roll $ETH sur Deribit ne ressemble pas au roll $BTC . Après le pin 27SEP, le résiduel et le weekly pointent dans des directions opposées.
FAITS (Deribit get_book_summary_by_currency, options ETH, lecture 27/09 UTC) :
• 27SEP26 : expiré / livré ≈ 2 712 (plus dans le book actif)
• Résiduel 28SEP26 : puts ≈ 20 856 / calls ≈ 9 927, put/call ≈ 2,10, OI ≈ 30,8k, max pain ≈ 2 680. Book clairement put-heavy sous le spot (~2 714 Kraken)
• Weekly 2OCT26 : calls ≈ 33 856 / puts ≈ 27 250, put/call ≈ 0,80, OI ≈ 61,1k, max pain ≈ 2 600. Mur d'appels visible à 3 000 (≈ 10,0k OI)
MIROIR BTC (même fenêtre, post précédent) :
• BTC 28SEP put/call ≈ 0,64 (call-leaning) · BTC 2OCT put/call ≈ 1,23 (put-heavy)
• Sur ETH, c'est l'inverse : put résiduel, puis weekly qui rebascule call
INTERPRÉTATION :
Le marché options ETH garde une couverture courte échéance (28SEP) tout en roulant du gamma/call vers le 2OCT. Ce n'est pas un signal directionnel unique. C'est une structure de positionnement : hedge proche, upside plus loin, avec un max pain weekly encore sous le spot.
SCÉNARIOS :
• Tenue au-dessus de ~2 680–2 700 : le put résiduel perd de la valeur, focus passe au mur 3k du 2OCT
• Rejet sous ~2 680 : le book put 28SEP redevient l'aimant court terme
• Invalidation lecture "miroir" : si le PC 2OCT remonte nettement au-dessus de 1,0 avant le weekly
$ETH $BTC
La structure ETH te semble plus hedge défensif, ou déjà un roll vers l'upside 3k ?
#Ethereum #Options #Deribit
FAITS (Deribit get_book_summary_by_currency, options ETH, lecture 27/09 UTC) :
• 27SEP26 : expiré / livré ≈ 2 712 (plus dans le book actif)
• Résiduel 28SEP26 : puts ≈ 20 856 / calls ≈ 9 927, put/call ≈ 2,10, OI ≈ 30,8k, max pain ≈ 2 680. Book clairement put-heavy sous le spot (~2 714 Kraken)
• Weekly 2OCT26 : calls ≈ 33 856 / puts ≈ 27 250, put/call ≈ 0,80, OI ≈ 61,1k, max pain ≈ 2 600. Mur d'appels visible à 3 000 (≈ 10,0k OI)
MIROIR BTC (même fenêtre, post précédent) :
• BTC 28SEP put/call ≈ 0,64 (call-leaning) · BTC 2OCT put/call ≈ 1,23 (put-heavy)
• Sur ETH, c'est l'inverse : put résiduel, puis weekly qui rebascule call
INTERPRÉTATION :
Le marché options ETH garde une couverture courte échéance (28SEP) tout en roulant du gamma/call vers le 2OCT. Ce n'est pas un signal directionnel unique. C'est une structure de positionnement : hedge proche, upside plus loin, avec un max pain weekly encore sous le spot.
SCÉNARIOS :
• Tenue au-dessus de ~2 680–2 700 : le put résiduel perd de la valeur, focus passe au mur 3k du 2OCT
• Rejet sous ~2 680 : le book put 28SEP redevient l'aimant court terme
• Invalidation lecture "miroir" : si le PC 2OCT remonte nettement au-dessus de 1,0 avant le weekly
$ETH $BTC
La structure ETH te semble plus hedge défensif, ou déjà un roll vers l'upside 3k ?
#Ethereum #Options #Deribit
56
·
--
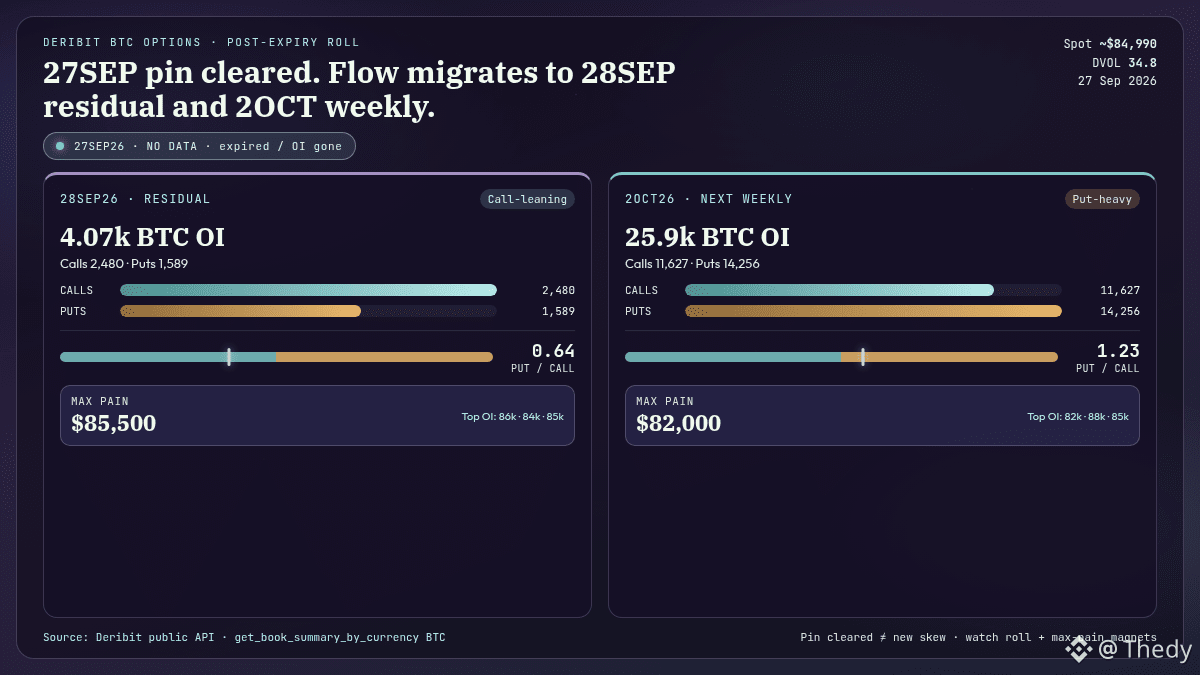
Le pin 27SEP Deribit a disparu du book. Le roll $BTC se lit maintenant sur le résiduel 28SEP et le weekly 2OCT.
FAITS (Deribit get_book_summary_by_currency, BTC options, lecture live 27/09) :
• 27SEP26 : plus de données (expiré, OI effacé). La veille encore : OI ≈ 4 462, put/call ≈ 0,49, max pain ≈ 84 500
• Résiduel 28SEP26 : calls ≈ 2 480 / puts ≈ 1 589, put/call ≈ 0,64 (call-leaning), max pain ≈ 85 500. Top OI : 86k / 84k / 85k
• Weekly 2OCT26 : calls ≈ 11 627 / puts ≈ 14 256, put/call ≈ 1,23 (put-heavy), OI ≈ 25,9k BTC, max pain ≈ 82 000. Top OI : 82k / 88k / 85k
• Spot ≈ 84 990 (+0,7% 24h), DVOL ≈ 34,8. Funding perp calme
INTERPRÉTATION :
Ce n’est plus le skew pré-expiry. C’est le post-roll : le pin du jour a été nettoyé, le résiduel 28SEP reste léger et call-leaning, tandis que le vrai stock d’OI a basculé sur 2OCT, plus put-heavy, avec un max pain plus bas (~82k) sous le spot.
SCÉNARIOS :
• Consolidation / pin soft : spot reste près de 84,5k–86k tant que le résiduel 28SEP digère
• Magnet hebdo : si le flux continue sur 2OCT, la zone 82k (max pain) + clusters 85k/88k devient le cadre de la semaine
• Pas un signal directionnel pur : OI put-heavy ≠ short spot forcé, surtout avec funding neutre
Tu trades plutôt le résiduel 28SEP ou le weekly 2OCT sur $BTC ?
#Bitcoin #Options #Crypto
Le pin 27SEP Deribit a disparu du book. Le roll $BTC se lit maintenant sur le résiduel 28SEP et le weekly 2OCT.
FAITS (Deribit get_book_summary_by_currency, BTC options, lecture live 27/09) :
• 27SEP26 : plus de données (expiré, OI effacé). La veille encore : OI ≈ 4 462, put/call ≈ 0,49, max pain ≈ 84 500
• Résiduel 28SEP26 : calls ≈ 2 480 / puts ≈ 1 589, put/call ≈ 0,64 (call-leaning), max pain ≈ 85 500. Top OI : 86k / 84k / 85k
• Weekly 2OCT26 : calls ≈ 11 627 / puts ≈ 14 256, put/call ≈ 1,23 (put-heavy), OI ≈ 25,9k BTC, max pain ≈ 82 000. Top OI : 82k / 88k / 85k
• Spot ≈ 84 990 (+0,7% 24h), DVOL ≈ 34,8. Funding perp calme
INTERPRÉTATION :
Ce n’est plus le skew pré-expiry. C’est le post-roll : le pin du jour a été nettoyé, le résiduel 28SEP reste léger et call-leaning, tandis que le vrai stock d’OI a basculé sur 2OCT, plus put-heavy, avec un max pain plus bas (~82k) sous le spot.
SCÉNARIOS :
• Consolidation / pin soft : spot reste près de 84,5k–86k tant que le résiduel 28SEP digère
• Magnet hebdo : si le flux continue sur 2OCT, la zone 82k (max pain) + clusters 85k/88k devient le cadre de la semaine
• Pas un signal directionnel pur : OI put-heavy ≠ short spot forcé, surtout avec funding neutre
Tu trades plutôt le résiduel 28SEP ou le weekly 2OCT sur $BTC ?
#Bitcoin #Options #Crypto
FAITS (Deribit get_book_summary_by_currency, BTC options, lecture live 27/09) :
• 27SEP26 : plus de données (expiré, OI effacé). La veille encore : OI ≈ 4 462, put/call ≈ 0,49, max pain ≈ 84 500
• Résiduel 28SEP26 : calls ≈ 2 480 / puts ≈ 1 589, put/call ≈ 0,64 (call-leaning), max pain ≈ 85 500. Top OI : 86k / 84k / 85k
• Weekly 2OCT26 : calls ≈ 11 627 / puts ≈ 14 256, put/call ≈ 1,23 (put-heavy), OI ≈ 25,9k BTC, max pain ≈ 82 000. Top OI : 82k / 88k / 85k
• Spot ≈ 84 990 (+0,7% 24h), DVOL ≈ 34,8. Funding perp calme
INTERPRÉTATION :
Ce n’est plus le skew pré-expiry. C’est le post-roll : le pin du jour a été nettoyé, le résiduel 28SEP reste léger et call-leaning, tandis que le vrai stock d’OI a basculé sur 2OCT, plus put-heavy, avec un max pain plus bas (~82k) sous le spot.
SCÉNARIOS :
• Consolidation / pin soft : spot reste près de 84,5k–86k tant que le résiduel 28SEP digère
• Magnet hebdo : si le flux continue sur 2OCT, la zone 82k (max pain) + clusters 85k/88k devient le cadre de la semaine
• Pas un signal directionnel pur : OI put-heavy ≠ short spot forcé, surtout avec funding neutre
Tu trades plutôt le résiduel 28SEP ou le weekly 2OCT sur $BTC ?
#Bitcoin #Options #Crypto
49

#options
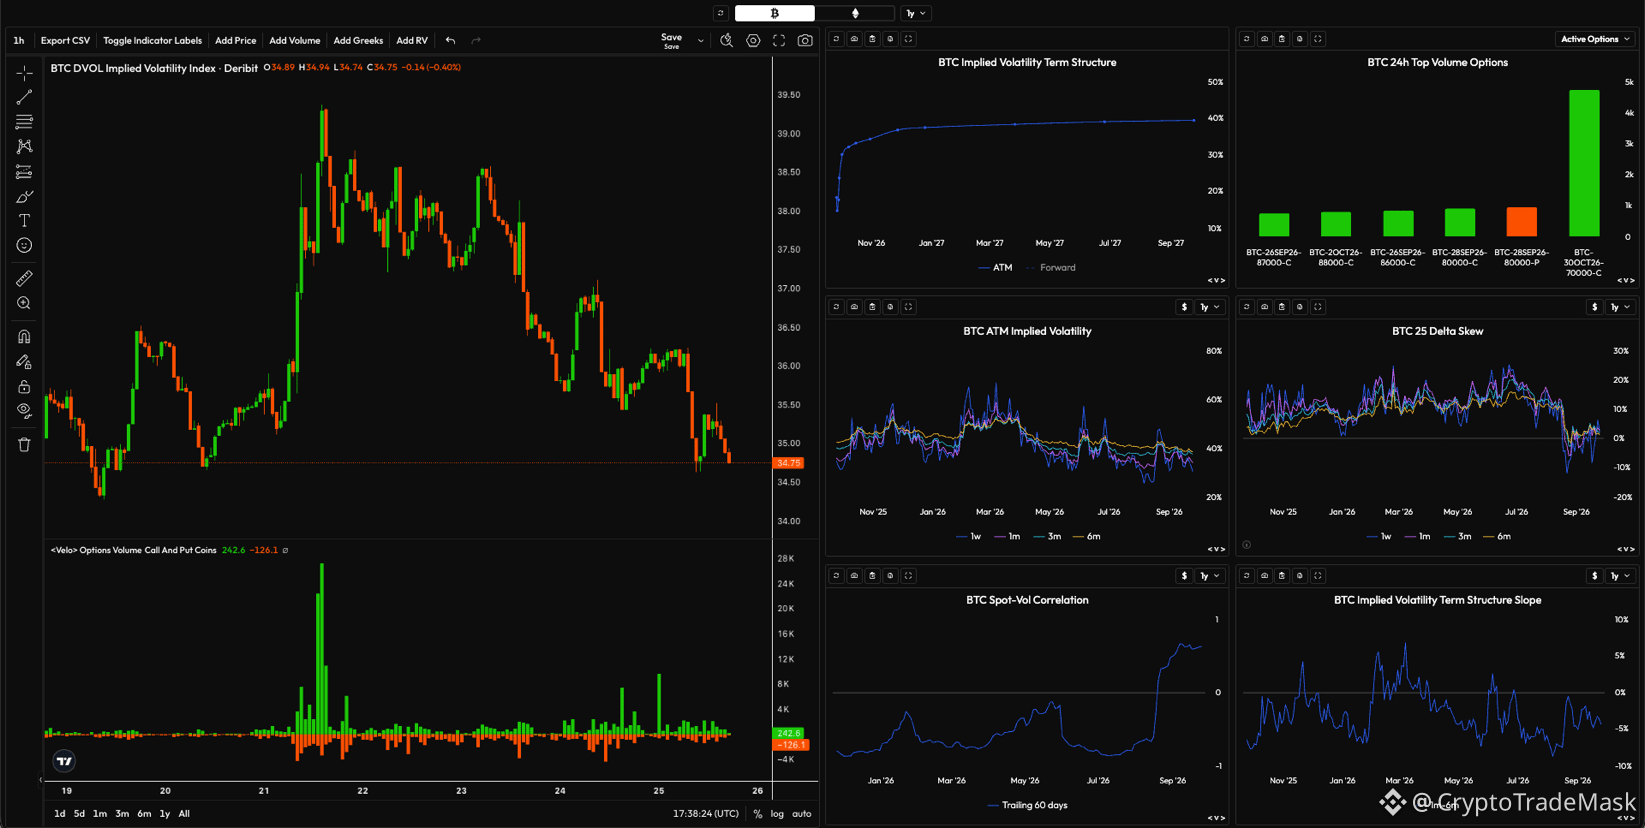
🚀 #ETH vs. #BTC : What do the options and volatility markets say?
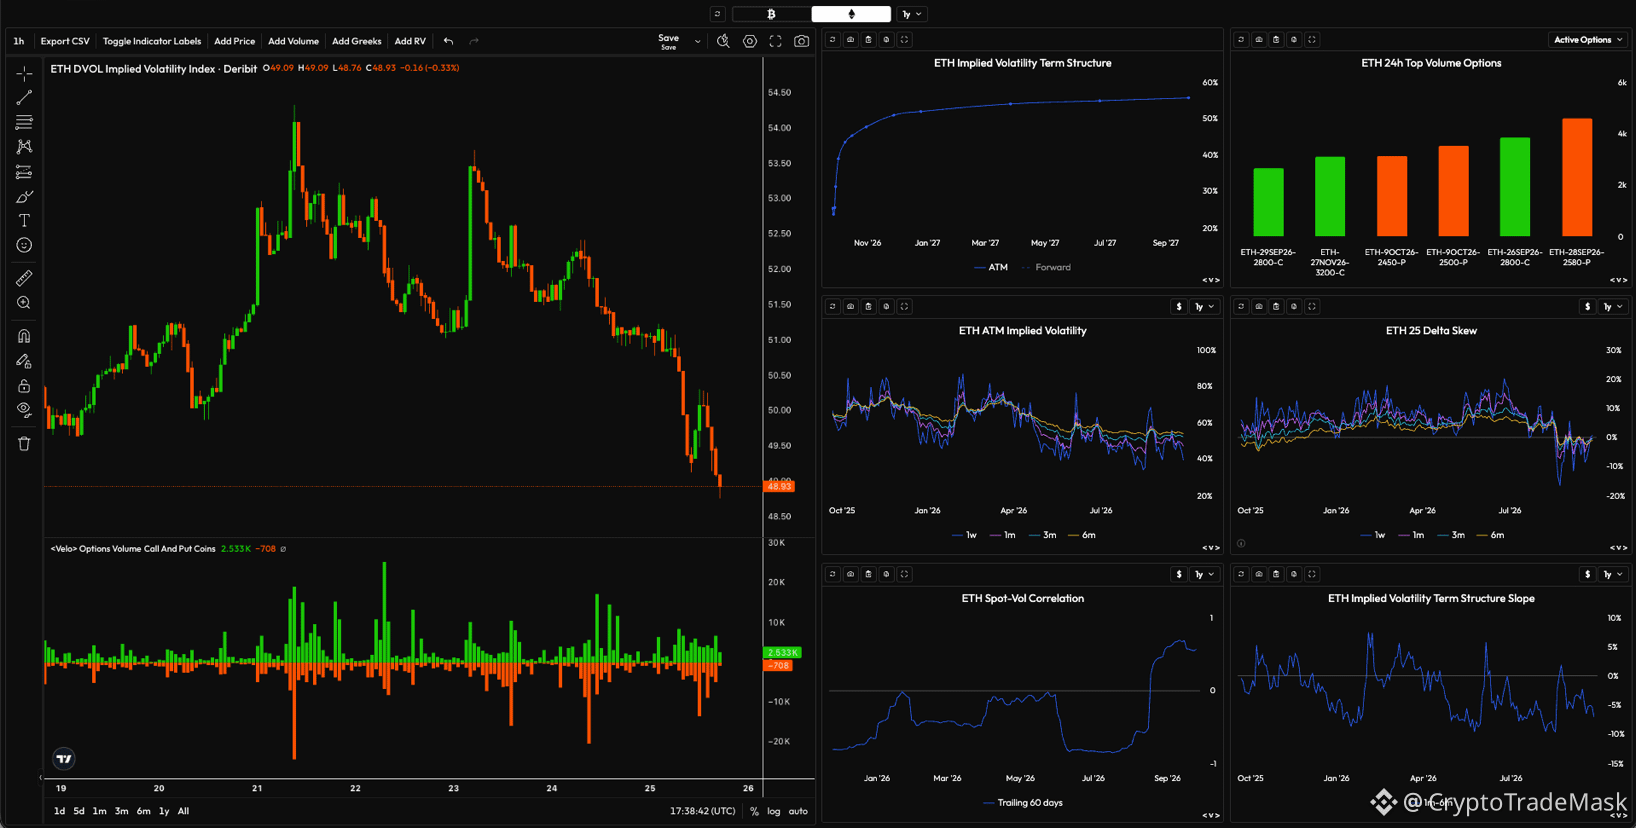
A fascinating divergence in sentiment between the two major assets is currently taking shape in the crypto options market. Let’s break down the key metrics from the Deribit and Velo dashboards:
{future}(ETHUSDT)
📊 #Ethereum ($ETH ) — Downside protection and caution
Volatility Index (DVOL): Currently at 48.98 after dropping from local peaks. The decline in DVOL during the correction indicates a local easing of panic, though the market remains tense.
Option Volumes (24h Top Volume): A distinct skew toward Put options—the highest volumes are concentrated at the 2500-P and 2400-P strikes. Major players have ramped up risk hedging or are preparing for a retest of the $2,400–$2,500 support levels.
Delta Skew & Spot-Vol Correlation: Negative skew and high positive correlation (~0.8) confirm a premium for downside protection.
{future}(BTCUSDT)
⚡ #bitcoin ($BTC ) — Quietly gearing up for a bullish reversal
Volatility Index (DVOL): Remains low—around 34.75—indicating consolidation and a buildup of strength.
Option Volumes (24h Top Volume): Call options dominate! A notable surge in volume is evident at strikes of $70,000 and above (reaching as high as $80,000–$87,000). Term Structure: Distinct contango (rising from 35% to over 40%) signals expectations of strong momentum over a longer time horizon.
🎯 Conclusion and Summary:
1. ETH is showing signs of local weakness, and the market is bracing for a potential dip to the $2,400–$2,500 range before a bottom is established.
2. BTC is in a much stronger position: institutional players are actively buying call options, anticipating an upward breakout from the current sideways range.
3. Overall Outlook: A lull in volatility (DVOL) for both assets typically precedes a powerful trending move.
#options
🚀 #ETH vs. #BTC : What do the options and volatility markets say?
A fascinating divergence in sentiment between the two major assets is currently taking shape in the crypto options market. Let’s break down the key metrics from the Deribit and Velo dashboards:
📊 #Ethereum ($ETH ) — Downside protection and caution
Volatility Index (DVOL): Currently at 48.98 after dropping from local peaks. The decline in DVOL during the correction indicates a local easing of panic, though the market remains tense.
Option Volumes (24h Top Volume): A distinct skew toward Put options—the highest volumes are concentrated at the 2500-P and 2400-P strikes. Major players have ramped up risk hedging or are preparing for a retest of the $2,400–$2,500 support levels.
Delta Skew & Spot-Vol Correlation: Negative skew and high positive correlation (~0.8) confirm a premium for downside protection.
⚡ #bitcoin ($BTC ) — Quietly gearing up for a bullish reversal
Volatility Index (DVOL): Remains low—around 34.75—indicating consolidation and a buildup of strength.
Option Volumes (24h Top Volume): Call options dominate! A notable surge in volume is evident at strikes of $70,000 and above (reaching as high as $80,000–$87,000). Term Structure: Distinct contango (rising from 35% to over 40%) signals expectations of strong momentum over a longer time horizon.
🎯 Conclusion and Summary:
1. ETH is showing signs of local weakness, and the market is bracing for a potential dip to the $2,400–$2,500 range before a bottom is established.
2. BTC is in a much stronger position: institutional players are actively buying call options, anticipating an upward breakout from the current sideways range.
3. Overall Outlook: A lull in volatility (DVOL) for both assets typically precedes a powerful trending move.
🚀 #ETH vs. #BTC : What do the options and volatility markets say?
A fascinating divergence in sentiment between the two major assets is currently taking shape in the crypto options market. Let’s break down the key metrics from the Deribit and Velo dashboards:
📊 #Ethereum ($ETH ) — Downside protection and caution
Volatility Index (DVOL): Currently at 48.98 after dropping from local peaks. The decline in DVOL during the correction indicates a local easing of panic, though the market remains tense.
Option Volumes (24h Top Volume): A distinct skew toward Put options—the highest volumes are concentrated at the 2500-P and 2400-P strikes. Major players have ramped up risk hedging or are preparing for a retest of the $2,400–$2,500 support levels.
Delta Skew & Spot-Vol Correlation: Negative skew and high positive correlation (~0.8) confirm a premium for downside protection.
⚡ #bitcoin ($BTC ) — Quietly gearing up for a bullish reversal
Volatility Index (DVOL): Remains low—around 34.75—indicating consolidation and a buildup of strength.
Option Volumes (24h Top Volume): Call options dominate! A notable surge in volume is evident at strikes of $70,000 and above (reaching as high as $80,000–$87,000). Term Structure: Distinct contango (rising from 35% to over 40%) signals expectations of strong momentum over a longer time horizon.
🎯 Conclusion and Summary:
1. ETH is showing signs of local weakness, and the market is bracing for a potential dip to the $2,400–$2,500 range before a bottom is established.
2. BTC is in a much stronger position: institutional players are actively buying call options, anticipating an upward breakout from the current sideways range.
3. Overall Outlook: A lull in volatility (DVOL) for both assets typically precedes a powerful trending move.
2
86
·
--
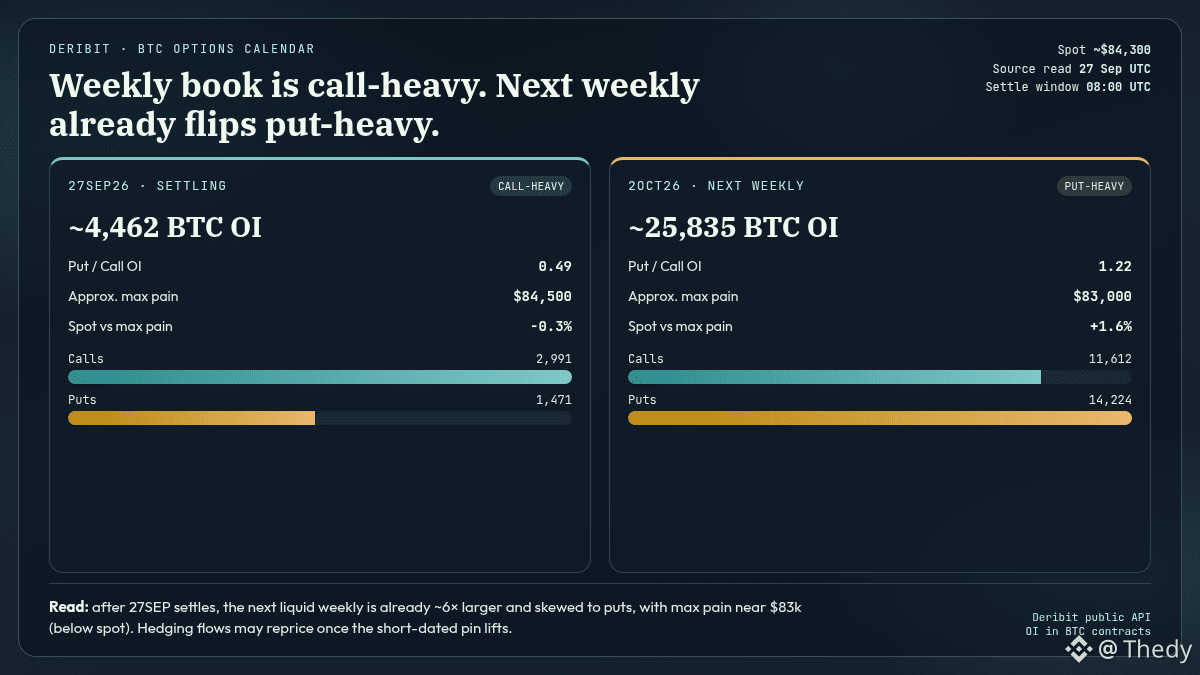
Le pin court de $BTC sur Deribit change déjà de visage.
Faits (API publique Deribit, lecture du 27/09 UTC) :
• Expiry 27SEP26 (règlement ~08:00 UTC) : OI ≈ 4 462 BTC, skew call-heavy (put/call ≈ 0,49), max pain approx. ≈ 84 500 $. Spot ≈ 84 300 $, soit −0,3 % sous ce niveau.
• Prochaine hebdo 2OCT26 : OI déjà ≈ 25 835 BTC (≈ 6× plus large), skew put-heavy (put/call ≈ 1,22), max pain approx. ≈ 83 000 $ (≈ +1,6 % sous le spot).
Interprétation (pas un conseil) : tant que le short-dated tient le prix près de 84,5k, le pin masque le vrai déséquilibre. Une fois 27SEP réglé, le livre liquide suivant est déjà biasé puts avec une douleur max plus basse. Les flux de hedging dealers peuvent alors réancrer la zone utile autour de ~83k, sauf si le spot casse franchement au-dessus des gros strikes calls (88k sur 2OCT).
Scénarios :
1) Spot tient 84k–84,5k après settlement → digestion calme, le skew 2OCT reste un frein plus qu’un aimant immédiat
2) Pullback vers 83–83,5k → alignement avec le max pain 2OCT et les gros puts (78k–82k)
3) Break net au-dessus de 85–86k → le biais put-heavy se fait mal et force un rattrapage de hedges
Tu regardes plutôt le pin jusqu’à 08:00 UTC, ou déjà le livre 2OCT ?
$BTC $ETH
#Bitcoin #Options #Crypto
Le pin court de $BTC sur Deribit change déjà de visage.
Faits (API publique Deribit, lecture du 27/09 UTC) :
• Expiry 27SEP26 (règlement ~08:00 UTC) : OI ≈ 4 462 BTC, skew call-heavy (put/call ≈ 0,49), max pain approx. ≈ 84 500 $. Spot ≈ 84 300 $, soit −0,3 % sous ce niveau.
• Prochaine hebdo 2OCT26 : OI déjà ≈ 25 835 BTC (≈ 6× plus large), skew put-heavy (put/call ≈ 1,22), max pain approx. ≈ 83 000 $ (≈ +1,6 % sous le spot).
Interprétation (pas un conseil) : tant que le short-dated tient le prix près de 84,5k, le pin masque le vrai déséquilibre. Une fois 27SEP réglé, le livre liquide suivant est déjà biasé puts avec une douleur max plus basse. Les flux de hedging dealers peuvent alors réancrer la zone utile autour de ~83k, sauf si le spot casse franchement au-dessus des gros strikes calls (88k sur 2OCT).
Scénarios :
1) Spot tient 84k–84,5k après settlement → digestion calme, le skew 2OCT reste un frein plus qu’un aimant immédiat
2) Pullback vers 83–83,5k → alignement avec le max pain 2OCT et les gros puts (78k–82k)
3) Break net au-dessus de 85–86k → le biais put-heavy se fait mal et force un rattrapage de hedges
Tu regardes plutôt le pin jusqu’à 08:00 UTC, ou déjà le livre 2OCT ?
$BTC $ETH
#Bitcoin #Options #Crypto
Faits (API publique Deribit, lecture du 27/09 UTC) :
• Expiry 27SEP26 (règlement ~08:00 UTC) : OI ≈ 4 462 BTC, skew call-heavy (put/call ≈ 0,49), max pain approx. ≈ 84 500 $. Spot ≈ 84 300 $, soit −0,3 % sous ce niveau.
• Prochaine hebdo 2OCT26 : OI déjà ≈ 25 835 BTC (≈ 6× plus large), skew put-heavy (put/call ≈ 1,22), max pain approx. ≈ 83 000 $ (≈ +1,6 % sous le spot).
Interprétation (pas un conseil) : tant que le short-dated tient le prix près de 84,5k, le pin masque le vrai déséquilibre. Une fois 27SEP réglé, le livre liquide suivant est déjà biasé puts avec une douleur max plus basse. Les flux de hedging dealers peuvent alors réancrer la zone utile autour de ~83k, sauf si le spot casse franchement au-dessus des gros strikes calls (88k sur 2OCT).
Scénarios :
1) Spot tient 84k–84,5k après settlement → digestion calme, le skew 2OCT reste un frein plus qu’un aimant immédiat
2) Pullback vers 83–83,5k → alignement avec le max pain 2OCT et les gros puts (78k–82k)
3) Break net au-dessus de 85–86k → le biais put-heavy se fait mal et force un rattrapage de hedges
Tu regardes plutôt le pin jusqu’à 08:00 UTC, ou déjà le livre 2OCT ?
$BTC $ETH
#Bitcoin #Options #Crypto
168

·
--
Baissier
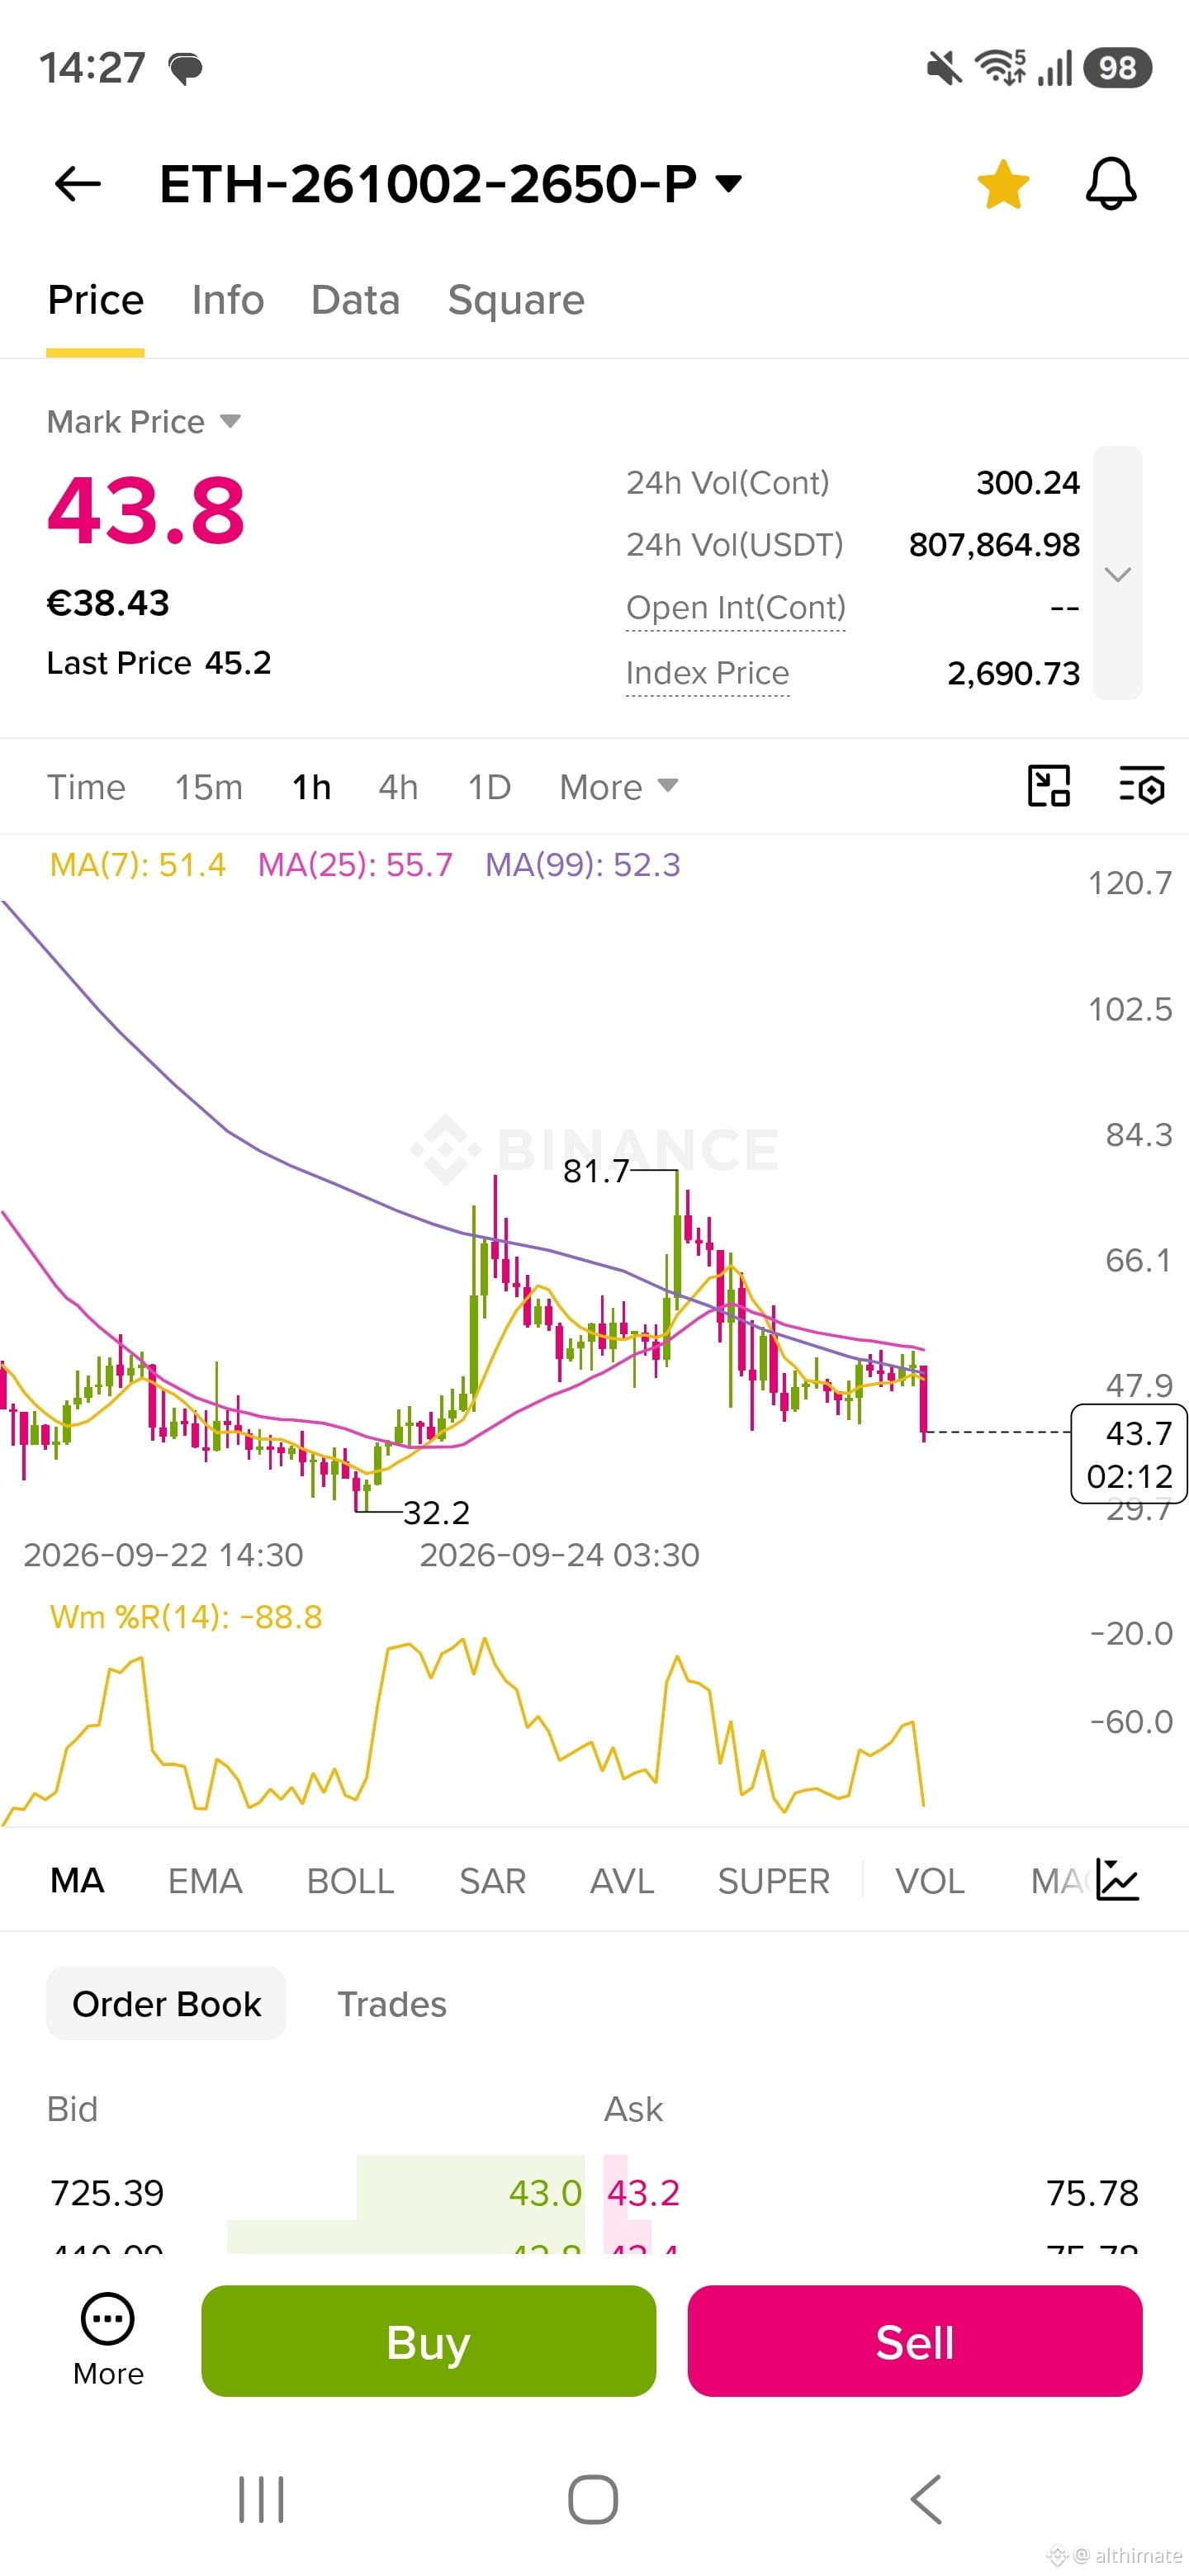
🚀 ETH 26.10.02 $2,650 PUT OPTION
🟢 Buy Zone: 35 – 40
🛑 Stop-Loss: 10
🎯 Targets:
T1: 75
T2: 100
T3: 150
the cmp is 43 #options $ETH
🚀 ETH 26.10.02 $2,650 PUT OPTION
🟢 Buy Zone: 35 – 40
🛑 Stop-Loss: 10
🎯 Targets:
T1: 75
T2: 100
T3: 150
the cmp is 43 #options $ETH
🟢 Buy Zone: 35 – 40
🛑 Stop-Loss: 10
🎯 Targets:
T1: 75
T2: 100
T3: 150
the cmp is 43 #options $ETH
1
70
·
--
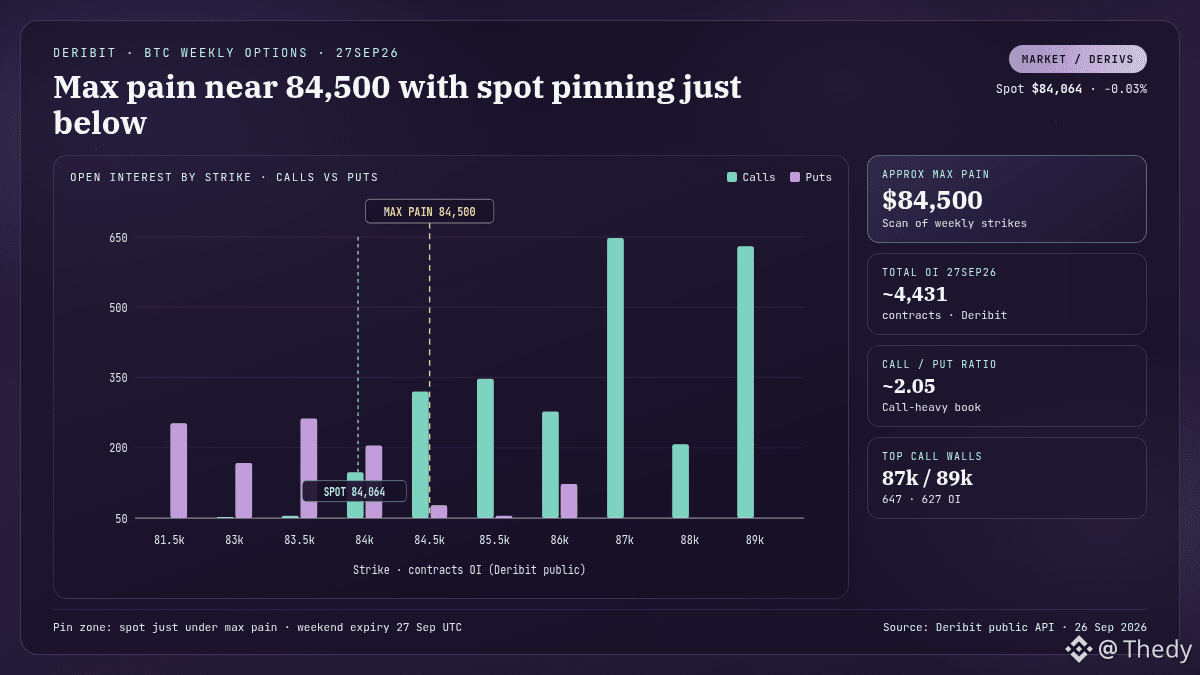
Demain, expiry options hebdo $BTC sur Deribit (27SEP26). Le spot pinne juste sous le max pain.
Faits (API publique Deribit, lecture du 26/09) :
• OI total sur 27SEP26 ≈ 4 431 contrats
• Max pain approx. ≈ 84 500 $ (scan des strikes)
• Skew call-heavy : ratio call/put ≈ 2,05 ; murs visibles à 87k (647 OI) et 89k (627)
• Spot Kraken ≈ 84 064 $ (−0,03%) ; funding OKX BTC ≈ −0,0025% (calme)
• Liquidations 24h CoinGlass ≈ 93 M$ (weekend soft), loin des pics de semaine
Interprétation (pas un conseil) : en weekend d’expiry, le prix a tendance à graviter vers la zone de douleur max des writers. Ici le pin est étroit, entre ~84k et ~84,5k. Les calls au-dessus concentrent beaucoup d’OI, ce qui peut plafonner les squeezes courts si le spot ne casse pas.
Scénarios :
1) Tenir au-dessus de ~84k / flirter avec 84,5k → pin classique jusqu’à l’expiry
2) Casser sous ~83-83,5k (où les puts s’épaississent) → le pin se décale et le biais call-heavy pèse moins
Et toi, tu joues le pin vers 84,5k ou une cassure sous 83,5k avant l’expiry ?
$BTC $ETH
#Bitcoin #Options #Crypto
Demain, expiry options hebdo $BTC sur Deribit (27SEP26). Le spot pinne juste sous le max pain.
Faits (API publique Deribit, lecture du 26/09) :
• OI total sur 27SEP26 ≈ 4 431 contrats
• Max pain approx. ≈ 84 500 $ (scan des strikes)
• Skew call-heavy : ratio call/put ≈ 2,05 ; murs visibles à 87k (647 OI) et 89k (627)
• Spot Kraken ≈ 84 064 $ (−0,03%) ; funding OKX BTC ≈ −0,0025% (calme)
• Liquidations 24h CoinGlass ≈ 93 M$ (weekend soft), loin des pics de semaine
Interprétation (pas un conseil) : en weekend d’expiry, le prix a tendance à graviter vers la zone de douleur max des writers. Ici le pin est étroit, entre ~84k et ~84,5k. Les calls au-dessus concentrent beaucoup d’OI, ce qui peut plafonner les squeezes courts si le spot ne casse pas.
Scénarios :
1) Tenir au-dessus de ~84k / flirter avec 84,5k → pin classique jusqu’à l’expiry
2) Casser sous ~83-83,5k (où les puts s’épaississent) → le pin se décale et le biais call-heavy pèse moins
Et toi, tu joues le pin vers 84,5k ou une cassure sous 83,5k avant l’expiry ?
$BTC $ETH
#Bitcoin #Options #Crypto
Faits (API publique Deribit, lecture du 26/09) :
• OI total sur 27SEP26 ≈ 4 431 contrats
• Max pain approx. ≈ 84 500 $ (scan des strikes)
• Skew call-heavy : ratio call/put ≈ 2,05 ; murs visibles à 87k (647 OI) et 89k (627)
• Spot Kraken ≈ 84 064 $ (−0,03%) ; funding OKX BTC ≈ −0,0025% (calme)
• Liquidations 24h CoinGlass ≈ 93 M$ (weekend soft), loin des pics de semaine
Interprétation (pas un conseil) : en weekend d’expiry, le prix a tendance à graviter vers la zone de douleur max des writers. Ici le pin est étroit, entre ~84k et ~84,5k. Les calls au-dessus concentrent beaucoup d’OI, ce qui peut plafonner les squeezes courts si le spot ne casse pas.
Scénarios :
1) Tenir au-dessus de ~84k / flirter avec 84,5k → pin classique jusqu’à l’expiry
2) Casser sous ~83-83,5k (où les puts s’épaississent) → le pin se décale et le biais call-heavy pèse moins
Et toi, tu joues le pin vers 84,5k ou une cassure sous 83,5k avant l’expiry ?
$BTC $ETH
#Bitcoin #Options #Crypto
55
·
--
If you are panic-selling every time derivatives data looks scary, stop now.
Most retail investors get chopped up and dump their bags right before major market rebounds because they misread open interest. They see massive numbers, expect an immediate crash, and end up selling at the exact local bottom.
This Friday brings a massive 18 billion dollar options expiry across major exchanges. Bearish traders are screaming that $BTC is bound to drop 10k to hit max pain levels. The sheer scale of expiring contracts makes people nervous, and when fear takes over, panic selling usually follows.
However, historical expiry events tell a completely different story. Max pain levels rarely trigger a straight plunge, especially with strong spot demand absorbing sell pressure while institutions hedge through $ETH contracts. The market has already absorbed most of this hedging volatility over the past two weeks, making a sharp post-settlement rebound far more likely than a collapse.
Do you think Friday triggers a real dump, or is the market setting up to squeeze the bears?
#Bitcoin #CryptoTrading #Options
If you are panic-selling every time derivatives data looks scary, stop now.
Most retail investors get chopped up and dump their bags right before major market rebounds because they misread open interest. They see massive numbers, expect an immediate crash, and end up selling at the exact local bottom.
This Friday brings a massive 18 billion dollar options expiry across major exchanges. Bearish traders are screaming that $BTC is bound to drop 10k to hit max pain levels. The sheer scale of expiring contracts makes people nervous, and when fear takes over, panic selling usually follows.
However, historical expiry events tell a completely different story. Max pain levels rarely trigger a straight plunge, especially with strong spot demand absorbing sell pressure while institutions hedge through $ETH contracts. The market has already absorbed most of this hedging volatility over the past two weeks, making a sharp post-settlement rebound far more likely than a collapse.
Do you think Friday triggers a real dump, or is the market setting up to squeeze the bears?
#Bitcoin #CryptoTrading #Options
Most retail investors get chopped up and dump their bags right before major market rebounds because they misread open interest. They see massive numbers, expect an immediate crash, and end up selling at the exact local bottom.
This Friday brings a massive 18 billion dollar options expiry across major exchanges. Bearish traders are screaming that $BTC is bound to drop 10k to hit max pain levels. The sheer scale of expiring contracts makes people nervous, and when fear takes over, panic selling usually follows.
However, historical expiry events tell a completely different story. Max pain levels rarely trigger a straight plunge, especially with strong spot demand absorbing sell pressure while institutions hedge through $ETH contracts. The market has already absorbed most of this hedging volatility over the past two weeks, making a sharp post-settlement rebound far more likely than a collapse.
Do you think Friday triggers a real dump, or is the market setting up to squeeze the bears?
#Bitcoin #CryptoTrading #Options
29

·
--
⏳ 15,6 tỷ USD quyền chọn đáo hạn, $BTC chững lại
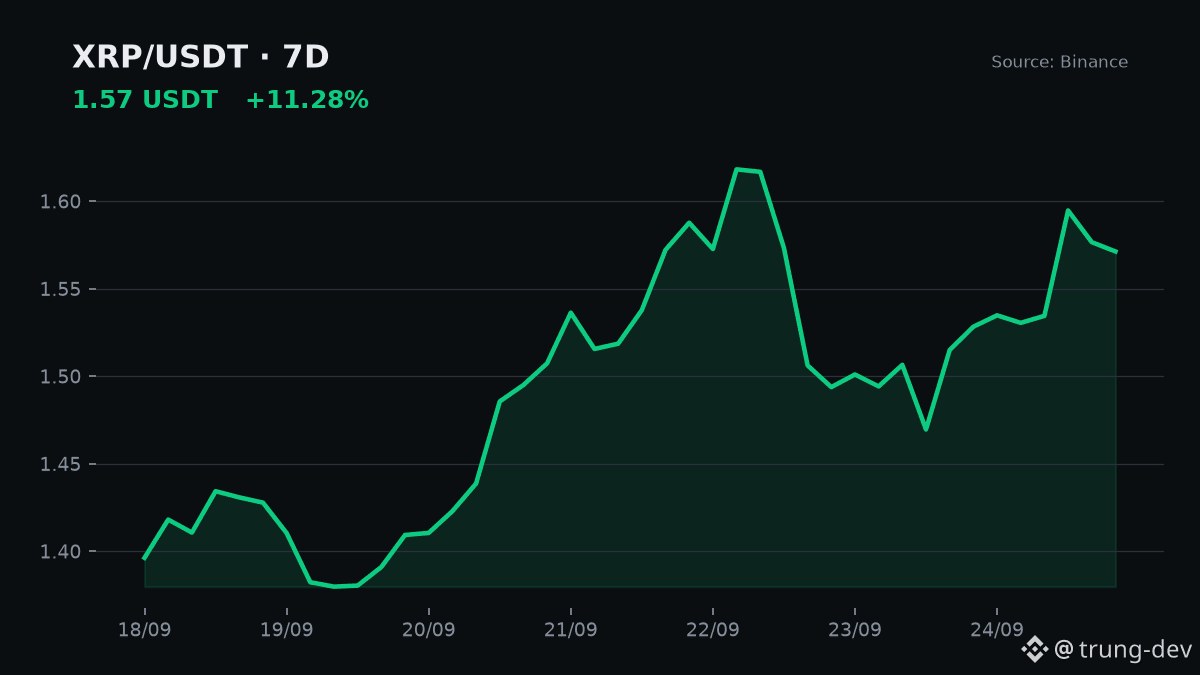
Theo Decrypt, đà tăng của $BTC chậm lại đúng lúc khoảng 15,6 tỷ USD hợp đồng quyền chọn đáo hạn. Trên Binance, $BTC đang ở quanh 83.922 USDT, giảm 0,89% trong 24 giờ. Ngược lại, $XRP tăng 2,81% lên 1,5713 USDT và $SOL tăng 3,42% lên 121,45 USDT.
Vì sao trader nên để ý? Những phiên đáo hạn lớn thường khiến giá dao động giật cục quanh các mức strike có nhiều hợp đồng mở. Một nhịp chững lại trong ngày đáo hạn chưa đủ để kết luận xu hướng đã đảo chiều. Thường phải chờ vài phiên sau, khi vị thế phòng hộ được gỡ ra, giá mới cho thấy hướng đi thật.
Điểm đáng chú ý là dòng tiền đang xoay sang altcoin. $XRP đã tăng 11,28% trong 7 ngày, dao động trong vùng 1,368 đến 1,6581 USDT. Chỉ số Fear & Greed ở mức 71, vùng Greed (alternative.me). Khi tâm lý đã nghiêng về tham lam, rủi ro đuổi theo cây nến xanh cũng lớn hơn.
Bài học của tôi: ngày đáo hạn quyền chọn là ngày nên giảm đòn bẩy và quan sát nhiều hơn hành động. Biến động lúc này phần nhiều đến từ vị thế phái sinh, không hẳn từ nhu cầu thật.
Nguồn: Decrypt
Bạn xem nhịp chững này của $BTC là nghỉ ngơi hay dấu hiệu đảo chiều? 🤔
#Bitcoin #Options #Altcoin
⏳ 15,6 tỷ USD quyền chọn đáo hạn, $BTC chững lại
Theo Decrypt, đà tăng của $BTC chậm lại đúng lúc khoảng 15,6 tỷ USD hợp đồng quyền chọn đáo hạn. Trên Binance, $BTC đang ở quanh 83.922 USDT, giảm 0,89% trong 24 giờ. Ngược lại, $XRP tăng 2,81% lên 1,5713 USDT và $SOL tăng 3,42% lên 121,45 USDT.
Vì sao trader nên để ý? Những phiên đáo hạn lớn thường khiến giá dao động giật cục quanh các mức strike có nhiều hợp đồng mở. Một nhịp chững lại trong ngày đáo hạn chưa đủ để kết luận xu hướng đã đảo chiều. Thường phải chờ vài phiên sau, khi vị thế phòng hộ được gỡ ra, giá mới cho thấy hướng đi thật.
Điểm đáng chú ý là dòng tiền đang xoay sang altcoin. $XRP đã tăng 11,28% trong 7 ngày, dao động trong vùng 1,368 đến 1,6581 USDT. Chỉ số Fear & Greed ở mức 71, vùng Greed (alternative.me). Khi tâm lý đã nghiêng về tham lam, rủi ro đuổi theo cây nến xanh cũng lớn hơn.
Bài học của tôi: ngày đáo hạn quyền chọn là ngày nên giảm đòn bẩy và quan sát nhiều hơn hành động. Biến động lúc này phần nhiều đến từ vị thế phái sinh, không hẳn từ nhu cầu thật.
Nguồn: Decrypt
Bạn xem nhịp chững này của $BTC là nghỉ ngơi hay dấu hiệu đảo chiều? 🤔
#Bitcoin #Options #Altcoin
Theo Decrypt, đà tăng của $BTC chậm lại đúng lúc khoảng 15,6 tỷ USD hợp đồng quyền chọn đáo hạn. Trên Binance, $BTC đang ở quanh 83.922 USDT, giảm 0,89% trong 24 giờ. Ngược lại, $XRP tăng 2,81% lên 1,5713 USDT và $SOL tăng 3,42% lên 121,45 USDT.
Vì sao trader nên để ý? Những phiên đáo hạn lớn thường khiến giá dao động giật cục quanh các mức strike có nhiều hợp đồng mở. Một nhịp chững lại trong ngày đáo hạn chưa đủ để kết luận xu hướng đã đảo chiều. Thường phải chờ vài phiên sau, khi vị thế phòng hộ được gỡ ra, giá mới cho thấy hướng đi thật.
Điểm đáng chú ý là dòng tiền đang xoay sang altcoin. $XRP đã tăng 11,28% trong 7 ngày, dao động trong vùng 1,368 đến 1,6581 USDT. Chỉ số Fear & Greed ở mức 71, vùng Greed (alternative.me). Khi tâm lý đã nghiêng về tham lam, rủi ro đuổi theo cây nến xanh cũng lớn hơn.
Bài học của tôi: ngày đáo hạn quyền chọn là ngày nên giảm đòn bẩy và quan sát nhiều hơn hành động. Biến động lúc này phần nhiều đến từ vị thế phái sinh, không hẳn từ nhu cầu thật.
Nguồn: Decrypt
Bạn xem nhịp chững này của $BTC là nghỉ ngơi hay dấu hiệu đảo chiều? 🤔
#Bitcoin #Options #Altcoin
459


·
--
one thing i wish i understood earlier about options is that they’re not just about guessing whether price goes up or down.
there are a few things that actually shape the trade:
the strike price.
the expiry.
the premium.
those details matter because an option isn’t simply “buy and wait.”
there’s a defined setup and a defined outcome.
learning these basics has honestly made options feel less complicated to me.
and now when i look at protocols like Ithaca, i’m not just seeing “another DeFi product.”
i’m starting to understand the financial mechanics behind what’s being built.
still learning, one concept at a time.
#Ithaca #defi #options #Web3
one thing i wish i understood earlier about options is that they’re not just about guessing whether price goes up or down.
there are a few things that actually shape the trade:
the strike price.
the expiry.
the premium.
those details matter because an option isn’t simply “buy and wait.”
there’s a defined setup and a defined outcome.
learning these basics has honestly made options feel less complicated to me.
and now when i look at protocols like Ithaca, i’m not just seeing “another DeFi product.”
i’m starting to understand the financial mechanics behind what’s being built.
still learning, one concept at a time.
#Ithaca #defi #options #Web3
there are a few things that actually shape the trade:
the strike price.
the expiry.
the premium.
those details matter because an option isn’t simply “buy and wait.”
there’s a defined setup and a defined outcome.
learning these basics has honestly made options feel less complicated to me.
and now when i look at protocols like Ithaca, i’m not just seeing “another DeFi product.”
i’m starting to understand the financial mechanics behind what’s being built.
still learning, one concept at a time.
#Ithaca #defi #options #Web3

83

·
--
🚨 $BTC HAS A BIG DATE AHEAD AND IT’S NOT JUST ANOTHER PRICE LEVEL
Bitcoin is holding around the $86K area while traders head into Friday’s quarterly options expiry.
Coinbase Markets puts the BTC + ETH options notional scheduled for Sept. 25 at roughly $18.1B.
Here’s the part I’m watching:
BTC options have a 0.66 open-interest put/call ratio, while recent 24-hour volume is even more call-heavy at 0.37.
Call open interest is concentrated around $90K and $100K.
But don’t confuse positioning with a prediction.
Large call interest does NOT mean BTC has to reach those strikes.
It simply means the expiry could become an important volatility and hedging event as traders adjust positions.
📊 MY WATCH ZONES
🟢 $85K → first area I want bulls to defend
🟡 $86K–$87K → current decision zone
🔴 $90K → major options-interest area
The setup is straightforward:
Hold the recent breakout structure → momentum stays constructive.
Lose the $85K area → the market may need to reset before another attempt higher.
Friday’s expiry is the catalyst.
Price action decides the reaction.
Are you watching the $90K calls or the $85K level underneath spot? 👀
Follow QuantVanta for daily crypto market intelligence.
$BTC
{future}(BTCUSDT)
#bitcoin #BTC #crypto #options #CryptoMarketAlert
🚨 $BTC HAS A BIG DATE AHEAD AND IT’S NOT JUST ANOTHER PRICE LEVEL
Bitcoin is holding around the $86K area while traders head into Friday’s quarterly options expiry.
Coinbase Markets puts the BTC + ETH options notional scheduled for Sept. 25 at roughly $18.1B.
Here’s the part I’m watching:
BTC options have a 0.66 open-interest put/call ratio, while recent 24-hour volume is even more call-heavy at 0.37.
Call open interest is concentrated around $90K and $100K.
But don’t confuse positioning with a prediction.
Large call interest does NOT mean BTC has to reach those strikes.
It simply means the expiry could become an important volatility and hedging event as traders adjust positions.
📊 MY WATCH ZONES
🟢 $85K → first area I want bulls to defend
🟡 $86K–$87K → current decision zone
🔴 $90K → major options-interest area
The setup is straightforward:
Hold the recent breakout structure → momentum stays constructive.
Lose the $85K area → the market may need to reset before another attempt higher.
Friday’s expiry is the catalyst.
Price action decides the reaction.
Are you watching the $90K calls or the $85K level underneath spot? 👀
Follow QuantVanta for daily crypto market intelligence.
$BTC
#bitcoin #BTC #crypto #options #CryptoMarketAlert
Bitcoin is holding around the $86K area while traders head into Friday’s quarterly options expiry.
Coinbase Markets puts the BTC + ETH options notional scheduled for Sept. 25 at roughly $18.1B.
Here’s the part I’m watching:
BTC options have a 0.66 open-interest put/call ratio, while recent 24-hour volume is even more call-heavy at 0.37.
Call open interest is concentrated around $90K and $100K.
But don’t confuse positioning with a prediction.
Large call interest does NOT mean BTC has to reach those strikes.
It simply means the expiry could become an important volatility and hedging event as traders adjust positions.
📊 MY WATCH ZONES
🟢 $85K → first area I want bulls to defend
🟡 $86K–$87K → current decision zone
🔴 $90K → major options-interest area
The setup is straightforward:
Hold the recent breakout structure → momentum stays constructive.
Lose the $85K area → the market may need to reset before another attempt higher.
Friday’s expiry is the catalyst.
Price action decides the reaction.
Are you watching the $90K calls or the $85K level underneath spot? 👀
Follow QuantVanta for daily crypto market intelligence.
$BTC
#bitcoin #BTC #crypto #options #CryptoMarketAlert

62

A hefty $3.2M options trade just targeted a bold $95K Bitcoin price by the end of October. Using a butterfly spread shows the trader expects a specific, controlled rally rather than wild volatility. While daring, it highlights growing institutional confidence in Q4 momentum. Are whales positioning for an early autumn breakout, or is this just an expensive gamble? Keep a close eye on the order books as September wraps up. $BTC #Bitcoin #CryptoTrading #Options
A hefty $3.2M options trade just targeted a bold $95K Bitcoin price by the end of October. Using a butterfly spread shows the trader expects a specific, controlled rally rather than wild volatility. While daring, it highlights growing institutional confidence in Q4 momentum. Are whales positioning for an early autumn breakout, or is this just an expensive gamble? Keep a close eye on the order books as September wraps up. $BTC #Bitcoin #CryptoTrading #Options
15

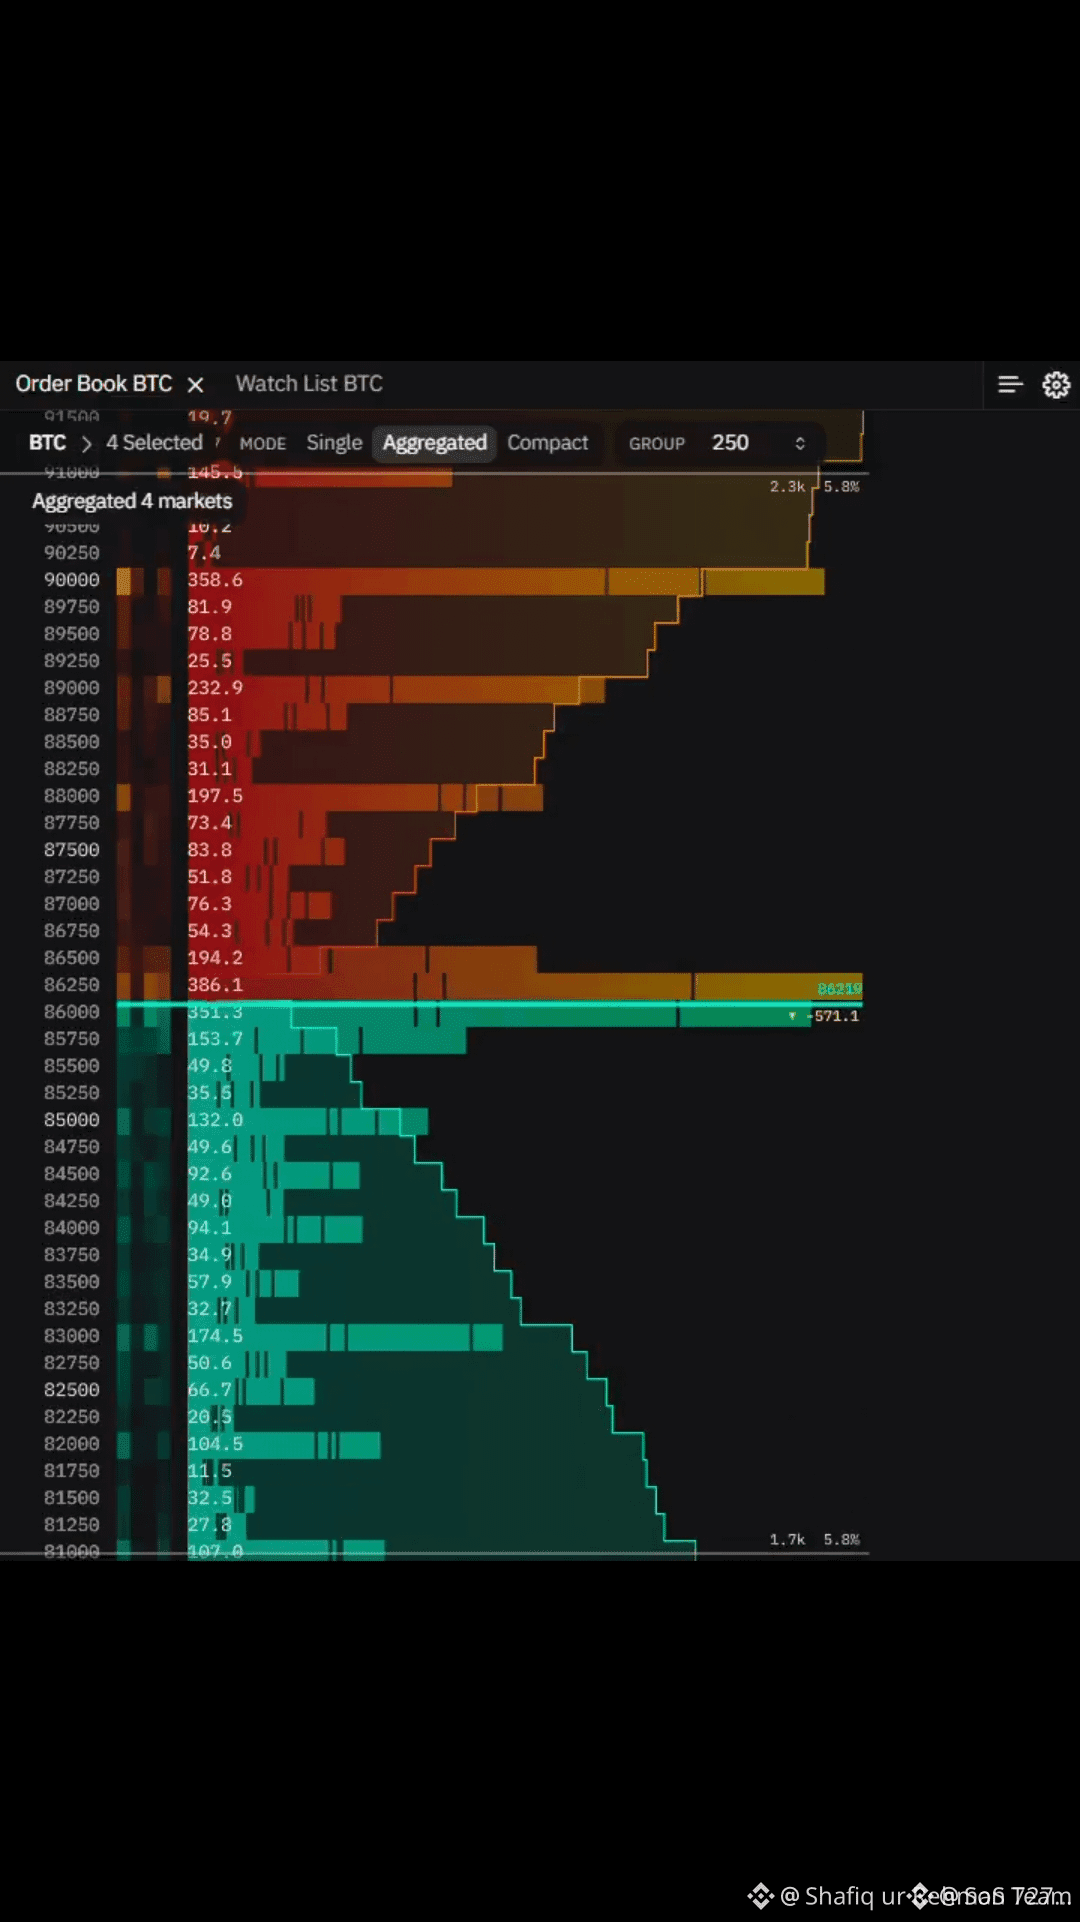
Why is Bitcoin rising? The answer is in the options market.Why is Bitcoin rising? The answer is in the options market.
In my last analysis, I said there'd be no resistance up to 85k if 82k was broken.
82k was broken, and the price climbed all the way to 85,300 dollars.
Bitcoin is now at 85,000 dollars, right at the 85k wall.
There were no chasers for the rise, but the price jumped 3,000 dollars.
Why?
The options market paved the way, and the shorts opened below 82k provided the speed.
Why is the price stuck between 84 and 85? That's also written on the same chart.
Now, look at who's driving the rise.
82k couldn't be broken over the weekend, but it was broken this morning.
Liquidated shorts have exceeded 500 million dollars.
Small accounts had opened shorts against the rise, and the rally forced those shorts to close.
Most of this rise came from those closed shorts.
Today's chart has changed.
Up top: 85,000 dollars.
Every 1% rise brings 122 million dollars in sells, around 1,450 Bitcoin.
In the previous chart, this seller was second with 100 million; when price arrived, it became first.
The price turned back from here.
Down below: 84,000 dollars.
Every 1% drop brings about 120 million dollars in buys, around 1,420 Bitcoin.
There was a seller here this morning.
Once price broke through, the level flipped to the buy side, and buys nearly doubled.
The two walls are almost the same size.
Seller up top, buyer down below.
That's why price is stuck between 84 and 85.
The distance between them is 1,000 dollars.
Behind 84, there's 67 million in buys at 83, and 78 million at 82.
82k was a 135 million sell wall in the previous chart; that flipped to the buy side too.
The real base is at 80k.
Every drop above 80 is met with buys.
Below 80, those buys aren't there; nothing to slow the drop.
Net dealer position is plus 710 million dollars, previously 634 million.
Dealers are softening every move.
Look above 85.
At 86, sells drop to 51 million, less than half of the sells at 85.
At 88, there's a 73 million seller; at 90, 61 million.
87 and 89 are nearly empty.
No big sellers above 90.
So the threshold is still 85.
September 25 is Friday's expiration day.
Over 16 billion dollars in contracts expire that day.
This expiration's biggest contracts are at 85k and 90k levels.
On Friday, both the walls and the base thin out.
So what could happen now?
If 85 is broken, the first seller halves.
Small accounts are still short; closed shorts will accelerate the move.
Up above, there are two levels: 88 and 90.
If price drops, the first buy is at 84, with 83 and 82 behind it.
If 82 breaks, the next level is 80.
Just like 85 if broken like 82, the next wall is 88.
This analysis is my opinion, not investment advice.
Data changes in real time. I'll keep updating.
#Bitcoin #BTC #Options
Why is Bitcoin rising? The answer is in the options market.
Why is Bitcoin rising? The answer is in the options market.
In my last analysis, I said there'd be no resistance up to 85k if 82k was broken.
82k was broken, and the price climbed all the way to 85,300 dollars.
Bitcoin is now at 85,000 dollars, right at the 85k wall.
There were no chasers for the rise, but the price jumped 3,000 dollars.
Why?
The options market paved the way, and the shorts opened below 82k provided the speed.
Why is the price stuck between 84 and 85? That's also written on the same chart.
Now, look at who's driving the rise.
82k couldn't be broken over the weekend, but it was broken this morning.
Liquidated shorts have exceeded 500 million dollars.
Small accounts had opened shorts against the rise, and the rally forced those shorts to close.
Most of this rise came from those closed shorts.
Today's chart has changed.
Up top: 85,000 dollars.
Every 1% rise brings 122 million dollars in sells, around 1,450 Bitcoin.
In the previous chart, this seller was second with 100 million; when price arrived, it became first.
The price turned back from here.
Down below: 84,000 dollars.
Every 1% drop brings about 120 million dollars in buys, around 1,420 Bitcoin.
There was a seller here this morning.
Once price broke through, the level flipped to the buy side, and buys nearly doubled.
The two walls are almost the same size.
Seller up top, buyer down below.
That's why price is stuck between 84 and 85.
The distance between them is 1,000 dollars.
Behind 84, there's 67 million in buys at 83, and 78 million at 82.
82k was a 135 million sell wall in the previous chart; that flipped to the buy side too.
The real base is at 80k.
Every drop above 80 is met with buys.
Below 80, those buys aren't there; nothing to slow the drop.
Net dealer position is plus 710 million dollars, previously 634 million.
Dealers are softening every move.
Look above 85.
At 86, sells drop to 51 million, less than half of the sells at 85.
At 88, there's a 73 million seller; at 90, 61 million.
87 and 89 are nearly empty.
No big sellers above 90.
So the threshold is still 85.
September 25 is Friday's expiration day.
Over 16 billion dollars in contracts expire that day.
This expiration's biggest contracts are at 85k and 90k levels.
On Friday, both the walls and the base thin out.
So what could happen now?
If 85 is broken, the first seller halves.
Small accounts are still short; closed shorts will accelerate the move.
Up above, there are two levels: 88 and 90.
If price drops, the first buy is at 84, with 83 and 82 behind it.
If 82 breaks, the next level is 80.
Just like 85 if broken like 82, the next wall is 88.
This analysis is my opinion, not investment advice.
Data changes in real time. I'll keep updating.
#Bitcoin #BTC #Options
In my last analysis, I said there'd be no resistance up to 85k if 82k was broken.
82k was broken, and the price climbed all the way to 85,300 dollars.
Bitcoin is now at 85,000 dollars, right at the 85k wall.
There were no chasers for the rise, but the price jumped 3,000 dollars.
Why?
The options market paved the way, and the shorts opened below 82k provided the speed.
Why is the price stuck between 84 and 85? That's also written on the same chart.
Now, look at who's driving the rise.
82k couldn't be broken over the weekend, but it was broken this morning.
Liquidated shorts have exceeded 500 million dollars.
Small accounts had opened shorts against the rise, and the rally forced those shorts to close.
Most of this rise came from those closed shorts.
Today's chart has changed.
Up top: 85,000 dollars.
Every 1% rise brings 122 million dollars in sells, around 1,450 Bitcoin.
In the previous chart, this seller was second with 100 million; when price arrived, it became first.
The price turned back from here.
Down below: 84,000 dollars.
Every 1% drop brings about 120 million dollars in buys, around 1,420 Bitcoin.
There was a seller here this morning.
Once price broke through, the level flipped to the buy side, and buys nearly doubled.
The two walls are almost the same size.
Seller up top, buyer down below.
That's why price is stuck between 84 and 85.
The distance between them is 1,000 dollars.
Behind 84, there's 67 million in buys at 83, and 78 million at 82.
82k was a 135 million sell wall in the previous chart; that flipped to the buy side too.
The real base is at 80k.
Every drop above 80 is met with buys.
Below 80, those buys aren't there; nothing to slow the drop.
Net dealer position is plus 710 million dollars, previously 634 million.
Dealers are softening every move.
Look above 85.
At 86, sells drop to 51 million, less than half of the sells at 85.
At 88, there's a 73 million seller; at 90, 61 million.
87 and 89 are nearly empty.
No big sellers above 90.
So the threshold is still 85.
September 25 is Friday's expiration day.
Over 16 billion dollars in contracts expire that day.
This expiration's biggest contracts are at 85k and 90k levels.
On Friday, both the walls and the base thin out.
So what could happen now?
If 85 is broken, the first seller halves.
Small accounts are still short; closed shorts will accelerate the move.
Up above, there are two levels: 88 and 90.
If price drops, the first buy is at 84, with 83 and 82 behind it.
If 82 breaks, the next level is 80.
Just like 85 if broken like 82, the next wall is 88.
This analysis is my opinion, not investment advice.
Data changes in real time. I'll keep updating.
#Bitcoin #BTC #Options
26
·
--
One thing i’ve realized while learning about options is that the hardest part isn’t always the product itself.
sometimes, it’s understanding why you would use it.
an option can give you another way to approach a market without simply buying or selling the underlying asset.
that changes the way you think about a position.
instead of only asking:
“where is price going?”
you start asking:
“what outcome am i preparing for?”
that shift in thinking is what makes options interesting to me.
and seeing that kind of financial primitive being built onchain through Ithaca makes the rabbit hole even deeper.
i’m still learning, but i like when a protocol makes me rethink how i understand a familiar financial product.
#Ithaca #defi #options #Web3
One thing i’ve realized while learning about options is that the hardest part isn’t always the product itself.
sometimes, it’s understanding why you would use it.
an option can give you another way to approach a market without simply buying or selling the underlying asset.
that changes the way you think about a position.
instead of only asking:
“where is price going?”
you start asking:
“what outcome am i preparing for?”
that shift in thinking is what makes options interesting to me.
and seeing that kind of financial primitive being built onchain through Ithaca makes the rabbit hole even deeper.
i’m still learning, but i like when a protocol makes me rethink how i understand a familiar financial product.
#Ithaca #defi #options #Web3
sometimes, it’s understanding why you would use it.
an option can give you another way to approach a market without simply buying or selling the underlying asset.
that changes the way you think about a position.
instead of only asking:
“where is price going?”
you start asking:
“what outcome am i preparing for?”
that shift in thinking is what makes options interesting to me.
and seeing that kind of financial primitive being built onchain through Ithaca makes the rabbit hole even deeper.
i’m still learning, but i like when a protocol makes me rethink how i understand a familiar financial product.
#Ithaca #defi #options #Web3

62

·
--
🚨 SMART MONEY LOCKS IN $BTC RANGE BOUNDS WHILE BUILDING MULTI-MILLION SHORT HEDGE 🦈
Institutional order flow reveals high-conviction delta hedging as top-tier smart money plays the $70,000 to $95,000 range parameters for September. 📊 By stacking high-probability options betting against extreme volatility spikes while scaling perpetual short exposure to $26M, this participant creates a tight structural fence.
🔍 Historical execution data shows a 90% win-rate methodology leveraging structural compression rather than chasing directional momentum. 💡 While holding underwater paper shorts, the overarching strategy extracts premium from high-odds range limits, reinforcing an institutional bias toward macro consolidation before the next major expansion phase.
💬 Do you see $BTC respecting this $70K-$95K range through month-end, or will structural liquidity force a breakout? 👇
⚠️ Not financial advice. Always manage your risk. 🛡️
🏷️ #BTC #Options #SmartMoney #MarketStructure
🎯 🦈
🚨 SMART MONEY LOCKS IN $BTC RANGE BOUNDS WHILE BUILDING MULTI-MILLION SHORT HEDGE 🦈
Institutional order flow reveals high-conviction delta hedging as top-tier smart money plays the $70,000 to $95,000 range parameters for September. 📊 By stacking high-probability options betting against extreme volatility spikes while scaling perpetual short exposure to $26M, this participant creates a tight structural fence.
🔍 Historical execution data shows a 90% win-rate methodology leveraging structural compression rather than chasing directional momentum. 💡 While holding underwater paper shorts, the overarching strategy extracts premium from high-odds range limits, reinforcing an institutional bias toward macro consolidation before the next major expansion phase.
💬 Do you see $BTC respecting this $70K-$95K range through month-end, or will structural liquidity force a breakout? 👇
⚠️ Not financial advice. Always manage your risk. 🛡️
🏷️ #BTC #Options #SmartMoney #MarketStructure
🎯 🦈
Institutional order flow reveals high-conviction delta hedging as top-tier smart money plays the $70,000 to $95,000 range parameters for September. 📊 By stacking high-probability options betting against extreme volatility spikes while scaling perpetual short exposure to $26M, this participant creates a tight structural fence.
🔍 Historical execution data shows a 90% win-rate methodology leveraging structural compression rather than chasing directional momentum. 💡 While holding underwater paper shorts, the overarching strategy extracts premium from high-odds range limits, reinforcing an institutional bias toward macro consolidation before the next major expansion phase.
💬 Do you see $BTC respecting this $70K-$95K range through month-end, or will structural liquidity force a breakout? 👇
⚠️ Not financial advice. Always manage your risk. 🛡️
🏷️ #BTC #Options #SmartMoney #MarketStructure
🎯 🦈
24
·
--
for me, one of the interesting things about options is that you don’t always have to be right about the exact price.
sometimes the bigger question is:
what happens if the market moves the other way?
that’s where options start to make more sense to me.
instead of only thinking:
“price goes up, i win.”
you can start thinking about different scenarios and how you want to position around them.
that flexibility is a big reason i’ve been digging deeper into what Ithaca is building.
options onchain, with self-custody and composability at the core.
still learning the mechanics, but the idea itself is becoming clearer to me.
#Ithaca #defi #options #Web3
for me, one of the interesting things about options is that you don’t always have to be right about the exact price.
sometimes the bigger question is:
what happens if the market moves the other way?
that’s where options start to make more sense to me.
instead of only thinking:
“price goes up, i win.”
you can start thinking about different scenarios and how you want to position around them.
that flexibility is a big reason i’ve been digging deeper into what Ithaca is building.
options onchain, with self-custody and composability at the core.
still learning the mechanics, but the idea itself is becoming clearer to me.
#Ithaca #defi #options #Web3
sometimes the bigger question is:
what happens if the market moves the other way?
that’s where options start to make more sense to me.
instead of only thinking:
“price goes up, i win.”
you can start thinking about different scenarios and how you want to position around them.
that flexibility is a big reason i’ve been digging deeper into what Ithaca is building.
options onchain, with self-custody and composability at the core.
still learning the mechanics, but the idea itself is becoming clearer to me.
#Ithaca #defi #options #Web3

65
#options
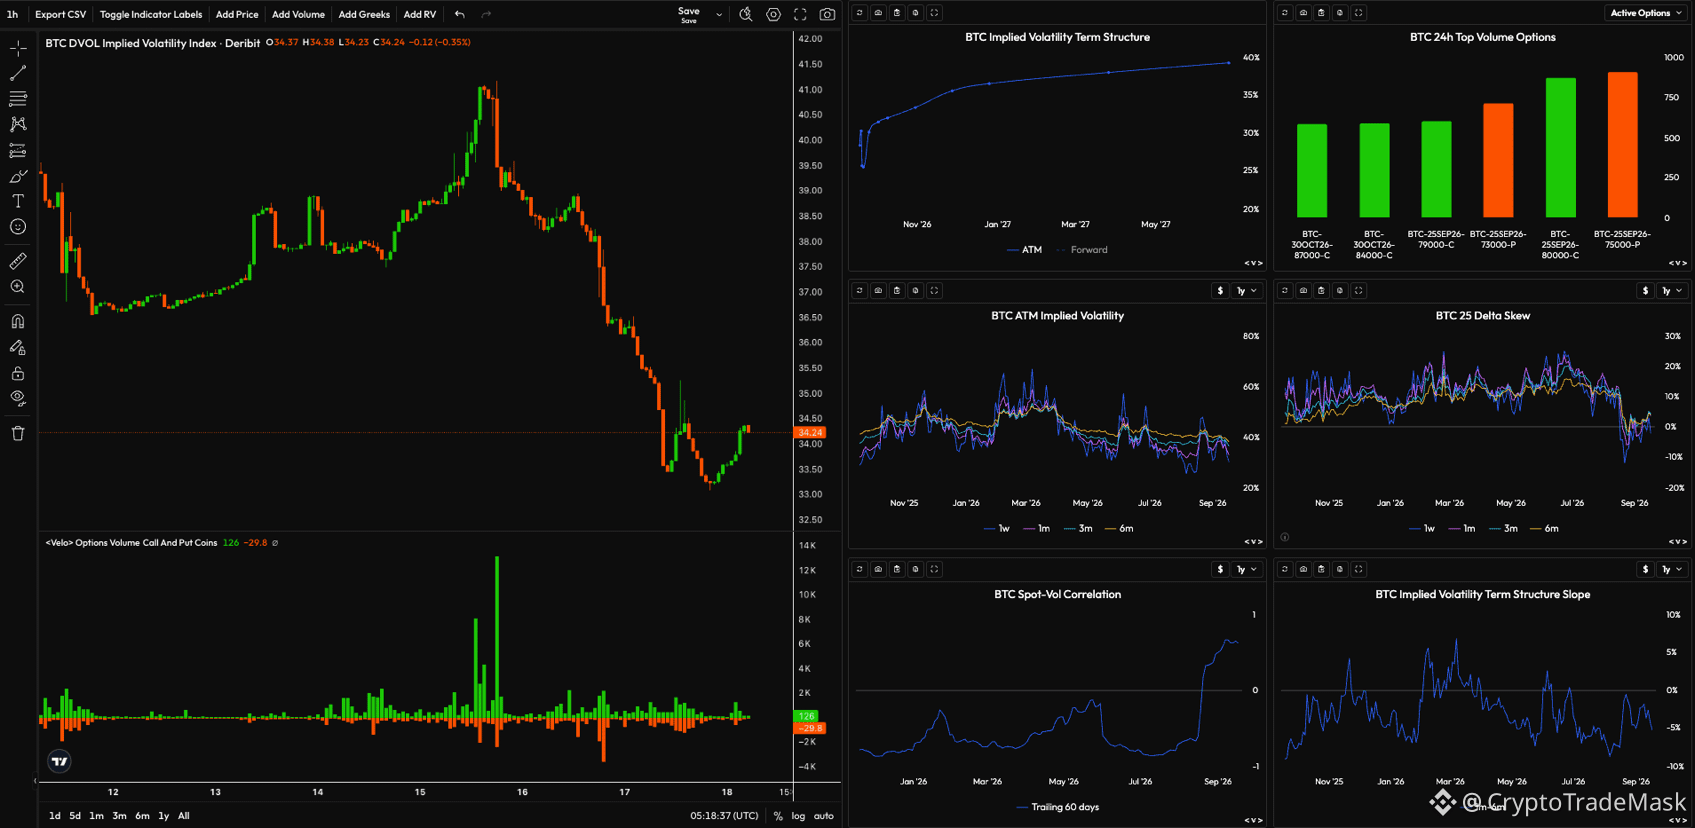
📉 What’s Happening in the $BTC Market: Volatility and Derivatives Analysis
As the Bitcoin price struggles to determine its direction, options market data (from Deribit) reveals a fascinating picture often overlooked on standard price charts.
1️⃣ Drop in DVOL (Implied Volatility Index)
The DVOL index has fallen from a local peak of ~41.5% to its current level of ~34.24%. This indicates that the market anticipates a reduction in price fluctuation amplitude in the near term. Panic or spikes driven by euphoric expectations are subsiding, and the market is entering a consolidation phase.
2️⃣ Term Structure in Contango
The volatility curve shows a healthy upward slope: short-term options exhibit lower volatility (~28%) compared to long-term ones (~40% for May 2027). This suggests an absence of immediate market stress events or shocks.
3️⃣ Behavior of Major Players (Top Volume Options)
24-hour options volume data reveals a clear focus:
Call Options: The bulk of the volume is concentrated at the $80,000 strike price.
Put Options: Active buying of downside protection (hedging) at the $75,000 level.
⚠️ Conclusion and Outlook:
A decline in DVOL typically precedes a period of sideways movement or slow, "calm" price action. However, high volume in $75k put options confirms that big capital continues to hedge its positions against a potential local sell-off.
‼️ Stay vigilant and keep an eye on the volume! 📊
{future}(BTCUSDT)
#options
📉 What’s Happening in the $BTC Market: Volatility and Derivatives Analysis
As the Bitcoin price struggles to determine its direction, options market data (from Deribit) reveals a fascinating picture often overlooked on standard price charts.
1️⃣ Drop in DVOL (Implied Volatility Index)
The DVOL index has fallen from a local peak of ~41.5% to its current level of ~34.24%. This indicates that the market anticipates a reduction in price fluctuation amplitude in the near term. Panic or spikes driven by euphoric expectations are subsiding, and the market is entering a consolidation phase.
2️⃣ Term Structure in Contango
The volatility curve shows a healthy upward slope: short-term options exhibit lower volatility (~28%) compared to long-term ones (~40% for May 2027). This suggests an absence of immediate market stress events or shocks.
3️⃣ Behavior of Major Players (Top Volume Options)
24-hour options volume data reveals a clear focus:
Call Options: The bulk of the volume is concentrated at the $80,000 strike price.
Put Options: Active buying of downside protection (hedging) at the $75,000 level.
⚠️ Conclusion and Outlook:
A decline in DVOL typically precedes a period of sideways movement or slow, "calm" price action. However, high volume in $75k put options confirms that big capital continues to hedge its positions against a potential local sell-off.
‼️ Stay vigilant and keep an eye on the volume! 📊
📉 What’s Happening in the $BTC Market: Volatility and Derivatives Analysis
As the Bitcoin price struggles to determine its direction, options market data (from Deribit) reveals a fascinating picture often overlooked on standard price charts.
1️⃣ Drop in DVOL (Implied Volatility Index)
The DVOL index has fallen from a local peak of ~41.5% to its current level of ~34.24%. This indicates that the market anticipates a reduction in price fluctuation amplitude in the near term. Panic or spikes driven by euphoric expectations are subsiding, and the market is entering a consolidation phase.
2️⃣ Term Structure in Contango
The volatility curve shows a healthy upward slope: short-term options exhibit lower volatility (~28%) compared to long-term ones (~40% for May 2027). This suggests an absence of immediate market stress events or shocks.
3️⃣ Behavior of Major Players (Top Volume Options)
24-hour options volume data reveals a clear focus:
Call Options: The bulk of the volume is concentrated at the $80,000 strike price.
Put Options: Active buying of downside protection (hedging) at the $75,000 level.
⚠️ Conclusion and Outlook:
A decline in DVOL typically precedes a period of sideways movement or slow, "calm" price action. However, high volume in $75k put options confirms that big capital continues to hedge its positions against a potential local sell-off.
‼️ Stay vigilant and keep an eye on the volume! 📊
1
1
166
Connectez-vous pour découvrir plus de contenu
Rejoignez la communauté mondiale des adeptes de cryptomonnaies sur Binance Square
⚡️ Suviez les dernières informations importantes sur les cryptomonnaies.
💬 Jugé digne de confiance par la plus grande plateforme d’échange de cryptomonnaies au monde.
👍 Découvrez les connaissances que partagent les créateurs vérifiés.
Adresse e-mail/Nº de téléphone
Sujets d’actualité
1
#EarningsSeason
89,041 vues
842 mentions
2
#ECBToTestAIAgentsInDigitalEuroPayments
504 vues
82 mentions
3
#JapanFSABacksFourthStablecoinTradeSettlementPilot
2,803 vues
189 mentions
4
#BitgetHackerFailsToMoveStolenFunds
11,106 vues
324 mentions
5
#BitMineETHHoldingsTop6Million
13,560 vues
489 mentions
6
#StrategyAdds1666BTCHoldingsReach847666
11,976 vues
336 mentions
7
#NvidiaApproves$150BBuyback
3,501 vues
61 mentions
8
#OpenAIDelaysGPT6.1OverSafetyIssues
24,723 vues
678 mentions
9
#AMDToAcquireWorldLabsFor$8.2B
1,741 vues
52 mentions
10
#AnthropicIPOProspectusCouldValueItOver$2T
5,598 vues
75 mentions