

AYAN CHINTAPATRA
11 Publicaciones

AYAN CHINTAPATRA
Denunciar
Bloquear usuario
Abrir operación
Trader frecuente
2.1 años
4 Siguiendo
26 Seguidores
27 Me gusta
Publicaciones
Cartera
·
--
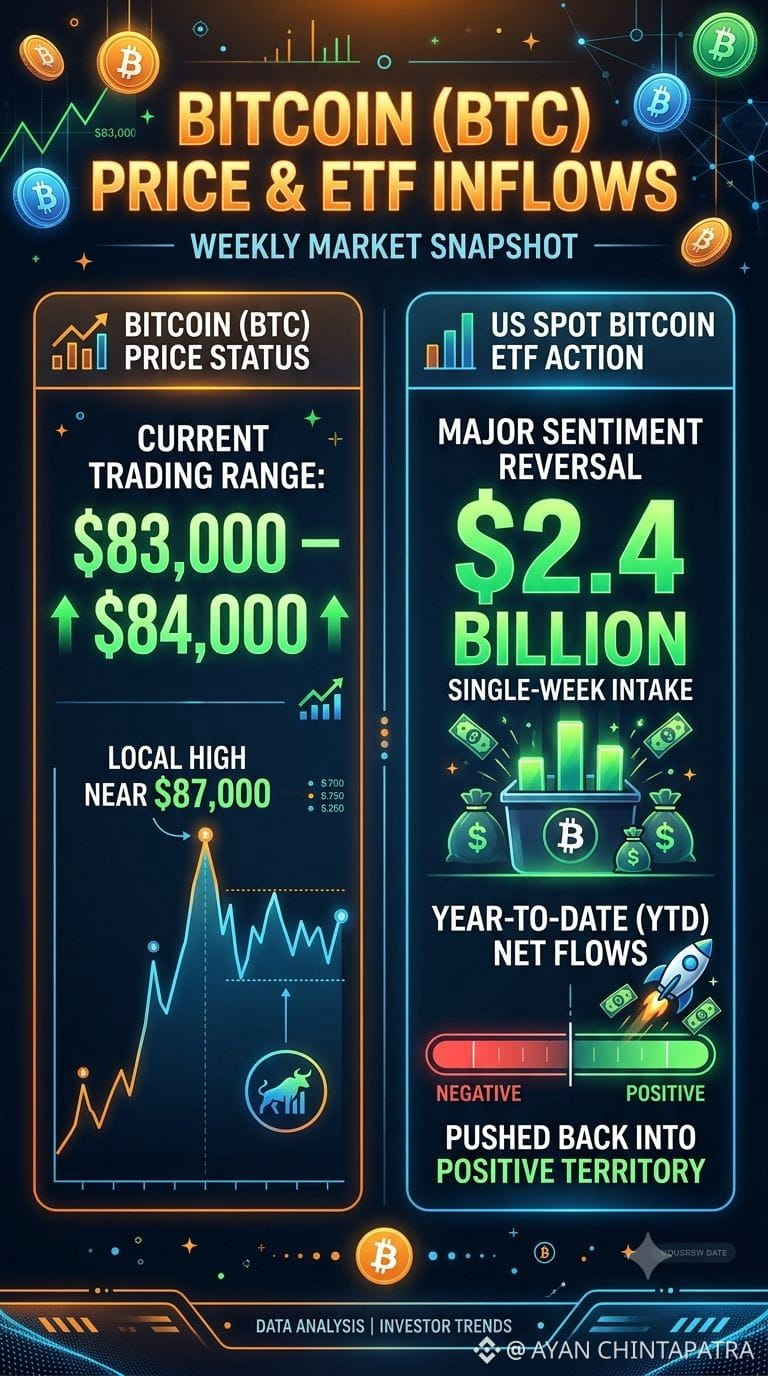
Precio de Bitcoin (#BTC ) y entradas en ETF
Situación del mercado: Bitcoin cotiza en el rango de $83,000–$84,000 tras alcanzar un máximo local cercano a los $87,000.
Actividad de los ETF: Los ETF de Bitcoin al contado de EE. UU. experimentaron un importante cambio de tendencia, con entradas de $2.4 mil millones en una sola semana, lo que hizo que los flujos netos acumulados en lo que va del año volvieran a terreno positivo.
1
50
·
--
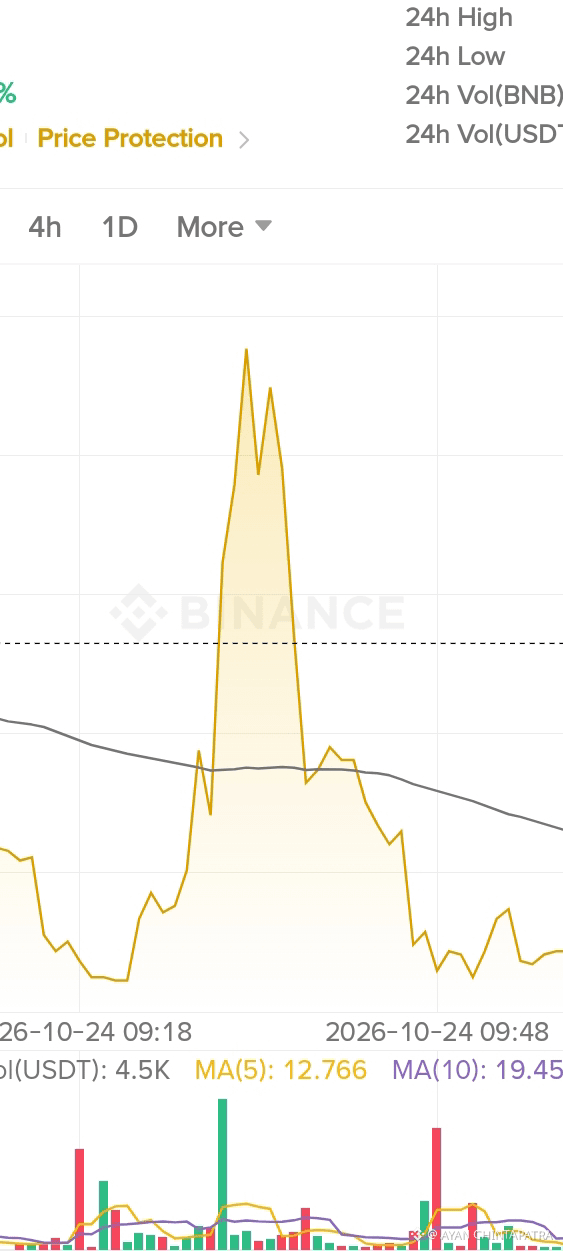
#SUI🔥 I Acción del precio:
Actualmente está poniendo a prueba un soporte estructural vital en torno a zonas críticas (área de $0.75). Los perfiles de volumen indican fases de acumulación, lo que prepara posibles escenarios de reversión para los operadores de swing.
#SUI🔥 I Acción del precio:
Actualmente está poniendo a prueba un soporte estructural vital en torno a zonas críticas (área de $0.75). Los perfiles de volumen indican fases de acumulación, lo que prepara posibles escenarios de reversión para los operadores de swing.
Actualmente está poniendo a prueba un soporte estructural vital en torno a zonas críticas (área de $0.75). Los perfiles de volumen indican fases de acumulación, lo que prepara posibles escenarios de reversión para los operadores de swing.
1
80
·
--
Ver traducción
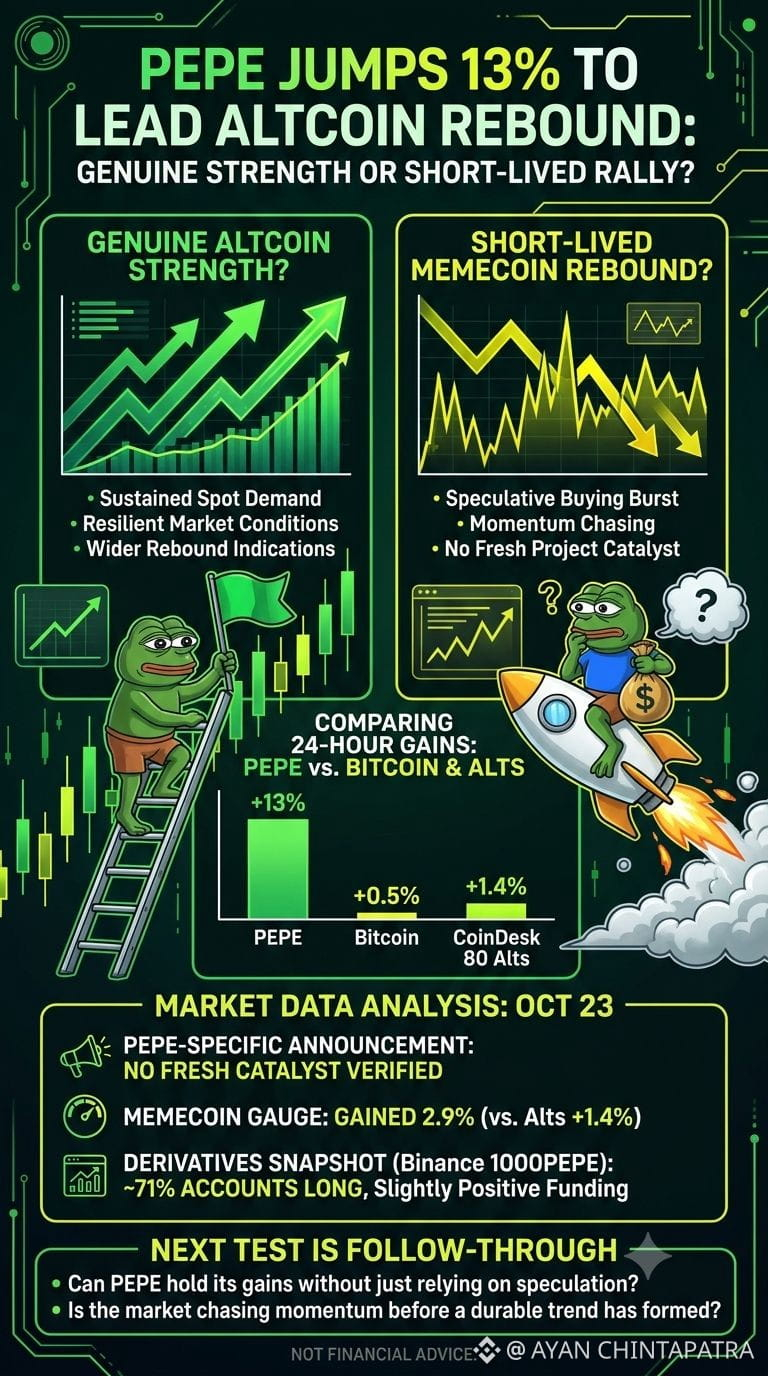
🚨 PEPE surged around 13% in 24 hours while Bitcoin gained just 0.5%. Is this genuine altcoin strength—or a short-lived meme coin rebound?
#pepejumps14%toleadaltcoinrebound
The broader market provides some context.
On October 23, the CoinDesk 80 altcoin index rose 1.4%, while its memecoin gauge gained 2.9%.
PEPE led the move.
But I couldn't verify a fresh PEPE-specific announcement that explains the rally. The evidence points to a wider rebound rather than a confirmed project catalyst.
There's another detail worth watching.
An October 23 derivatives snapshot showed roughly 71% of Binance's 1000PEPE futures accounts positioned long, with slightly positive funding.
That doesn't prove the market is dangerously overleveraged, and account counts aren't the same as capital exposure. But it does show that bullish positioning was already leaning in one direction.
The next test is follow-through: sustained spot demand, resilient market conditions and whether PEPE can hold its gains without relying on another burst of speculative buying.
Is PEPE leading a broader recovery—or is the market chasing momentum before a durable trend has formed?
Not financial advice.
#PEPE #BTC
1
61
·
--
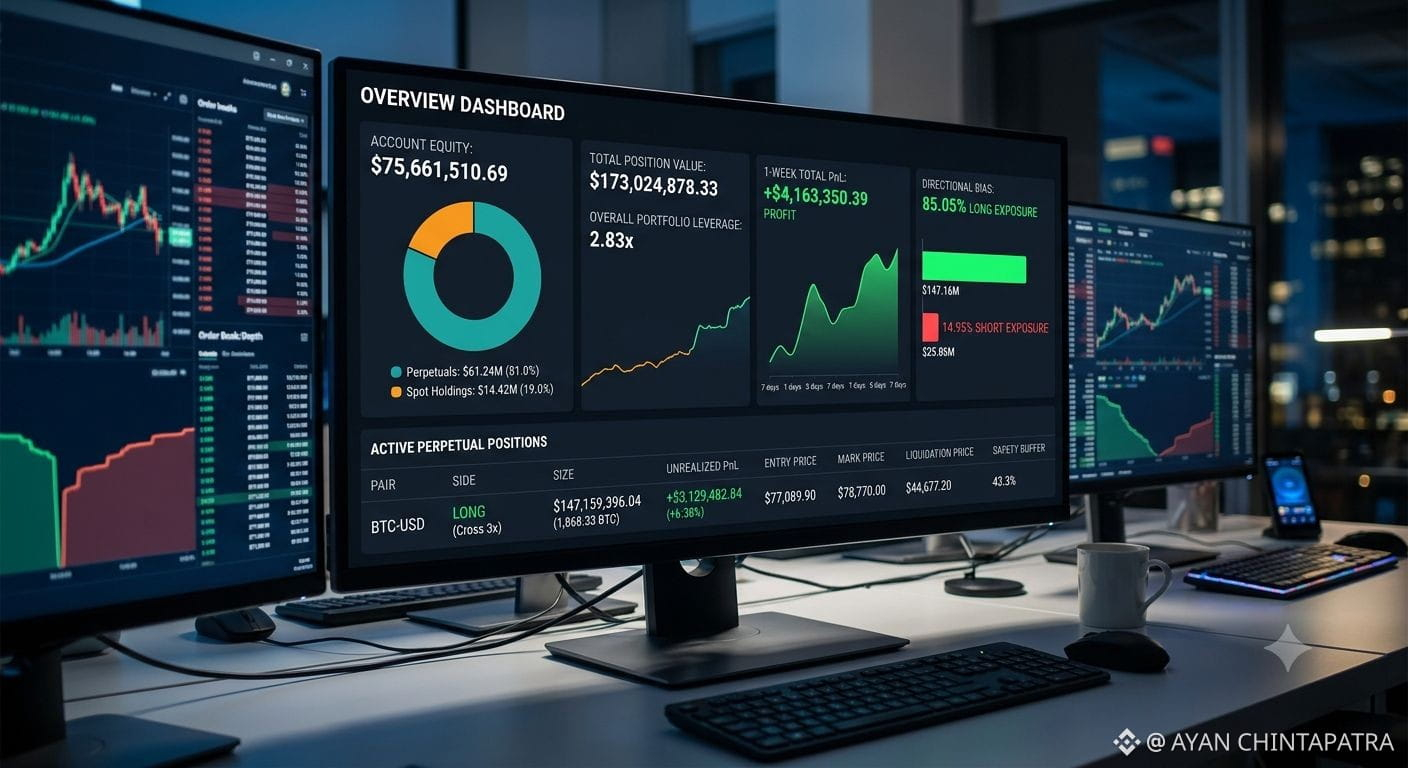
#XRPLeadsCryptoPullbackDropsNearly7% Patrimonio neto: $75,661,510.69 (repartido entre $61.24M en Perpétuos y $14.42M en tenencias Spot).
Valor total de la posición: $173,024,878.33 usando un apalancamiento total de la cartera de 2.83x.
PnL total de 1 semana: +$4,163,350.39 en ganancias durante un periodo de 7 días, mostrado mediante un gráfico de área verde.
Sesgo direccional: Marcadamente inclinado en largo (85.05% Exposición Larga vs 14.95% Exposición Corta), con un valor largo de $147.16M frente a un valor corto de $25.86M.
Desglose de posiciones activas
La tabla inferior detalla posiciones activas abiertas de futuros perpetuos:
Posición principal: BTC Largo (Cross 3x)
Tamaño de la posición: $147,159,396.04 (~1,868.33 BTC)
PnL no realizado: +$3,129,482.84 (+6.38%)
Precio promedio de entrada: $77,089.90
Precio de referencia: $78,770.00
Precio de liquidación: $44,677.20 (proporciona un margen de seguridad de ~43% frente al riesgo a la baja)
Análisis de la estrategia y conclusiones
Apalancamiento controlado: A pesar de mantener un valor de posición masivo de $173M+, el trader conserva un apalancamiento conservador de 2.83x, manteniendo el umbral de liquidación muy por debajo de los precios actuales del spot.
Gestión del riesgo: Mantener una posición masiva con una entrada de BTC en $77k indica una fuerte confianza direccional durante fases de continuación del mercado, respaldada por un capital spot sustancial que actúa como colateral de margen.
1
93
·
--
Ver traducción
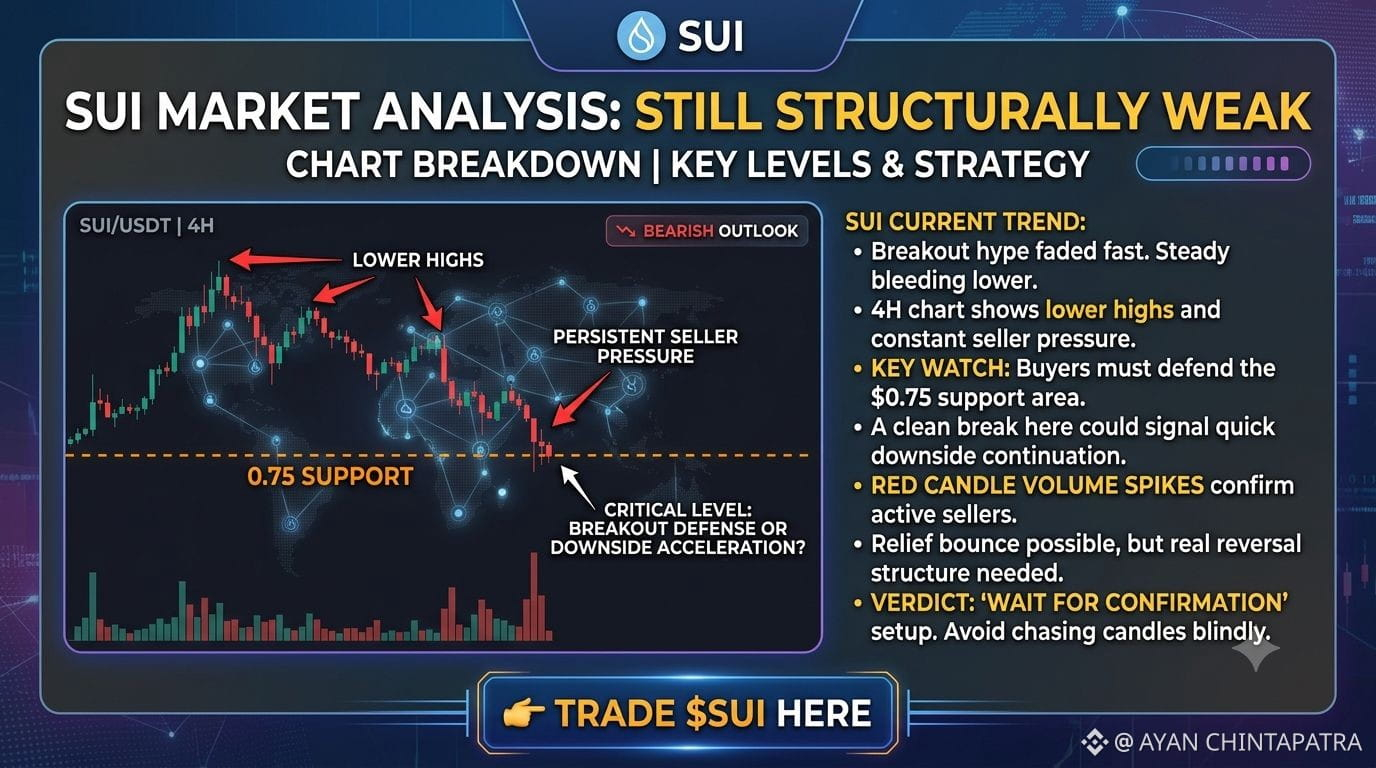
$SUI still looks structurally weak on the chart.
The initial breakout hype faded rapidly, and the price has been steadily bleeding lower—characterized by a series of lower highs and persistent seller pressure on the 4H timeframe.
Right now, the critical level to watch is the 0.75 area. If buyers fail to defend this support and it breaks cleanly, downside continuation could accelerate quickly. This bearish sentiment is further confirmed by volume spikes on red candles, indicating that sellers remain firmly in control.
While a relief bounce is entirely possible after a selloff of this magnitude, the chart needs to print a definitive reversal structure before flipping structurally bullish again. For now, the smartest play is patience—this is a "wait for confirmation" setup rather than one for chasing candles blindly.
👉 Trade $SUI here
1
34
·
--
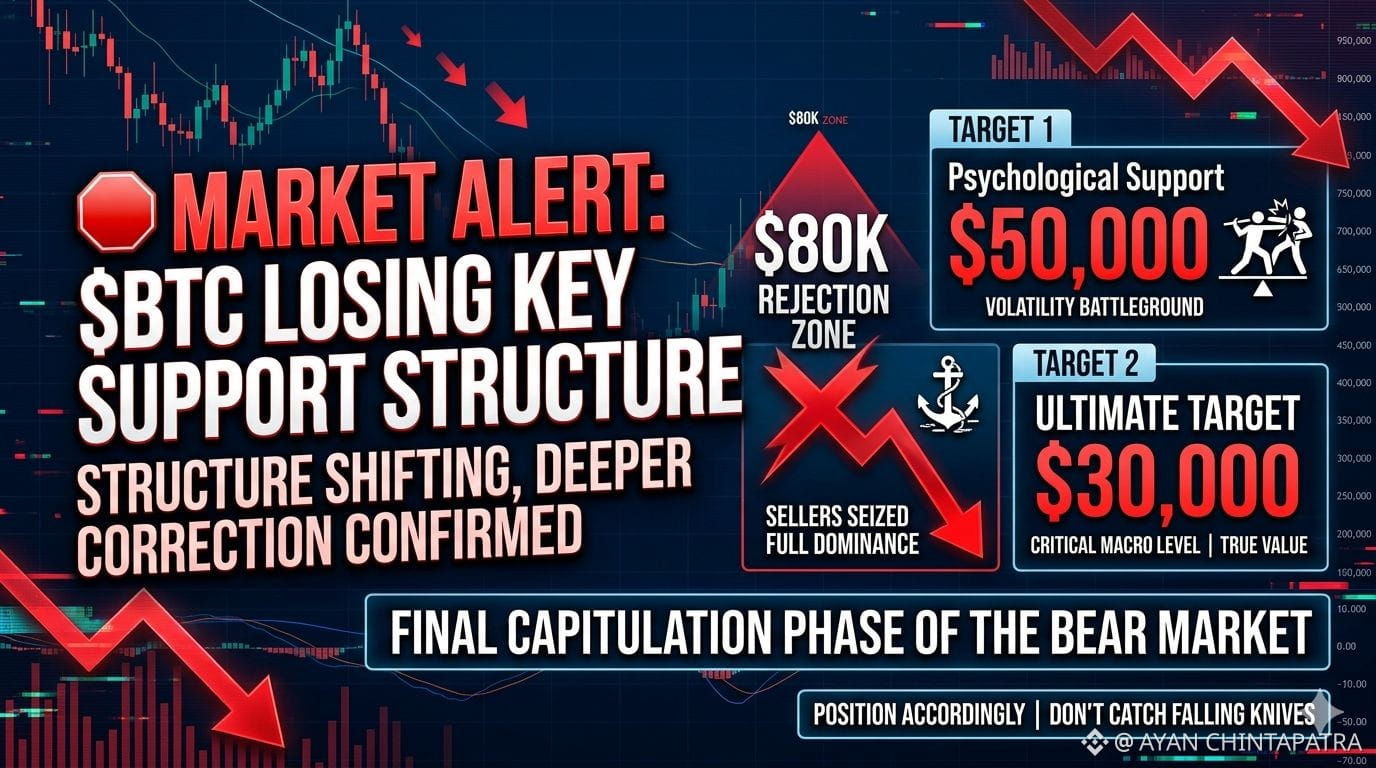
📉 Alerta del Mercado: $BTC BTC Perdiendo Estructura de Soporte Clave
Está sucediendo. La estructura está cambiando, y los técnicos apuntan hacia una corrección mucho más profunda.
Después de un fuerte rechazo cerca de la zona de resistencia de $80K, los vendedores han tomado el control total del libro de órdenes. El momentum ha cambiado completamente a favor de los osos.
🔍 Los Objetivos Técnicos:
Soporte Psicológico: $50,000 — Espera una volatilidad masiva y un campo de batalla temporal aquí mientras el retail intenta defender el número redondo.
El Objetivo Final: $30,000 — El nivel macro crítico donde se encuentra el verdadero valor.
La Gran Imagen: Estamos entrando oficialmente en la fase final de capitulación de este mercado bajista. Las manos débiles están siendo expulsadas.
Posiciona acorde. Mantente disciplinado y no intentes atrapar cuchillos cayendo. 📉
✍️ Por qué este formato impacta más:
Niveles de Precio en Negrita: Destacan los números cruciales ($80K, $50K, $30K) para que los lectores absorban instantáneamente los objetivos macro.
Diseño Limpio: Dividir la tesis en secciones claras (El Rechazo, Los Objetivos, La Gran Imagen) le da la autoridad de una nota de investigación institucional.
Emojis Estratégicos: Los emojis de tendencia a la baja envuelven la pieza en un sentimiento bajista cohesivo sin sentirse demasiado desordenado.
1
252
·
--
Ver traducción
🛑 Stop Funding a Whale's Next Mansion!
Everyone telling you to "buy the dip" right now is setting you up to be exit liquidity. Don't fall for the trap. Look at the actual data:
The Big Players: 947 massive whales have locked in $1.44 BILLION in short positions.
The Reality: They are already up over $210 MILLION in pure, realized profit.
The Retail Trap: Meanwhile, a tiny group of 194 stubborn buyers are sitting on an $84 million loss, praying for a miracle that isn't coming.
The smart money isn’t waiting around. The long/short ratio has utterly collapsed to a brutal 24.97%.
Bottom line: Personally, I am riding with the whales and aggressively adding to my short positions before the floor completely drops out.
Don't be the liquidity they exit on. Tick-tock. ⏳
✍️ Why this works better:
Bullet Points: Breaking down the numbers makes the raw data hit much harder and faster for someone scrolling.
Visual Structure: Bolded text highlights the stark contrast between the winning whales and the losing buyers.
The Hook: Keeping your strong opening ensures people don't just scroll past.
Good luck with the post—let's see if the market plays out exactly how you're anticipating!
1
78
·
--
👌🏼Una profunda inmersión en el "Efecto Vitalik": Enfocándose más en cómo un solo influyente puede mover los mercados.
Un análisis de memecoins como un indicador líder: Discutiendo si este aumento realmente señala un rally más amplio de altcoins.#USJobsData
Una comparación de los mejores desempeños: Desglosando por qué #BTCVSGOLD PEPE, BONK, DOGE y PENGU están liderando el grupo.
Una historia de advertencia: Destacando los riesgos y la volatilidad a pesar de las ganancias.
Una visión general del mercado más amplia: Resumiendo el evento y sus posibles implicaciones.
¡Déjame saber tu ángulo preferido, y comenzaré!
👌🏼
Una profunda inmersión en el "Efecto Vitalik": Enfocándose más en cómo un solo influyente puede mover los mercados.
Un análisis de memecoins como un indicador líder: Discutiendo si este aumento realmente señala un rally más amplio de altcoins.#USJobsData
Una comparación de los mejores desempeños: Desglosando por qué #BTCVSGOLD PEPE, BONK, DOGE y PENGU están liderando el grupo.
Una historia de advertencia: Destacando los riesgos y la volatilidad a pesar de las ganancias.
Una visión general del mercado más amplia: Resumiendo el evento y sus posibles implicaciones.
¡Déjame saber tu ángulo preferido, y comenzaré!
9
208
Inicia sesión para explorar más contenidos
Únete a usuarios de criptomonedas de todo el mundo en Binance Square
⚡️ Obtén la información más reciente y útil sobre criptomonedas.
💬 Confía en el mayor exchange de criptomonedas del mundo.
👍 Descubre opiniones reales de creadores verificados.
Correo electrónico/número de teléfono
Temas en tendencia
CanMicrosoftDeliverOnAI
598 visualizaciones
64 participa(n) en el debate
#canmicrosoftdeliveronai Microsoft ya integró IA en Azure, Copilot, GitHub y Microsoft 365. La verdadera pregunta no es si puede entregar IA, sino si puede convertir esa enorme inversión en adopción masiva y resultados reales además apostó fuerte por la IA y está construyendo uno de los ecosistemas más grandes del sector. Si logra conectar infraestructura, modelos y productividad en una sola experiencia, podría dominar la próxima era tecnológica. #CanMicrosoftDeliverOnA
EnriqueLR
·0 «Me gusta»
·59 visualizaciones
CanGoogleDefindItsCore
619 visualizaciones
70 participa(n) en el debate
FOMCWatch
9M visualizaciones
27,208 participa(n) en el debate