
#usstocks
usstocks
201,168 vistas
840 están debatiendo
Hot
Lo último


·
--
Parcialmente cierto
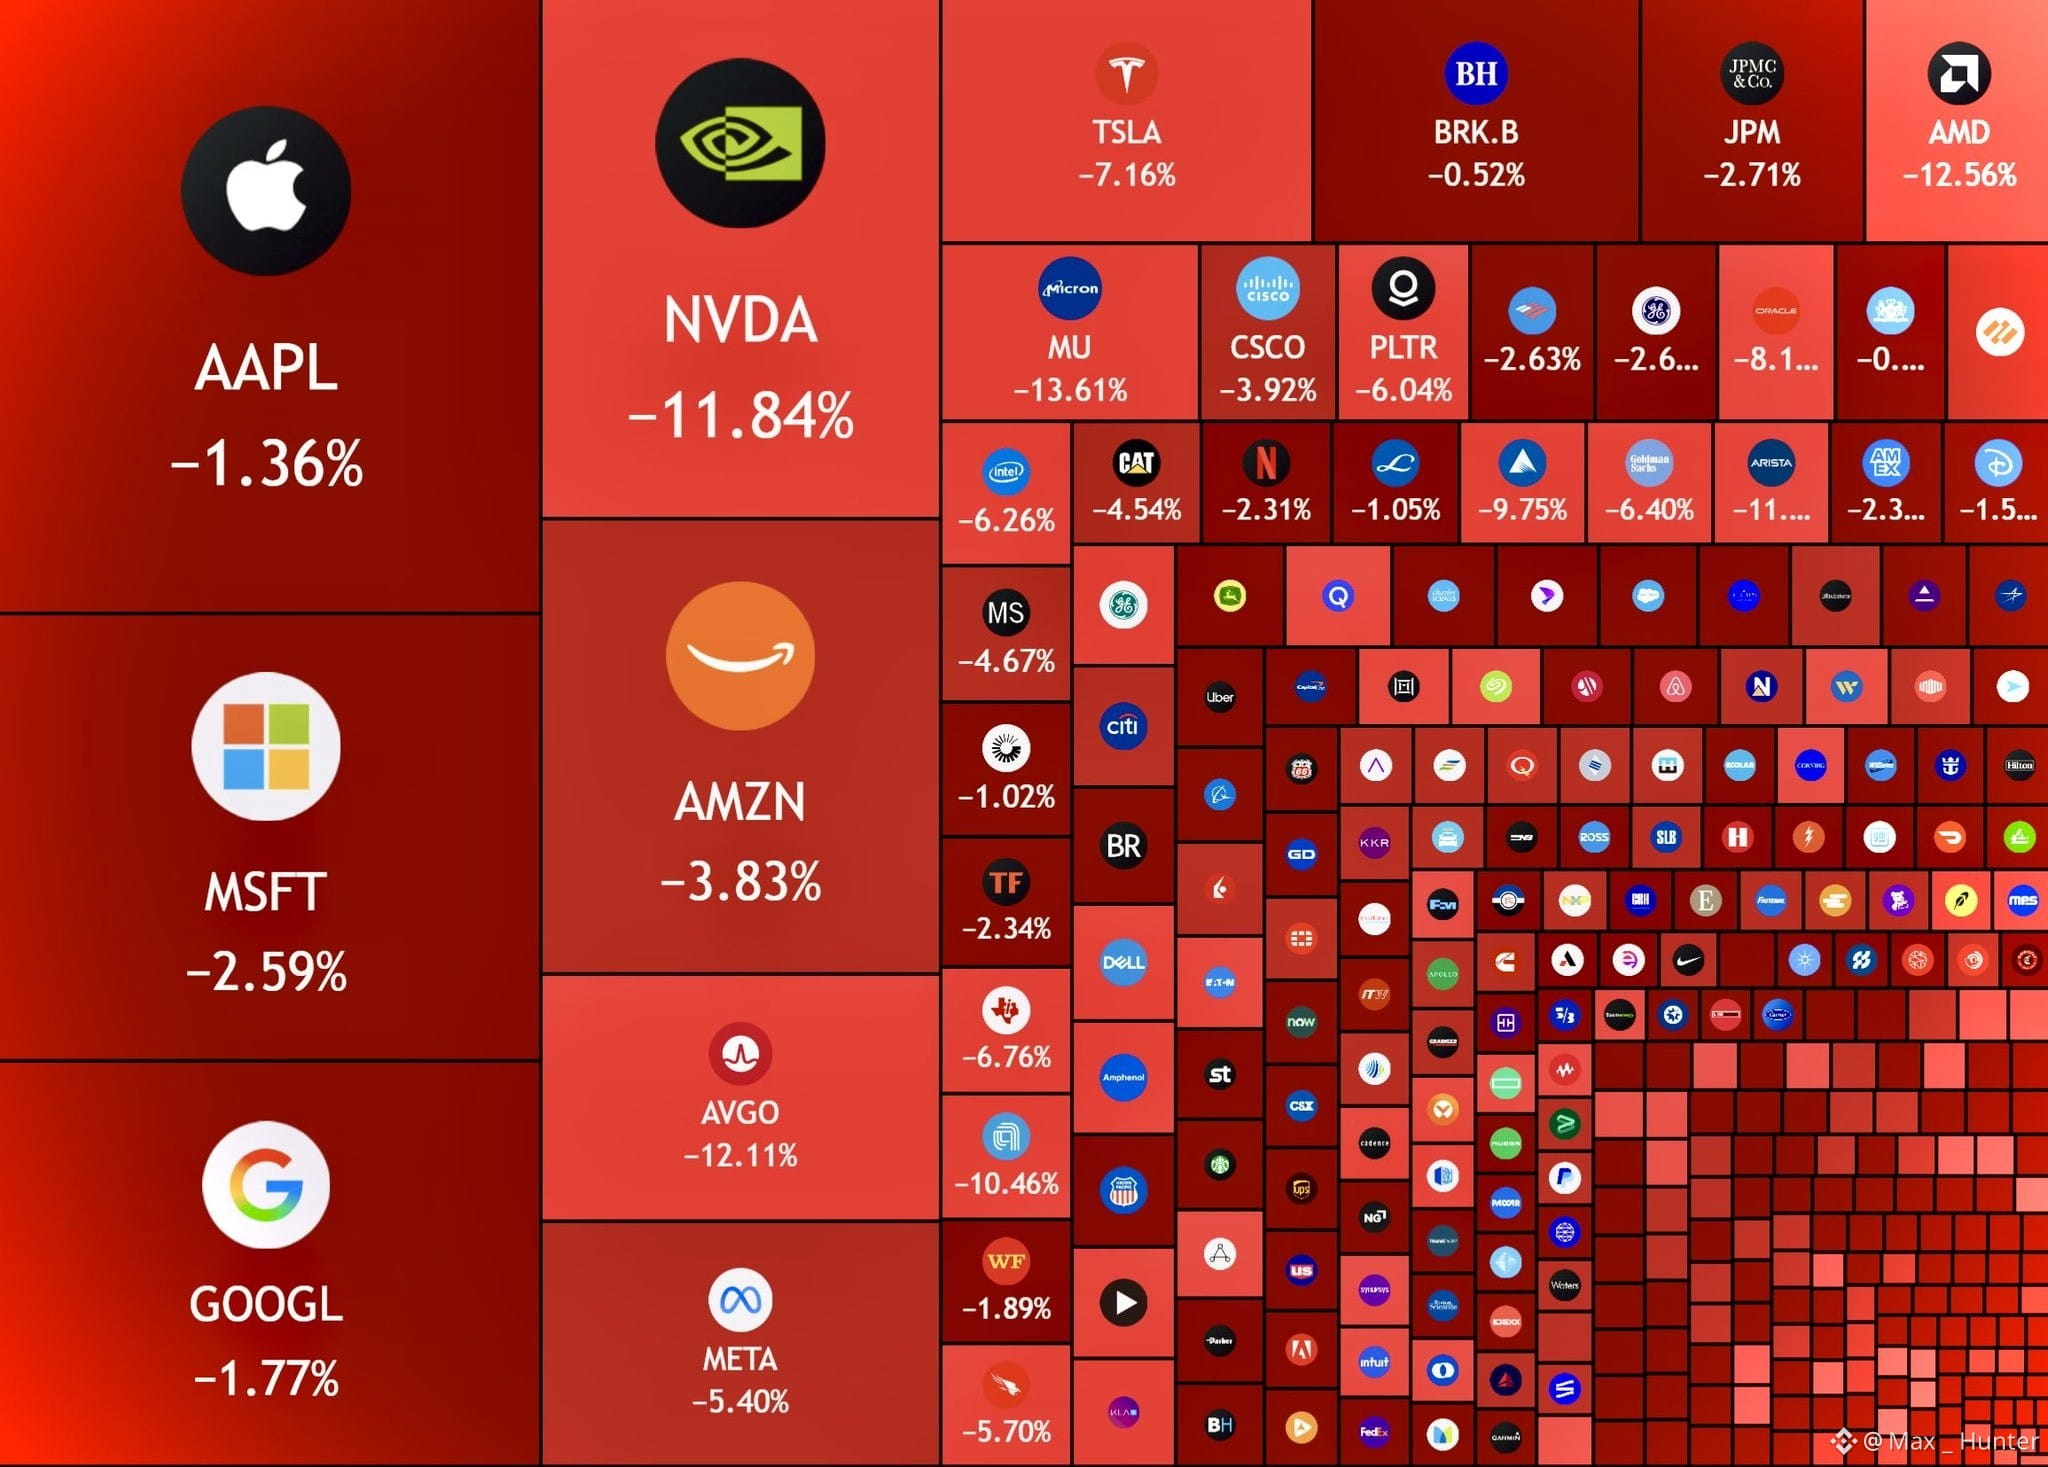
🚨 ¡ENORME PÉRDIDA DE RIQUEZA EN EL MERCADO BURSÁTIL DE EE. UU.! 🇺🇸
Cada vez es más difícil ignorar las cifras.
Según las cifras que circulan, aproximadamente 8,9 billones de dólares se han esfumado del mercado bursátil estadounidense en los últimos 45 días, y al parecer hoy se han perdido otros 2,5 billones.
Es una cantidad enorme de valor de mercado que desaparece en un período muy corto.
Esto plantea una pregunta más importante: ¿Se trata simplemente de una corrección temporal o los inversores están empezando a replantearse su exposición a los mercados financieros tradicionales?
Cuando aumenta la incertidumbre, la confianza se vuelve tan importante como el capital. Las próximas semanas podrían revelar si esta presión es pasajera o si forma parte de un cambio más profundo en el sentimiento del mercado.
Una cosa está clara: ahora mismo, los mercados financieros merecen mucha atención. 👀
¿Es una corrección normal o algo mucho más grande?
#StockMarket #USStocks #breakingnews s#Crypto #MarketUpdate
🚨 ¡ENORME PÉRDIDA DE RIQUEZA EN EL MERCADO BURSÁTIL DE EE. UU.! 🇺🇸
Cada vez es más difícil ignorar las cifras.
Según las cifras que circulan, aproximadamente 8,9 billones de dólares se han esfumado del mercado bursátil estadounidense en los últimos 45 días, y al parecer hoy se han perdido otros 2,5 billones.
Es una cantidad enorme de valor de mercado que desaparece en un período muy corto.
Esto plantea una pregunta más importante: ¿Se trata simplemente de una corrección temporal o los inversores están empezando a replantearse su exposición a los mercados financieros tradicionales?
Cuando aumenta la incertidumbre, la confianza se vuelve tan importante como el capital. Las próximas semanas podrían revelar si esta presión es pasajera o si forma parte de un cambio más profundo en el sentimiento del mercado.
Una cosa está clara: ahora mismo, los mercados financieros merecen mucha atención. 👀
¿Es una corrección normal o algo mucho más grande?
#StockMarket #USStocks #breakingnews s#Crypto #MarketUpdate
Cada vez es más difícil ignorar las cifras.
Según las cifras que circulan, aproximadamente 8,9 billones de dólares se han esfumado del mercado bursátil estadounidense en los últimos 45 días, y al parecer hoy se han perdido otros 2,5 billones.
Es una cantidad enorme de valor de mercado que desaparece en un período muy corto.
Esto plantea una pregunta más importante: ¿Se trata simplemente de una corrección temporal o los inversores están empezando a replantearse su exposición a los mercados financieros tradicionales?
Cuando aumenta la incertidumbre, la confianza se vuelve tan importante como el capital. Las próximas semanas podrían revelar si esta presión es pasajera o si forma parte de un cambio más profundo en el sentimiento del mercado.
Una cosa está clara: ahora mismo, los mercados financieros merecen mucha atención. 👀
¿Es una corrección normal o algo mucho más grande?
#StockMarket #USStocks #breakingnews s#Crypto #MarketUpdate
559

·
--
Parcialmente cierto
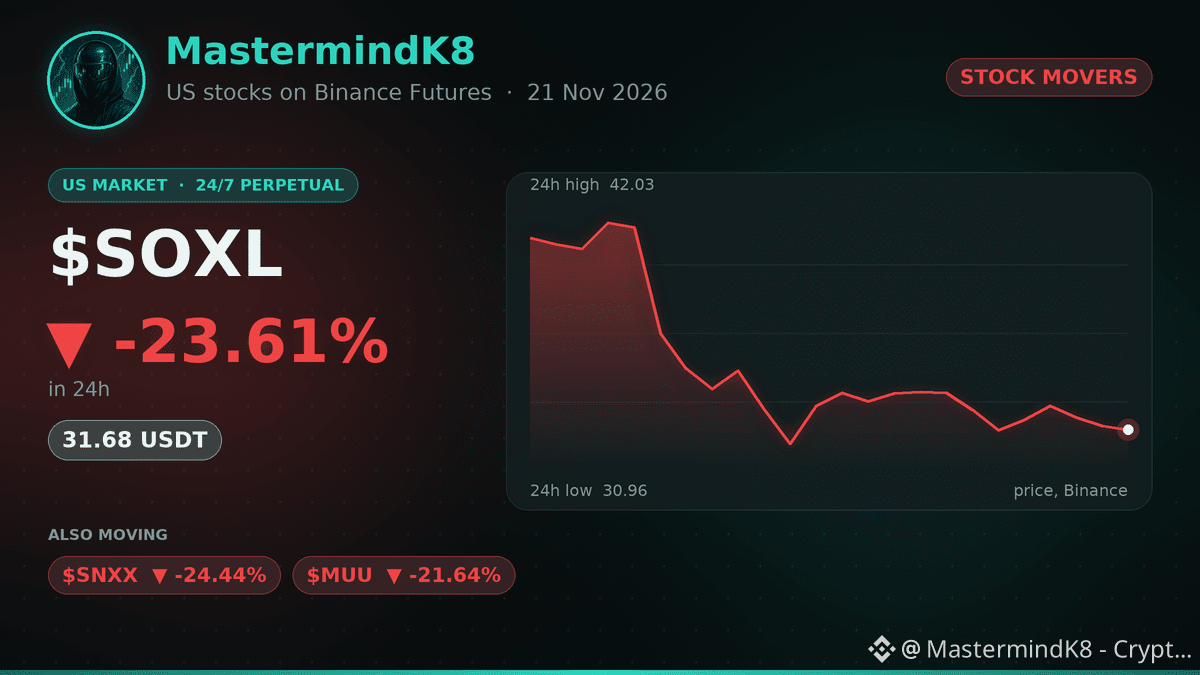
📉 $SOXL cae un 23.61% en 24 h 😬
Un trader redujo su exposición a SOXL, señalando el rezago de un líder de chips y el deterioro del ETF, y trasladó su inversión a otras empresas de semiconductores. ⚡
SOXL es un ETF de semiconductores apalancado 3x, por lo que sus movimientos son varias veces mayores que los de su índice.
SOXL se negocia las 24 horas, los 7 días de la semana, en Binance Futures como contrato perpetuo de USDT. 🕒
¿Este movimiento cambia tu opinión sobre los ETF apalancados de chips? 🤔
📊 También bajan: $SNXX un 24.44%, $MUU un 21.64%
Sígueme para conocer las acciones estadounidenses con mayores movimientos del día 🔔
#USStocks #TradFi #StockMarket
📉 $SOXL cae un 23.61% en 24 h 😬
Un trader redujo su exposición a SOXL, señalando el rezago de un líder de chips y el deterioro del ETF, y trasladó su inversión a otras empresas de semiconductores. ⚡
SOXL es un ETF de semiconductores apalancado 3x, por lo que sus movimientos son varias veces mayores que los de su índice.
SOXL se negocia las 24 horas, los 7 días de la semana, en Binance Futures como contrato perpetuo de USDT. 🕒
¿Este movimiento cambia tu opinión sobre los ETF apalancados de chips? 🤔
📊 También bajan: $SNXX un 24.44%, $MUU un 21.64%
Sígueme para conocer las acciones estadounidenses con mayores movimientos del día 🔔
#USStocks #TradFi #StockMarket
Un trader redujo su exposición a SOXL, señalando el rezago de un líder de chips y el deterioro del ETF, y trasladó su inversión a otras empresas de semiconductores. ⚡
SOXL es un ETF de semiconductores apalancado 3x, por lo que sus movimientos son varias veces mayores que los de su índice.
SOXL se negocia las 24 horas, los 7 días de la semana, en Binance Futures como contrato perpetuo de USDT. 🕒
¿Este movimiento cambia tu opinión sobre los ETF apalancados de chips? 🤔
📊 También bajan: $SNXX un 24.44%, $MUU un 21.64%
Sígueme para conocer las acciones estadounidenses con mayores movimientos del día 🔔
#USStocks #TradFi #StockMarket
1
915

El mercado más sólido combina rendimiento, participación y continuidad.
Acciones — Mejor rendimiento y tendencia:
$WMT | $CVX | $XOM | AAPL | LLY | DIS | MSFT | GOOGL | NFLX | BA
Lectura de WPO:
Walmart lidera el universo líquido con +1,51% en la última sesión monitoreada y -0,74% en la muestra de cinco sesiones. 3 de los 5 principales valores están en positivo, por lo que la amplitud es selectiva. El liderazgo se reparte entre los principales valores; el volumen es 2,2 veces su ritmo reciente.
El impulso puede revertirse rápidamente, así que la confirmación importa más que el entusiasmo.
#wpo_report #USStocks #InvestigaciónDeMercado
El mercado más sólido combina rendimiento, participación y continuidad.
Acciones — Mejor rendimiento y tendencia:
$WMT | $CVX | $XOM | AAPL | LLY | DIS | MSFT | GOOGL | NFLX | BA
Lectura de WPO:
Walmart lidera el universo líquido con +1,51% en la última sesión monitoreada y -0,74% en la muestra de cinco sesiones. 3 de los 5 principales valores están en positivo, por lo que la amplitud es selectiva. El liderazgo se reparte entre los principales valores; el volumen es 2,2 veces su ritmo reciente.
El impulso puede revertirse rápidamente, así que la confirmación importa más que el entusiasmo.
#wpo_report #USStocks #InvestigaciónDeMercado
Acciones — Mejor rendimiento y tendencia:
$WMT | $CVX | $XOM | AAPL | LLY | DIS | MSFT | GOOGL | NFLX | BA
Lectura de WPO:
Walmart lidera el universo líquido con +1,51% en la última sesión monitoreada y -0,74% en la muestra de cinco sesiones. 3 de los 5 principales valores están en positivo, por lo que la amplitud es selectiva. El liderazgo se reparte entre los principales valores; el volumen es 2,2 veces su ritmo reciente.
El impulso puede revertirse rápidamente, así que la confirmación importa más que el entusiasmo.
#wpo_report #USStocks #InvestigaciónDeMercado
185

·
--
Parcialmente cierto
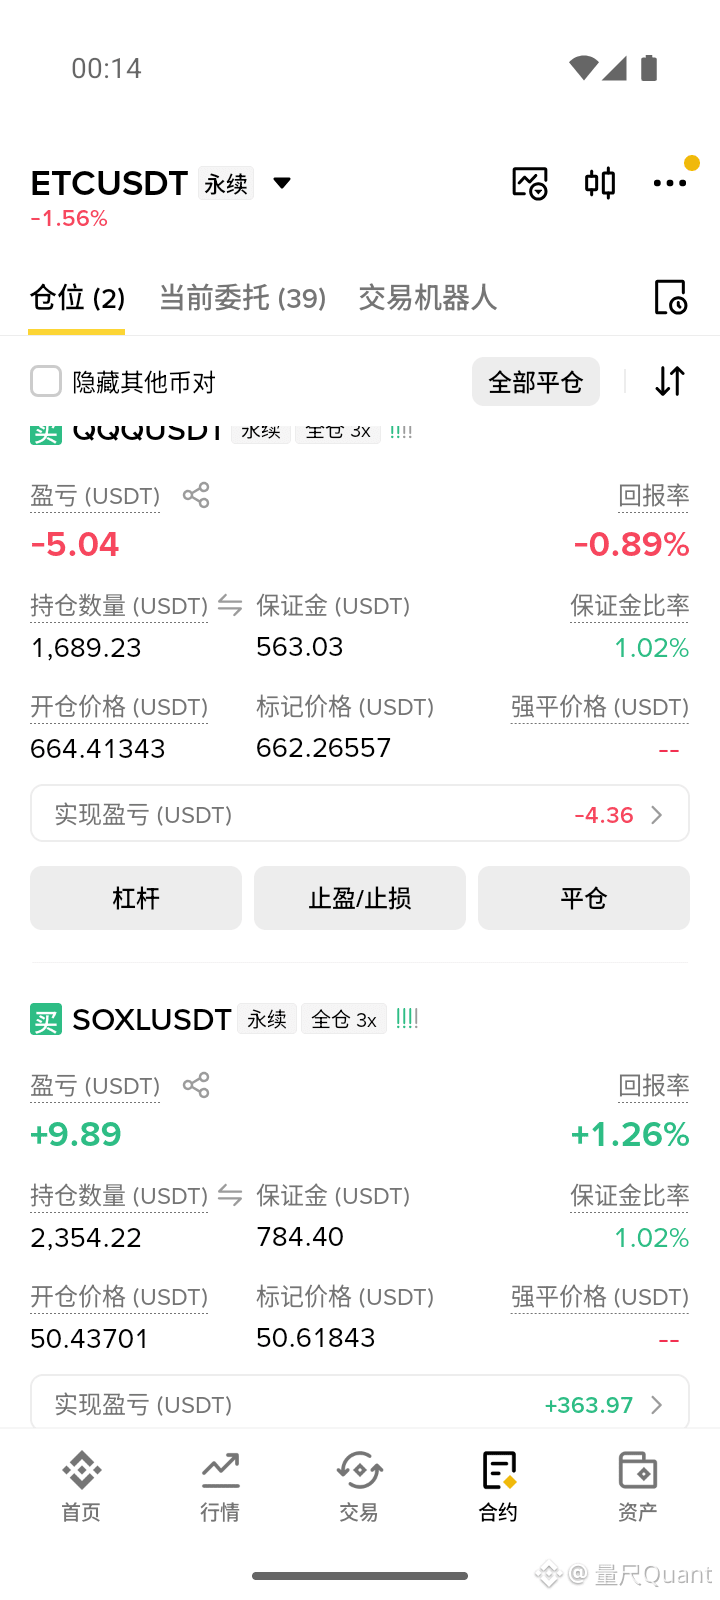
En esta subida de los semiconductores, la estrategia de rejilla fue vendiendo a medida que subían, así que yo casi no tuve que mover un dedo. Acabo de echar un vistazo a la cuenta: la ganancia realizada de mi posición en SOXL ya está asegurada, +363.97, aunque el precio actual apenas ronda mi costo promedio. La verdad, cuanto más directa es la subida, menos me atrevo a aumentar la posición. Por ahora mantendré la posición base que me queda; si vuelve a la zona de costo, decidiré si compro más. Si cae por debajo del mínimo anterior, venderé la mitad. Quienes invierten en productos apalancados por tres, ¿prefieren asegurar ganancias o quedarse para aprovechar la tendencia? Registro de operaciones reales · Día 10 #Semiconductors #USStocks
En esta subida de los semiconductores, la estrategia de rejilla fue vendiendo a medida que subían, así que yo casi no tuve que mover un dedo. Acabo de echar un vistazo a la cuenta: la ganancia realizada de mi posición en SOXL ya está asegurada, +363.97, aunque el precio actual apenas ronda mi costo promedio. La verdad, cuanto más directa es la subida, menos me atrevo a aumentar la posición. Por ahora mantendré la posición base que me queda; si vuelve a la zona de costo, decidiré si compro más. Si cae por debajo del mínimo anterior, venderé la mitad. Quienes invierten en productos apalancados por tres, ¿prefieren asegurar ganancias o quedarse para aprovechar la tendencia? Registro de operaciones reales · Día 10 #Semiconductors #USStocks
1.1k

·
--
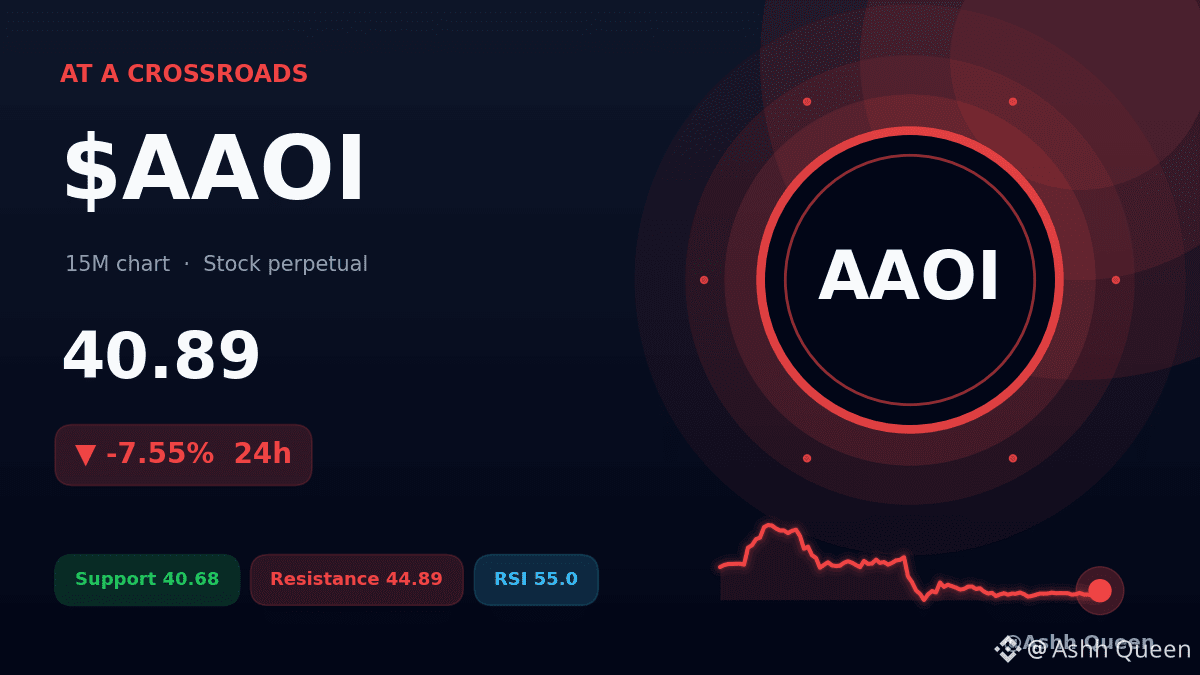
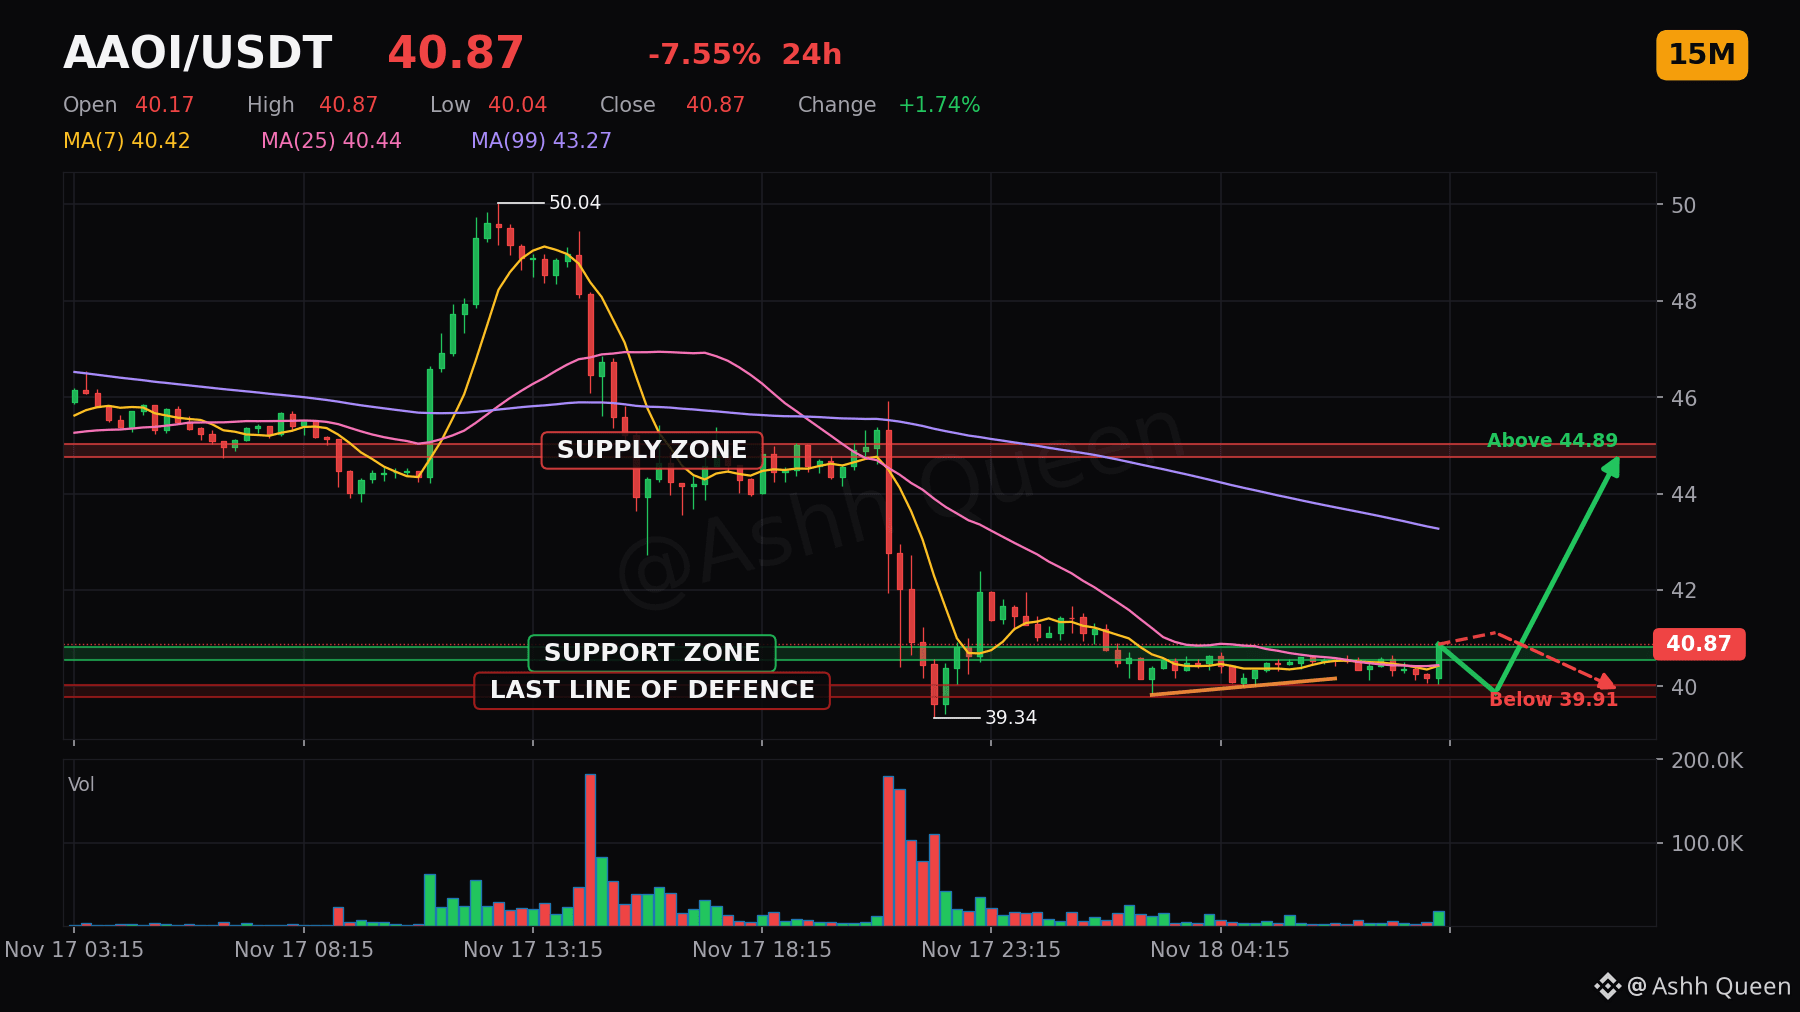
Un nivel que $AAOI traders no deberían ignorar hoy. ⚠️
Este contrato perpetuo ha registrado un MOVIMIENTO del +1.74% en la última hora, elevando el precio a 40.89 en el gráfico de 15 min. 🧐
Aunque actualmente se mantiene por encima del VWAP en 40.67 y de la EMA20 en 40.51, el activo sigue muy por debajo de la EMA50 en 41.26. Si el soporte en 40.68 se mantiene, podríamos mirar hacia la resistencia en 44.89. Si cede, probablemente volveremos a probar el soporte en 39.91. 🛡️
¿Qué opinas de este cambio y qué indicadores respaldan tu análisis?
#AAOI #USStocks #StockMarket #BinanceSquare
⚠️ Los contratos perpetuos son derivados apalancados, no la acción ni la materia prima en sí.
Nota de riesgo: el apalancamiento amplifica las pérdidas. Planifica la salida antes de entrar.
Un nivel que $AAOI traders no deberían ignorar hoy. ⚠️
Este contrato perpetuo ha registrado un MOVIMIENTO del +1.74% en la última hora, elevando el precio a 40.89 en el gráfico de 15 min. 🧐
Aunque actualmente se mantiene por encima del VWAP en 40.67 y de la EMA20 en 40.51, el activo sigue muy por debajo de la EMA50 en 41.26. Si el soporte en 40.68 se mantiene, podríamos mirar hacia la resistencia en 44.89. Si cede, probablemente volveremos a probar el soporte en 39.91. 🛡️
¿Qué opinas de este cambio y qué indicadores respaldan tu análisis?
#AAOI #USStocks #StockMarket #BinanceSquare
⚠️ Los contratos perpetuos son derivados apalancados, no la acción ni la materia prima en sí.
Nota de riesgo: el apalancamiento amplifica las pérdidas. Planifica la salida antes de entrar.
Este contrato perpetuo ha registrado un MOVIMIENTO del +1.74% en la última hora, elevando el precio a 40.89 en el gráfico de 15 min. 🧐
Aunque actualmente se mantiene por encima del VWAP en 40.67 y de la EMA20 en 40.51, el activo sigue muy por debajo de la EMA50 en 41.26. Si el soporte en 40.68 se mantiene, podríamos mirar hacia la resistencia en 44.89. Si cede, probablemente volveremos a probar el soporte en 39.91. 🛡️
¿Qué opinas de este cambio y qué indicadores respaldan tu análisis?
#AAOI #USStocks #StockMarket #BinanceSquare
⚠️ Los contratos perpetuos son derivados apalancados, no la acción ni la materia prima en sí.
Nota de riesgo: el apalancamiento amplifica las pérdidas. Planifica la salida antes de entrar.
4
·
--
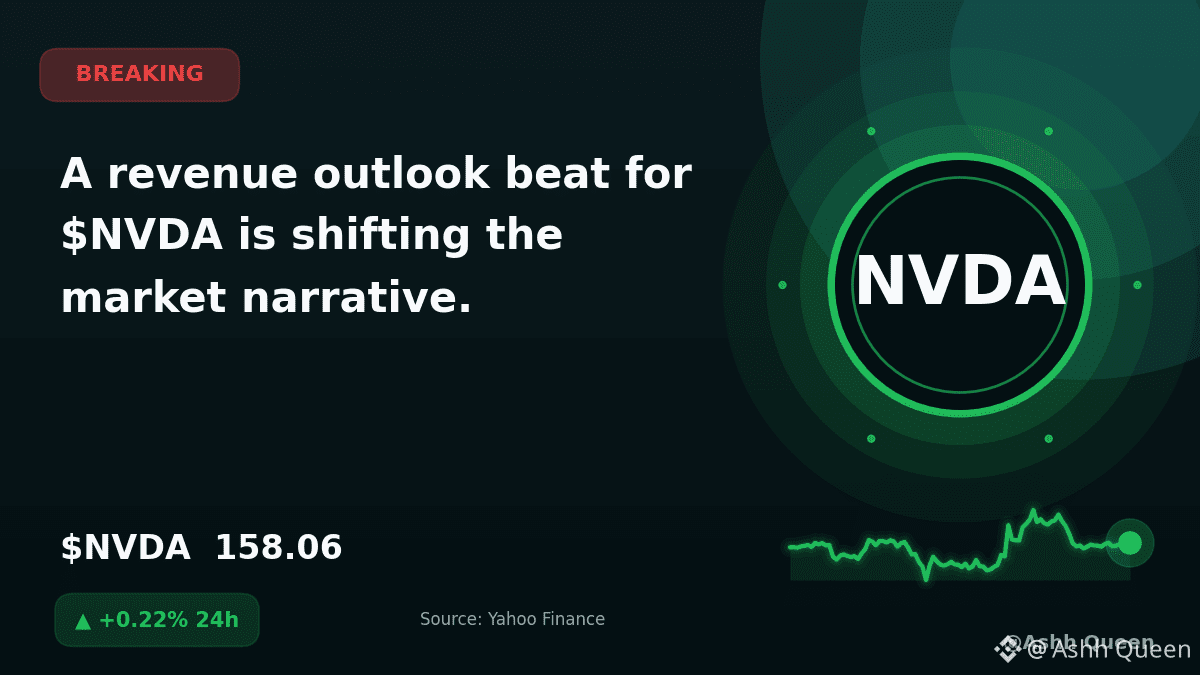
Una previsión de ingresos que superó las expectativas para $NVDA está cambiando la narrativa del mercado.
Según Yahoo Finance, los futuros de las acciones estadounidenses están repuntando tras unos resultados de ingresos de la empresa mejores de lo esperado. Esto ocurre mientras los mercados en general afrontaban un reciente retroceso, con el S&P 500 y el Nasdaq registrando su cuarto día consecutivo de pérdidas.
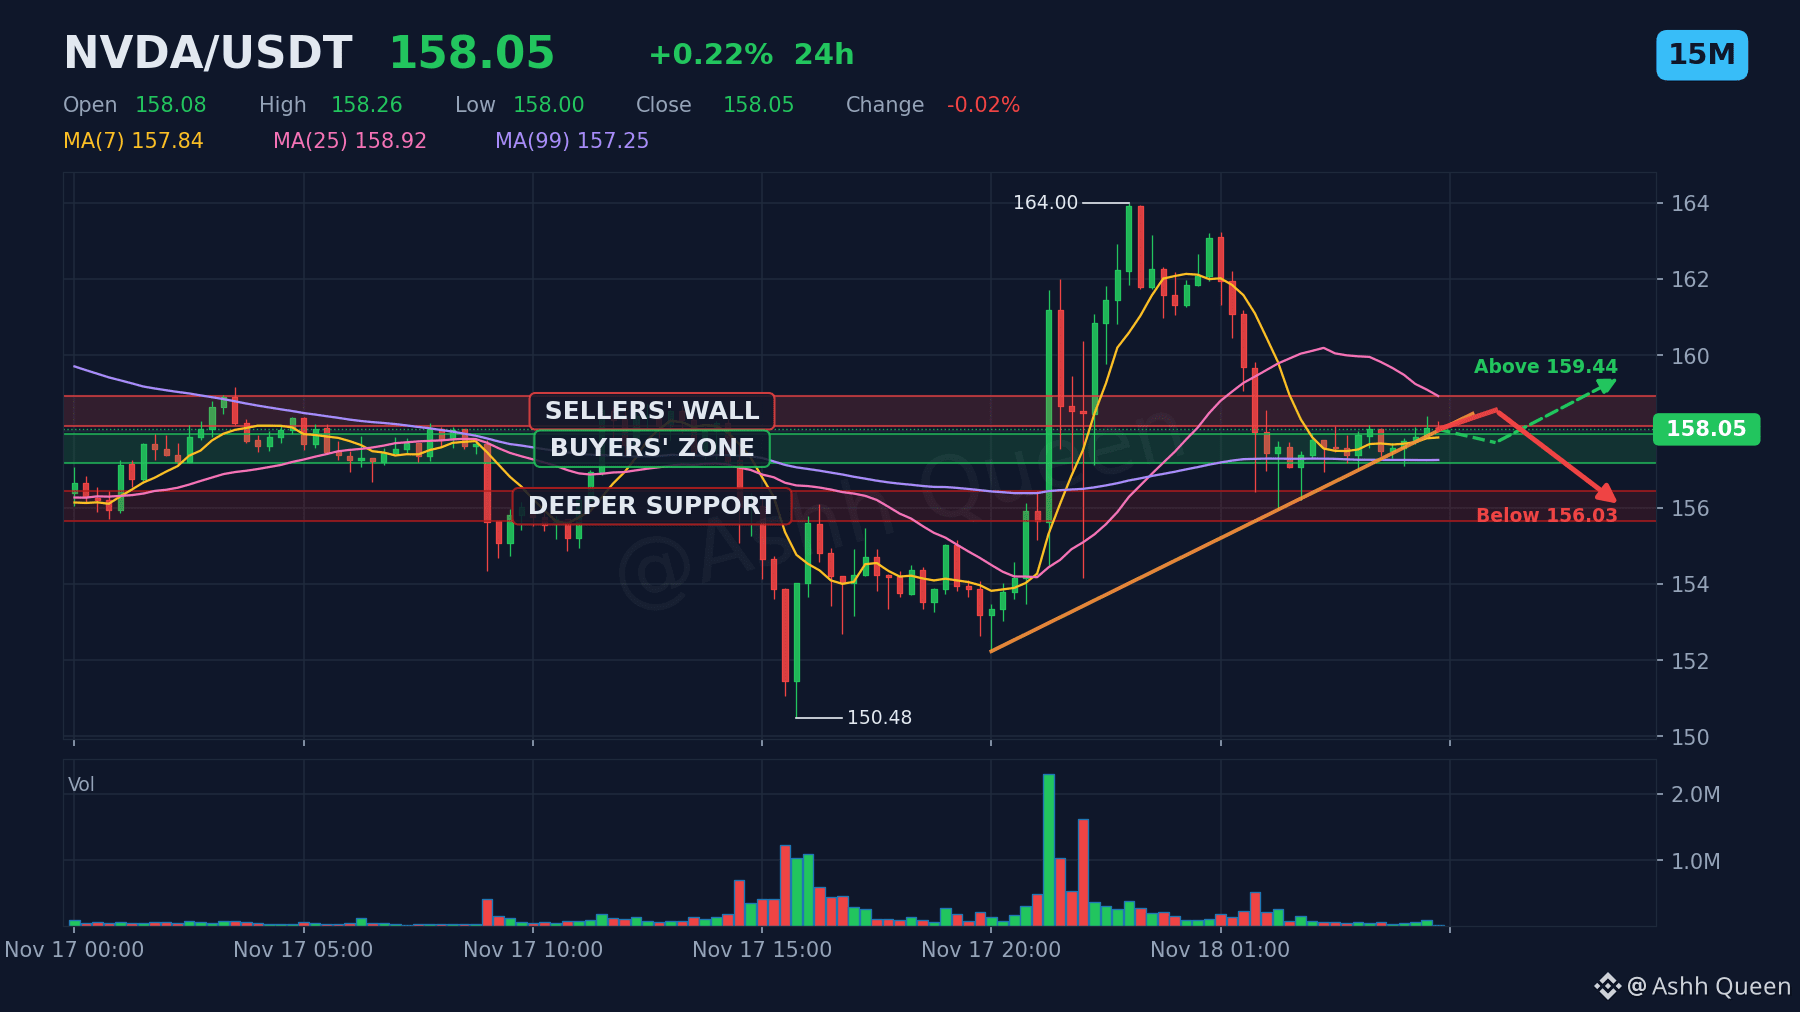
El contrato perpetuo de $NVDA cotiza actualmente a 158.06, con una variación de +0.22% en las últimas 24 h. El activo se mueve cerca del soporte de 157.54 y de la resistencia de 158.53.
¿Cómo crees que este informe de resultados afectará al sentimiento general del sector tecnológico en las próximas sesiones? 🔥⚡🚀
#NVDA #USStocks #NoticiasDelMercado
⚠️ Los contratos perpetuos son derivados apalancados; no son la acción ni la materia prima en sí.
Haz tu propia investigación. Dimensiona tus posiciones con cuidado y nunca operes con dinero que no puedas permitirte perder.
Una previsión de ingresos que superó las expectativas para $NVDA está cambiando la narrativa del mercado.
Según Yahoo Finance, los futuros de las acciones estadounidenses están repuntando tras unos resultados de ingresos de la empresa mejores de lo esperado. Esto ocurre mientras los mercados en general afrontaban un reciente retroceso, con el S&P 500 y el Nasdaq registrando su cuarto día consecutivo de pérdidas.
El contrato perpetuo de $NVDA cotiza actualmente a 158.06, con una variación de +0.22% en las últimas 24 h. El activo se mueve cerca del soporte de 157.54 y de la resistencia de 158.53.
¿Cómo crees que este informe de resultados afectará al sentimiento general del sector tecnológico en las próximas sesiones? 🔥⚡🚀
#NVDA #USStocks #NoticiasDelMercado
⚠️ Los contratos perpetuos son derivados apalancados; no son la acción ni la materia prima en sí.
Haz tu propia investigación. Dimensiona tus posiciones con cuidado y nunca operes con dinero que no puedas permitirte perder.
Según Yahoo Finance, los futuros de las acciones estadounidenses están repuntando tras unos resultados de ingresos de la empresa mejores de lo esperado. Esto ocurre mientras los mercados en general afrontaban un reciente retroceso, con el S&P 500 y el Nasdaq registrando su cuarto día consecutivo de pérdidas.
El contrato perpetuo de $NVDA cotiza actualmente a 158.06, con una variación de +0.22% en las últimas 24 h. El activo se mueve cerca del soporte de 157.54 y de la resistencia de 158.53.
¿Cómo crees que este informe de resultados afectará al sentimiento general del sector tecnológico en las próximas sesiones? 🔥⚡🚀
#NVDA #USStocks #NoticiasDelMercado
⚠️ Los contratos perpetuos son derivados apalancados; no son la acción ni la materia prima en sí.
Haz tu propia investigación. Dimensiona tus posiciones con cuidado y nunca operes con dinero que no puedas permitirte perder.
6

·
--
Verificado
Artículo
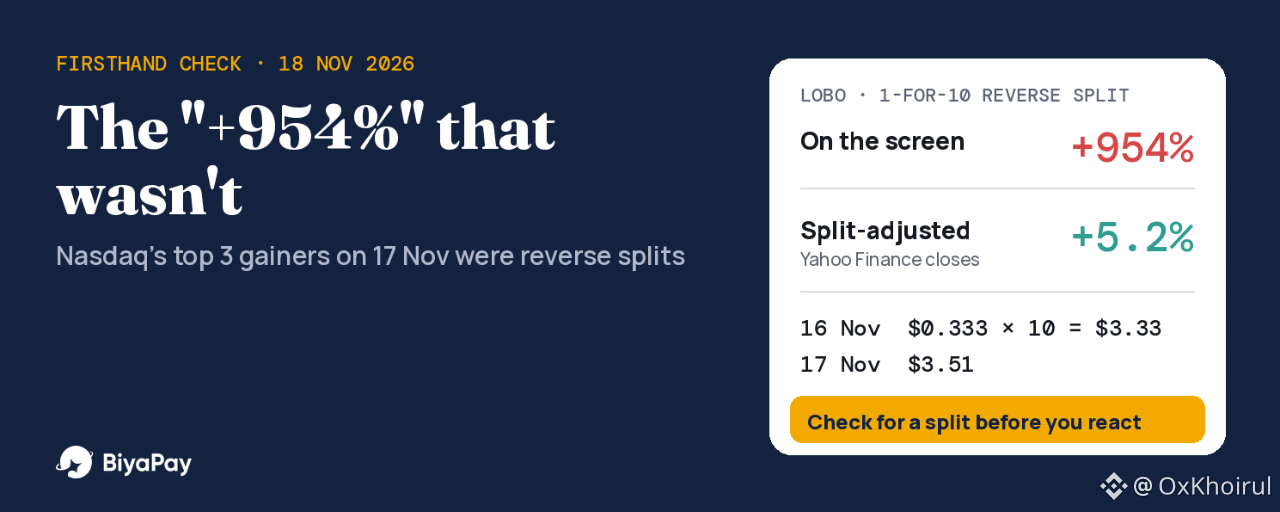
Las tres mayores «subidas» del Nasdaq del 17 de noviembre se debieron a desdoblamientos inversos: qué muestran los precios ajustadosAviso: Esto no es asesoramiento financiero
El martes 17 de noviembre, el informe de cierre de mercado de Investing.com incluyó a los valores con mejor desempeño del Nasdaq Composite: Lobo Technologies (LOBO), con una subida del 954.08% hasta $3.51; Edible Garden (EDBL), con un alza del 384.31% hasta $2.47; y Forcendra (FCDH), con un aumento del 366.39% hasta $2.56. Si viste esa lista por encima, era comprensible pensar que tres acciones acababan de triplicar su valor o más en un solo día.
Verifiqué cada caso con los anuncios de las empresas y un historial de precios ajustado por desdoblamientos. Las tres habían realizado un desdoblamiento inverso de acciones esa misma semana. Ninguna subió realmente más del 6%. Dos bajaron.
Las tres mayores «subidas» del Nasdaq del 17 de noviembre se debieron a desdoblamientos inversos: qué muestran los precios ajustados
Aviso: Esto no es asesoramiento financiero
El martes 17 de noviembre, el informe de cierre de mercado de Investing.com incluyó a los valores con mejor desempeño del Nasdaq Composite: Lobo Technologies (LOBO), con una subida del 954.08% hasta $3.51; Edible Garden (EDBL), con un alza del 384.31% hasta $2.47; y Forcendra (FCDH), con un aumento del 366.39% hasta $2.56. Si viste esa lista por encima, era comprensible pensar que tres acciones acababan de triplicar su valor o más en un solo día.
Verifiqué cada caso con los anuncios de las empresas y un historial de precios ajustado por desdoblamientos. Las tres habían realizado un desdoblamiento inverso de acciones esa misma semana. Ninguna subió realmente más del 6%. Dos bajaron.
El martes 17 de noviembre, el informe de cierre de mercado de Investing.com incluyó a los valores con mejor desempeño del Nasdaq Composite: Lobo Technologies (LOBO), con una subida del 954.08% hasta $3.51; Edible Garden (EDBL), con un alza del 384.31% hasta $2.47; y Forcendra (FCDH), con un aumento del 366.39% hasta $2.56. Si viste esa lista por encima, era comprensible pensar que tres acciones acababan de triplicar su valor o más en un solo día.
Verifiqué cada caso con los anuncios de las empresas y un historial de precios ajustado por desdoblamientos. Las tres habían realizado un desdoblamiento inverso de acciones esa misma semana. Ninguna subió realmente más del 6%. Dos bajaron.
SNDK-9,65%
FCDHUS+2,53%
2
2.1k

·
--
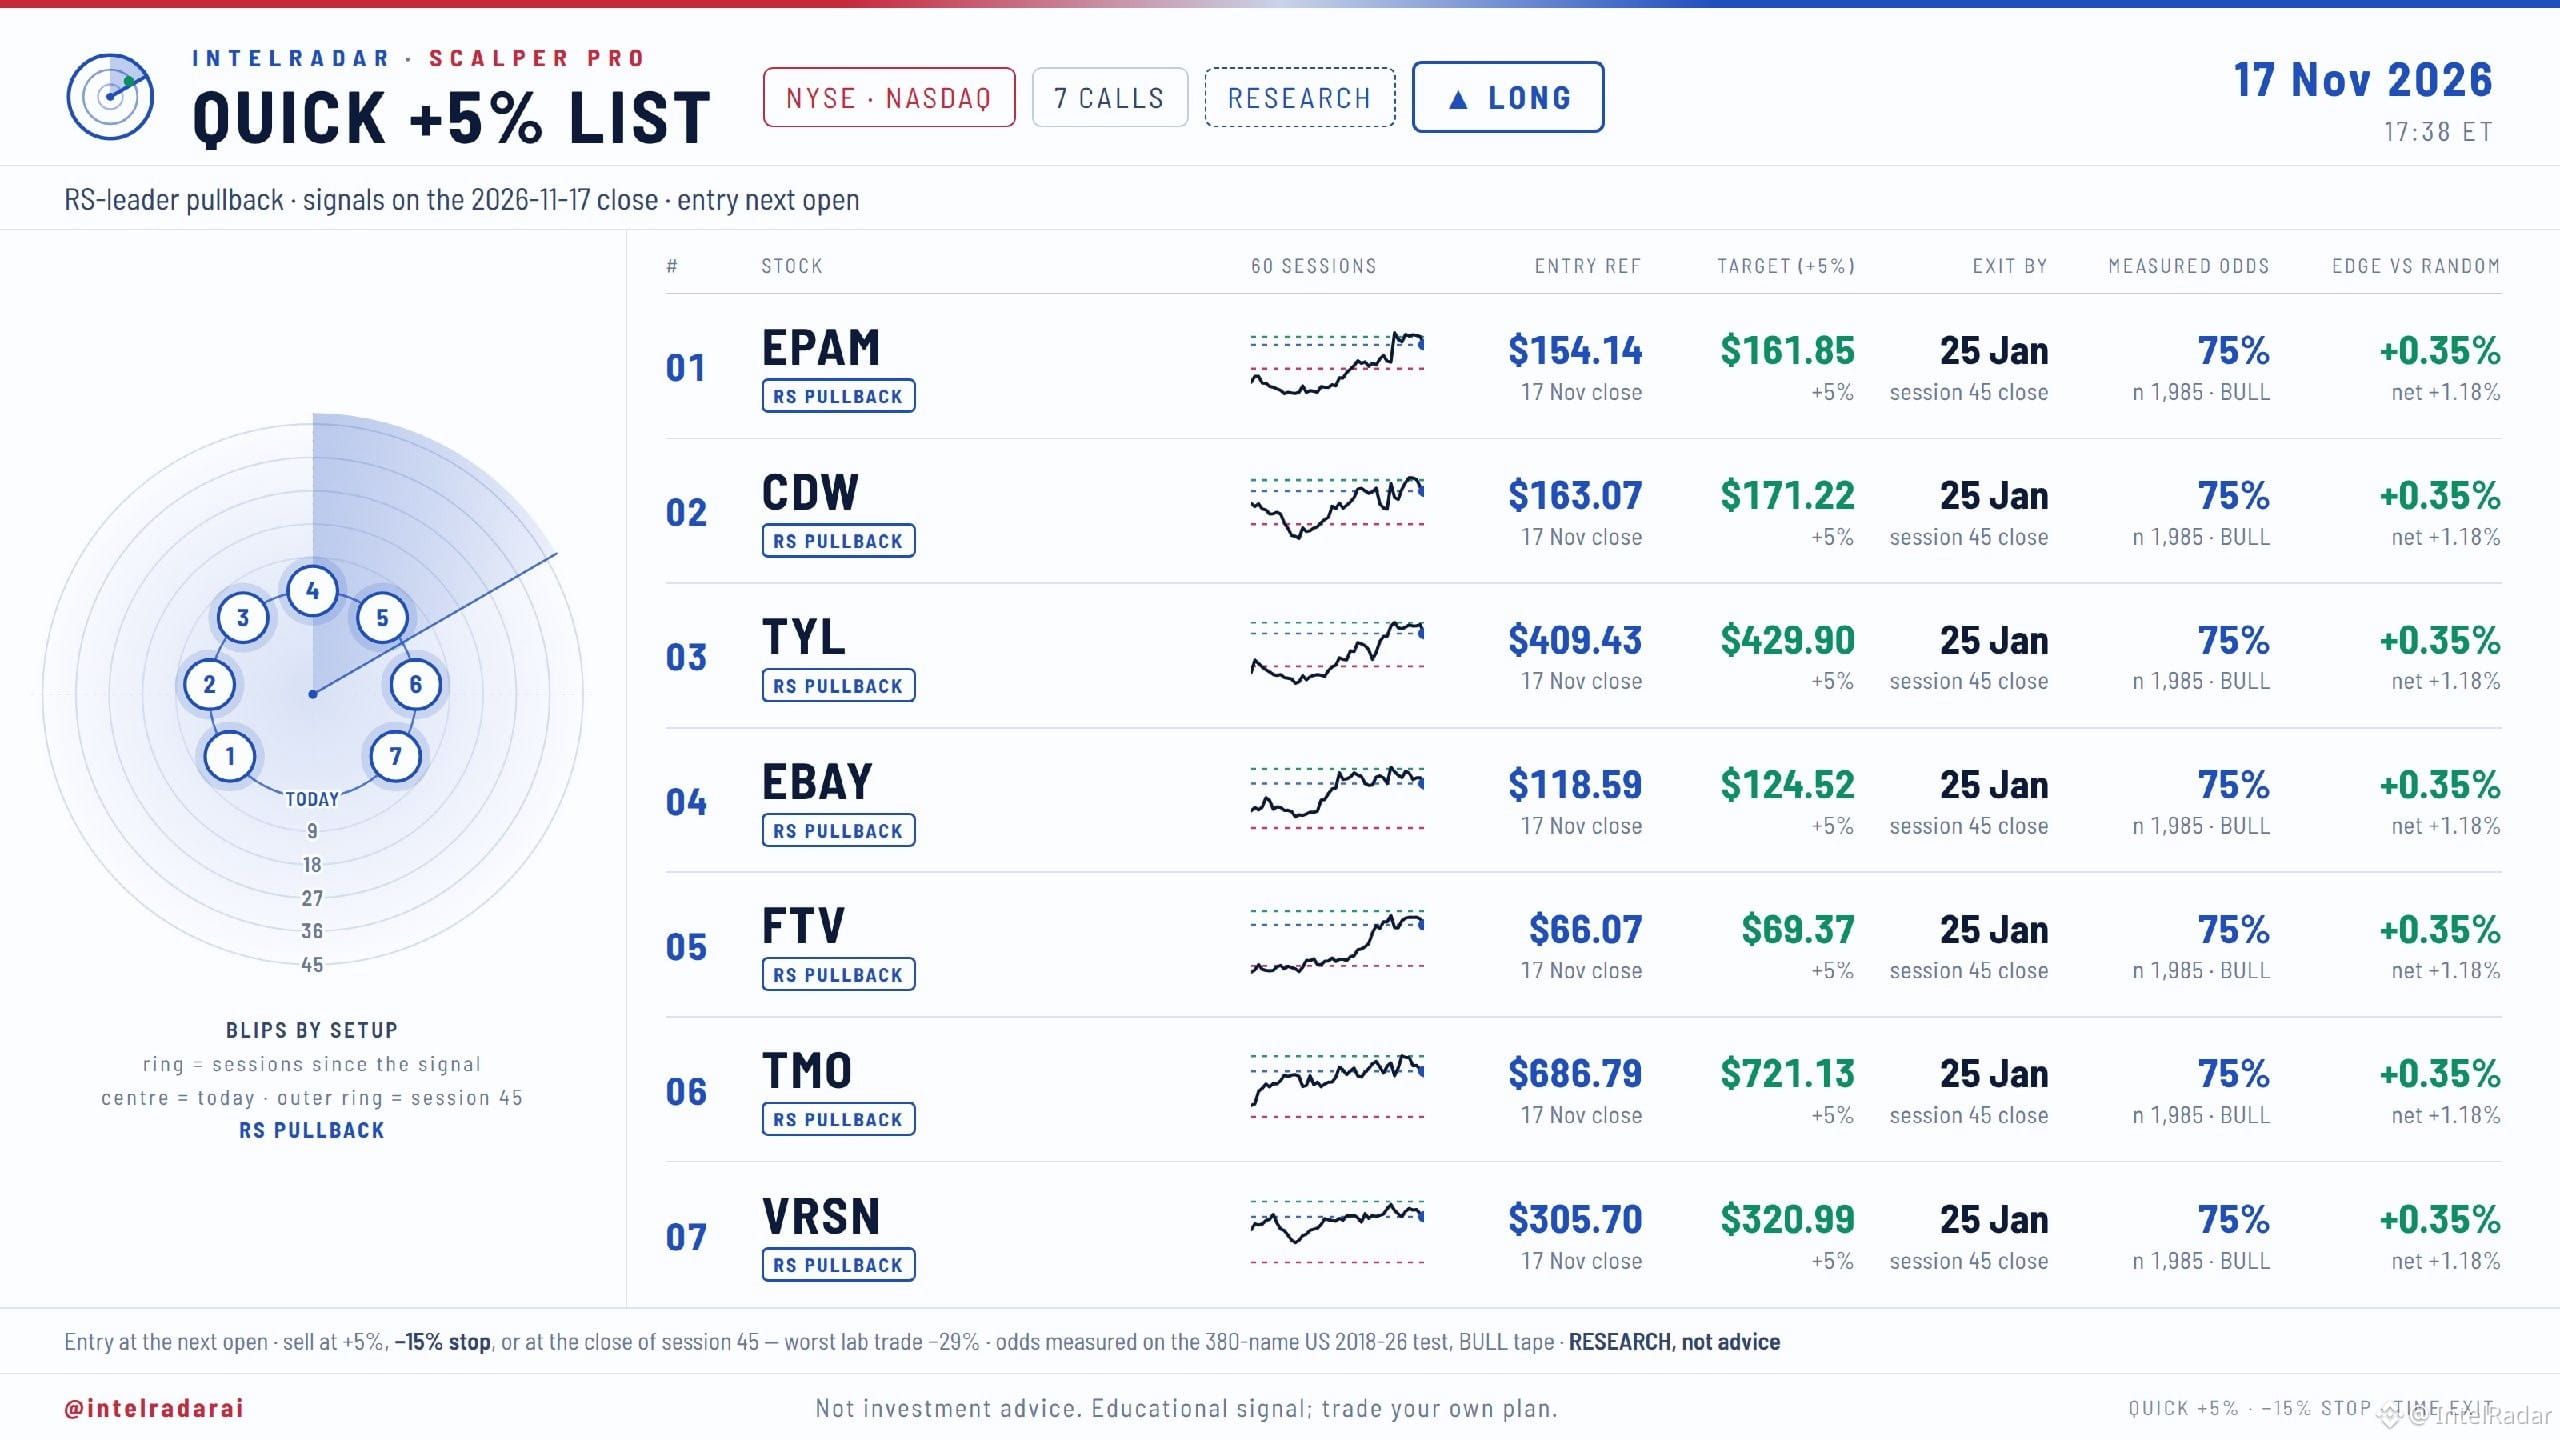
Lista rápida de +5% | cierre del 17 nov
Retrocesos de líderes de fuerza relativa, 7 valores de EE. UU.
Reglas:
Entrada en la próxima apertura
Objetivo +5%
Stop -15%
Salida por tiempo al cierre de la sesión 45 (25 ene)
Referencia de entrada → objetivo:
$EPAM.US 154.14 → 161.85
$CDW.US 163.07 → 171.22
$TYL.US 409.43 → 429.90
$EBAY 118.59 → 124.52
$FTV 66.07 → 69.37
$TMO 686.79 → 721.13
$VRSN 305.70 → 320.99
Probabilidades del patrón (backtest, iguales para los 7):
75% alcanzaron +5%
380 valores, 2018–26, mercado alcista
Peor operación de prueba: -29%
Investigación, no asesoramiento. Backtest, no resultados en vivo.
¿Cuál descartarías y por qué?
#Acciones #USStocks
Lista rápida de +5% | cierre del 17 nov
Retrocesos de líderes de fuerza relativa, 7 valores de EE. UU.
Reglas:
Entrada en la próxima apertura
Objetivo +5%
Stop -15%
Salida por tiempo al cierre de la sesión 45 (25 ene)
Referencia de entrada → objetivo:
$EPAM.US 154.14 → 161.85
$CDW.US 163.07 → 171.22
$TYL.US 409.43 → 429.90
$EBAY 118.59 → 124.52
$FTV 66.07 → 69.37
$TMO 686.79 → 721.13
$VRSN 305.70 → 320.99
Probabilidades del patrón (backtest, iguales para los 7):
75% alcanzaron +5%
380 valores, 2018–26, mercado alcista
Peor operación de prueba: -29%
Investigación, no asesoramiento. Backtest, no resultados en vivo.
¿Cuál descartarías y por qué?
#Acciones #USStocks
Retrocesos de líderes de fuerza relativa, 7 valores de EE. UU.
Reglas:
Entrada en la próxima apertura
Objetivo +5%
Stop -15%
Salida por tiempo al cierre de la sesión 45 (25 ene)
Referencia de entrada → objetivo:
$EPAM.US 154.14 → 161.85
$CDW.US 163.07 → 171.22
$TYL.US 409.43 → 429.90
$EBAY 118.59 → 124.52
$FTV 66.07 → 69.37
$TMO 686.79 → 721.13
$VRSN 305.70 → 320.99
Probabilidades del patrón (backtest, iguales para los 7):
75% alcanzaron +5%
380 valores, 2018–26, mercado alcista
Peor operación de prueba: -29%
Investigación, no asesoramiento. Backtest, no resultados en vivo.
¿Cuál descartarías y por qué?
#Acciones #USStocks
CDWUS-4,50%
EPAMUS-0,38%
TYLUS+0,06%
79
El impulso merece atención cuando varios marcos temporales apuntan en la misma dirección.
Acciones — Mejor rendimiento y tendencia:
$ARM | $AVGO | $CVX | XOM | WMT | RDDT | AAPL | AMZN | DIS | TSLA
Lectura de WPO:
Arm lidera el universo de activos líquidos con un +4.76% en la última sesión monitoreada y un -7.30% en la muestra de cinco sesiones. 3 de las 5 principales acciones están en positivo, por lo que la amplitud es selectiva. El liderazgo se comparte entre el grupo principal; el volumen está en 1.3x de su ritmo reciente.
Compara el movimiento con las noticias de la empresa y el mercado en general antes de actuar.
#wpo_report #USStocks #InvestigaciónDeMercado
El impulso merece atención cuando varios marcos temporales apuntan en la misma dirección.
Acciones — Mejor rendimiento y tendencia:
$ARM | $AVGO | $CVX | XOM | WMT | RDDT | AAPL | AMZN | DIS | TSLA
Lectura de WPO:
Arm lidera el universo de activos líquidos con un +4.76% en la última sesión monitoreada y un -7.30% en la muestra de cinco sesiones. 3 de las 5 principales acciones están en positivo, por lo que la amplitud es selectiva. El liderazgo se comparte entre el grupo principal; el volumen está en 1.3x de su ritmo reciente.
Compara el movimiento con las noticias de la empresa y el mercado en general antes de actuar.
#wpo_report #USStocks #InvestigaciónDeMercado
Acciones — Mejor rendimiento y tendencia:
$ARM | $AVGO | $CVX | XOM | WMT | RDDT | AAPL | AMZN | DIS | TSLA
Lectura de WPO:
Arm lidera el universo de activos líquidos con un +4.76% en la última sesión monitoreada y un -7.30% en la muestra de cinco sesiones. 3 de las 5 principales acciones están en positivo, por lo que la amplitud es selectiva. El liderazgo se comparte entre el grupo principal; el volumen está en 1.3x de su ritmo reciente.
Compara el movimiento con las noticias de la empresa y el mercado en general antes de actuar.
#wpo_report #USStocks #InvestigaciónDeMercado
208
·
--
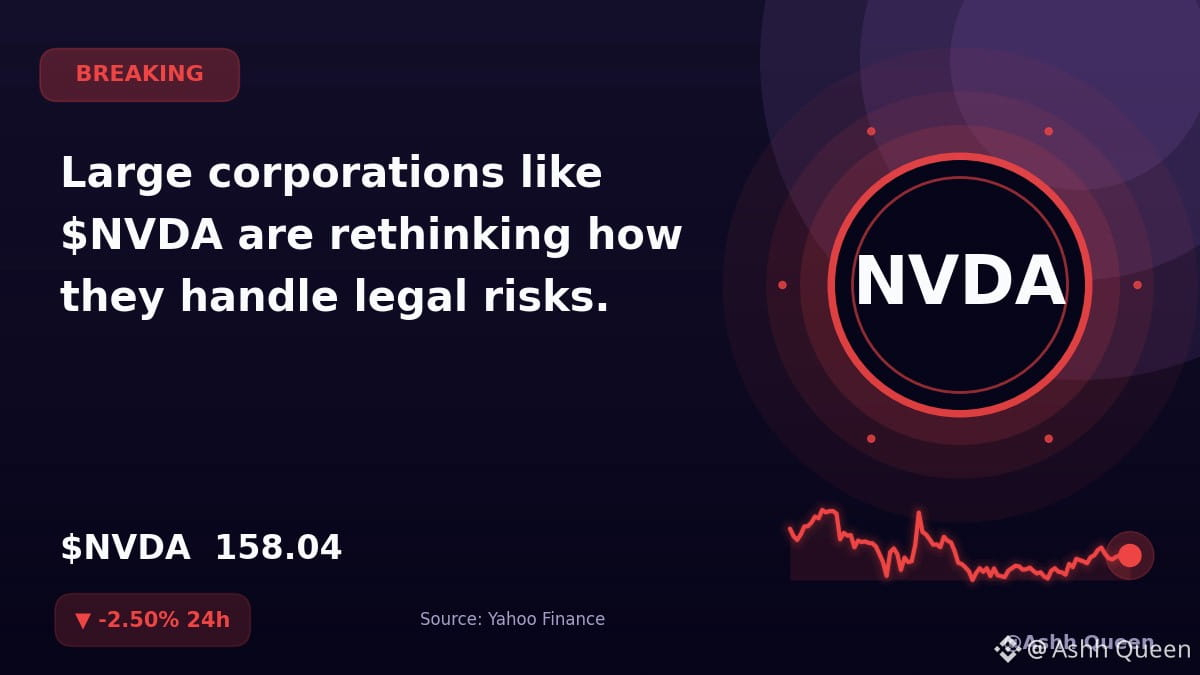
Grandes corporaciones como $NVDA están replanteándose cómo gestionan los riesgos legales.
Yahoo Finance informa que la empresa mantiene $900 millones en seguros de responsabilidad civil para administradores y directivos, pero cubre las demandas de accionistas contra la empresa con sus propias reservas de efectivo.
Los analistas sugieren que este enfoque es una estrategia prudente para una empresa con esta estructura de capital.
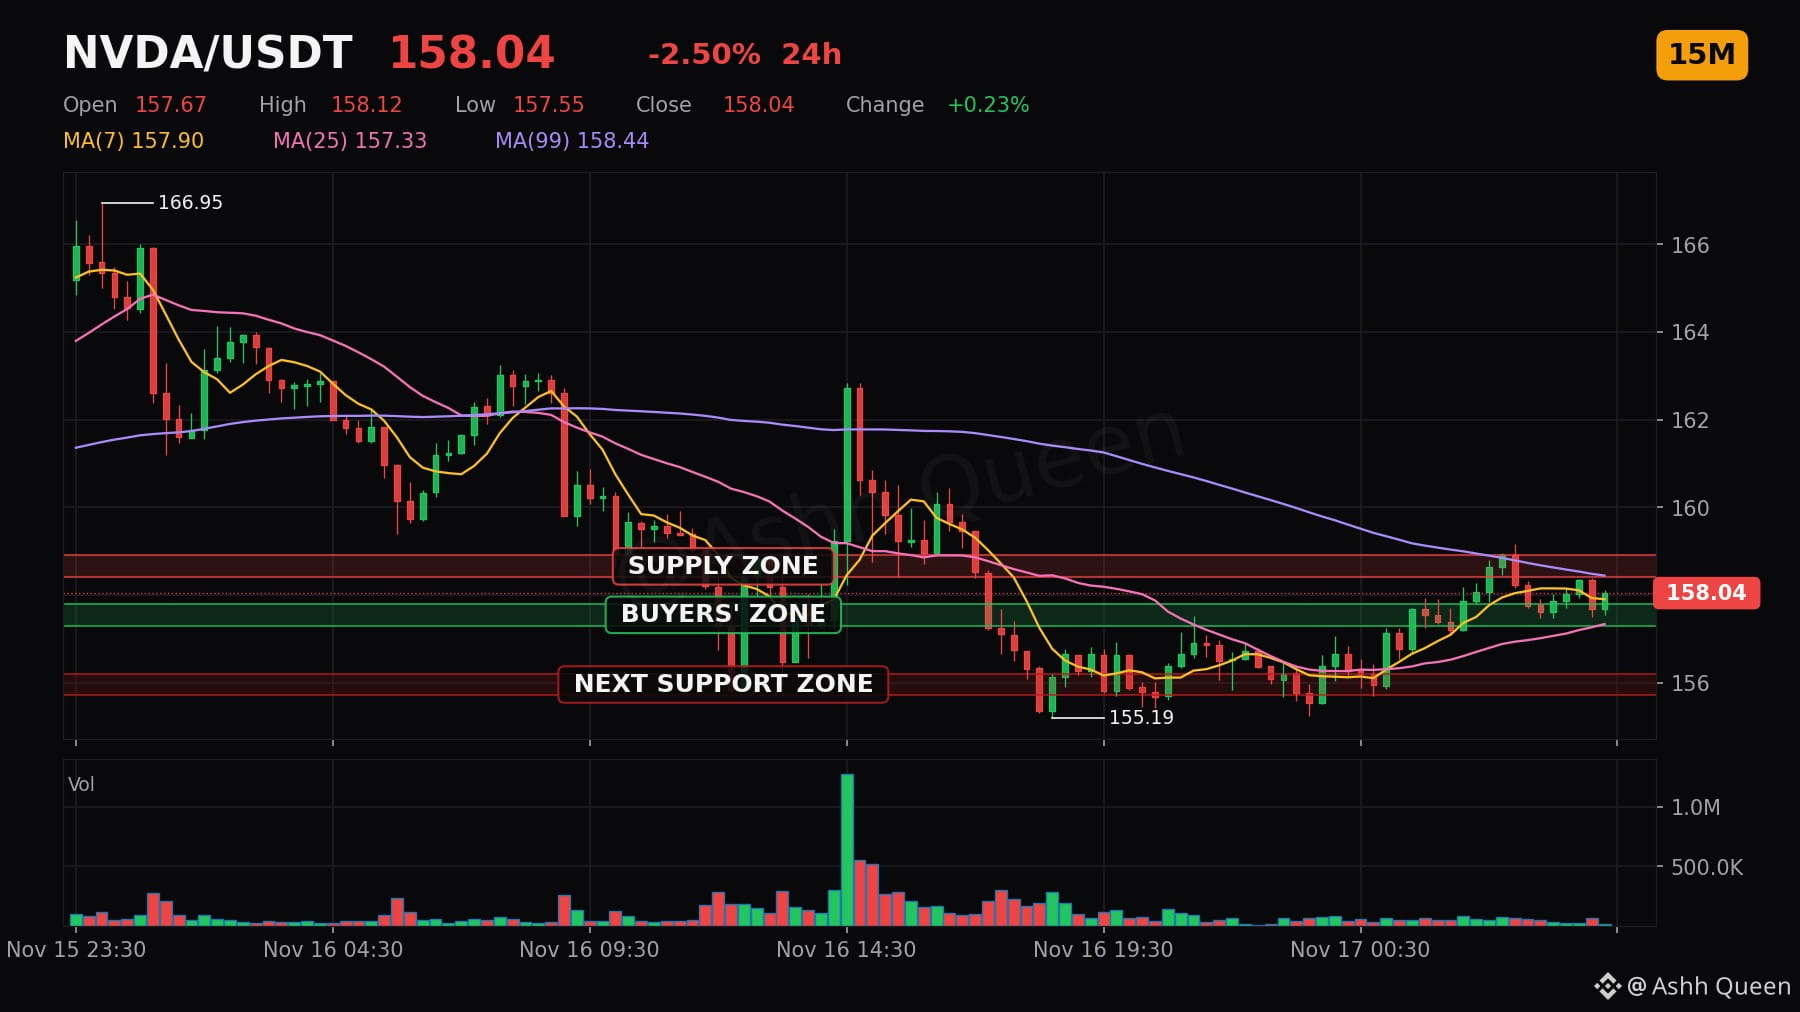
El contrato perpetuo de $NVDA cotiza actualmente a 158.04, con una variación del -2.50% en las últimas 24 h. El precio se mantiene cerca del nivel de soporte de 157.54.
¿Cómo han ajustado su estrategia de gestión de riesgos al tratar con activos que afrontan obstáculos particulares relacionados con litigios corporativos? ⚔️🐂
#NVDA #NVDAStock #USStocks
⚠️ Los contratos perpetuos son derivados apalancados, no la acción ni la materia prima en sí.
Esto no es asesoramiento financiero. Protege tu capital primero; siempre llegará la próxima oportunidad.
Grandes corporaciones como $NVDA están replanteándose cómo gestionan los riesgos legales.
Yahoo Finance informa que la empresa mantiene $900 millones en seguros de responsabilidad civil para administradores y directivos, pero cubre las demandas de accionistas contra la empresa con sus propias reservas de efectivo.
Los analistas sugieren que este enfoque es una estrategia prudente para una empresa con esta estructura de capital.
El contrato perpetuo de $NVDA cotiza actualmente a 158.04, con una variación del -2.50% en las últimas 24 h. El precio se mantiene cerca del nivel de soporte de 157.54.
¿Cómo han ajustado su estrategia de gestión de riesgos al tratar con activos que afrontan obstáculos particulares relacionados con litigios corporativos? ⚔️🐂
#NVDA #NVDAStock #USStocks
⚠️ Los contratos perpetuos son derivados apalancados, no la acción ni la materia prima en sí.
Esto no es asesoramiento financiero. Protege tu capital primero; siempre llegará la próxima oportunidad.
Yahoo Finance informa que la empresa mantiene $900 millones en seguros de responsabilidad civil para administradores y directivos, pero cubre las demandas de accionistas contra la empresa con sus propias reservas de efectivo.
Los analistas sugieren que este enfoque es una estrategia prudente para una empresa con esta estructura de capital.
El contrato perpetuo de $NVDA cotiza actualmente a 158.04, con una variación del -2.50% en las últimas 24 h. El precio se mantiene cerca del nivel de soporte de 157.54.
¿Cómo han ajustado su estrategia de gestión de riesgos al tratar con activos que afrontan obstáculos particulares relacionados con litigios corporativos? ⚔️🐂
#NVDA #NVDAStock #USStocks
⚠️ Los contratos perpetuos son derivados apalancados, no la acción ni la materia prima en sí.
Esto no es asesoramiento financiero. Protege tu capital primero; siempre llegará la próxima oportunidad.
7
·
--
Verificado
Artículo
Ver traducción
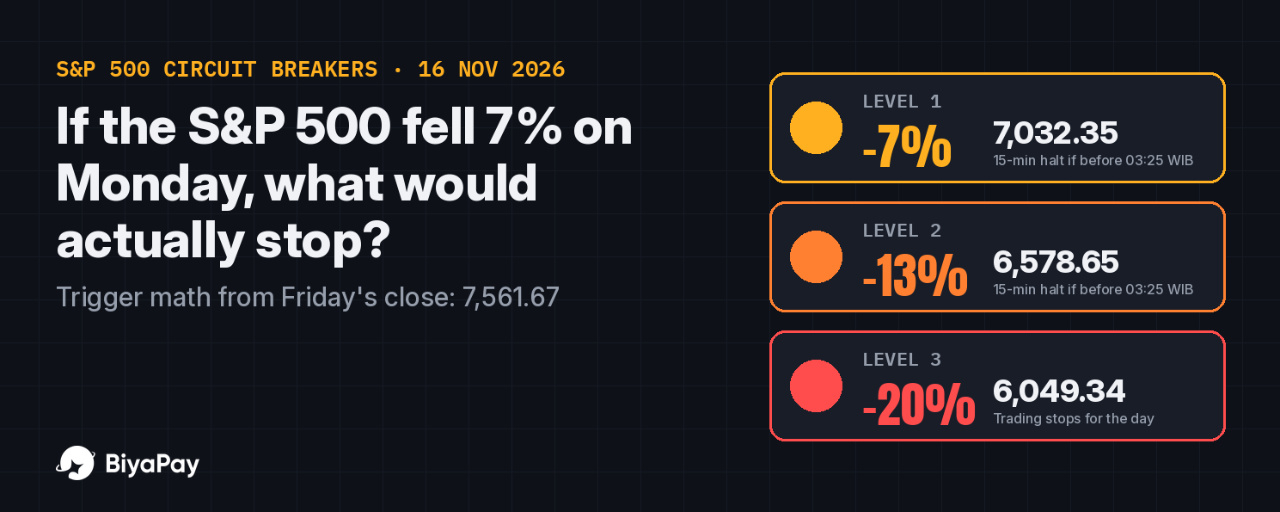
If the S&P 500 Fell 7% on Monday, What Would Actually Stop? Circuit-Breaker Math at 7,561Disclosure: It is not financial advice.
Friday was a reminder that "the market is up for the week" and "my screen is calm" are two different things. On Friday 13 November 2026 the S&P 500 lost 0.40% to close at 7,561.67, the Nasdaq Composite fell 0.91%, and the Philadelphia Semiconductor Index dropped 3.4%. AMD fell 8.8% and Broadcom 4.8% in a single session, according to Reuters. The VIX rose to 19.35 (Anadolu Agency), the 10-year Treasury yield sat above 5.1%, and traders were pricing a December Fed hike as close to certain.
None of that was a crash. But it is exactly the kind of week where I hear a comforting myth: "If things get really bad, the exchange halts trading, so I'll have time to react." That is only partly true. Circuit breakers exist, but they trigger at specific levels, at specific times, and only inside a specific session. If you hold US stocks from Indonesia, the timing part matters more than most people think.
So let's do the math with Friday's real closing number.
How the market-wide circuit breaker works
US exchanges use three Market-Wide Circuit Breaker (MWCB) levels. They are measured as a single-day decline in the S&P 500 against the previous day's close, and the trigger points are recalculated every day (NYSE trading information page; SEC Investor.gov glossary):
- Level 1: a 7% fall. Trading halts market-wide for 15 minutes, but only if it happens before 3:25 p.m. ET.
- Level 2: a 13% fall. Another 15-minute halt, again only before 3:25 p.m. ET.
- Level 3: a 20% fall. Trading stops for the rest of the day, at any time.
Those same three levels apply to US shares you hold through any broker, including BiyaPay.
Worked numbers from Friday's close
Because Friday's close was 7,561.67, Monday's (16 November) trigger levels work out to:
Level 1 (−7%): 7,032.35, a drop of 529.32 pointsLevel 2 (−13%): 6,578.65, a drop of 983.02 pointsLevel 3 (−20%): 6,049.34, a drop of 1,512.33 points
Put that into a portfolio. If you had $1,000 tracking the S&P 500, the first pause arrives only after you are down about $70. The second comes at about −$130, and the full-day stop at about −$200. A circuit breaker does not prevent those losses. It just pauses trading after they happen.
Now convert the clock. The US moved back to standard time on 1 November, so Eastern Time is UTC−5 and Jakarta (WIB, UTC+7) is 12 hours ahead. The regular session runs 21:30–04:00 WIB. The 3:25 p.m. ET cut-off is 03:25 WIB. A 7% or 13% fall that arrives after 03:25 WIB does not halt anything. The market simply keeps trading into the close while most of Indonesia is asleep.
The single-stock version: why an 8.8% day is possible
Individual stocks have a different mechanism called Limit Up-Limit Down (LULD). According to Investor.gov, trades cannot happen outside a price band set around the stock's average price over the previous five minutes. If the price stays at the band for 15 seconds, trading in that stock pauses for five minutes. For Tier 1 stocks (S&P 500, Russell 1000 and selected ETPs) priced above $3, the band is 5%. For Tier 2 stocks above $3 it is 10%. The bands double during the last 25 minutes of the regular session for Tier 1 stocks.
A quick example with a $150 stock in Tier 1:
Normal band: $142.50 to $157.50 around the five-minute averageLast 25 minutes (03:35–04:00 WIB): doubled to 10%, so $135 to $165
The key word is "average over the previous five minutes." The band moves with the price. A stock can slide 8.8% over a full session in steady steps without ever touching a band, because each new five-minute reference is already lower. LULD stops sudden spikes. It does not stop a bad day.
When it applies, and when it doesn't
The protection applies:
During the regular session, 9:30 a.m.–4:00 p.m. ET (21:30–04:00 WIB).To the whole market (MWCB) when the S&P 500 itself falls 7%, 13% or 20% from the prior close.To single stocks (LULD) when a move is sudden, relative to the last five minutes.
It does not help:
Outside regular hours. Investor.gov states LULD applies 9:30–4:00 ET, and the MWCB levels are defined around the regular session. BiyaPay, like several brokers, offers night, pre-market and after-hours trading (20:00–04:00, 04:00–09:30 and 16:00–20:00 ET). Those sessions are thinner and move without these bands.With overnight gaps. If bad news lands while the market is closed, the stock can simply open lower. There is no halt between your last price and the open.Late in the day for Levels 1 and 2 (after 03:25 WIB).With slow declines, as in the 8.8% example above.
My opinion
I don't treat circuit breakers as a safety net. I treat them as a traffic light for the whole market. A 15-minute halt does not give me a better price. It gives everyone the same 15 minutes, and the reopening price can be worse. For my own risk planning, a few things matter more. How big is my position? Would a 7% index day or a 10% single-stock day hurt more than I can accept? Am I holding orders through the night sessions, when liquidity is lower? With a December hike nearly priced in and yields above 5%, I would rather size positions for a −7% day than hope a halt saves me from one.
My checklist before holding US stocks through a volatile week
Write down today's Level 1, 2 and 3 points. They are the prior S&P 500 close × 0.93, × 0.87 and × 0.80.Convert the 3:25 p.m. ET cut-off to your time zone (03:25 WIB in standard time).Know whether your stock is Tier 1 (5% LULD band) or Tier 2 (10% band).Assume no protection in pre-market, after-hours or night sessions, and no protection against an opening gap.Use limit orders, not market orders, around reopenings after a halt.Size each position so a 7% market day is uncomfortable, not account-ending.Re-read your platform's help page on trading halts and sessions before you need it, not during the halt.
Sources: Reuters via Moneycontrol, 14 Nov 2026 (index closes, SOX, AMD, Broadcom); Anadolu Agency, 14 Nov 2026 (VIX 19.35, 10-year yield); NYSE Trading Information page, Market-Wide Circuit Breaker and LULD sections (fetched 16 Nov 2026); SEC Investor.gov, "Stock Market Circuit Breakers" (fetched 16 Nov 2026).
#BiyaPay #USStocks #CircuitBreaker #StockMarket
If the S&P 500 Fell 7% on Monday, What Would Actually Stop? Circuit-Breaker Math at 7,561
Disclosure: It is not financial advice.
Friday was a reminder that "the market is up for the week" and "my screen is calm" are two different things. On Friday 13 November 2026 the S&P 500 lost 0.40% to close at 7,561.67, the Nasdaq Composite fell 0.91%, and the Philadelphia Semiconductor Index dropped 3.4%. AMD fell 8.8% and Broadcom 4.8% in a single session, according to Reuters. The VIX rose to 19.35 (Anadolu Agency), the 10-year Treasury yield sat above 5.1%, and traders were pricing a December Fed hike as close to certain.
None of that was a crash. But it is exactly the kind of week where I hear a comforting myth: "If things get really bad, the exchange halts trading, so I'll have time to react." That is only partly true. Circuit breakers exist, but they trigger at specific levels, at specific times, and only inside a specific session. If you hold US stocks from Indonesia, the timing part matters more than most people think.
So let's do the math with Friday's real closing number.
How the market-wide circuit breaker works
US exchanges use three Market-Wide Circuit Breaker (MWCB) levels. They are measured as a single-day decline in the S&P 500 against the previous day's close, and the trigger points are recalculated every day (NYSE trading information page; SEC Investor.gov glossary):
- Level 1: a 7% fall. Trading halts market-wide for 15 minutes, but only if it happens before 3:25 p.m. ET.
- Level 2: a 13% fall. Another 15-minute halt, again only before 3:25 p.m. ET.
- Level 3: a 20% fall. Trading stops for the rest of the day, at any time.
Those same three levels apply to US shares you hold through any broker, including BiyaPay.
Worked numbers from Friday's close
Because Friday's close was 7,561.67, Monday's (16 November) trigger levels work out to:
Level 1 (−7%): 7,032.35, a drop of 529.32 pointsLevel 2 (−13%): 6,578.65, a drop of 983.02 pointsLevel 3 (−20%): 6,049.34, a drop of 1,512.33 points
Put that into a portfolio. If you had $1,000 tracking the S&P 500, the first pause arrives only after you are down about $70. The second comes at about −$130, and the full-day stop at about −$200. A circuit breaker does not prevent those losses. It just pauses trading after they happen.
Now convert the clock. The US moved back to standard time on 1 November, so Eastern Time is UTC−5 and Jakarta (WIB, UTC+7) is 12 hours ahead. The regular session runs 21:30–04:00 WIB. The 3:25 p.m. ET cut-off is 03:25 WIB. A 7% or 13% fall that arrives after 03:25 WIB does not halt anything. The market simply keeps trading into the close while most of Indonesia is asleep.
The single-stock version: why an 8.8% day is possible
Individual stocks have a different mechanism called Limit Up-Limit Down (LULD). According to Investor.gov, trades cannot happen outside a price band set around the stock's average price over the previous five minutes. If the price stays at the band for 15 seconds, trading in that stock pauses for five minutes. For Tier 1 stocks (S&P 500, Russell 1000 and selected ETPs) priced above $3, the band is 5%. For Tier 2 stocks above $3 it is 10%. The bands double during the last 25 minutes of the regular session for Tier 1 stocks.
A quick example with a $150 stock in Tier 1:
Normal band: $142.50 to $157.50 around the five-minute averageLast 25 minutes (03:35–04:00 WIB): doubled to 10%, so $135 to $165
The key word is "average over the previous five minutes." The band moves with the price. A stock can slide 8.8% over a full session in steady steps without ever touching a band, because each new five-minute reference is already lower. LULD stops sudden spikes. It does not stop a bad day.
When it applies, and when it doesn't
The protection applies:
During the regular session, 9:30 a.m.–4:00 p.m. ET (21:30–04:00 WIB).To the whole market (MWCB) when the S&P 500 itself falls 7%, 13% or 20% from the prior close.To single stocks (LULD) when a move is sudden, relative to the last five minutes.
It does not help:
Outside regular hours. Investor.gov states LULD applies 9:30–4:00 ET, and the MWCB levels are defined around the regular session. BiyaPay, like several brokers, offers night, pre-market and after-hours trading (20:00–04:00, 04:00–09:30 and 16:00–20:00 ET). Those sessions are thinner and move without these bands.With overnight gaps. If bad news lands while the market is closed, the stock can simply open lower. There is no halt between your last price and the open.Late in the day for Levels 1 and 2 (after 03:25 WIB).With slow declines, as in the 8.8% example above.
My opinion
I don't treat circuit breakers as a safety net. I treat them as a traffic light for the whole market. A 15-minute halt does not give me a better price. It gives everyone the same 15 minutes, and the reopening price can be worse. For my own risk planning, a few things matter more. How big is my position? Would a 7% index day or a 10% single-stock day hurt more than I can accept? Am I holding orders through the night sessions, when liquidity is lower? With a December hike nearly priced in and yields above 5%, I would rather size positions for a −7% day than hope a halt saves me from one.
My checklist before holding US stocks through a volatile week
Write down today's Level 1, 2 and 3 points. They are the prior S&P 500 close × 0.93, × 0.87 and × 0.80.Convert the 3:25 p.m. ET cut-off to your time zone (03:25 WIB in standard time).Know whether your stock is Tier 1 (5% LULD band) or Tier 2 (10% band).Assume no protection in pre-market, after-hours or night sessions, and no protection against an opening gap.Use limit orders, not market orders, around reopenings after a halt.Size each position so a 7% market day is uncomfortable, not account-ending.Re-read your platform's help page on trading halts and sessions before you need it, not during the halt.
Sources: Reuters via Moneycontrol, 14 Nov 2026 (index closes, SOX, AMD, Broadcom); Anadolu Agency, 14 Nov 2026 (VIX 19.35, 10-year yield); NYSE Trading Information page, Market-Wide Circuit Breaker and LULD sections (fetched 16 Nov 2026); SEC Investor.gov, "Stock Market Circuit Breakers" (fetched 16 Nov 2026).
#BiyaPay #USStocks #CircuitBreaker #StockMarket
Friday was a reminder that "the market is up for the week" and "my screen is calm" are two different things. On Friday 13 November 2026 the S&P 500 lost 0.40% to close at 7,561.67, the Nasdaq Composite fell 0.91%, and the Philadelphia Semiconductor Index dropped 3.4%. AMD fell 8.8% and Broadcom 4.8% in a single session, according to Reuters. The VIX rose to 19.35 (Anadolu Agency), the 10-year Treasury yield sat above 5.1%, and traders were pricing a December Fed hike as close to certain.
None of that was a crash. But it is exactly the kind of week where I hear a comforting myth: "If things get really bad, the exchange halts trading, so I'll have time to react." That is only partly true. Circuit breakers exist, but they trigger at specific levels, at specific times, and only inside a specific session. If you hold US stocks from Indonesia, the timing part matters more than most people think.
So let's do the math with Friday's real closing number.
How the market-wide circuit breaker works
US exchanges use three Market-Wide Circuit Breaker (MWCB) levels. They are measured as a single-day decline in the S&P 500 against the previous day's close, and the trigger points are recalculated every day (NYSE trading information page; SEC Investor.gov glossary):
- Level 1: a 7% fall. Trading halts market-wide for 15 minutes, but only if it happens before 3:25 p.m. ET.
- Level 2: a 13% fall. Another 15-minute halt, again only before 3:25 p.m. ET.
- Level 3: a 20% fall. Trading stops for the rest of the day, at any time.
Those same three levels apply to US shares you hold through any broker, including BiyaPay.
Worked numbers from Friday's close
Because Friday's close was 7,561.67, Monday's (16 November) trigger levels work out to:
Level 1 (−7%): 7,032.35, a drop of 529.32 pointsLevel 2 (−13%): 6,578.65, a drop of 983.02 pointsLevel 3 (−20%): 6,049.34, a drop of 1,512.33 points
Put that into a portfolio. If you had $1,000 tracking the S&P 500, the first pause arrives only after you are down about $70. The second comes at about −$130, and the full-day stop at about −$200. A circuit breaker does not prevent those losses. It just pauses trading after they happen.
Now convert the clock. The US moved back to standard time on 1 November, so Eastern Time is UTC−5 and Jakarta (WIB, UTC+7) is 12 hours ahead. The regular session runs 21:30–04:00 WIB. The 3:25 p.m. ET cut-off is 03:25 WIB. A 7% or 13% fall that arrives after 03:25 WIB does not halt anything. The market simply keeps trading into the close while most of Indonesia is asleep.
The single-stock version: why an 8.8% day is possible
Individual stocks have a different mechanism called Limit Up-Limit Down (LULD). According to Investor.gov, trades cannot happen outside a price band set around the stock's average price over the previous five minutes. If the price stays at the band for 15 seconds, trading in that stock pauses for five minutes. For Tier 1 stocks (S&P 500, Russell 1000 and selected ETPs) priced above $3, the band is 5%. For Tier 2 stocks above $3 it is 10%. The bands double during the last 25 minutes of the regular session for Tier 1 stocks.
A quick example with a $150 stock in Tier 1:
Normal band: $142.50 to $157.50 around the five-minute averageLast 25 minutes (03:35–04:00 WIB): doubled to 10%, so $135 to $165
The key word is "average over the previous five minutes." The band moves with the price. A stock can slide 8.8% over a full session in steady steps without ever touching a band, because each new five-minute reference is already lower. LULD stops sudden spikes. It does not stop a bad day.
When it applies, and when it doesn't
The protection applies:
During the regular session, 9:30 a.m.–4:00 p.m. ET (21:30–04:00 WIB).To the whole market (MWCB) when the S&P 500 itself falls 7%, 13% or 20% from the prior close.To single stocks (LULD) when a move is sudden, relative to the last five minutes.
It does not help:
Outside regular hours. Investor.gov states LULD applies 9:30–4:00 ET, and the MWCB levels are defined around the regular session. BiyaPay, like several brokers, offers night, pre-market and after-hours trading (20:00–04:00, 04:00–09:30 and 16:00–20:00 ET). Those sessions are thinner and move without these bands.With overnight gaps. If bad news lands while the market is closed, the stock can simply open lower. There is no halt between your last price and the open.Late in the day for Levels 1 and 2 (after 03:25 WIB).With slow declines, as in the 8.8% example above.
My opinion
I don't treat circuit breakers as a safety net. I treat them as a traffic light for the whole market. A 15-minute halt does not give me a better price. It gives everyone the same 15 minutes, and the reopening price can be worse. For my own risk planning, a few things matter more. How big is my position? Would a 7% index day or a 10% single-stock day hurt more than I can accept? Am I holding orders through the night sessions, when liquidity is lower? With a December hike nearly priced in and yields above 5%, I would rather size positions for a −7% day than hope a halt saves me from one.
My checklist before holding US stocks through a volatile week
Write down today's Level 1, 2 and 3 points. They are the prior S&P 500 close × 0.93, × 0.87 and × 0.80.Convert the 3:25 p.m. ET cut-off to your time zone (03:25 WIB in standard time).Know whether your stock is Tier 1 (5% LULD band) or Tier 2 (10% band).Assume no protection in pre-market, after-hours or night sessions, and no protection against an opening gap.Use limit orders, not market orders, around reopenings after a halt.Size each position so a 7% market day is uncomfortable, not account-ending.Re-read your platform's help page on trading halts and sessions before you need it, not during the halt.
Sources: Reuters via Moneycontrol, 14 Nov 2026 (index closes, SOX, AMD, Broadcom); Anadolu Agency, 14 Nov 2026 (VIX 19.35, 10-year yield); NYSE Trading Information page, Market-Wide Circuit Breaker and LULD sections (fetched 16 Nov 2026); SEC Investor.gov, "Stock Market Circuit Breakers" (fetched 16 Nov 2026).
#BiyaPay #USStocks #CircuitBreaker #StockMarket
596
La cinta más sólida combina rendimiento, participación y continuidad.
Acciones — Mejor rendimiento y tendencia:
$META | $CVX | $WMT | LLY | UBER | JPM | XOM | BAC | DIS | AAPL
Lectura de WPO:
Meta Platforms lidera el universo líquido con +2.90% en la última sesión monitoreada y +0.58% durante la muestra de cinco sesiones. Los 5 principales valores están en positivo, así que la amplitud es amplia. El liderazgo se reparte entre los principales valores; el volumen está a 1.3 veces su ritmo reciente.
El impulso puede revertirse rápidamente, así que la confirmación importa más que el entusiasmo.
#wpo_report #USStocks #InvestigaciónDeMercado
La cinta más sólida combina rendimiento, participación y continuidad.
Acciones — Mejor rendimiento y tendencia:
$META | $CVX | $WMT | LLY | UBER | JPM | XOM | BAC | DIS | AAPL
Lectura de WPO:
Meta Platforms lidera el universo líquido con +2.90% en la última sesión monitoreada y +0.58% durante la muestra de cinco sesiones. Los 5 principales valores están en positivo, así que la amplitud es amplia. El liderazgo se reparte entre los principales valores; el volumen está a 1.3 veces su ritmo reciente.
El impulso puede revertirse rápidamente, así que la confirmación importa más que el entusiasmo.
#wpo_report #USStocks #InvestigaciónDeMercado
Acciones — Mejor rendimiento y tendencia:
$META | $CVX | $WMT | LLY | UBER | JPM | XOM | BAC | DIS | AAPL
Lectura de WPO:
Meta Platforms lidera el universo líquido con +2.90% en la última sesión monitoreada y +0.58% durante la muestra de cinco sesiones. Los 5 principales valores están en positivo, así que la amplitud es amplia. El liderazgo se reparte entre los principales valores; el volumen está a 1.3 veces su ritmo reciente.
El impulso puede revertirse rápidamente, así que la confirmación importa más que el entusiasmo.
#wpo_report #USStocks #InvestigaciónDeMercado
222
·
--
Verificado
Artículo
Ver traducción
Five Stocks or One Index ETF? What Friday's Chip Sell-Off Means for a $1,000 AccountDisclosure: It is not financial advice
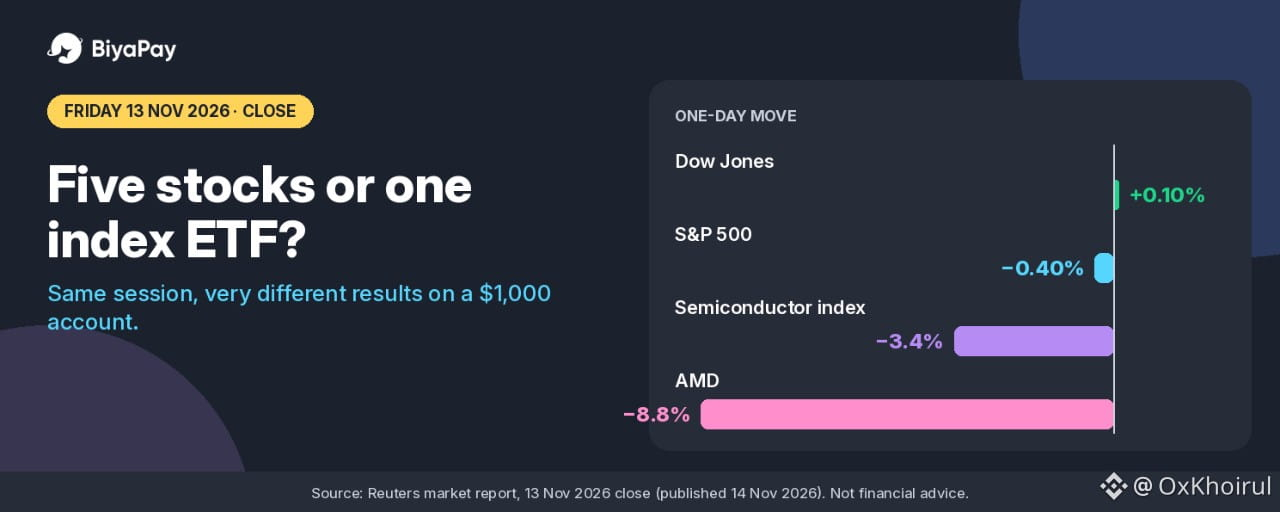
On Friday, 13 November 2026, the S&P 500 closed down 0.40 percent. On the same day, Advanced Micro Devices fell 8.8 percent, Broadcom fell 4.8 percent, and the Philadelphia Semiconductor Index fell 3.4 percent, according to Reuters. The Dow Jones Industrial Average actually closed 0.10 percent higher.
Same market, same session, very different results. The gap between those numbers is the whole argument of this article.
A common piece of advice for small accounts is "just split your money across five stocks and you are diversified." A second one is "buy one index ETF, it is always the cheaper choice." Friday's numbers, and the fee arithmetic on a 1,000 dollar account, suggest both claims are only half true.
This is a worked comparison using official and reputable figures, with a 1,000 dollar example that is an illustration, not a suggested order size.
What one session did to 1,000 dollars
Take 1,000 dollars and put it to work three different ways, using Friday's actual closing moves.
All of it in one chip stock that fell 8.8 percent: the position loses 88 dollars in one session.
Split into five equal 200 dollar positions, where one of them is that same stock and the other four are unchanged: the account loses 17.60 dollars, or 1.76 percent. The one bad position still hurts, but it is one fifth of the damage.
All of it tracking the S&P 500, which fell 0.40 percent: the account loses about 4 dollars, before any tracking difference or fund costs.
That middle case comes with a catch that is easy to miss. "Five stocks" only spreads risk if the five stocks do not all react to the same news. Five chip names are closer to one bet with five tickers. On Friday the semiconductor index as a whole fell 3.4 percent, which on 1,000 dollars is 34 dollars, more than eight times the S&P 500's move.
The index does not avoid chip stocks either
The opposite mistake is to think an index fund simply sidesteps a sector sell-off. It does not. It holds the sector at whatever weight the index gives it.
State Street's official page for the SPDR S&P 500 ETF Trust (SPY), with holdings as of 12 November 2026, lists the index weight of Nvidia at 6.15 percent and Broadcom at 2.65 percent. Information Technology is 36.15 percent of the index.
A rough contribution estimate: Nvidia fell 2 percent on Friday and Broadcom fell 4.8 percent, according to Reuters. At those weights, Nvidia's move takes about 0.12 percentage points off the index, and Broadcom's takes about 0.13 points. Together that is roughly 0.25 points of the index's 0.40 percent decline, from just two companies. Weights shift during the day, so treat this as an approximation, not an official attribution.
So the index ETF did not dodge Friday. It diluted it. That is a real difference, but it is not immunity. In a broad market decline the index falls too, and with 36 percent in technology, a tech-led sell-off reaches an index holder more than the word "diversified" suggests.
What order fees add to a $1,000 account
Here is where the "five stocks" approach has a cost that a 1,000 dollar account feels more than a large one.
On BiyaPay, US stock commission is 0 dollars, while the platform fee is 0.005 dollars per share, with a minimum of 0.99 dollars per order and a maximum of 1 percent of the transaction value. External institution fees, trading activity fees, and sell-related items are added on top of the platform fee. Some US stocks on BiyaPay support fractional trading: an order below one share is charged a 1 percent platform fee capped at 1 dollar, with no commission and no external institution fees.
On small orders the per-share calculation is usually below the minimum, so the 0.99 dollar minimum is what applies. On a 200 dollar order, 1 percent is 2 dollars, so the cap does not bring it lower. Using only that platform-fee minimum:
One order of 1,000 dollars: 0.99 dollars to buy, 1.98 dollars to buy and later sell. That is about 0.2 percent of the account for the round trip.
Five orders of 200 dollars: 4.95 dollars to buy, 9.90 dollars to buy and later sell. That is about 0.99 percent of the account, five times as much, before any external fees.
Now scale the same split to 10,000 dollars. If each order is still under 198 shares, so the per-share calculation stays below the minimum, five orders of 2,000 dollars still cost 9.90 dollars for a round trip, which is about 0.1 percent of the account. The fee did not change. The account size did.
The index ETF has its own cost, and it is a different kind. State Street lists SPY's gross expense ratio at 0.0945 percent a year, as of 14 November 2026. On 1,000 dollars that is about 0.95 dollars a year, taken inside the fund rather than charged per order. It is small, but it repeats every year you hold, while an order fee is paid once per trade.
There is one more practical detail. SPY closed at 757.12 dollars on 12 November 2026, according to State Street. A 1,000 dollar account can buy one whole share and has about 243 dollars left over, which is below one share and would be a fractional order.
So the choice is not only about risk. It is also about how many orders a 1,000 dollar account has to pay for.
When five single stocks make sense, and when they do not
Five single stocks can make sense when:
The account is large enough that the minimum fee is a small slice of each position. At 0.99 dollars per order, a 495 dollar position keeps the minimum at about 0.2 percent per side.
The five companies are genuinely different businesses that do not move on the same headline. A bank, a retailer, a drug maker, an energy company, and a software company spread risk. Five chip makers do not.
You actually want to avoid what the index is heavy in. With 36 percent of the S&P 500 in technology, someone who wants less tech exposure cannot get that from the index alone.
They make less sense when:
The account is small and every position is under a few hundred dollars. The minimum fee then becomes a meaningful percentage before the stock has moved at all.
The five picks are really one theme. That is concentration with extra fees.
You plan to rebalance or trade often. Each trade on each name pays the minimum again.
And the index ETF is not automatically right either. It cannot outperform the market it tracks, it charges an annual expense ratio, and it fell on Friday along with everything it holds.
My view
In my view, the first 1,000 dollars of a US stock account is not the place to build a five-stock portfolio. The numbers say the five-order version costs about five times as much in platform-fee minimums, and the protection it buys depends entirely on whether the five stocks are truly different. Friday showed what happens when they are not.
I would rather start with one broad position, accept that it holds tech at the index weight, and add single names only when each new position is large enough that the 0.99 dollar minimum stays near 0.2 percent per side. That works out to roughly 500 dollars per position or more. That is a rule I would set for myself.
A short checklist I would use before splitting money across stocks:
Divide 0.99 by the planned position size. If the result is above about 0.2 percent per side, the position is small relative to the minimum fee.Ask whether the stocks would all fall on the same headline. If yes, count them as one bet.If using an index ETF, read its official holdings and sector weights, so you know what it already contains.
Sources: Reuters market report on 13 November 2026 trading, published 14 November 2026; State Street Investment Management, SPDR S&P 500 ETF Trust (SPY) page: top holdings and sector weights as of 12 November 2026, closing price as of 12 November 2026, gross expense ratio as of 14 November 2026. All checked on 15 November 2026 (Asia/Jakarta, UTC+7).
#BiyaPay #USStocks #ETF
Five Stocks or One Index ETF? What Friday's Chip Sell-Off Means for a $1,000 Account
Disclosure: It is not financial advice
On Friday, 13 November 2026, the S&P 500 closed down 0.40 percent. On the same day, Advanced Micro Devices fell 8.8 percent, Broadcom fell 4.8 percent, and the Philadelphia Semiconductor Index fell 3.4 percent, according to Reuters. The Dow Jones Industrial Average actually closed 0.10 percent higher.
Same market, same session, very different results. The gap between those numbers is the whole argument of this article.
A common piece of advice for small accounts is "just split your money across five stocks and you are diversified." A second one is "buy one index ETF, it is always the cheaper choice." Friday's numbers, and the fee arithmetic on a 1,000 dollar account, suggest both claims are only half true.
This is a worked comparison using official and reputable figures, with a 1,000 dollar example that is an illustration, not a suggested order size.
What one session did to 1,000 dollars
Take 1,000 dollars and put it to work three different ways, using Friday's actual closing moves.
All of it in one chip stock that fell 8.8 percent: the position loses 88 dollars in one session.
Split into five equal 200 dollar positions, where one of them is that same stock and the other four are unchanged: the account loses 17.60 dollars, or 1.76 percent. The one bad position still hurts, but it is one fifth of the damage.
All of it tracking the S&P 500, which fell 0.40 percent: the account loses about 4 dollars, before any tracking difference or fund costs.
That middle case comes with a catch that is easy to miss. "Five stocks" only spreads risk if the five stocks do not all react to the same news. Five chip names are closer to one bet with five tickers. On Friday the semiconductor index as a whole fell 3.4 percent, which on 1,000 dollars is 34 dollars, more than eight times the S&P 500's move.
The index does not avoid chip stocks either
The opposite mistake is to think an index fund simply sidesteps a sector sell-off. It does not. It holds the sector at whatever weight the index gives it.
State Street's official page for the SPDR S&P 500 ETF Trust (SPY), with holdings as of 12 November 2026, lists the index weight of Nvidia at 6.15 percent and Broadcom at 2.65 percent. Information Technology is 36.15 percent of the index.
A rough contribution estimate: Nvidia fell 2 percent on Friday and Broadcom fell 4.8 percent, according to Reuters. At those weights, Nvidia's move takes about 0.12 percentage points off the index, and Broadcom's takes about 0.13 points. Together that is roughly 0.25 points of the index's 0.40 percent decline, from just two companies. Weights shift during the day, so treat this as an approximation, not an official attribution.
So the index ETF did not dodge Friday. It diluted it. That is a real difference, but it is not immunity. In a broad market decline the index falls too, and with 36 percent in technology, a tech-led sell-off reaches an index holder more than the word "diversified" suggests.
What order fees add to a $1,000 account
Here is where the "five stocks" approach has a cost that a 1,000 dollar account feels more than a large one.
On BiyaPay, US stock commission is 0 dollars, while the platform fee is 0.005 dollars per share, with a minimum of 0.99 dollars per order and a maximum of 1 percent of the transaction value. External institution fees, trading activity fees, and sell-related items are added on top of the platform fee. Some US stocks on BiyaPay support fractional trading: an order below one share is charged a 1 percent platform fee capped at 1 dollar, with no commission and no external institution fees.
On small orders the per-share calculation is usually below the minimum, so the 0.99 dollar minimum is what applies. On a 200 dollar order, 1 percent is 2 dollars, so the cap does not bring it lower. Using only that platform-fee minimum:
One order of 1,000 dollars: 0.99 dollars to buy, 1.98 dollars to buy and later sell. That is about 0.2 percent of the account for the round trip.
Five orders of 200 dollars: 4.95 dollars to buy, 9.90 dollars to buy and later sell. That is about 0.99 percent of the account, five times as much, before any external fees.
Now scale the same split to 10,000 dollars. If each order is still under 198 shares, so the per-share calculation stays below the minimum, five orders of 2,000 dollars still cost 9.90 dollars for a round trip, which is about 0.1 percent of the account. The fee did not change. The account size did.
The index ETF has its own cost, and it is a different kind. State Street lists SPY's gross expense ratio at 0.0945 percent a year, as of 14 November 2026. On 1,000 dollars that is about 0.95 dollars a year, taken inside the fund rather than charged per order. It is small, but it repeats every year you hold, while an order fee is paid once per trade.
There is one more practical detail. SPY closed at 757.12 dollars on 12 November 2026, according to State Street. A 1,000 dollar account can buy one whole share and has about 243 dollars left over, which is below one share and would be a fractional order.
So the choice is not only about risk. It is also about how many orders a 1,000 dollar account has to pay for.
When five single stocks make sense, and when they do not
Five single stocks can make sense when:
The account is large enough that the minimum fee is a small slice of each position. At 0.99 dollars per order, a 495 dollar position keeps the minimum at about 0.2 percent per side.
The five companies are genuinely different businesses that do not move on the same headline. A bank, a retailer, a drug maker, an energy company, and a software company spread risk. Five chip makers do not.
You actually want to avoid what the index is heavy in. With 36 percent of the S&P 500 in technology, someone who wants less tech exposure cannot get that from the index alone.
They make less sense when:
The account is small and every position is under a few hundred dollars. The minimum fee then becomes a meaningful percentage before the stock has moved at all.
The five picks are really one theme. That is concentration with extra fees.
You plan to rebalance or trade often. Each trade on each name pays the minimum again.
And the index ETF is not automatically right either. It cannot outperform the market it tracks, it charges an annual expense ratio, and it fell on Friday along with everything it holds.
My view
In my view, the first 1,000 dollars of a US stock account is not the place to build a five-stock portfolio. The numbers say the five-order version costs about five times as much in platform-fee minimums, and the protection it buys depends entirely on whether the five stocks are truly different. Friday showed what happens when they are not.
I would rather start with one broad position, accept that it holds tech at the index weight, and add single names only when each new position is large enough that the 0.99 dollar minimum stays near 0.2 percent per side. That works out to roughly 500 dollars per position or more. That is a rule I would set for myself.
A short checklist I would use before splitting money across stocks:
Divide 0.99 by the planned position size. If the result is above about 0.2 percent per side, the position is small relative to the minimum fee.Ask whether the stocks would all fall on the same headline. If yes, count them as one bet.If using an index ETF, read its official holdings and sector weights, so you know what it already contains.
Sources: Reuters market report on 13 November 2026 trading, published 14 November 2026; State Street Investment Management, SPDR S&P 500 ETF Trust (SPY) page: top holdings and sector weights as of 12 November 2026, closing price as of 12 November 2026, gross expense ratio as of 14 November 2026. All checked on 15 November 2026 (Asia/Jakarta, UTC+7).
#BiyaPay #USStocks #ETF
On Friday, 13 November 2026, the S&P 500 closed down 0.40 percent. On the same day, Advanced Micro Devices fell 8.8 percent, Broadcom fell 4.8 percent, and the Philadelphia Semiconductor Index fell 3.4 percent, according to Reuters. The Dow Jones Industrial Average actually closed 0.10 percent higher.
Same market, same session, very different results. The gap between those numbers is the whole argument of this article.
A common piece of advice for small accounts is "just split your money across five stocks and you are diversified." A second one is "buy one index ETF, it is always the cheaper choice." Friday's numbers, and the fee arithmetic on a 1,000 dollar account, suggest both claims are only half true.
This is a worked comparison using official and reputable figures, with a 1,000 dollar example that is an illustration, not a suggested order size.
What one session did to 1,000 dollars
Take 1,000 dollars and put it to work three different ways, using Friday's actual closing moves.
All of it in one chip stock that fell 8.8 percent: the position loses 88 dollars in one session.
Split into five equal 200 dollar positions, where one of them is that same stock and the other four are unchanged: the account loses 17.60 dollars, or 1.76 percent. The one bad position still hurts, but it is one fifth of the damage.
All of it tracking the S&P 500, which fell 0.40 percent: the account loses about 4 dollars, before any tracking difference or fund costs.
That middle case comes with a catch that is easy to miss. "Five stocks" only spreads risk if the five stocks do not all react to the same news. Five chip names are closer to one bet with five tickers. On Friday the semiconductor index as a whole fell 3.4 percent, which on 1,000 dollars is 34 dollars, more than eight times the S&P 500's move.
The index does not avoid chip stocks either
The opposite mistake is to think an index fund simply sidesteps a sector sell-off. It does not. It holds the sector at whatever weight the index gives it.
State Street's official page for the SPDR S&P 500 ETF Trust (SPY), with holdings as of 12 November 2026, lists the index weight of Nvidia at 6.15 percent and Broadcom at 2.65 percent. Information Technology is 36.15 percent of the index.
A rough contribution estimate: Nvidia fell 2 percent on Friday and Broadcom fell 4.8 percent, according to Reuters. At those weights, Nvidia's move takes about 0.12 percentage points off the index, and Broadcom's takes about 0.13 points. Together that is roughly 0.25 points of the index's 0.40 percent decline, from just two companies. Weights shift during the day, so treat this as an approximation, not an official attribution.
So the index ETF did not dodge Friday. It diluted it. That is a real difference, but it is not immunity. In a broad market decline the index falls too, and with 36 percent in technology, a tech-led sell-off reaches an index holder more than the word "diversified" suggests.
What order fees add to a $1,000 account
Here is where the "five stocks" approach has a cost that a 1,000 dollar account feels more than a large one.
On BiyaPay, US stock commission is 0 dollars, while the platform fee is 0.005 dollars per share, with a minimum of 0.99 dollars per order and a maximum of 1 percent of the transaction value. External institution fees, trading activity fees, and sell-related items are added on top of the platform fee. Some US stocks on BiyaPay support fractional trading: an order below one share is charged a 1 percent platform fee capped at 1 dollar, with no commission and no external institution fees.
On small orders the per-share calculation is usually below the minimum, so the 0.99 dollar minimum is what applies. On a 200 dollar order, 1 percent is 2 dollars, so the cap does not bring it lower. Using only that platform-fee minimum:
One order of 1,000 dollars: 0.99 dollars to buy, 1.98 dollars to buy and later sell. That is about 0.2 percent of the account for the round trip.
Five orders of 200 dollars: 4.95 dollars to buy, 9.90 dollars to buy and later sell. That is about 0.99 percent of the account, five times as much, before any external fees.
Now scale the same split to 10,000 dollars. If each order is still under 198 shares, so the per-share calculation stays below the minimum, five orders of 2,000 dollars still cost 9.90 dollars for a round trip, which is about 0.1 percent of the account. The fee did not change. The account size did.
The index ETF has its own cost, and it is a different kind. State Street lists SPY's gross expense ratio at 0.0945 percent a year, as of 14 November 2026. On 1,000 dollars that is about 0.95 dollars a year, taken inside the fund rather than charged per order. It is small, but it repeats every year you hold, while an order fee is paid once per trade.
There is one more practical detail. SPY closed at 757.12 dollars on 12 November 2026, according to State Street. A 1,000 dollar account can buy one whole share and has about 243 dollars left over, which is below one share and would be a fractional order.
So the choice is not only about risk. It is also about how many orders a 1,000 dollar account has to pay for.
When five single stocks make sense, and when they do not
Five single stocks can make sense when:
The account is large enough that the minimum fee is a small slice of each position. At 0.99 dollars per order, a 495 dollar position keeps the minimum at about 0.2 percent per side.
The five companies are genuinely different businesses that do not move on the same headline. A bank, a retailer, a drug maker, an energy company, and a software company spread risk. Five chip makers do not.
You actually want to avoid what the index is heavy in. With 36 percent of the S&P 500 in technology, someone who wants less tech exposure cannot get that from the index alone.
They make less sense when:
The account is small and every position is under a few hundred dollars. The minimum fee then becomes a meaningful percentage before the stock has moved at all.
The five picks are really one theme. That is concentration with extra fees.
You plan to rebalance or trade often. Each trade on each name pays the minimum again.
And the index ETF is not automatically right either. It cannot outperform the market it tracks, it charges an annual expense ratio, and it fell on Friday along with everything it holds.
My view
In my view, the first 1,000 dollars of a US stock account is not the place to build a five-stock portfolio. The numbers say the five-order version costs about five times as much in platform-fee minimums, and the protection it buys depends entirely on whether the five stocks are truly different. Friday showed what happens when they are not.
I would rather start with one broad position, accept that it holds tech at the index weight, and add single names only when each new position is large enough that the 0.99 dollar minimum stays near 0.2 percent per side. That works out to roughly 500 dollars per position or more. That is a rule I would set for myself.
A short checklist I would use before splitting money across stocks:
Divide 0.99 by the planned position size. If the result is above about 0.2 percent per side, the position is small relative to the minimum fee.Ask whether the stocks would all fall on the same headline. If yes, count them as one bet.If using an index ETF, read its official holdings and sector weights, so you know what it already contains.
Sources: Reuters market report on 13 November 2026 trading, published 14 November 2026; State Street Investment Management, SPDR S&P 500 ETF Trust (SPY) page: top holdings and sector weights as of 12 November 2026, closing price as of 12 November 2026, gross expense ratio as of 14 November 2026. All checked on 15 November 2026 (Asia/Jakarta, UTC+7).
#BiyaPay #USStocks #ETF
475
·
--
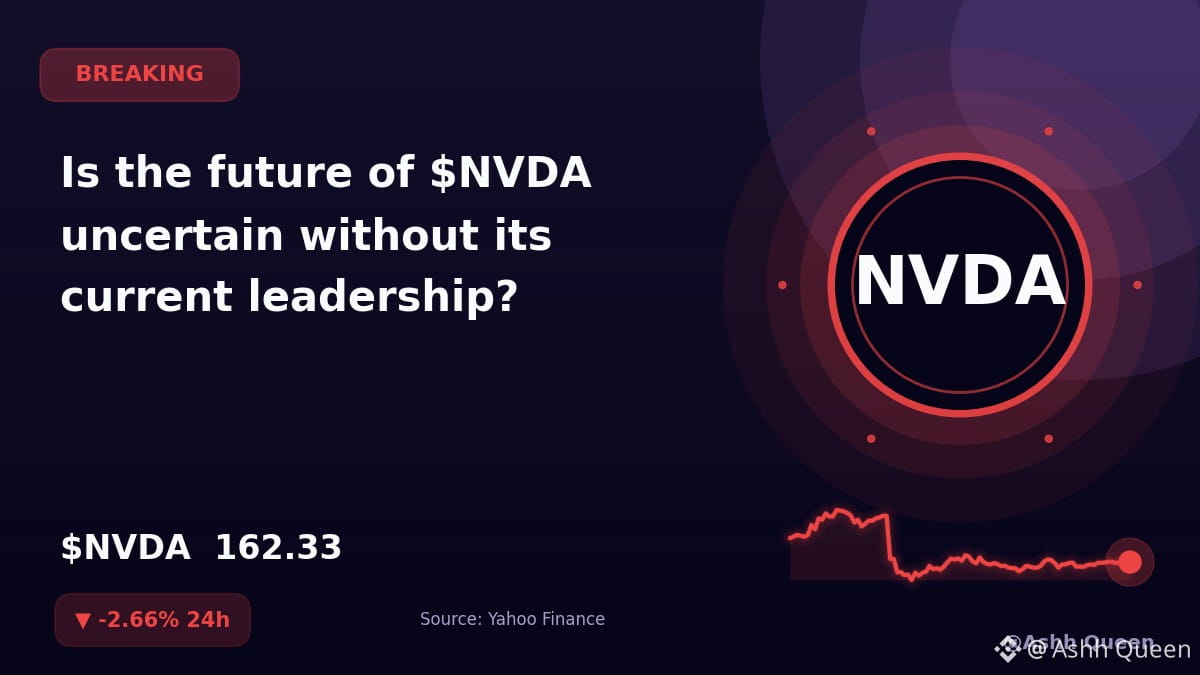
¿Es incierto el futuro de $NVDA sin su actual liderazgo?
Yahoo Finance informa que el valor de las acciones de la empresa cayó casi un 13 % esta semana. Mientras tanto, Decrypt señala que, según se informa, la junta directiva se ha acercado al director ejecutivo de Arm como posible sucesor de Jensen Huang.
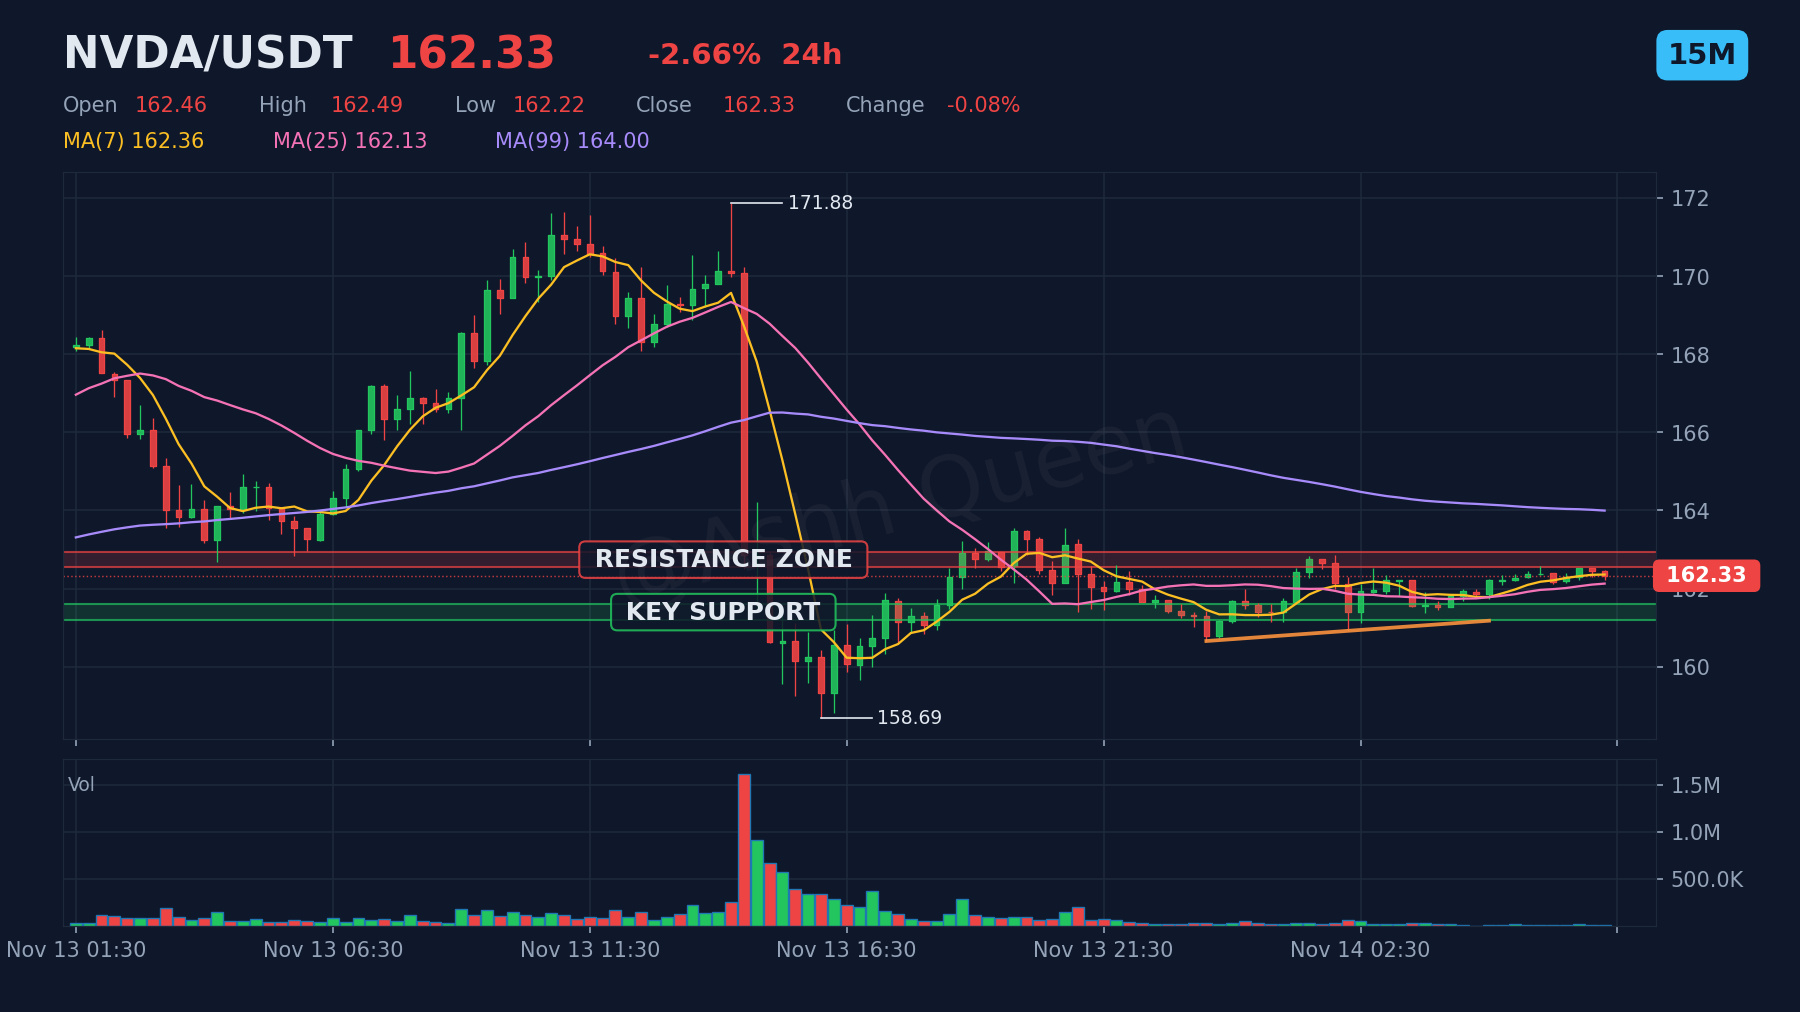
Puedes seguir este contrato perpetuo a un precio de 162.33, con una variación en 24 h de -2.66 %. El nivel de soporte actual se sitúa en 161.40.
⚠️ 🧐
¿Prefieres operar este contrato perpetuo en un plazo corto o más largo?
#NVDA #USStocks #Acciones
⚠️ Los contratos perpetuos son derivados apalancados, no son la acción ni la materia prima en sí.
Esto es un análisis, no una recomendación. Gestiona el riesgo primero y las ganancias después.
¿Es incierto el futuro de $NVDA sin su actual liderazgo?
Yahoo Finance informa que el valor de las acciones de la empresa cayó casi un 13 % esta semana. Mientras tanto, Decrypt señala que, según se informa, la junta directiva se ha acercado al director ejecutivo de Arm como posible sucesor de Jensen Huang.
Puedes seguir este contrato perpetuo a un precio de 162.33, con una variación en 24 h de -2.66 %. El nivel de soporte actual se sitúa en 161.40.
⚠️ 🧐
¿Prefieres operar este contrato perpetuo en un plazo corto o más largo?
#NVDA #USStocks #Acciones
⚠️ Los contratos perpetuos son derivados apalancados, no son la acción ni la materia prima en sí.
Esto es un análisis, no una recomendación. Gestiona el riesgo primero y las ganancias después.
Yahoo Finance informa que el valor de las acciones de la empresa cayó casi un 13 % esta semana. Mientras tanto, Decrypt señala que, según se informa, la junta directiva se ha acercado al director ejecutivo de Arm como posible sucesor de Jensen Huang.
Puedes seguir este contrato perpetuo a un precio de 162.33, con una variación en 24 h de -2.66 %. El nivel de soporte actual se sitúa en 161.40.
⚠️ 🧐
¿Prefieres operar este contrato perpetuo en un plazo corto o más largo?
#NVDA #USStocks #Acciones
⚠️ Los contratos perpetuos son derivados apalancados, no son la acción ni la materia prima en sí.
Esto es un análisis, no una recomendación. Gestiona el riesgo primero y las ganancias después.
53
·
--
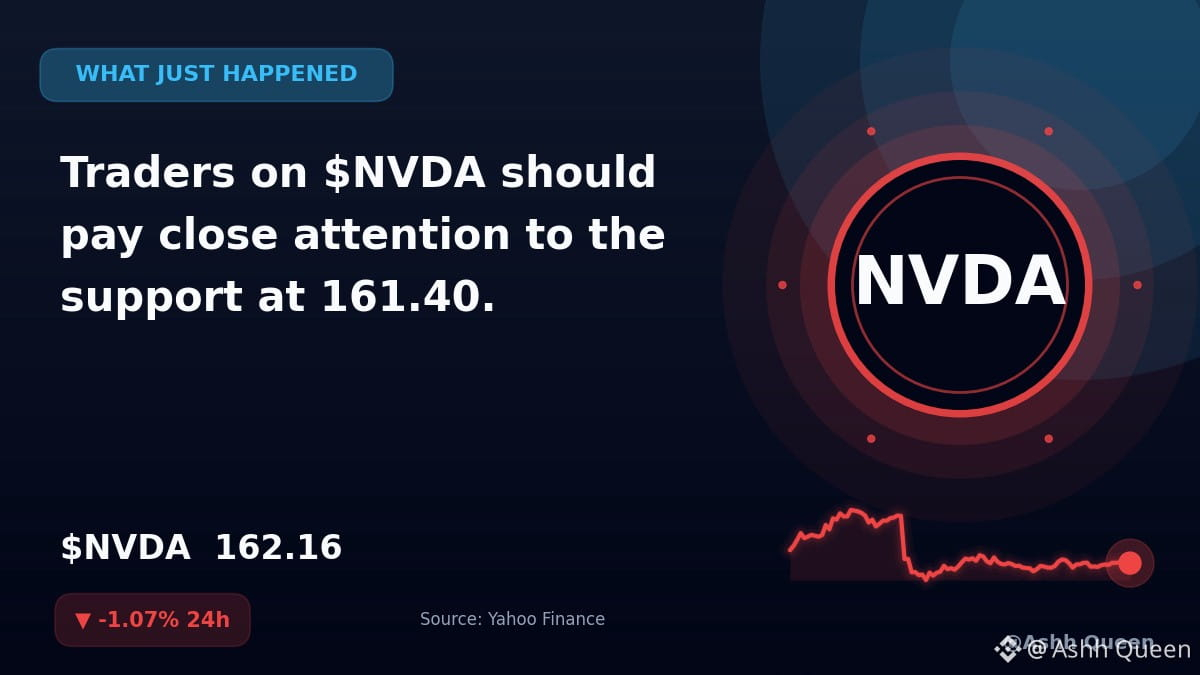
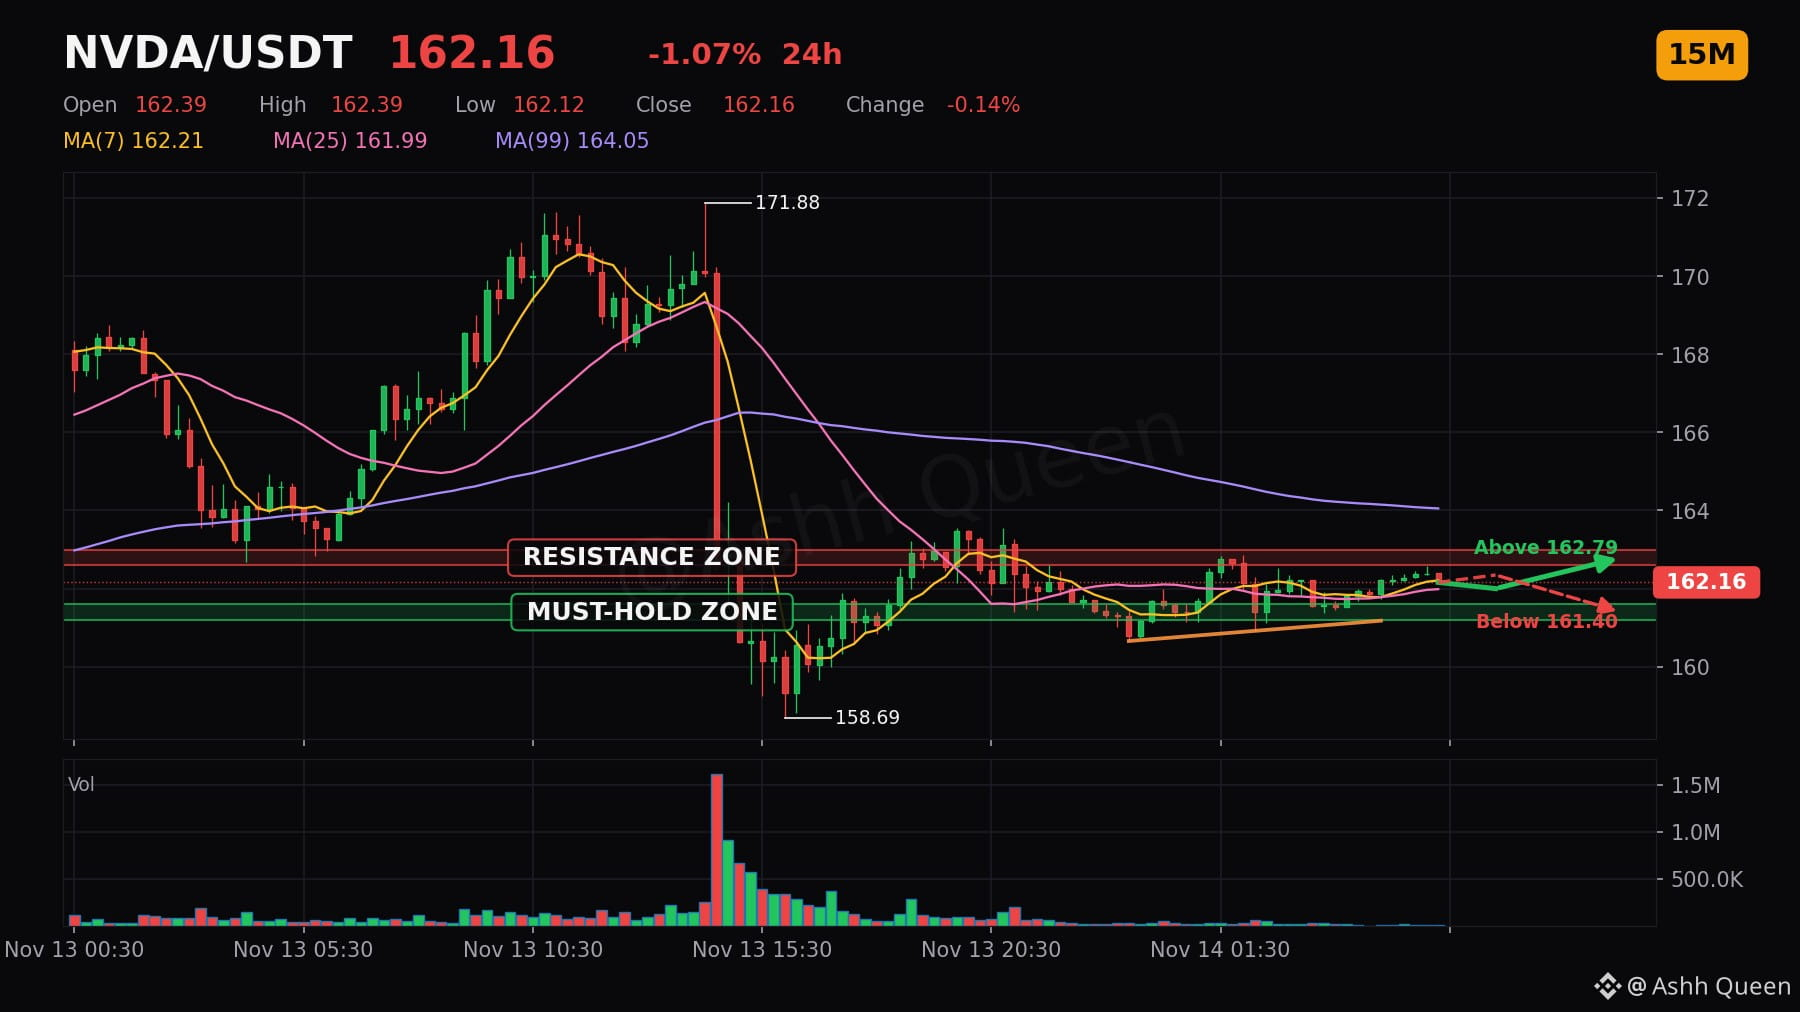
Los operadores de $NVDA deberían prestar mucha atención al soporte en 161.40.
Según Yahoo Finance, la firma de Jim Simons ha cerrado su posición en el fabricante de chips. Informes del mismo medio indican que la firma reveló participaciones de varios miles de millones de dólares en otras acciones tecnológicas.
El contrato perpetuo de $NVDA cotiza actualmente a 162.16, con una variación del -1.07% en 24 h.
📈 📉 📊
¿Qué señal de mercado específica o cambio fundamental modificaría tu perspectiva actual sobre este activo?
#NVDA #NVDAStock #StockMarketNews #AccionesEEUU
⚠️ Los contratos perpetuos son derivados apalancados, no la acción ni la materia prima en sí.
Esto no es asesoramiento financiero. Los mercados son volátiles, así que usa órdenes de stop-loss y arriesga solo lo que puedas permitirte perder.
Los operadores de $NVDA deberían prestar mucha atención al soporte en 161.40.
Según Yahoo Finance, la firma de Jim Simons ha cerrado su posición en el fabricante de chips. Informes del mismo medio indican que la firma reveló participaciones de varios miles de millones de dólares en otras acciones tecnológicas.
El contrato perpetuo de $NVDA cotiza actualmente a 162.16, con una variación del -1.07% en 24 h.
📈 📉 📊
¿Qué señal de mercado específica o cambio fundamental modificaría tu perspectiva actual sobre este activo?
#NVDA #NVDAStock #StockMarketNews #AccionesEEUU
⚠️ Los contratos perpetuos son derivados apalancados, no la acción ni la materia prima en sí.
Esto no es asesoramiento financiero. Los mercados son volátiles, así que usa órdenes de stop-loss y arriesga solo lo que puedas permitirte perder.
Según Yahoo Finance, la firma de Jim Simons ha cerrado su posición en el fabricante de chips. Informes del mismo medio indican que la firma reveló participaciones de varios miles de millones de dólares en otras acciones tecnológicas.
El contrato perpetuo de $NVDA cotiza actualmente a 162.16, con una variación del -1.07% en 24 h.
📈 📉 📊
¿Qué señal de mercado específica o cambio fundamental modificaría tu perspectiva actual sobre este activo?
#NVDA #NVDAStock #StockMarketNews #AccionesEEUU
⚠️ Los contratos perpetuos son derivados apalancados, no la acción ni la materia prima en sí.
Esto no es asesoramiento financiero. Los mercados son volátiles, así que usa órdenes de stop-loss y arriesga solo lo que puedas permitirte perder.
47
·
--
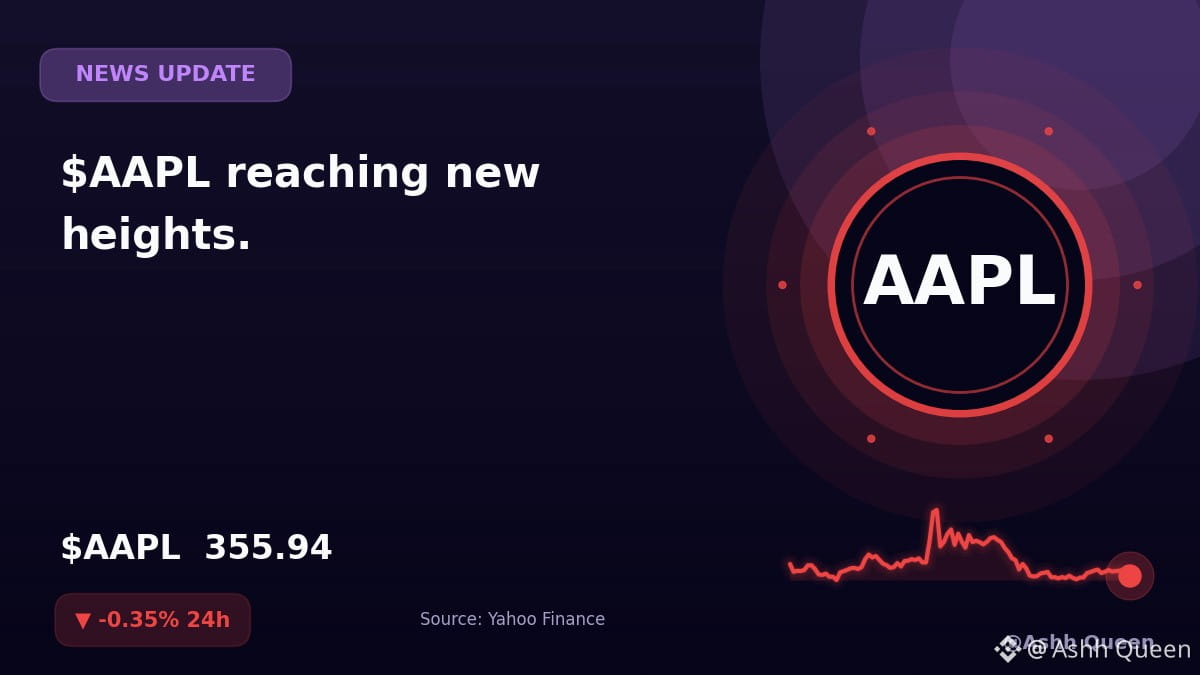
$AAPL alcanzando nuevas alturas.
Yahoo Finance informa que el activo está alcanzando nuevos máximos, aunque las perspectivas sugieren que aún podría haber más potencial alcista.
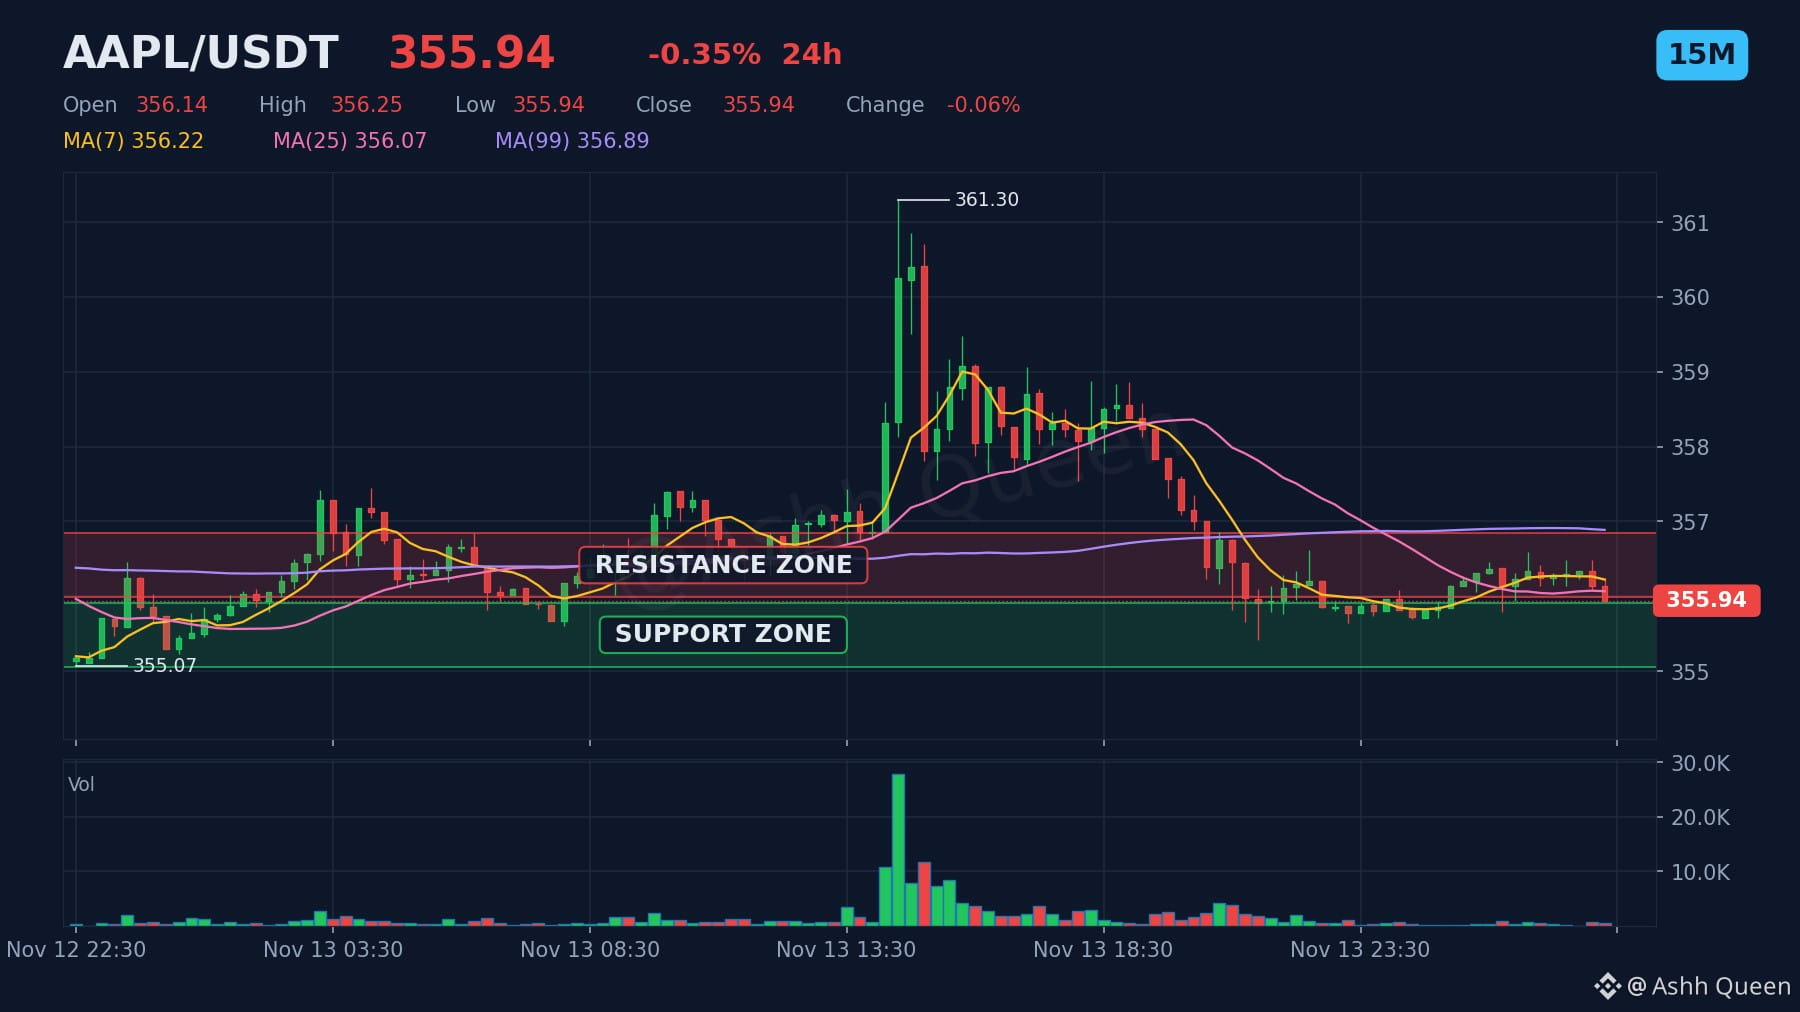
Este contrato perpetuo de AAPLUSDT cotiza actualmente a 355.94, con una variación del -0.35% en 24 h. El nivel de resistencia actual se sitúa en 356.42. 🎯 👀 🧭
¿Qué nivel estás observando en el gráfico y por qué?
#AAPL #AAPLStock #AccionesEEUU
⚠️ Los contratos perpetuos son derivados apalancados, no la acción ni la materia prima en sí.
Esto no es asesoramiento financiero. Los mercados son volátiles, así que utiliza órdenes de stop-loss y arriesga solo lo que puedas permitirte perder.
$AAPL alcanzando nuevas alturas.
Yahoo Finance informa que el activo está alcanzando nuevos máximos, aunque las perspectivas sugieren que aún podría haber más potencial alcista.
Este contrato perpetuo de AAPLUSDT cotiza actualmente a 355.94, con una variación del -0.35% en 24 h. El nivel de resistencia actual se sitúa en 356.42. 🎯 👀 🧭
¿Qué nivel estás observando en el gráfico y por qué?
#AAPL #AAPLStock #AccionesEEUU
⚠️ Los contratos perpetuos son derivados apalancados, no la acción ni la materia prima en sí.
Esto no es asesoramiento financiero. Los mercados son volátiles, así que utiliza órdenes de stop-loss y arriesga solo lo que puedas permitirte perder.
Yahoo Finance informa que el activo está alcanzando nuevos máximos, aunque las perspectivas sugieren que aún podría haber más potencial alcista.
Este contrato perpetuo de AAPLUSDT cotiza actualmente a 355.94, con una variación del -0.35% en 24 h. El nivel de resistencia actual se sitúa en 356.42. 🎯 👀 🧭
¿Qué nivel estás observando en el gráfico y por qué?
#AAPL #AAPLStock #AccionesEEUU
⚠️ Los contratos perpetuos son derivados apalancados, no la acción ni la materia prima en sí.
Esto no es asesoramiento financiero. Los mercados son volátiles, así que utiliza órdenes de stop-loss y arriesga solo lo que puedas permitirte perder.
71
·
--
Verificado
Artículo
Ver traducción
The Fed Meets in December. The 10-Year Yield Is Already Above 5%Disclosure: It is not financial advice
The next Federal Reserve policy meeting is still weeks away. The 10-year US Treasury yield did not wait.
On Tuesday, 10 November 2026, the US Bureau of Labor Statistics reported that the consumer price index rose a seasonally adjusted 0.4 percent in October, above the 0.3 percent increase economists had expected, according to Reuters and CNBC. Core CPI, which excludes food and energy, rose 0.3 percent, also above the forecast. The BLS did not publish a year-over-year inflation rate, because a government shutdown in 2025 left no October comparison base.
The Federal Reserve's policy rate is still in a 3.75 percent to 4.00 percent range, after officials held that range at the October meeting. The next scheduled Federal Open Market Committee meeting is on 8 and 9 December 2026, according to the Federal Reserve's official calendar, last updated on 12 November 2026. It is a meeting associated with a Summary of Economic Projections.
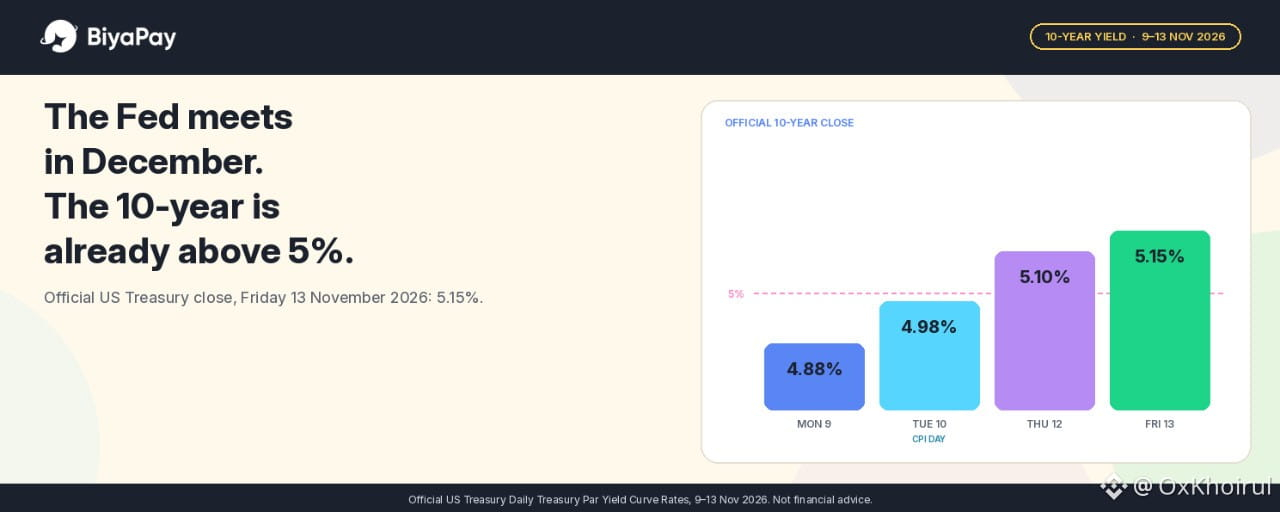
By Friday, 13 November, the official Daily Treasury Par Yield Curve Rate for the 10-year note had closed at 5.15 percent. On Monday, 9 November, that same official series closed at 4.88 percent. That is a rise of 27 basis points in four trading sessions. One basis point is 0.01 percent. From the previous Friday, 6 November, when the 10-year closed at 4.86 percent, the week's move was 29 basis points.
The 10-year crossed 5 percent between the Tuesday close of 4.98 percent, the day of the CPI report, and the Thursday close of 5.10 percent. There is no official daily close on that Treasury series for Wednesday, 11 November. I am using the official daily par yield curve, not an intra-day screen, so these are closing figures.
This piece is a reading of a rate that is already on an official Treasury page, and of what I would put next to a US stock after a week like this.
The policy rate and the 10-year are not the same number
It is easy to treat "the Fed will hike" as the whole story. The policy rate is the overnight federal funds range. A widely discussed 25 basis point increase in December would take that range to 4.00 percent to 4.25 percent, if the Fed chooses that size. That decision has not been made.
The 10-year yield is a longer market rate. It already closed at 5.15 percent on Friday, which is above both the current policy range and the 4.00 to 4.25 percent range that a quarter-point hike would create. The two-year yield, which usually moves more closely with near-term policy expectations, closed at 4.88 percent on Friday, up 32 basis points from Monday's 4.56 percent, on the same official Treasury series.
In my view, that is why the useful number this week is not a December headline that has not arrived yet. The useful number is the 10-year yield that already moved.
Markets can still be surprised. Officials have discussed a larger 50 basis point option, and I would not treat Friday's close as a prediction of where the 10-year will be on 9 December. I would treat 5.15 percent as the market rate that is on the page today.
What 5.15 percent means on a 1,000 dollar example
Take 1,000 dollars as a worked example, not as a suggested order size.
At Friday's official 10-year close of 5.15 percent, 1,000 dollars would correspond to 51.50 dollars over a year if that yield were earned for a full year. At Monday's close of 4.88 percent, the same example would have been 48.80 dollars. The week's 27 basis point rise lifted that annual figure by 2.70 dollars on 1,000 dollars, or by 27 dollars on 10,000 dollars.
That 51.50 dollar figure is a benchmark, not a return I can claim, and it is not a product on BiyaPay. To earn a Treasury yield, an investor would have to buy an actual Treasury security, elsewhere, at the then-prevailing price, and hold it through the relevant period. The 5.15 percent close is the market's own longer-term rate. I would use it as a hurdle: a US stock I am considering would have to offer a combination of dividends and price change that I believe can clear that bar, after costs, and after the risk that comes with equities.
Dividends are part of that comparison only when they are actually paid. US and Hong Kong stocks purchased on BiyaPay may receive dividends. Whether a dividend is paid depends on whether the company pays one and whether you meet that company's conditions. I would not plug in a made-up dividend and call it income.
The cost of placing a US stock order on BiyaPay sits in a different category. US stock trading has 0 commission. The US stock platform fee is 0.005 US dollars per share, with a minimum of 0.99 US dollars per order and a maximum of 1 percent of the transaction value. External institution fees, trading activity fees, and other items can also apply.
On a 1,000 dollar example, that 0.99 dollar minimum is about 0.1 percent of the position, and it is a one-time order cost. Friday's 5.15 percent yield is an annual benchmark. Those two numbers are not the same kind of cost, and I would not pretend they are. The comparison I would still make is one of scale. If I hold for a year, the hurdle I am measuring against is 51.50 dollars on 1,000 dollars, which is many times the minimum platform fee on a single order. This week, the market rate moved by 2.70 dollars on that same 1,000 dollar example, which is already larger than the 0.99 dollar minimum.
When this hurdle matters, and when it does not
This comparison is useful if I am considering a US stock as a longer holding, and I want a clear market rate to put next to whatever return I expect. In a week when the 10-year has just moved through 5 percent, that rate is easier to ignore than it should be, because the conversation is about the December meeting rather than about the yield that already changed.
It is less useful if I am trading around the announcement itself. A short holding is dominated by the next price move, which can be several percent in either direction, not by a 5.15 percent annual benchmark. A 1 percent move on a 1,000 dollar position is 10 dollars, which is already larger than the week's 2.70 dollar change in the annual hurdle.
It also does not apply as a guaranteed alternative. BiyaPay's US stock product is a way to buy actual shares. It is not a Treasury auction, and I would not write as if a 5.15 percent yield is sitting in a wallet and can be clicked. Cash, USDT, and a 10-year Treasury are different assets. This article is about the hurdle, not about a substitute trade.
A December decision that surprises the path already priced into the market could move the 10-year again, up or down. Friday's close is a starting point I would update, not a number I would freeze until December.
What I would actually do
In my view, the question worth asking after this CPI week is not "will the Fed hike in December?" That outcome is widely expected, and the 10-year has already moved. The question I would ask is whether a US stock I am looking at can reasonably be expected to earn more than the 5.15 percent the 10-year already offers, after the costs I would actually pay, and after the risk of holding equities instead of a government note.
I would rather start with that hurdle than start with the commission line. The commission is zero, and the remaining order fees are real, but they are not what changed this week.
A short list I would use:
Read the latest official 10-year close, not only the Fed-meeting headline.Write down what return I actually expect from the stock, including only dividends the company itself has declared or paid, not a round number I assumed.Look at the fee on that ticket in the BiyaPay order preview, including the 0.99 dollar platform-fee minimum where it applies.If I cannot explain why the stock should clear a 5.15 percent hurdle after those costs, I would wait, rather than treat a December headline as a reason to click.
Source: US Bureau of Labor Statistics CPI report for October 2026, as reported by Reuters and CNBC on 10 November 2026; US Treasury Daily Treasury Par Yield Curve Rates for 6 to 13 November 2026, captured on 14 November 2026 at 06:12 Asia/Jakarta (UTC+7); Federal Reserve FOMC calendar, last updated 12 November 2026.
#BiyaPay #TreasuryYield #USStocks
The Fed Meets in December. The 10-Year Yield Is Already Above 5%
Disclosure: It is not financial advice
The next Federal Reserve policy meeting is still weeks away. The 10-year US Treasury yield did not wait.
On Tuesday, 10 November 2026, the US Bureau of Labor Statistics reported that the consumer price index rose a seasonally adjusted 0.4 percent in October, above the 0.3 percent increase economists had expected, according to Reuters and CNBC. Core CPI, which excludes food and energy, rose 0.3 percent, also above the forecast. The BLS did not publish a year-over-year inflation rate, because a government shutdown in 2025 left no October comparison base.
The Federal Reserve's policy rate is still in a 3.75 percent to 4.00 percent range, after officials held that range at the October meeting. The next scheduled Federal Open Market Committee meeting is on 8 and 9 December 2026, according to the Federal Reserve's official calendar, last updated on 12 November 2026. It is a meeting associated with a Summary of Economic Projections.
By Friday, 13 November, the official Daily Treasury Par Yield Curve Rate for the 10-year note had closed at 5.15 percent. On Monday, 9 November, that same official series closed at 4.88 percent. That is a rise of 27 basis points in four trading sessions. One basis point is 0.01 percent. From the previous Friday, 6 November, when the 10-year closed at 4.86 percent, the week's move was 29 basis points.
The 10-year crossed 5 percent between the Tuesday close of 4.98 percent, the day of the CPI report, and the Thursday close of 5.10 percent. There is no official daily close on that Treasury series for Wednesday, 11 November. I am using the official daily par yield curve, not an intra-day screen, so these are closing figures.
This piece is a reading of a rate that is already on an official Treasury page, and of what I would put next to a US stock after a week like this.
The policy rate and the 10-year are not the same number
It is easy to treat "the Fed will hike" as the whole story. The policy rate is the overnight federal funds range. A widely discussed 25 basis point increase in December would take that range to 4.00 percent to 4.25 percent, if the Fed chooses that size. That decision has not been made.
The 10-year yield is a longer market rate. It already closed at 5.15 percent on Friday, which is above both the current policy range and the 4.00 to 4.25 percent range that a quarter-point hike would create. The two-year yield, which usually moves more closely with near-term policy expectations, closed at 4.88 percent on Friday, up 32 basis points from Monday's 4.56 percent, on the same official Treasury series.
In my view, that is why the useful number this week is not a December headline that has not arrived yet. The useful number is the 10-year yield that already moved.
Markets can still be surprised. Officials have discussed a larger 50 basis point option, and I would not treat Friday's close as a prediction of where the 10-year will be on 9 December. I would treat 5.15 percent as the market rate that is on the page today.
What 5.15 percent means on a 1,000 dollar example
Take 1,000 dollars as a worked example, not as a suggested order size.
At Friday's official 10-year close of 5.15 percent, 1,000 dollars would correspond to 51.50 dollars over a year if that yield were earned for a full year. At Monday's close of 4.88 percent, the same example would have been 48.80 dollars. The week's 27 basis point rise lifted that annual figure by 2.70 dollars on 1,000 dollars, or by 27 dollars on 10,000 dollars.
That 51.50 dollar figure is a benchmark, not a return I can claim, and it is not a product on BiyaPay. To earn a Treasury yield, an investor would have to buy an actual Treasury security, elsewhere, at the then-prevailing price, and hold it through the relevant period. The 5.15 percent close is the market's own longer-term rate. I would use it as a hurdle: a US stock I am considering would have to offer a combination of dividends and price change that I believe can clear that bar, after costs, and after the risk that comes with equities.
Dividends are part of that comparison only when they are actually paid. US and Hong Kong stocks purchased on BiyaPay may receive dividends. Whether a dividend is paid depends on whether the company pays one and whether you meet that company's conditions. I would not plug in a made-up dividend and call it income.
The cost of placing a US stock order on BiyaPay sits in a different category. US stock trading has 0 commission. The US stock platform fee is 0.005 US dollars per share, with a minimum of 0.99 US dollars per order and a maximum of 1 percent of the transaction value. External institution fees, trading activity fees, and other items can also apply.
On a 1,000 dollar example, that 0.99 dollar minimum is about 0.1 percent of the position, and it is a one-time order cost. Friday's 5.15 percent yield is an annual benchmark. Those two numbers are not the same kind of cost, and I would not pretend they are. The comparison I would still make is one of scale. If I hold for a year, the hurdle I am measuring against is 51.50 dollars on 1,000 dollars, which is many times the minimum platform fee on a single order. This week, the market rate moved by 2.70 dollars on that same 1,000 dollar example, which is already larger than the 0.99 dollar minimum.
When this hurdle matters, and when it does not
This comparison is useful if I am considering a US stock as a longer holding, and I want a clear market rate to put next to whatever return I expect. In a week when the 10-year has just moved through 5 percent, that rate is easier to ignore than it should be, because the conversation is about the December meeting rather than about the yield that already changed.
It is less useful if I am trading around the announcement itself. A short holding is dominated by the next price move, which can be several percent in either direction, not by a 5.15 percent annual benchmark. A 1 percent move on a 1,000 dollar position is 10 dollars, which is already larger than the week's 2.70 dollar change in the annual hurdle.
It also does not apply as a guaranteed alternative. BiyaPay's US stock product is a way to buy actual shares. It is not a Treasury auction, and I would not write as if a 5.15 percent yield is sitting in a wallet and can be clicked. Cash, USDT, and a 10-year Treasury are different assets. This article is about the hurdle, not about a substitute trade.
A December decision that surprises the path already priced into the market could move the 10-year again, up or down. Friday's close is a starting point I would update, not a number I would freeze until December.
What I would actually do
In my view, the question worth asking after this CPI week is not "will the Fed hike in December?" That outcome is widely expected, and the 10-year has already moved. The question I would ask is whether a US stock I am looking at can reasonably be expected to earn more than the 5.15 percent the 10-year already offers, after the costs I would actually pay, and after the risk of holding equities instead of a government note.
I would rather start with that hurdle than start with the commission line. The commission is zero, and the remaining order fees are real, but they are not what changed this week.
A short list I would use:
Read the latest official 10-year close, not only the Fed-meeting headline.Write down what return I actually expect from the stock, including only dividends the company itself has declared or paid, not a round number I assumed.Look at the fee on that ticket in the BiyaPay order preview, including the 0.99 dollar platform-fee minimum where it applies.If I cannot explain why the stock should clear a 5.15 percent hurdle after those costs, I would wait, rather than treat a December headline as a reason to click.
Source: US Bureau of Labor Statistics CPI report for October 2026, as reported by Reuters and CNBC on 10 November 2026; US Treasury Daily Treasury Par Yield Curve Rates for 6 to 13 November 2026, captured on 14 November 2026 at 06:12 Asia/Jakarta (UTC+7); Federal Reserve FOMC calendar, last updated 12 November 2026.
#BiyaPay #TreasuryYield #USStocks
The next Federal Reserve policy meeting is still weeks away. The 10-year US Treasury yield did not wait.
On Tuesday, 10 November 2026, the US Bureau of Labor Statistics reported that the consumer price index rose a seasonally adjusted 0.4 percent in October, above the 0.3 percent increase economists had expected, according to Reuters and CNBC. Core CPI, which excludes food and energy, rose 0.3 percent, also above the forecast. The BLS did not publish a year-over-year inflation rate, because a government shutdown in 2025 left no October comparison base.
The Federal Reserve's policy rate is still in a 3.75 percent to 4.00 percent range, after officials held that range at the October meeting. The next scheduled Federal Open Market Committee meeting is on 8 and 9 December 2026, according to the Federal Reserve's official calendar, last updated on 12 November 2026. It is a meeting associated with a Summary of Economic Projections.
By Friday, 13 November, the official Daily Treasury Par Yield Curve Rate for the 10-year note had closed at 5.15 percent. On Monday, 9 November, that same official series closed at 4.88 percent. That is a rise of 27 basis points in four trading sessions. One basis point is 0.01 percent. From the previous Friday, 6 November, when the 10-year closed at 4.86 percent, the week's move was 29 basis points.
The 10-year crossed 5 percent between the Tuesday close of 4.98 percent, the day of the CPI report, and the Thursday close of 5.10 percent. There is no official daily close on that Treasury series for Wednesday, 11 November. I am using the official daily par yield curve, not an intra-day screen, so these are closing figures.
This piece is a reading of a rate that is already on an official Treasury page, and of what I would put next to a US stock after a week like this.
The policy rate and the 10-year are not the same number
It is easy to treat "the Fed will hike" as the whole story. The policy rate is the overnight federal funds range. A widely discussed 25 basis point increase in December would take that range to 4.00 percent to 4.25 percent, if the Fed chooses that size. That decision has not been made.
The 10-year yield is a longer market rate. It already closed at 5.15 percent on Friday, which is above both the current policy range and the 4.00 to 4.25 percent range that a quarter-point hike would create. The two-year yield, which usually moves more closely with near-term policy expectations, closed at 4.88 percent on Friday, up 32 basis points from Monday's 4.56 percent, on the same official Treasury series.
In my view, that is why the useful number this week is not a December headline that has not arrived yet. The useful number is the 10-year yield that already moved.
Markets can still be surprised. Officials have discussed a larger 50 basis point option, and I would not treat Friday's close as a prediction of where the 10-year will be on 9 December. I would treat 5.15 percent as the market rate that is on the page today.
What 5.15 percent means on a 1,000 dollar example
Take 1,000 dollars as a worked example, not as a suggested order size.
At Friday's official 10-year close of 5.15 percent, 1,000 dollars would correspond to 51.50 dollars over a year if that yield were earned for a full year. At Monday's close of 4.88 percent, the same example would have been 48.80 dollars. The week's 27 basis point rise lifted that annual figure by 2.70 dollars on 1,000 dollars, or by 27 dollars on 10,000 dollars.
That 51.50 dollar figure is a benchmark, not a return I can claim, and it is not a product on BiyaPay. To earn a Treasury yield, an investor would have to buy an actual Treasury security, elsewhere, at the then-prevailing price, and hold it through the relevant period. The 5.15 percent close is the market's own longer-term rate. I would use it as a hurdle: a US stock I am considering would have to offer a combination of dividends and price change that I believe can clear that bar, after costs, and after the risk that comes with equities.
Dividends are part of that comparison only when they are actually paid. US and Hong Kong stocks purchased on BiyaPay may receive dividends. Whether a dividend is paid depends on whether the company pays one and whether you meet that company's conditions. I would not plug in a made-up dividend and call it income.
The cost of placing a US stock order on BiyaPay sits in a different category. US stock trading has 0 commission. The US stock platform fee is 0.005 US dollars per share, with a minimum of 0.99 US dollars per order and a maximum of 1 percent of the transaction value. External institution fees, trading activity fees, and other items can also apply.
On a 1,000 dollar example, that 0.99 dollar minimum is about 0.1 percent of the position, and it is a one-time order cost. Friday's 5.15 percent yield is an annual benchmark. Those two numbers are not the same kind of cost, and I would not pretend they are. The comparison I would still make is one of scale. If I hold for a year, the hurdle I am measuring against is 51.50 dollars on 1,000 dollars, which is many times the minimum platform fee on a single order. This week, the market rate moved by 2.70 dollars on that same 1,000 dollar example, which is already larger than the 0.99 dollar minimum.
When this hurdle matters, and when it does not
This comparison is useful if I am considering a US stock as a longer holding, and I want a clear market rate to put next to whatever return I expect. In a week when the 10-year has just moved through 5 percent, that rate is easier to ignore than it should be, because the conversation is about the December meeting rather than about the yield that already changed.
It is less useful if I am trading around the announcement itself. A short holding is dominated by the next price move, which can be several percent in either direction, not by a 5.15 percent annual benchmark. A 1 percent move on a 1,000 dollar position is 10 dollars, which is already larger than the week's 2.70 dollar change in the annual hurdle.
It also does not apply as a guaranteed alternative. BiyaPay's US stock product is a way to buy actual shares. It is not a Treasury auction, and I would not write as if a 5.15 percent yield is sitting in a wallet and can be clicked. Cash, USDT, and a 10-year Treasury are different assets. This article is about the hurdle, not about a substitute trade.
A December decision that surprises the path already priced into the market could move the 10-year again, up or down. Friday's close is a starting point I would update, not a number I would freeze until December.
What I would actually do
In my view, the question worth asking after this CPI week is not "will the Fed hike in December?" That outcome is widely expected, and the 10-year has already moved. The question I would ask is whether a US stock I am looking at can reasonably be expected to earn more than the 5.15 percent the 10-year already offers, after the costs I would actually pay, and after the risk of holding equities instead of a government note.
I would rather start with that hurdle than start with the commission line. The commission is zero, and the remaining order fees are real, but they are not what changed this week.
A short list I would use:
Read the latest official 10-year close, not only the Fed-meeting headline.Write down what return I actually expect from the stock, including only dividends the company itself has declared or paid, not a round number I assumed.Look at the fee on that ticket in the BiyaPay order preview, including the 0.99 dollar platform-fee minimum where it applies.If I cannot explain why the stock should clear a 5.15 percent hurdle after those costs, I would wait, rather than treat a December headline as a reason to click.
Source: US Bureau of Labor Statistics CPI report for October 2026, as reported by Reuters and CNBC on 10 November 2026; US Treasury Daily Treasury Par Yield Curve Rates for 6 to 13 November 2026, captured on 14 November 2026 at 06:12 Asia/Jakarta (UTC+7); Federal Reserve FOMC calendar, last updated 12 November 2026.
#BiyaPay #TreasuryYield #USStocks
2
2
1.1k

Un viernes inusual en Wall Street.
El Dow apenas varió (+0,1 %), pero el Nasdaq y las acciones de semiconductores sufrieron fuertes caídas, ya que la inflación mayorista de octubre (PPI) subió al 6,5 % interanual, su mayor aumento desde 2022. A pesar de esto, los tres principales índices cerraron la semana en positivo, lo que demuestra que el sector tecnológico es el que está soportando el golpe.
Cuando el Nasdaq estornuda, $BTC tiende a resfriarse. ¿Usas las acciones para determinar la dirección de las criptomonedas o vas a desconectarte de Wall Street hasta diciembre? 👇
$BTC #USStocks #Nasdaq #Inflation #Macro
Un viernes inusual en Wall Street.
El Dow apenas varió (+0,1 %), pero el Nasdaq y las acciones de semiconductores sufrieron fuertes caídas, ya que la inflación mayorista de octubre (PPI) subió al 6,5 % interanual, su mayor aumento desde 2022. A pesar de esto, los tres principales índices cerraron la semana en positivo, lo que demuestra que el sector tecnológico es el que está soportando el golpe.
Cuando el Nasdaq estornuda, $BTC tiende a resfriarse. ¿Usas las acciones para determinar la dirección de las criptomonedas o vas a desconectarte de Wall Street hasta diciembre? 👇
$BTC #USStocks #Nasdaq #Inflation #Macro
El Dow apenas varió (+0,1 %), pero el Nasdaq y las acciones de semiconductores sufrieron fuertes caídas, ya que la inflación mayorista de octubre (PPI) subió al 6,5 % interanual, su mayor aumento desde 2022. A pesar de esto, los tres principales índices cerraron la semana en positivo, lo que demuestra que el sector tecnológico es el que está soportando el golpe.
Cuando el Nasdaq estornuda, $BTC tiende a resfriarse. ¿Usas las acciones para determinar la dirección de las criptomonedas o vas a desconectarte de Wall Street hasta diciembre? 👇
$BTC #USStocks #Nasdaq #Inflation #Macro
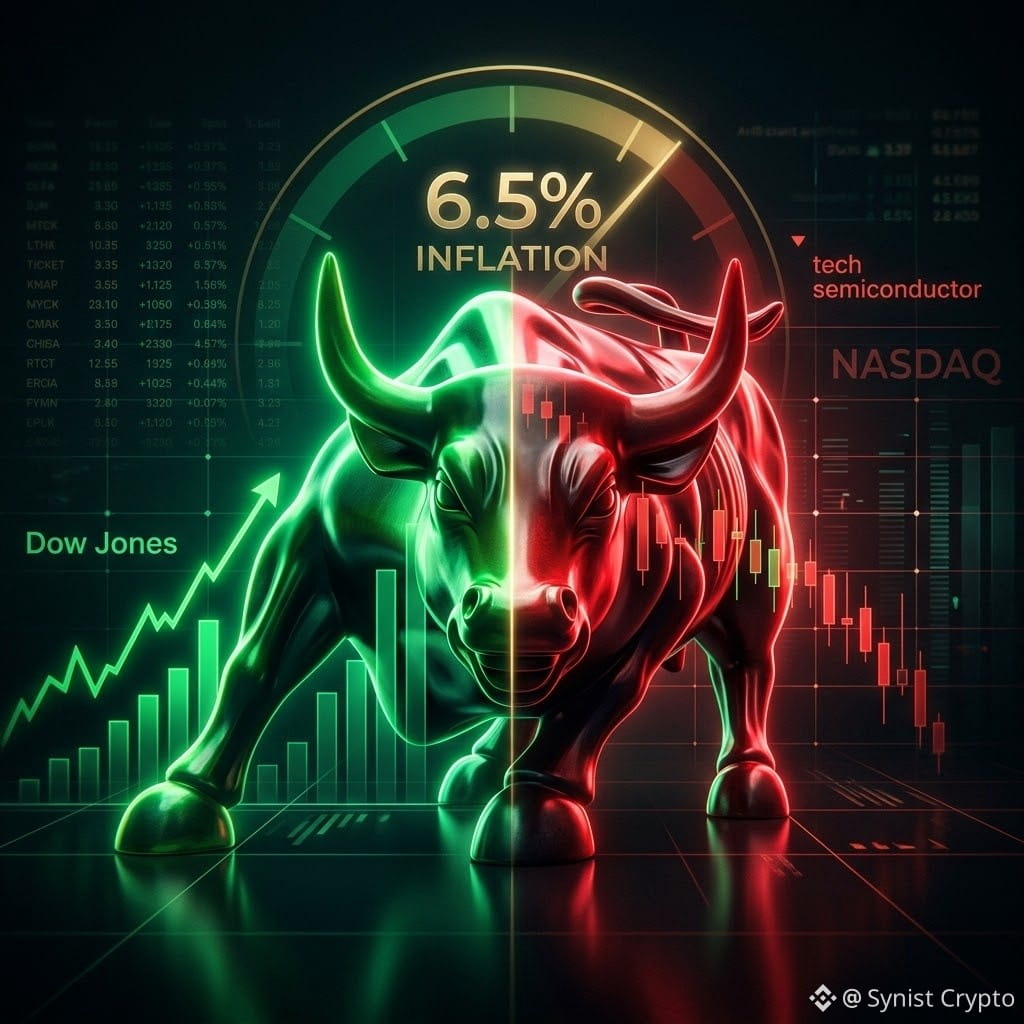
58

·
--
Bajista
🚨 ÚLTIMA HORA: SE HAN ESFUMADO 1,2 BILLONES DE DÓLARES DE LAS BOLSAS DE EE. UU. EN SOLO 40 MINUTOS. WALL STREET ESTÁ VENDIENDO AGRESIVAMENTE.
La presión vendedora se está extendiendo por todo el mercado bursátil estadounidense.
📉 S&P 500: -1,56 %
📉 Nasdaq: -2,28 %
📉 Semiconductores (SOXX): -6,02 %
Pero esto es lo que hace que esta venta masiva sea particularmente interesante:
Los rendimientos de los bonos del Tesoro de EE. UU. están CAYENDO con fuerza en los vencimientos a 10, 20 y 30 años.
Esto sugiere que, ante la creciente incertidumbre, los inversores podrían estar orientándose hacia la seguridad relativa de los bonos del Estado.
Dos preocupaciones importantes están afectando al sentimiento del mercado:
Las valoraciones de la IA y las dudas sobre los rendimientos futuros.
La incertidumbre sobre la inflación y su posible impacto en la política monetaria.
La gran pregunta: ¿Se trata de una corrección temporal o del comienzo de una mayor aversión al riesgo?
Sigue de cerca los rendimientos de los bonos del Tesoro, las acciones tecnológicas y el desempeño de los semiconductores.
Si las ventas se aceleran, la volatilidad en los mercados globales podría aumentar considerablemente.
#StockMarket #WallStreet #USStocks #BondMarket #GlobalMarkets
🚨 ÚLTIMA HORA: SE HAN ESFUMADO 1,2 BILLONES DE DÓLARES DE LAS BOLSAS DE EE. UU. EN SOLO 40 MINUTOS. WALL STREET ESTÁ VENDIENDO AGRESIVAMENTE.
La presión vendedora se está extendiendo por todo el mercado bursátil estadounidense.
📉 S&P 500: -1,56 %
📉 Nasdaq: -2,28 %
📉 Semiconductores (SOXX): -6,02 %
Pero esto es lo que hace que esta venta masiva sea particularmente interesante:
Los rendimientos de los bonos del Tesoro de EE. UU. están CAYENDO con fuerza en los vencimientos a 10, 20 y 30 años.
Esto sugiere que, ante la creciente incertidumbre, los inversores podrían estar orientándose hacia la seguridad relativa de los bonos del Estado.
Dos preocupaciones importantes están afectando al sentimiento del mercado:
Las valoraciones de la IA y las dudas sobre los rendimientos futuros.
La incertidumbre sobre la inflación y su posible impacto en la política monetaria.
La gran pregunta: ¿Se trata de una corrección temporal o del comienzo de una mayor aversión al riesgo?
Sigue de cerca los rendimientos de los bonos del Tesoro, las acciones tecnológicas y el desempeño de los semiconductores.
Si las ventas se aceleran, la volatilidad en los mercados globales podría aumentar considerablemente.
#StockMarket #WallStreet #USStocks #BondMarket #GlobalMarkets
La presión vendedora se está extendiendo por todo el mercado bursátil estadounidense.
📉 S&P 500: -1,56 %
📉 Nasdaq: -2,28 %
📉 Semiconductores (SOXX): -6,02 %
Pero esto es lo que hace que esta venta masiva sea particularmente interesante:
Los rendimientos de los bonos del Tesoro de EE. UU. están CAYENDO con fuerza en los vencimientos a 10, 20 y 30 años.
Esto sugiere que, ante la creciente incertidumbre, los inversores podrían estar orientándose hacia la seguridad relativa de los bonos del Estado.
Dos preocupaciones importantes están afectando al sentimiento del mercado:
Las valoraciones de la IA y las dudas sobre los rendimientos futuros.
La incertidumbre sobre la inflación y su posible impacto en la política monetaria.
La gran pregunta: ¿Se trata de una corrección temporal o del comienzo de una mayor aversión al riesgo?
Sigue de cerca los rendimientos de los bonos del Tesoro, las acciones tecnológicas y el desempeño de los semiconductores.
Si las ventas se aceleran, la volatilidad en los mercados globales podría aumentar considerablemente.
#StockMarket #WallStreet #USStocks #BondMarket #GlobalMarkets
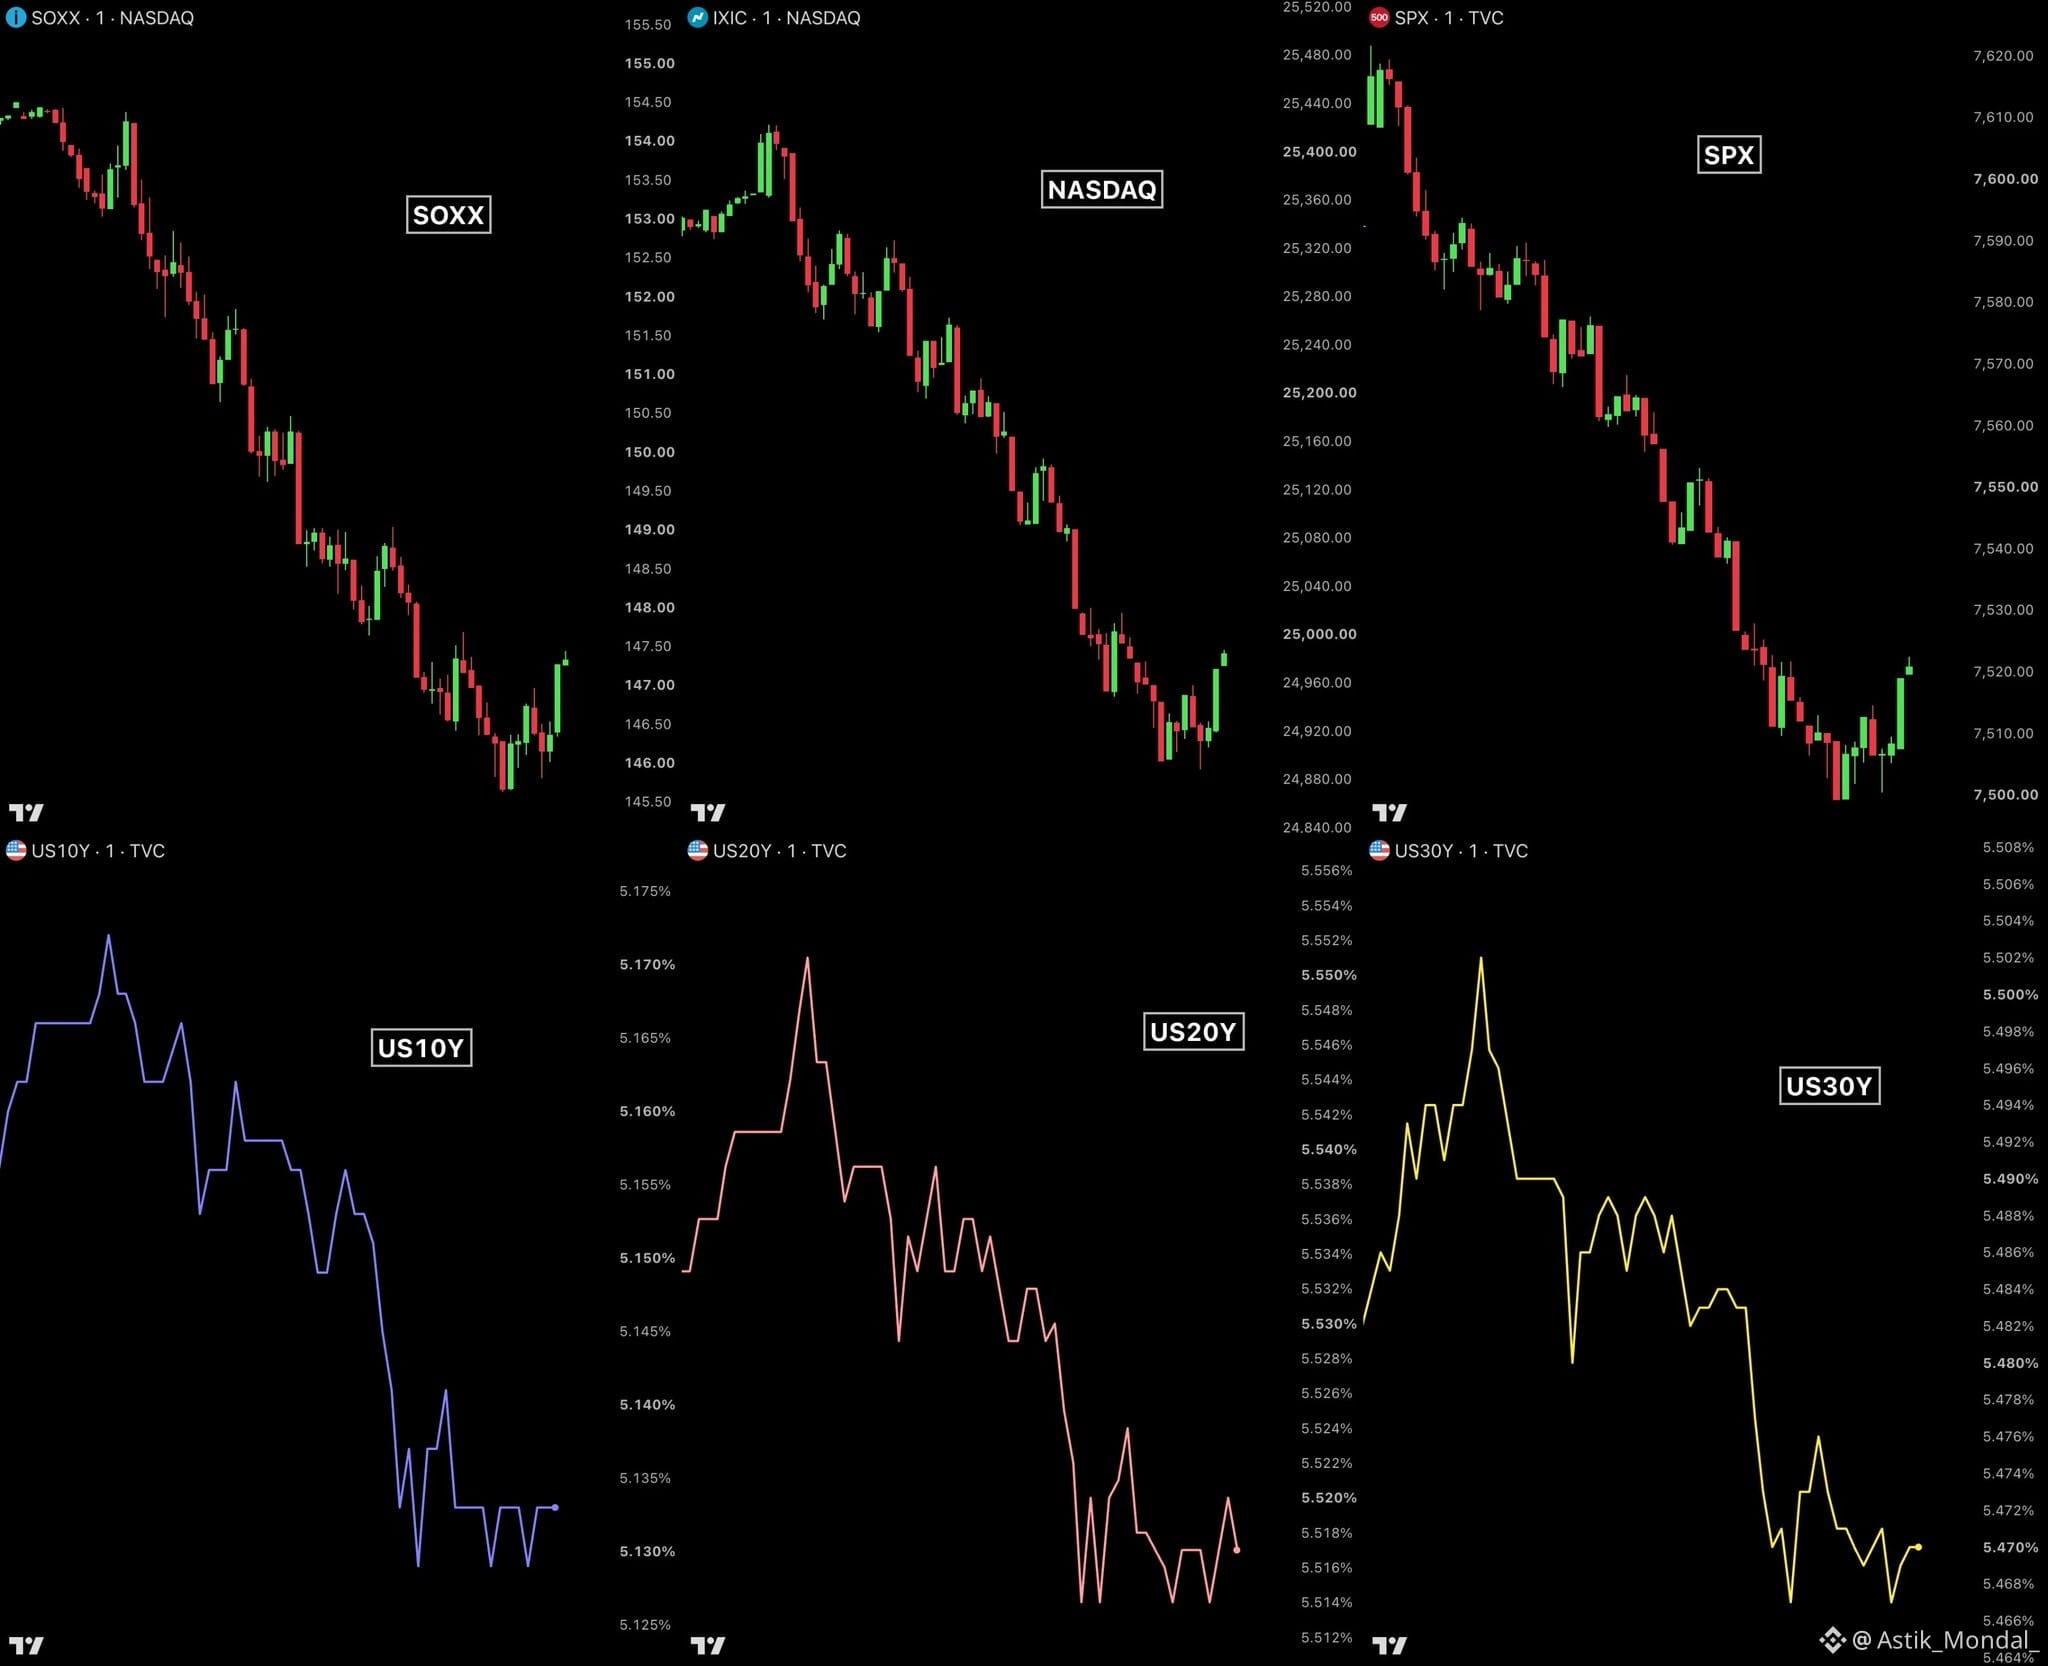
1
249
🚨 ÚLTIMA HORA: 🇺🇸 LAS APUESTAS INSTITUCIONALES EN ACCIONES DE EE. UU. SE DISPARAN HASTA LOS 330.000 MILLONES DE DÓLARES, EL SEGUNDO NIVEL MÁS ALTO DE LA HISTORIA.
Los principales actores de Wall Street están fuertemente posicionados en el mercado de renta variable estadounidense.
La exposición neta larga de las instituciones se ha disparado en 100.000 MILLONES DE DÓLARES en solo seis meses.
Eso está apenas 10.000 MILLONES DE DÓLARES por debajo del récord histórico establecido en 2024.
Esta es la advertencia que los inversores no deberían ignorar:
Un posicionamiento alcista extremo puede impulsar nuevas subidas, pero también crea el riesgo de operaciones abarrotadas y ventas agresivas si cambia el sentimiento.
Wall Street está apostando fuerte por las acciones estadounidenses. Pero ¿están todos ya del mismo lado de la operación?
#StockMarket #WallStreet #SP500 #USStocks #GlobalMarkets
🚨 ÚLTIMA HORA: 🇺🇸 LAS APUESTAS INSTITUCIONALES EN ACCIONES DE EE. UU. SE DISPARAN HASTA LOS 330.000 MILLONES DE DÓLARES, EL SEGUNDO NIVEL MÁS ALTO DE LA HISTORIA.
Los principales actores de Wall Street están fuertemente posicionados en el mercado de renta variable estadounidense.
La exposición neta larga de las instituciones se ha disparado en 100.000 MILLONES DE DÓLARES en solo seis meses.
Eso está apenas 10.000 MILLONES DE DÓLARES por debajo del récord histórico establecido en 2024.
Esta es la advertencia que los inversores no deberían ignorar:
Un posicionamiento alcista extremo puede impulsar nuevas subidas, pero también crea el riesgo de operaciones abarrotadas y ventas agresivas si cambia el sentimiento.
Wall Street está apostando fuerte por las acciones estadounidenses. Pero ¿están todos ya del mismo lado de la operación?
#StockMarket #WallStreet #SP500 #USStocks #GlobalMarkets
Los principales actores de Wall Street están fuertemente posicionados en el mercado de renta variable estadounidense.
La exposición neta larga de las instituciones se ha disparado en 100.000 MILLONES DE DÓLARES en solo seis meses.
Eso está apenas 10.000 MILLONES DE DÓLARES por debajo del récord histórico establecido en 2024.
Esta es la advertencia que los inversores no deberían ignorar:
Un posicionamiento alcista extremo puede impulsar nuevas subidas, pero también crea el riesgo de operaciones abarrotadas y ventas agresivas si cambia el sentimiento.
Wall Street está apostando fuerte por las acciones estadounidenses. Pero ¿están todos ya del mismo lado de la operación?
#StockMarket #WallStreet #SP500 #USStocks #GlobalMarkets


1
15
Inicia sesión para explorar más contenidos
Únete a usuarios globales de criptomonedas en Binance Square
⚡️ Obtén información útil y actualizada sobre criptos.
💬 Avalado por el mayor exchange de criptomonedas en el mundo.
👍 Descubre perspectivas reales de creadores verificados.
Email/número de teléfono
Temas populares
1
#CanBTCReboundAfterFallingBelow60K?
439,213 vistas
1,867 están debatiendo
2
#GlobalStocksFaceLongestLosingStreakSince2023
148,467 vistas
1,302 están debatiendo
3
#BlackRockIBITPostsRecord$541MSingleDayOutflow
4,598 vistas
41 están debatiendo
4
#AnthropicPlungesTowardIPOPriceonDay2
71,485 vistas
731 están debatiendo
5
#TwentyOneCapitalAdds172.25BTC
22,355 vistas
264 están debatiendo
6
#HKBillWouldExcludeTokenizedDepositsFromVirtualAssets
2,539 vistas
26 están debatiendo
7
#BNBDropsBelow540USDTWith8.46%DailyDecline
41,732 vistas
362 están debatiendo
8
#HKBillProposesHK$100KFineForUnauthorizedCryptoTitles
1,455 vistas
19 están debatiendo
9
#BitMineFaces$10.1BUnrealizedETHLoss
2,623 vistas
25 están debatiendo
10
#StrategyReports$35BNetReserves
2,315 vistas
18 están debatiendo