
Junii Ahmad
740 Publicaciones
Junii Ahmad
Denunciar
Bloquear usuario
📊 Crypto Trader | Technical Analysis & Risk Management | Disciplined Execution over Emotion 🎯
Trader frecuente
2 año(s)
214 Siguiendo
71 Seguidores
224 Me gusta
Publicaciones
Todo
Citas
Videos
Live
PINNED
·
--
Alcista
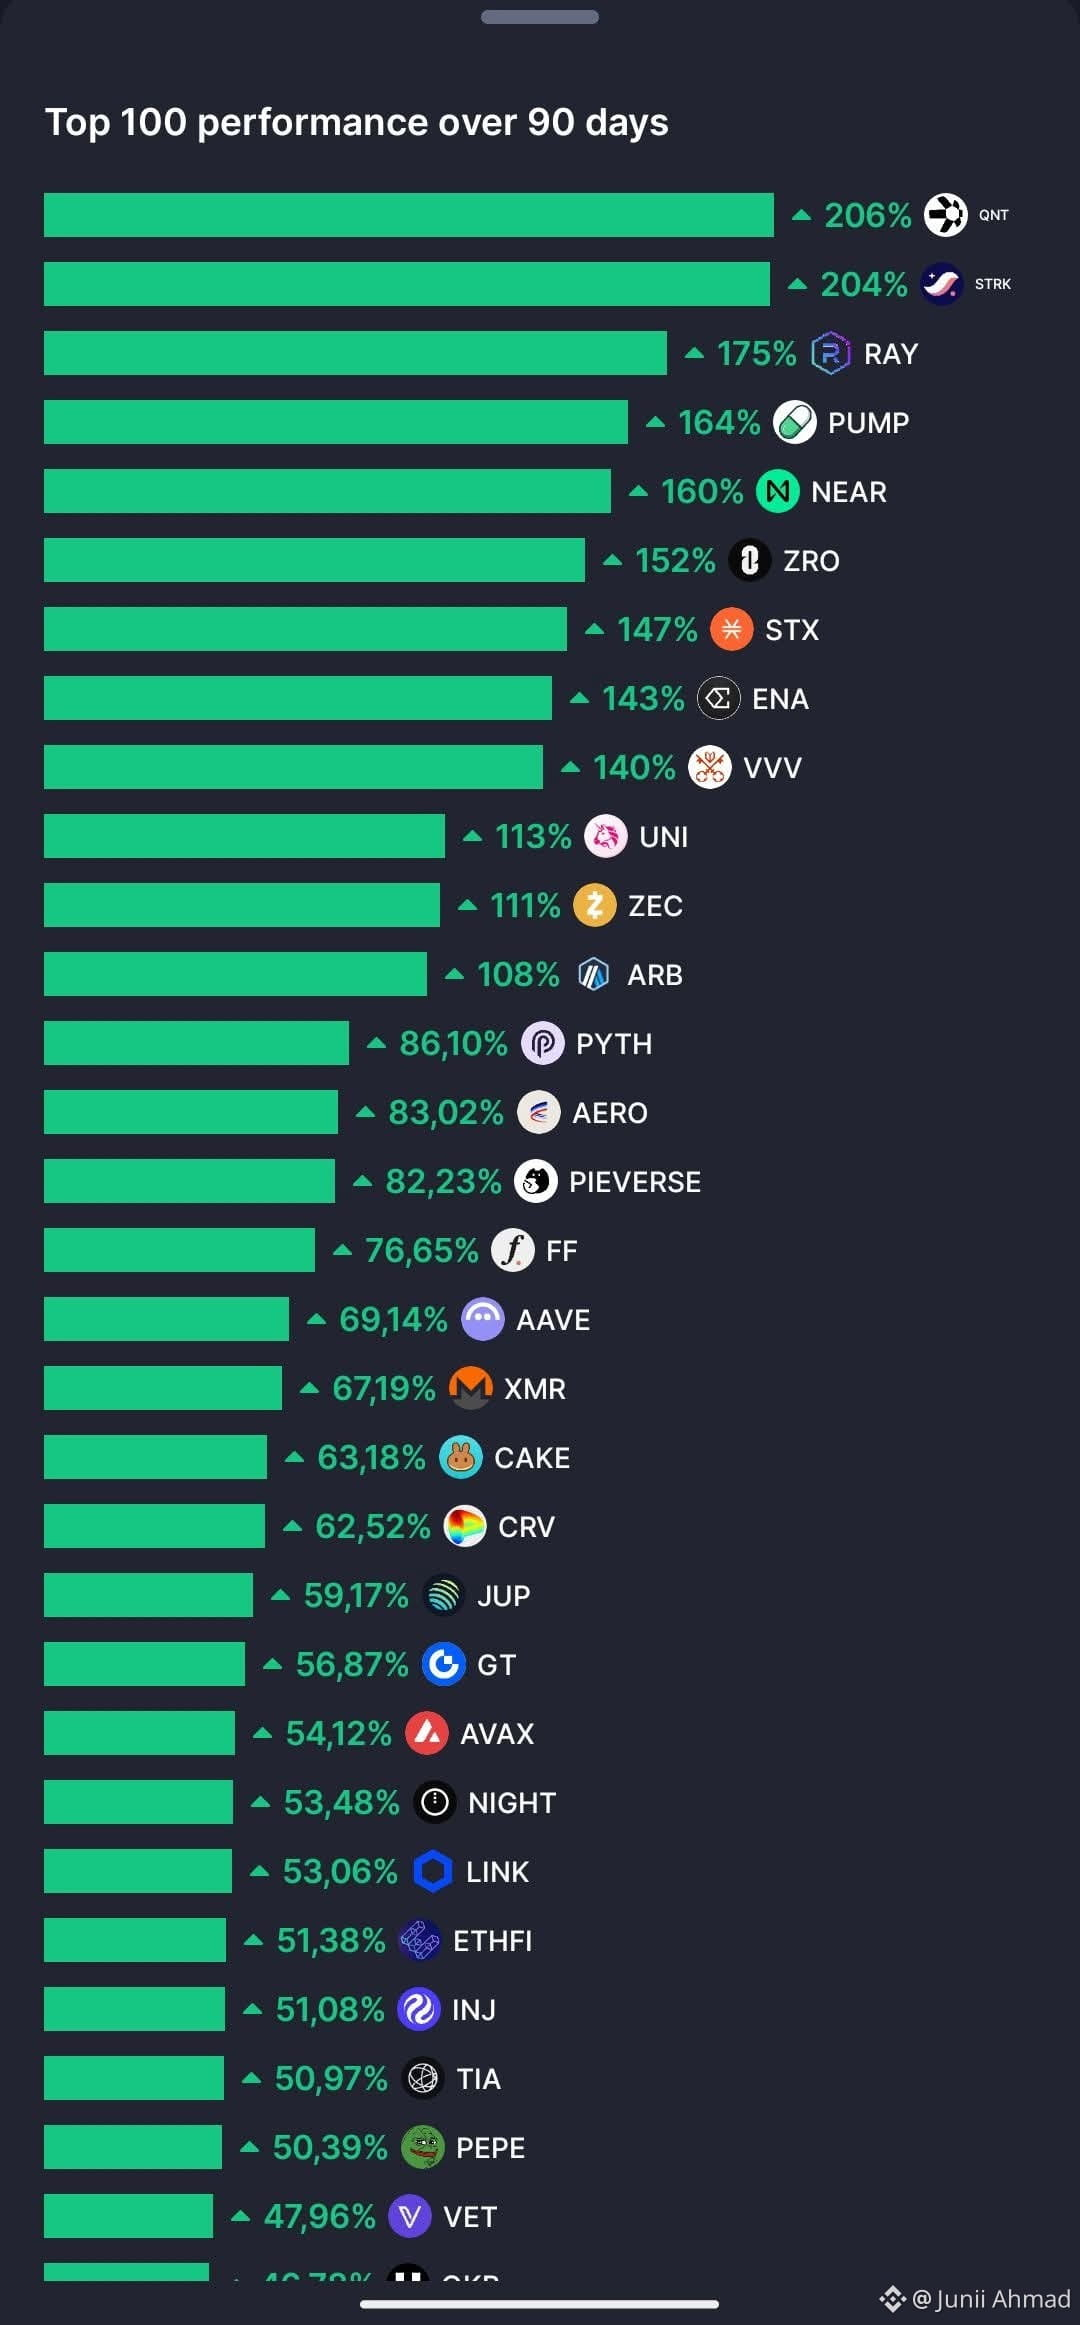
"Al analizar el rendimiento de las 100 principales criptomonedas durante los últimos 90 días, hemos seleccionado algunas de las más destacadas para mostrártelas."
$QNT $STRK $RAY
#CelestiaRises16%To2026High #NasdaqDowWeeklyGapWidestSinceJuly2002 #Nasdaq100Falls5.5%InWorstWeekIn18Months #StrategySharesFall9%OnFriday #USPPIRises6.3%YearOverYear
"Al analizar el rendimiento de las 100 principales criptomonedas durante los últimos 90 días, hemos seleccionado algunas de las más destacadas para mostrártelas."
$QNT $STRK $RAY
#CelestiaRises16%To2026High #NasdaqDowWeeklyGapWidestSinceJuly2002 #Nasdaq100Falls5.5%InWorstWeekIn18Months #StrategySharesFall9%OnFriday #USPPIRises6.3%YearOverYear
$QNT $STRK $RAY
#CelestiaRises16%To2026High #NasdaqDowWeeklyGapWidestSinceJuly2002 #Nasdaq100Falls5.5%InWorstWeekIn18Months #StrategySharesFall9%OnFriday #USPPIRises6.3%YearOverYear
2
3
4.3k
·
--
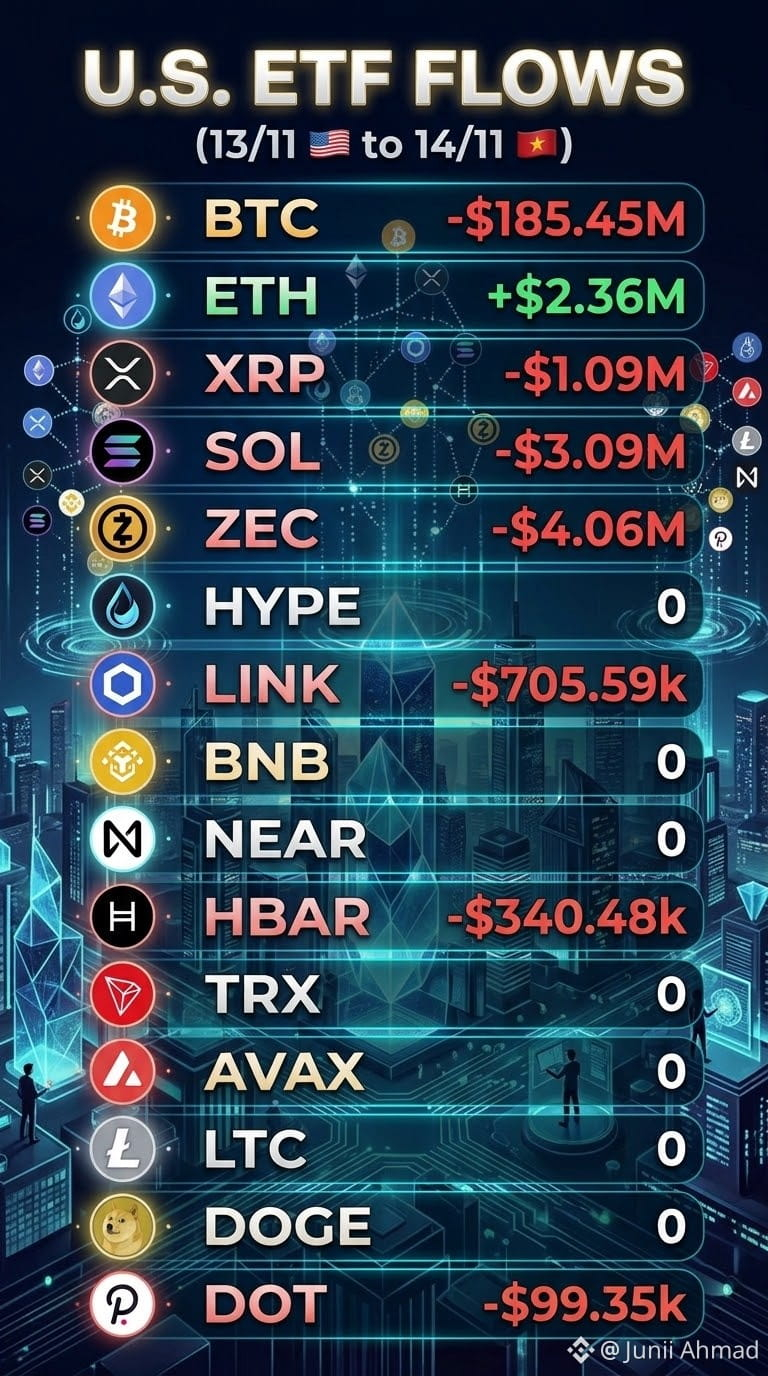
Flujos de ETF de EE. UU. (13/11 🇺🇸 - 14/11 🇻🇳)
📉 🟠 $BTC : -$185.45 millones
📈 💠 $ETH : +$2.36 millones
📉 ✕ $XRP : -$1.09 millones
📉 🟣 SOL: -$3.09 millones
📉 🛡️ ZEC: -$4.06 millones
⚪ 💧 HYPE: 0
📉 🔗 LINK: -$705.59 mil
⚪ 🟡 BNB: 0
⚪ 🌐 NEAR: 0
📉 ℏ HBAR: -$340.48 mil
⚪ 🔺 TRX: 0
⚪ 🔺 AVAX: 0
⚪ 🥈 LTC: 0
⚪ 🐕 DOGE: 0
📉 ⚪ DOT: -$99.35 mil
#WhatWillDriveCryptoandStocks’NextRebound? #USPPIMissMayEaseBTCPressure #TradFiForBeginners #BitcoinBreaksBelow200WeekMovingAverage #BitcoinCoreDisclosesTorTrafficVulnerability
Flujos de ETF de EE. UU. (13/11 🇺🇸 - 14/11 🇻🇳)
📉 🟠 $BTC : -$185.45 millones
📈 💠 $ETH : +$2.36 millones
📉 ✕ $XRP : -$1.09 millones
📉 🟣 SOL: -$3.09 millones
📉 🛡️ ZEC: -$4.06 millones
⚪ 💧 HYPE: 0
📉 🔗 LINK: -$705.59 mil
⚪ 🟡 BNB: 0
⚪ 🌐 NEAR: 0
📉 ℏ HBAR: -$340.48 mil
⚪ 🔺 TRX: 0
⚪ 🔺 AVAX: 0
⚪ 🥈 LTC: 0
⚪ 🐕 DOGE: 0
📉 ⚪ DOT: -$99.35 mil
#WhatWillDriveCryptoandStocks’NextRebound? #USPPIMissMayEaseBTCPressure #TradFiForBeginners #BitcoinBreaksBelow200WeekMovingAverage #BitcoinCoreDisclosesTorTrafficVulnerability
📉 🟠 $BTC : -$185.45 millones
📈 💠 $ETH : +$2.36 millones
📉 ✕ $XRP : -$1.09 millones
📉 🟣 SOL: -$3.09 millones
📉 🛡️ ZEC: -$4.06 millones
⚪ 💧 HYPE: 0
📉 🔗 LINK: -$705.59 mil
⚪ 🟡 BNB: 0
⚪ 🌐 NEAR: 0
📉 ℏ HBAR: -$340.48 mil
⚪ 🔺 TRX: 0
⚪ 🔺 AVAX: 0
⚪ 🥈 LTC: 0
⚪ 🐕 DOGE: 0
📉 ⚪ DOT: -$99.35 mil
#WhatWillDriveCryptoandStocks’NextRebound? #USPPIMissMayEaseBTCPressure #TradFiForBeginners #BitcoinBreaksBelow200WeekMovingAverage #BitcoinCoreDisclosesTorTrafficVulnerability
28
·
--

Artículo
Ver traducción
How Traders Can Think Like a ScientistPhilosophy of Science: Science advances by testing ideas against evidence, not by defending beliefs.
Replace prediction and opinion with observation, evidence and repeatable decisions
Here is Chapter 1 from my book: How to Trade Like a Scientist: Use the Principles of Science to Build, Test, and Continuously Improve a Profitable Trading System
Two traders opened the same chart on the same morning. The first one says the stock looks strong and is probably beginning a new uptrend, so they buy it. The second pulls up a spreadsheet of 74 prior bullish 5-day / 20-day EMA crossovers, finds that the setup produced about a 60 percent win rate with an average 2:1 reward-to-risk ratio over a large sample of trades, and buys it too. Same trade, same entry price, same afternoon of uncertainty while the stock pulls back fifty cents after entry. Only one of those traders can tell you what they expect to happen over the next hundred trades, and only one of them knows they are executing a strategy with positive expectancy instead of acting on a hunch.
That difference is the whole subject of this book, and it starts with a procedure borrowed from the laboratory.
Observe something specific.Propose an explanation that could be wrong.Build a test capable of disproving that explanation.Gather enough data so that luck isn't driving the answer.Compare the result against what would have happened.Then run the idea again on data that you have never seen.Six steps. None of them asks you to predict anything.
Prediction is the habit that makes most retail traders unprofitable, and can be a slow leak over the years, while the trader feels intelligent the entire time. A trader who trades like a scientist exchanges a bad question for a much better one. Instead of asking what the market will do next, they ask how often a defined situation has produced a defined outcome, by how much, and measured against what. You will never know what the next trade does. You can know, within a stated margin of error, what one hundred trades of the same kind have done. That is a different kind of knowledge. Only the second one pays.
Observation Comes First
Every scientific discovery begins with someone writing what actually happened. For traders, that means a journal, though probably not the kind you have kept before. The emotional diary, where you record that you felt anxious and jumped in early, has some value for behavior, but it produces no data you can sort, filter, or test. What you want is a structured dataset with identical data fields on every row.
Record the date, ticker, setup name, entry price, initial stop, exit price, position size, and result in R multiples. R is your unit of risk, defined as the distance between your entry price and your original stop loss.
For example, suppose you buy a stock at $100 with an initial stop at $95. Your risk is $5 per share, so 1R equals $5. If you exit at $110, you earn $10 per share, or +2R. If you exit at $95, you lose $5.00 per share, or -1R.
Measuring every trade in R standardizes your results regardless of the stock's price or the number of shares traded. It allows you to compare trades objectively and evaluate the actual performance of your trading system, rather than being misled by raw dollar gains and losses.
Then record the context based on the market parameters you want to analyze. Was the S&P 500 above or below its 50-day moving average that day? What was the stock's Average True Range as a percentage of price, what was the volume against its 20-day average, which sector, and what time of day did you enter? A lot of columns of what feels like clerical work, but gives you valuable data to analyze. What is in those columns depends on which signals you find most valuable.
For the first few dozen trades, keeping detailed records can feel like busywork. However, with a much larger sample, patterns emerge. You may discover that your biggest losses consistently occur under certain market conditions, that one setup significantly outperforms another, or that trades taken outside your written rules rarely succeed.
Those insights don't come from memory. They come from data. A few minutes spent recording each trade creates a database that can reveal weaknesses to eliminate and strengths to exploit. Over the course of a trading career, those small daily habits can become one of the highest-return investments a trader ever makes. Today, many software platforms automate this.
Turning a Belief Into Something That Can Fail
Write an observation, and your brain immediately hands you a story explaining it. That story is a hypothesis. It only has value if it is specific enough to be proven wrong.
"Moving average crossovers make money" is an opinion, not a hypothesis. There is nothing specific to test.
Now compare it to this statement: when a specific stock's 5-day EMA crosses above its 20-day EMA, the trade produces a 60 percent win rate with an average reward-to-risk ratio of 2:1 over the next twenty trading days, when the same cross-under is used as an exit signal.
Every part of that statement can be tested. Another trader using the same rules should get nearly the same results. Most importantly, the hypothesis can be proven wrong. If the backtest shows only a 45 percent win rate with a 1:1 reward-to-risk ratio, you have discovered that the idea doesn't provide a profitable edge before risking real money.
That is why every trading idea should begin as a testable hypothesis, not a belief. A hypothesis tells you exactly what to measure and gives the market a chance to prove you wrong through live price action, backtesting, or historical chart studies. If a signal survives repeated testing across different stocks and market environments, you may have found a genuine edge. If it doesn't, you've saved yourself from trading a strategy that only sounded good in theory.
Measuring the Edge
Once you have a few hundred rows of data, one number matters more than anything else on your screen: the average result per trade in R units. Traders call it expectancy.
Expectancy is the average amount you can expect to make or lose on each trade over a large sample.
The formula is:
Expectancy = (Win Rate × Average Win in R) − (Loss Rate × Average Loss in R)
Suppose you analyze 100 trades and find a 40 percent win rate. Your average winning trade is 2R, and your average losing trade is 1R.
The math is simple:
(0.40 × 2) − (0.60 × 1) = 0.80 − 0.60 = +0.20R
Your expectancy is +0.20R per trade. If you risk $100 on every trade, your expected profit is $20 per trade over the long run. After 500 trades, your statistical expectation is about $10,000 in profits before commissions and slippage.
Now compare that to another system with a 70 percent win rate, an average winner of 1R, and an average loser of 3R.
(0.70 × 1) − (0.30 × 3) = 0.70 − 0.90 = -0.20R
Even though this trader wins seven out of every ten trades, the system loses an average of 0.20R per trade because the losses are much larger than the gains.
This is one of the most important lessons in trading. A high win rate does not guarantee profitability. What matters is expectancy. It combines both your win rate and your reward-to-risk ratio into a single number that tells you whether your trading strategy has a positive edge. Almost no trading strategy will be profitable long-term if it has big losses.
Deciding How Much Data Is Enough
One of the biggest mistakes a trader makes is believing a small sample of trades proves they have found an edge. It doesn't. Small samples are heavily influenced by luck.
Imagine you test a new trading strategy for just 20 trades and it wins 14 of them. A 70 percent win rate sounds impressive, but after only 20 trades, it could simply be a lucky streak. The next 20 trades might win only 8, dropping the overall win rate to 55 percent.
Now suppose you test the same strategy over 200 trades and it still wins about 60 percent of the time. That result is much more believable because random luck has much less influence over a large sample.
The larger your sample size, the more confidence you can have that your results reflect the actual performance of the strategy instead of chance.
As a practical guideline:
Fewer than 30 trades tell you very little.Around 100 trades give you a reasonable first estimate.Around 200 trades provide much greater confidence.
Three hundred or more trades give you a much more reliable picture of whether a trading edge actually exists.
Professional traders understand that every new trading system is an experiment. They begin by risking small amounts of capital while collecting enough data to determine whether the strategy has a genuine positive expectancy in real trading. Only after the evidence consistently supports the strategy do they consider increasing position size.
The goal isn't to prove yourself right quickly. The goal is to gather enough evidence that you can trust the results. In trading, confidence should come from data, not from a handful of winning trades.
Position Size Is the Price of Uncertainty
Finding a profitable trading strategy is only half the job. The other half is deciding how much money to risk on each trade.
Many traders think they should risk more money once they find a strategy with a positive expectancy. The problem is that no backtest or historical study can tell you exactly how the strategy will perform in the future. Every estimate contains uncertainty.
That's why professional traders risk only a small percentage of their account on any single trade.
A common guideline is to risk between 1% and 2% of your account on each trade. This keeps a normal losing streak from causing serious damage while giving your edge enough trades to play out.
For example, suppose you have a $100,000 trading account and decide to risk 1 percent per trade. Your maximum loss is $1,000.
If your entry is $50 and your stop loss is $45, you are risking $5 per share. Divide your maximum dollar risk by your risk per share:
$1,000 ÷ $5 = 200 shares
Now suppose the same trade requires a wider stop at $40 instead of $45. Your risk is now $10 per share.
$1,000 ÷ $10 = 100 shares
Notice what changed. The stop-loss widened to twice its size, so your position size was cut in half. Yet your maximum loss remains $1,000.
This is how professional traders think about position sizing. They don't decide how many shares to buy first. They decide how much money they will lose if the trade is wrong, then calculate the correct position size based on that.
By keeping your dollar risk consistent from trade to trade, you give your trading edge the time it needs to work while protecting your account from the inevitable losing streaks that every profitable system experiences.
Change One Thing at a Time
Amateur traders often change several parts of their strategy at the same time after a losing streak. They might adjust their entry signal, move their stop loss, change their profit target, and increase or decrease their position size all at once. If the results improve, they have no way of knowing which change actually made the difference. If the results get worse, they don't know what caused that either. Good experiments change only one variable at a time.
For example, suppose you want to know whether a trailing stop performs better than a fixed profit target. Keep everything else exactly the same. Use the same 300 historical trades, the same entry rules, the same stop losses, and the same position sizing. The only difference is the exit method. Your original strategy produced an expectancy of 0.20R per trade. The trailing-stop version yields an expectancy of 0.30R per trade. Because only one rule changed, you can confidently conclude that the new exit method improved the strategy by 0.10R per trade. That improvement is measurable, repeatable, and gives you a solid foundation for testing the next idea.
Define System Failure in Advance
The habit that separates a scientific trader from an optimistic one is written into the trading plan before the first live order goes in, and it defines the conditions under which the system is declared invalid.
Something like this works: if the realized expectancy across any rolling 100 trades turns negative, or if drawdown exceeds 1.5 times the worst drawdown observed in testing, trading stops and the system goes back for review. A backtested maximum drawdown of 10R gives you a live shutdown level of 15R. Written in advance, dated, and treated as non-negotiable when the moment arrives.
That single paragraph in your plan defends you against the most expensive behavior in this business, which is continuing to trade a failed strategy idea with actual capital because quitting would feel like an admission that your research was wrong. A researcher whose hypothesis fails has not failed at research. They have removed one wrong path from their journey and moved on with their trading capital still intact.
What Intuition Is Actually For
None of this makes your instincts worthless. Instinct is a superb generator of hypotheses but usually a disastrous primary decision maker, and the mistake most traders make is assigning it the second job. It takes many years of market and trading experience to develop intuition, and that usually comes from seeing patterns in the markets repeatedly until it trains your subconscious. Everyone must use quantified data even after reaching that level.
For veteran traders, when something on a chart makes the hairs on your arms stand up, that reaction stems from thousands of hours of pattern exposure and often points to something real. Honor it by writing it down. Screenshot the chart, date it, describe the condition in numbers you could code, and drop it into a file of untested ideas. Then keep trading your tested rules. Once a month, pull three items out of that file and put them through the same process you just read about.
Most of them will probably fail. One might add to your R expectancy, which can add up. The errors are in missing your trade management ideas so you can't research them, either by ignoring the instinct or, far worse, betting on it live with no research on their viability.
Build the Scientific Method Into Your Trading Plan
Build a structured trade log with fixed columns (date, ticker, setup name, entry, initial stop loss, trailing stop, profit target, share count, R multiple, relative volume, sector, entry time, etc.) and complete every column on every trade without exception. Gather the data you will need to analyze.Convert each trading idea into a written hypothesis containing a defined entry condition, a defined exit condition, a defined measurement window, and a defined baseline it has to beat before it earns capital.Calculate monthly expectancy as (Win Rate x Avg Win in R) minus (Loss Rate x Avg Loss in R), and track it separately for each distinct setup and for the account.Refuse to draw conclusions before 30 trades; treat 100 to 200 as the confidence threshold, and always state your win rate as a range using the square root of p(1 minus p) divided by n rather than as a single number.Compute t = (Mean R divided by Std Dev of R) x the square root of n at every review, and hold risk at or below 1 percent of equity per trade until t clears 2.0.Set position size from the stop distance and a fixed fractional risk of 1 percent to 2 percent of equity, and calculate share count as risk dollars divided by stop distance per share.Test exactly one rule change per cycle against an unchanged trade list, and record the expectancy difference in R so every improvement has a documented cause.Write criteria that invalidate a strategy before going live (negative expectancy across a rolling 100 trades, or drawdown beyond 1.5 times the worst tested drawdown) and treat the trigger as automatic.Keep a dated file of untested instincts, with screenshots and numeric conditions, and promote three of them to formal testing on a fixed monthly schedule, rather than acting on them in real time.
If you liked this chapter sample, you can get a copy of my book on Amazon worldwide: How to Trade Like a Scientist: Use the Principles of Science to Build, Test, and Continuously Improve a Profitable Trading System
#WhatWillDriveCryptoandStocks’NextRebound? #USPPIMissMayEaseBTCPressure #TradFiForBeginners #BitcoinBreaksBelow200WeekMovingAverage #BitcoinCoreDisclosesTorTrafficVulnerability
How Traders Can Think Like a Scientist
Philosophy of Science: Science advances by testing ideas against evidence, not by defending beliefs.
Replace prediction and opinion with observation, evidence and repeatable decisions
Here is Chapter 1 from my book: How to Trade Like a Scientist: Use the Principles of Science to Build, Test, and Continuously Improve a Profitable Trading System
Two traders opened the same chart on the same morning. The first one says the stock looks strong and is probably beginning a new uptrend, so they buy it. The second pulls up a spreadsheet of 74 prior bullish 5-day / 20-day EMA crossovers, finds that the setup produced about a 60 percent win rate with an average 2:1 reward-to-risk ratio over a large sample of trades, and buys it too. Same trade, same entry price, same afternoon of uncertainty while the stock pulls back fifty cents after entry. Only one of those traders can tell you what they expect to happen over the next hundred trades, and only one of them knows they are executing a strategy with positive expectancy instead of acting on a hunch.
That difference is the whole subject of this book, and it starts with a procedure borrowed from the laboratory.
Observe something specific.Propose an explanation that could be wrong.Build a test capable of disproving that explanation.Gather enough data so that luck isn't driving the answer.Compare the result against what would have happened.Then run the idea again on data that you have never seen.Six steps. None of them asks you to predict anything.
Prediction is the habit that makes most retail traders unprofitable, and can be a slow leak over the years, while the trader feels intelligent the entire time. A trader who trades like a scientist exchanges a bad question for a much better one. Instead of asking what the market will do next, they ask how often a defined situation has produced a defined outcome, by how much, and measured against what. You will never know what the next trade does. You can know, within a stated margin of error, what one hundred trades of the same kind have done. That is a different kind of knowledge. Only the second one pays.
Observation Comes First
Every scientific discovery begins with someone writing what actually happened. For traders, that means a journal, though probably not the kind you have kept before. The emotional diary, where you record that you felt anxious and jumped in early, has some value for behavior, but it produces no data you can sort, filter, or test. What you want is a structured dataset with identical data fields on every row.
Record the date, ticker, setup name, entry price, initial stop, exit price, position size, and result in R multiples. R is your unit of risk, defined as the distance between your entry price and your original stop loss.
For example, suppose you buy a stock at $100 with an initial stop at $95. Your risk is $5 per share, so 1R equals $5. If you exit at $110, you earn $10 per share, or +2R. If you exit at $95, you lose $5.00 per share, or -1R.
Measuring every trade in R standardizes your results regardless of the stock's price or the number of shares traded. It allows you to compare trades objectively and evaluate the actual performance of your trading system, rather than being misled by raw dollar gains and losses.
Then record the context based on the market parameters you want to analyze. Was the S&P 500 above or below its 50-day moving average that day? What was the stock's Average True Range as a percentage of price, what was the volume against its 20-day average, which sector, and what time of day did you enter? A lot of columns of what feels like clerical work, but gives you valuable data to analyze. What is in those columns depends on which signals you find most valuable.
For the first few dozen trades, keeping detailed records can feel like busywork. However, with a much larger sample, patterns emerge. You may discover that your biggest losses consistently occur under certain market conditions, that one setup significantly outperforms another, or that trades taken outside your written rules rarely succeed.
Those insights don't come from memory. They come from data. A few minutes spent recording each trade creates a database that can reveal weaknesses to eliminate and strengths to exploit. Over the course of a trading career, those small daily habits can become one of the highest-return investments a trader ever makes. Today, many software platforms automate this.
Turning a Belief Into Something That Can Fail
Write an observation, and your brain immediately hands you a story explaining it. That story is a hypothesis. It only has value if it is specific enough to be proven wrong.
"Moving average crossovers make money" is an opinion, not a hypothesis. There is nothing specific to test.
Now compare it to this statement: when a specific stock's 5-day EMA crosses above its 20-day EMA, the trade produces a 60 percent win rate with an average reward-to-risk ratio of 2:1 over the next twenty trading days, when the same cross-under is used as an exit signal.
Every part of that statement can be tested. Another trader using the same rules should get nearly the same results. Most importantly, the hypothesis can be proven wrong. If the backtest shows only a 45 percent win rate with a 1:1 reward-to-risk ratio, you have discovered that the idea doesn't provide a profitable edge before risking real money.
That is why every trading idea should begin as a testable hypothesis, not a belief. A hypothesis tells you exactly what to measure and gives the market a chance to prove you wrong through live price action, backtesting, or historical chart studies. If a signal survives repeated testing across different stocks and market environments, you may have found a genuine edge. If it doesn't, you've saved yourself from trading a strategy that only sounded good in theory.
Measuring the Edge
Once you have a few hundred rows of data, one number matters more than anything else on your screen: the average result per trade in R units. Traders call it expectancy.
Expectancy is the average amount you can expect to make or lose on each trade over a large sample.
The formula is:
Expectancy = (Win Rate × Average Win in R) − (Loss Rate × Average Loss in R)
Suppose you analyze 100 trades and find a 40 percent win rate. Your average winning trade is 2R, and your average losing trade is 1R.
The math is simple:
(0.40 × 2) − (0.60 × 1) = 0.80 − 0.60 = +0.20R
Your expectancy is +0.20R per trade. If you risk $100 on every trade, your expected profit is $20 per trade over the long run. After 500 trades, your statistical expectation is about $10,000 in profits before commissions and slippage.
Now compare that to another system with a 70 percent win rate, an average winner of 1R, and an average loser of 3R.
(0.70 × 1) − (0.30 × 3) = 0.70 − 0.90 = -0.20R
Even though this trader wins seven out of every ten trades, the system loses an average of 0.20R per trade because the losses are much larger than the gains.
This is one of the most important lessons in trading. A high win rate does not guarantee profitability. What matters is expectancy. It combines both your win rate and your reward-to-risk ratio into a single number that tells you whether your trading strategy has a positive edge. Almost no trading strategy will be profitable long-term if it has big losses.
Deciding How Much Data Is Enough
One of the biggest mistakes a trader makes is believing a small sample of trades proves they have found an edge. It doesn't. Small samples are heavily influenced by luck.
Imagine you test a new trading strategy for just 20 trades and it wins 14 of them. A 70 percent win rate sounds impressive, but after only 20 trades, it could simply be a lucky streak. The next 20 trades might win only 8, dropping the overall win rate to 55 percent.
Now suppose you test the same strategy over 200 trades and it still wins about 60 percent of the time. That result is much more believable because random luck has much less influence over a large sample.
The larger your sample size, the more confidence you can have that your results reflect the actual performance of the strategy instead of chance.
As a practical guideline:
Fewer than 30 trades tell you very little.Around 100 trades give you a reasonable first estimate.Around 200 trades provide much greater confidence.
Three hundred or more trades give you a much more reliable picture of whether a trading edge actually exists.
Professional traders understand that every new trading system is an experiment. They begin by risking small amounts of capital while collecting enough data to determine whether the strategy has a genuine positive expectancy in real trading. Only after the evidence consistently supports the strategy do they consider increasing position size.
The goal isn't to prove yourself right quickly. The goal is to gather enough evidence that you can trust the results. In trading, confidence should come from data, not from a handful of winning trades.
Position Size Is the Price of Uncertainty
Finding a profitable trading strategy is only half the job. The other half is deciding how much money to risk on each trade.
Many traders think they should risk more money once they find a strategy with a positive expectancy. The problem is that no backtest or historical study can tell you exactly how the strategy will perform in the future. Every estimate contains uncertainty.
That's why professional traders risk only a small percentage of their account on any single trade.
A common guideline is to risk between 1% and 2% of your account on each trade. This keeps a normal losing streak from causing serious damage while giving your edge enough trades to play out.
For example, suppose you have a $100,000 trading account and decide to risk 1 percent per trade. Your maximum loss is $1,000.
If your entry is $50 and your stop loss is $45, you are risking $5 per share. Divide your maximum dollar risk by your risk per share:
$1,000 ÷ $5 = 200 shares
Now suppose the same trade requires a wider stop at $40 instead of $45. Your risk is now $10 per share.
$1,000 ÷ $10 = 100 shares
Notice what changed. The stop-loss widened to twice its size, so your position size was cut in half. Yet your maximum loss remains $1,000.
This is how professional traders think about position sizing. They don't decide how many shares to buy first. They decide how much money they will lose if the trade is wrong, then calculate the correct position size based on that.
By keeping your dollar risk consistent from trade to trade, you give your trading edge the time it needs to work while protecting your account from the inevitable losing streaks that every profitable system experiences.
Change One Thing at a Time
Amateur traders often change several parts of their strategy at the same time after a losing streak. They might adjust their entry signal, move their stop loss, change their profit target, and increase or decrease their position size all at once. If the results improve, they have no way of knowing which change actually made the difference. If the results get worse, they don't know what caused that either. Good experiments change only one variable at a time.
For example, suppose you want to know whether a trailing stop performs better than a fixed profit target. Keep everything else exactly the same. Use the same 300 historical trades, the same entry rules, the same stop losses, and the same position sizing. The only difference is the exit method. Your original strategy produced an expectancy of 0.20R per trade. The trailing-stop version yields an expectancy of 0.30R per trade. Because only one rule changed, you can confidently conclude that the new exit method improved the strategy by 0.10R per trade. That improvement is measurable, repeatable, and gives you a solid foundation for testing the next idea.
Define System Failure in Advance
The habit that separates a scientific trader from an optimistic one is written into the trading plan before the first live order goes in, and it defines the conditions under which the system is declared invalid.
Something like this works: if the realized expectancy across any rolling 100 trades turns negative, or if drawdown exceeds 1.5 times the worst drawdown observed in testing, trading stops and the system goes back for review. A backtested maximum drawdown of 10R gives you a live shutdown level of 15R. Written in advance, dated, and treated as non-negotiable when the moment arrives.
That single paragraph in your plan defends you against the most expensive behavior in this business, which is continuing to trade a failed strategy idea with actual capital because quitting would feel like an admission that your research was wrong. A researcher whose hypothesis fails has not failed at research. They have removed one wrong path from their journey and moved on with their trading capital still intact.
What Intuition Is Actually For
None of this makes your instincts worthless. Instinct is a superb generator of hypotheses but usually a disastrous primary decision maker, and the mistake most traders make is assigning it the second job. It takes many years of market and trading experience to develop intuition, and that usually comes from seeing patterns in the markets repeatedly until it trains your subconscious. Everyone must use quantified data even after reaching that level.
For veteran traders, when something on a chart makes the hairs on your arms stand up, that reaction stems from thousands of hours of pattern exposure and often points to something real. Honor it by writing it down. Screenshot the chart, date it, describe the condition in numbers you could code, and drop it into a file of untested ideas. Then keep trading your tested rules. Once a month, pull three items out of that file and put them through the same process you just read about.
Most of them will probably fail. One might add to your R expectancy, which can add up. The errors are in missing your trade management ideas so you can't research them, either by ignoring the instinct or, far worse, betting on it live with no research on their viability.
Build the Scientific Method Into Your Trading Plan
Build a structured trade log with fixed columns (date, ticker, setup name, entry, initial stop loss, trailing stop, profit target, share count, R multiple, relative volume, sector, entry time, etc.) and complete every column on every trade without exception. Gather the data you will need to analyze.Convert each trading idea into a written hypothesis containing a defined entry condition, a defined exit condition, a defined measurement window, and a defined baseline it has to beat before it earns capital.Calculate monthly expectancy as (Win Rate x Avg Win in R) minus (Loss Rate x Avg Loss in R), and track it separately for each distinct setup and for the account.Refuse to draw conclusions before 30 trades; treat 100 to 200 as the confidence threshold, and always state your win rate as a range using the square root of p(1 minus p) divided by n rather than as a single number.Compute t = (Mean R divided by Std Dev of R) x the square root of n at every review, and hold risk at or below 1 percent of equity per trade until t clears 2.0.Set position size from the stop distance and a fixed fractional risk of 1 percent to 2 percent of equity, and calculate share count as risk dollars divided by stop distance per share.Test exactly one rule change per cycle against an unchanged trade list, and record the expectancy difference in R so every improvement has a documented cause.Write criteria that invalidate a strategy before going live (negative expectancy across a rolling 100 trades, or drawdown beyond 1.5 times the worst tested drawdown) and treat the trigger as automatic.Keep a dated file of untested instincts, with screenshots and numeric conditions, and promote three of them to formal testing on a fixed monthly schedule, rather than acting on them in real time.
If you liked this chapter sample, you can get a copy of my book on Amazon worldwide: How to Trade Like a Scientist: Use the Principles of Science to Build, Test, and Continuously Improve a Profitable Trading System
#WhatWillDriveCryptoandStocks’NextRebound? #USPPIMissMayEaseBTCPressure #TradFiForBeginners #BitcoinBreaksBelow200WeekMovingAverage #BitcoinCoreDisclosesTorTrafficVulnerability
Replace prediction and opinion with observation, evidence and repeatable decisions
Here is Chapter 1 from my book: How to Trade Like a Scientist: Use the Principles of Science to Build, Test, and Continuously Improve a Profitable Trading System
Two traders opened the same chart on the same morning. The first one says the stock looks strong and is probably beginning a new uptrend, so they buy it. The second pulls up a spreadsheet of 74 prior bullish 5-day / 20-day EMA crossovers, finds that the setup produced about a 60 percent win rate with an average 2:1 reward-to-risk ratio over a large sample of trades, and buys it too. Same trade, same entry price, same afternoon of uncertainty while the stock pulls back fifty cents after entry. Only one of those traders can tell you what they expect to happen over the next hundred trades, and only one of them knows they are executing a strategy with positive expectancy instead of acting on a hunch.
That difference is the whole subject of this book, and it starts with a procedure borrowed from the laboratory.
Observe something specific.Propose an explanation that could be wrong.Build a test capable of disproving that explanation.Gather enough data so that luck isn't driving the answer.Compare the result against what would have happened.Then run the idea again on data that you have never seen.Six steps. None of them asks you to predict anything.
Prediction is the habit that makes most retail traders unprofitable, and can be a slow leak over the years, while the trader feels intelligent the entire time. A trader who trades like a scientist exchanges a bad question for a much better one. Instead of asking what the market will do next, they ask how often a defined situation has produced a defined outcome, by how much, and measured against what. You will never know what the next trade does. You can know, within a stated margin of error, what one hundred trades of the same kind have done. That is a different kind of knowledge. Only the second one pays.
Observation Comes First
Every scientific discovery begins with someone writing what actually happened. For traders, that means a journal, though probably not the kind you have kept before. The emotional diary, where you record that you felt anxious and jumped in early, has some value for behavior, but it produces no data you can sort, filter, or test. What you want is a structured dataset with identical data fields on every row.
Record the date, ticker, setup name, entry price, initial stop, exit price, position size, and result in R multiples. R is your unit of risk, defined as the distance between your entry price and your original stop loss.
For example, suppose you buy a stock at $100 with an initial stop at $95. Your risk is $5 per share, so 1R equals $5. If you exit at $110, you earn $10 per share, or +2R. If you exit at $95, you lose $5.00 per share, or -1R.
Measuring every trade in R standardizes your results regardless of the stock's price or the number of shares traded. It allows you to compare trades objectively and evaluate the actual performance of your trading system, rather than being misled by raw dollar gains and losses.
Then record the context based on the market parameters you want to analyze. Was the S&P 500 above or below its 50-day moving average that day? What was the stock's Average True Range as a percentage of price, what was the volume against its 20-day average, which sector, and what time of day did you enter? A lot of columns of what feels like clerical work, but gives you valuable data to analyze. What is in those columns depends on which signals you find most valuable.
For the first few dozen trades, keeping detailed records can feel like busywork. However, with a much larger sample, patterns emerge. You may discover that your biggest losses consistently occur under certain market conditions, that one setup significantly outperforms another, or that trades taken outside your written rules rarely succeed.
Those insights don't come from memory. They come from data. A few minutes spent recording each trade creates a database that can reveal weaknesses to eliminate and strengths to exploit. Over the course of a trading career, those small daily habits can become one of the highest-return investments a trader ever makes. Today, many software platforms automate this.
Turning a Belief Into Something That Can Fail
Write an observation, and your brain immediately hands you a story explaining it. That story is a hypothesis. It only has value if it is specific enough to be proven wrong.
"Moving average crossovers make money" is an opinion, not a hypothesis. There is nothing specific to test.
Now compare it to this statement: when a specific stock's 5-day EMA crosses above its 20-day EMA, the trade produces a 60 percent win rate with an average reward-to-risk ratio of 2:1 over the next twenty trading days, when the same cross-under is used as an exit signal.
Every part of that statement can be tested. Another trader using the same rules should get nearly the same results. Most importantly, the hypothesis can be proven wrong. If the backtest shows only a 45 percent win rate with a 1:1 reward-to-risk ratio, you have discovered that the idea doesn't provide a profitable edge before risking real money.
That is why every trading idea should begin as a testable hypothesis, not a belief. A hypothesis tells you exactly what to measure and gives the market a chance to prove you wrong through live price action, backtesting, or historical chart studies. If a signal survives repeated testing across different stocks and market environments, you may have found a genuine edge. If it doesn't, you've saved yourself from trading a strategy that only sounded good in theory.
Measuring the Edge
Once you have a few hundred rows of data, one number matters more than anything else on your screen: the average result per trade in R units. Traders call it expectancy.
Expectancy is the average amount you can expect to make or lose on each trade over a large sample.
The formula is:
Expectancy = (Win Rate × Average Win in R) − (Loss Rate × Average Loss in R)
Suppose you analyze 100 trades and find a 40 percent win rate. Your average winning trade is 2R, and your average losing trade is 1R.
The math is simple:
(0.40 × 2) − (0.60 × 1) = 0.80 − 0.60 = +0.20R
Your expectancy is +0.20R per trade. If you risk $100 on every trade, your expected profit is $20 per trade over the long run. After 500 trades, your statistical expectation is about $10,000 in profits before commissions and slippage.
Now compare that to another system with a 70 percent win rate, an average winner of 1R, and an average loser of 3R.
(0.70 × 1) − (0.30 × 3) = 0.70 − 0.90 = -0.20R
Even though this trader wins seven out of every ten trades, the system loses an average of 0.20R per trade because the losses are much larger than the gains.
This is one of the most important lessons in trading. A high win rate does not guarantee profitability. What matters is expectancy. It combines both your win rate and your reward-to-risk ratio into a single number that tells you whether your trading strategy has a positive edge. Almost no trading strategy will be profitable long-term if it has big losses.
Deciding How Much Data Is Enough
One of the biggest mistakes a trader makes is believing a small sample of trades proves they have found an edge. It doesn't. Small samples are heavily influenced by luck.
Imagine you test a new trading strategy for just 20 trades and it wins 14 of them. A 70 percent win rate sounds impressive, but after only 20 trades, it could simply be a lucky streak. The next 20 trades might win only 8, dropping the overall win rate to 55 percent.
Now suppose you test the same strategy over 200 trades and it still wins about 60 percent of the time. That result is much more believable because random luck has much less influence over a large sample.
The larger your sample size, the more confidence you can have that your results reflect the actual performance of the strategy instead of chance.
As a practical guideline:
Fewer than 30 trades tell you very little.Around 100 trades give you a reasonable first estimate.Around 200 trades provide much greater confidence.
Three hundred or more trades give you a much more reliable picture of whether a trading edge actually exists.
Professional traders understand that every new trading system is an experiment. They begin by risking small amounts of capital while collecting enough data to determine whether the strategy has a genuine positive expectancy in real trading. Only after the evidence consistently supports the strategy do they consider increasing position size.
The goal isn't to prove yourself right quickly. The goal is to gather enough evidence that you can trust the results. In trading, confidence should come from data, not from a handful of winning trades.
Position Size Is the Price of Uncertainty
Finding a profitable trading strategy is only half the job. The other half is deciding how much money to risk on each trade.
Many traders think they should risk more money once they find a strategy with a positive expectancy. The problem is that no backtest or historical study can tell you exactly how the strategy will perform in the future. Every estimate contains uncertainty.
That's why professional traders risk only a small percentage of their account on any single trade.
A common guideline is to risk between 1% and 2% of your account on each trade. This keeps a normal losing streak from causing serious damage while giving your edge enough trades to play out.
For example, suppose you have a $100,000 trading account and decide to risk 1 percent per trade. Your maximum loss is $1,000.
If your entry is $50 and your stop loss is $45, you are risking $5 per share. Divide your maximum dollar risk by your risk per share:
$1,000 ÷ $5 = 200 shares
Now suppose the same trade requires a wider stop at $40 instead of $45. Your risk is now $10 per share.
$1,000 ÷ $10 = 100 shares
Notice what changed. The stop-loss widened to twice its size, so your position size was cut in half. Yet your maximum loss remains $1,000.
This is how professional traders think about position sizing. They don't decide how many shares to buy first. They decide how much money they will lose if the trade is wrong, then calculate the correct position size based on that.
By keeping your dollar risk consistent from trade to trade, you give your trading edge the time it needs to work while protecting your account from the inevitable losing streaks that every profitable system experiences.
Change One Thing at a Time
Amateur traders often change several parts of their strategy at the same time after a losing streak. They might adjust their entry signal, move their stop loss, change their profit target, and increase or decrease their position size all at once. If the results improve, they have no way of knowing which change actually made the difference. If the results get worse, they don't know what caused that either. Good experiments change only one variable at a time.
For example, suppose you want to know whether a trailing stop performs better than a fixed profit target. Keep everything else exactly the same. Use the same 300 historical trades, the same entry rules, the same stop losses, and the same position sizing. The only difference is the exit method. Your original strategy produced an expectancy of 0.20R per trade. The trailing-stop version yields an expectancy of 0.30R per trade. Because only one rule changed, you can confidently conclude that the new exit method improved the strategy by 0.10R per trade. That improvement is measurable, repeatable, and gives you a solid foundation for testing the next idea.
Define System Failure in Advance
The habit that separates a scientific trader from an optimistic one is written into the trading plan before the first live order goes in, and it defines the conditions under which the system is declared invalid.
Something like this works: if the realized expectancy across any rolling 100 trades turns negative, or if drawdown exceeds 1.5 times the worst drawdown observed in testing, trading stops and the system goes back for review. A backtested maximum drawdown of 10R gives you a live shutdown level of 15R. Written in advance, dated, and treated as non-negotiable when the moment arrives.
That single paragraph in your plan defends you against the most expensive behavior in this business, which is continuing to trade a failed strategy idea with actual capital because quitting would feel like an admission that your research was wrong. A researcher whose hypothesis fails has not failed at research. They have removed one wrong path from their journey and moved on with their trading capital still intact.
What Intuition Is Actually For
None of this makes your instincts worthless. Instinct is a superb generator of hypotheses but usually a disastrous primary decision maker, and the mistake most traders make is assigning it the second job. It takes many years of market and trading experience to develop intuition, and that usually comes from seeing patterns in the markets repeatedly until it trains your subconscious. Everyone must use quantified data even after reaching that level.
For veteran traders, when something on a chart makes the hairs on your arms stand up, that reaction stems from thousands of hours of pattern exposure and often points to something real. Honor it by writing it down. Screenshot the chart, date it, describe the condition in numbers you could code, and drop it into a file of untested ideas. Then keep trading your tested rules. Once a month, pull three items out of that file and put them through the same process you just read about.
Most of them will probably fail. One might add to your R expectancy, which can add up. The errors are in missing your trade management ideas so you can't research them, either by ignoring the instinct or, far worse, betting on it live with no research on their viability.
Build the Scientific Method Into Your Trading Plan
Build a structured trade log with fixed columns (date, ticker, setup name, entry, initial stop loss, trailing stop, profit target, share count, R multiple, relative volume, sector, entry time, etc.) and complete every column on every trade without exception. Gather the data you will need to analyze.Convert each trading idea into a written hypothesis containing a defined entry condition, a defined exit condition, a defined measurement window, and a defined baseline it has to beat before it earns capital.Calculate monthly expectancy as (Win Rate x Avg Win in R) minus (Loss Rate x Avg Loss in R), and track it separately for each distinct setup and for the account.Refuse to draw conclusions before 30 trades; treat 100 to 200 as the confidence threshold, and always state your win rate as a range using the square root of p(1 minus p) divided by n rather than as a single number.Compute t = (Mean R divided by Std Dev of R) x the square root of n at every review, and hold risk at or below 1 percent of equity per trade until t clears 2.0.Set position size from the stop distance and a fixed fractional risk of 1 percent to 2 percent of equity, and calculate share count as risk dollars divided by stop distance per share.Test exactly one rule change per cycle against an unchanged trade list, and record the expectancy difference in R so every improvement has a documented cause.Write criteria that invalidate a strategy before going live (negative expectancy across a rolling 100 trades, or drawdown beyond 1.5 times the worst tested drawdown) and treat the trigger as automatic.Keep a dated file of untested instincts, with screenshots and numeric conditions, and promote three of them to formal testing on a fixed monthly schedule, rather than acting on them in real time.
If you liked this chapter sample, you can get a copy of my book on Amazon worldwide: How to Trade Like a Scientist: Use the Principles of Science to Build, Test, and Continuously Improve a Profitable Trading System
#WhatWillDriveCryptoandStocks’NextRebound? #USPPIMissMayEaseBTCPressure #TradFiForBeginners #BitcoinBreaksBelow200WeekMovingAverage #BitcoinCoreDisclosesTorTrafficVulnerability
16
·
--
Artículo
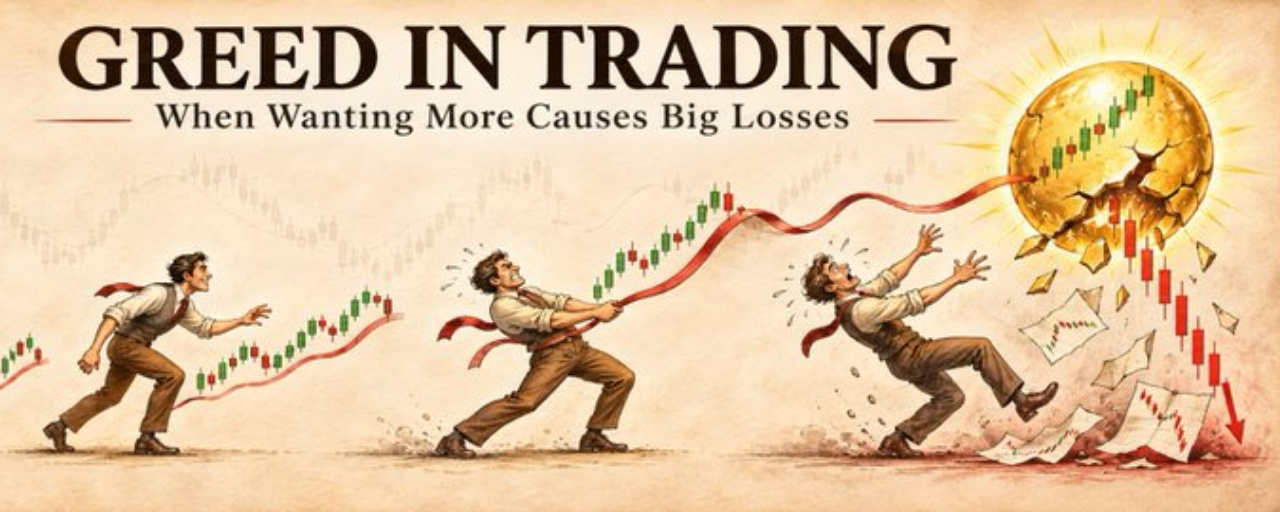
La codicia en el trading: cuando querer más provoca grandes pérdidasLa codicia es la única emoción que se siente como un éxito mientras te está destruyendo.
Tu posición en acciones sube un 10 % y sigue escalando. Tu plan original era recoger ganancias al llegar al 10 %, pero ahora piensas: «¿Y si llega al 20 %? ¿O al 30 %?». Las cifras siguen creciendo y te sientes un genio mientras ves aumentar tus ganancias no realizadas. Entonces el mercado se da la vuelta. Tu ganancia del 10 % se convierte en un 5 %, luego en una pérdida y, de repente, ves cómo una operación que podría haber sido rentable termina en pérdidas. Eso es la codicia en acción, y acaba de costarte dinero de verdad.
La codicia en el trading: cuando querer más provoca grandes pérdidas
La codicia es la única emoción que se siente como un éxito mientras te está destruyendo.
Tu posición en acciones sube un 10 % y sigue escalando. Tu plan original era recoger ganancias al llegar al 10 %, pero ahora piensas: «¿Y si llega al 20 %? ¿O al 30 %?». Las cifras siguen creciendo y te sientes un genio mientras ves aumentar tus ganancias no realizadas. Entonces el mercado se da la vuelta. Tu ganancia del 10 % se convierte en un 5 %, luego en una pérdida y, de repente, ves cómo una operación que podría haber sido rentable termina en pérdidas. Eso es la codicia en acción, y acaba de costarte dinero de verdad.
Tu posición en acciones sube un 10 % y sigue escalando. Tu plan original era recoger ganancias al llegar al 10 %, pero ahora piensas: «¿Y si llega al 20 %? ¿O al 30 %?». Las cifras siguen creciendo y te sientes un genio mientras ves aumentar tus ganancias no realizadas. Entonces el mercado se da la vuelta. Tu ganancia del 10 % se convierte en un 5 %, luego en una pérdida y, de repente, ves cómo una operación que podría haber sido rentable termina en pérdidas. Eso es la codicia en acción, y acaba de costarte dinero de verdad.
24
·
--
Artículo
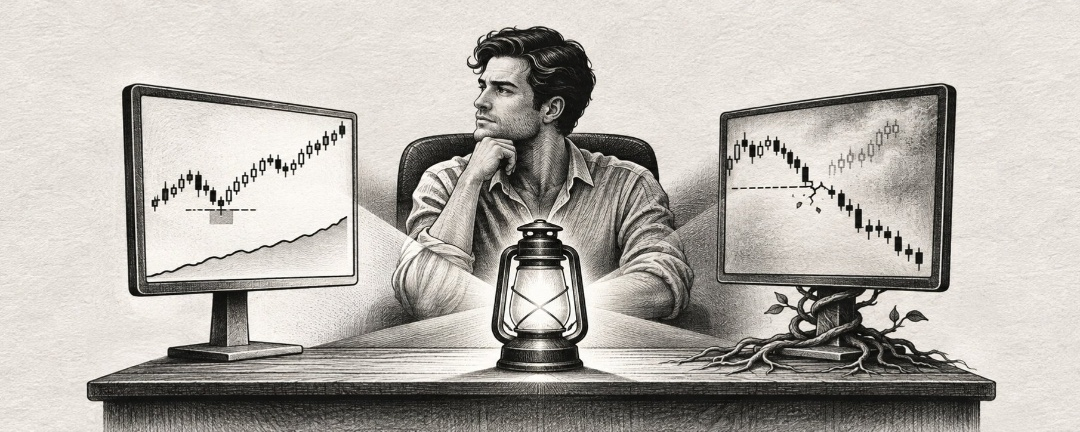
La esperanza: el arma de doble filo del traderLa esperanza es la emoción más peligrosa en el trading, porque parece una virtud mientras actúa como un vicio.
Compraste una acción a 50 $ después de que un análisis minucioso indicara que estaba infravalorada en términos fundamentales y técnicamente sobrevendida. La empresa tenía buenos resultados y una buena dirección, y confiabas en tu investigación. La acción subió a 60 $, lo que confirmó tu tesis y te hizo sentir inteligente. Entonces, se publicaron unos resultados ligeramente inferiores a lo esperado y la acción cayó a 45 $. Habías fijado un nivel de stop loss en 47 $, pero no lo ejecutaste porque esperabas que se recuperara. Al fin y al cabo, los fundamentos no habían cambiado realmente y, sin duda, el mercado estaba reaccionando de forma exagerada.
La esperanza: el arma de doble filo del trader
La esperanza es la emoción más peligrosa en el trading, porque parece una virtud mientras actúa como un vicio.
Compraste una acción a 50 $ después de que un análisis minucioso indicara que estaba infravalorada en términos fundamentales y técnicamente sobrevendida. La empresa tenía buenos resultados y una buena dirección, y confiabas en tu investigación. La acción subió a 60 $, lo que confirmó tu tesis y te hizo sentir inteligente. Entonces, se publicaron unos resultados ligeramente inferiores a lo esperado y la acción cayó a 45 $. Habías fijado un nivel de stop loss en 47 $, pero no lo ejecutaste porque esperabas que se recuperara. Al fin y al cabo, los fundamentos no habían cambiado realmente y, sin duda, el mercado estaba reaccionando de forma exagerada.
Compraste una acción a 50 $ después de que un análisis minucioso indicara que estaba infravalorada en términos fundamentales y técnicamente sobrevendida. La empresa tenía buenos resultados y una buena dirección, y confiabas en tu investigación. La acción subió a 60 $, lo que confirmó tu tesis y te hizo sentir inteligente. Entonces, se publicaron unos resultados ligeramente inferiores a lo esperado y la acción cayó a 45 $. Habías fijado un nivel de stop loss en 47 $, pero no lo ejecutaste porque esperabas que se recuperara. Al fin y al cabo, los fundamentos no habían cambiado realmente y, sin duda, el mercado estaba reaccionando de forma exagerada.
3
·
--
Artículo
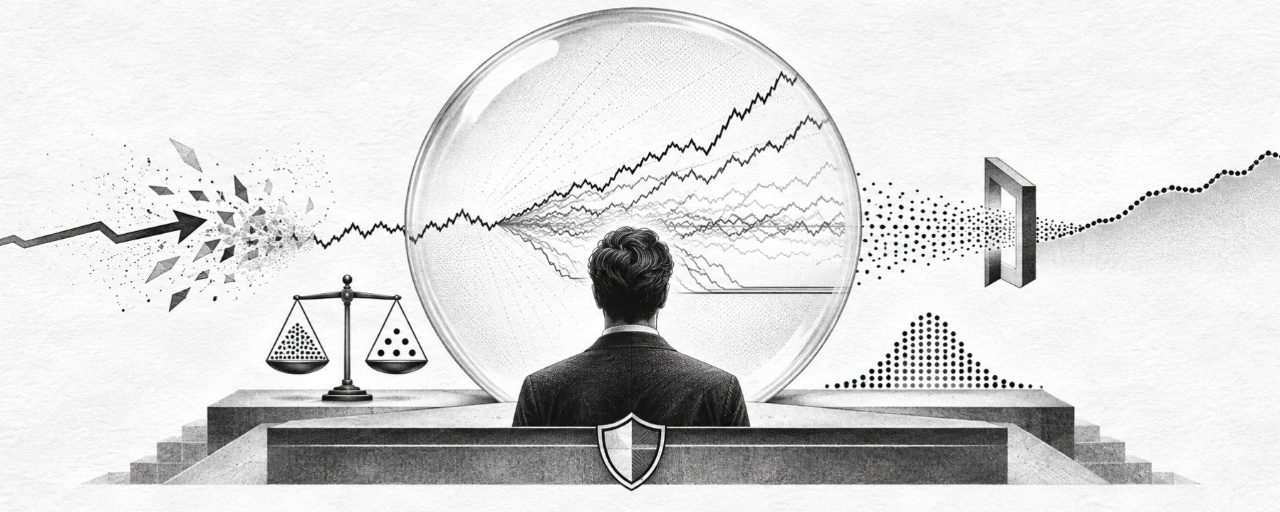
Pensar en probabilidades, no en predicciones ni opinionesOperar la distribución, sin obsesionarse con los resultados a corto plazo
Nunca sabrás qué va a hacer el mercado. Nadie lo sabe. El analista de televisión no lo sabe, y el gestor de fondos que habla con seguridad tampoco. Tú tampoco, por muy bien que se vea tu gráfico al abrir una posición. Si entiendes esta idea, ya estás por delante de la mayoría de las personas contra las que operas. La mayoría de quienes están al otro lado de tus operaciones dedicará todo su tiempo a perseguir lo imposible: predecir el futuro.
Pensar en probabilidades, no en predicciones ni opiniones
Operar la distribución, sin obsesionarse con los resultados a corto plazo
Nunca sabrás qué va a hacer el mercado. Nadie lo sabe. El analista de televisión no lo sabe, y el gestor de fondos que habla con seguridad tampoco. Tú tampoco, por muy bien que se vea tu gráfico al abrir una posición. Si entiendes esta idea, ya estás por delante de la mayoría de las personas contra las que operas. La mayoría de quienes están al otro lado de tus operaciones dedicará todo su tiempo a perseguir lo imposible: predecir el futuro.
Nunca sabrás qué va a hacer el mercado. Nadie lo sabe. El analista de televisión no lo sabe, y el gestor de fondos que habla con seguridad tampoco. Tú tampoco, por muy bien que se vea tu gráfico al abrir una posición. Si entiendes esta idea, ya estás por delante de la mayoría de las personas contra las que operas. La mayoría de quienes están al otro lado de tus operaciones dedicará todo su tiempo a perseguir lo imposible: predecir el futuro.
128
·
--
Alcista
Parcialmente cierto
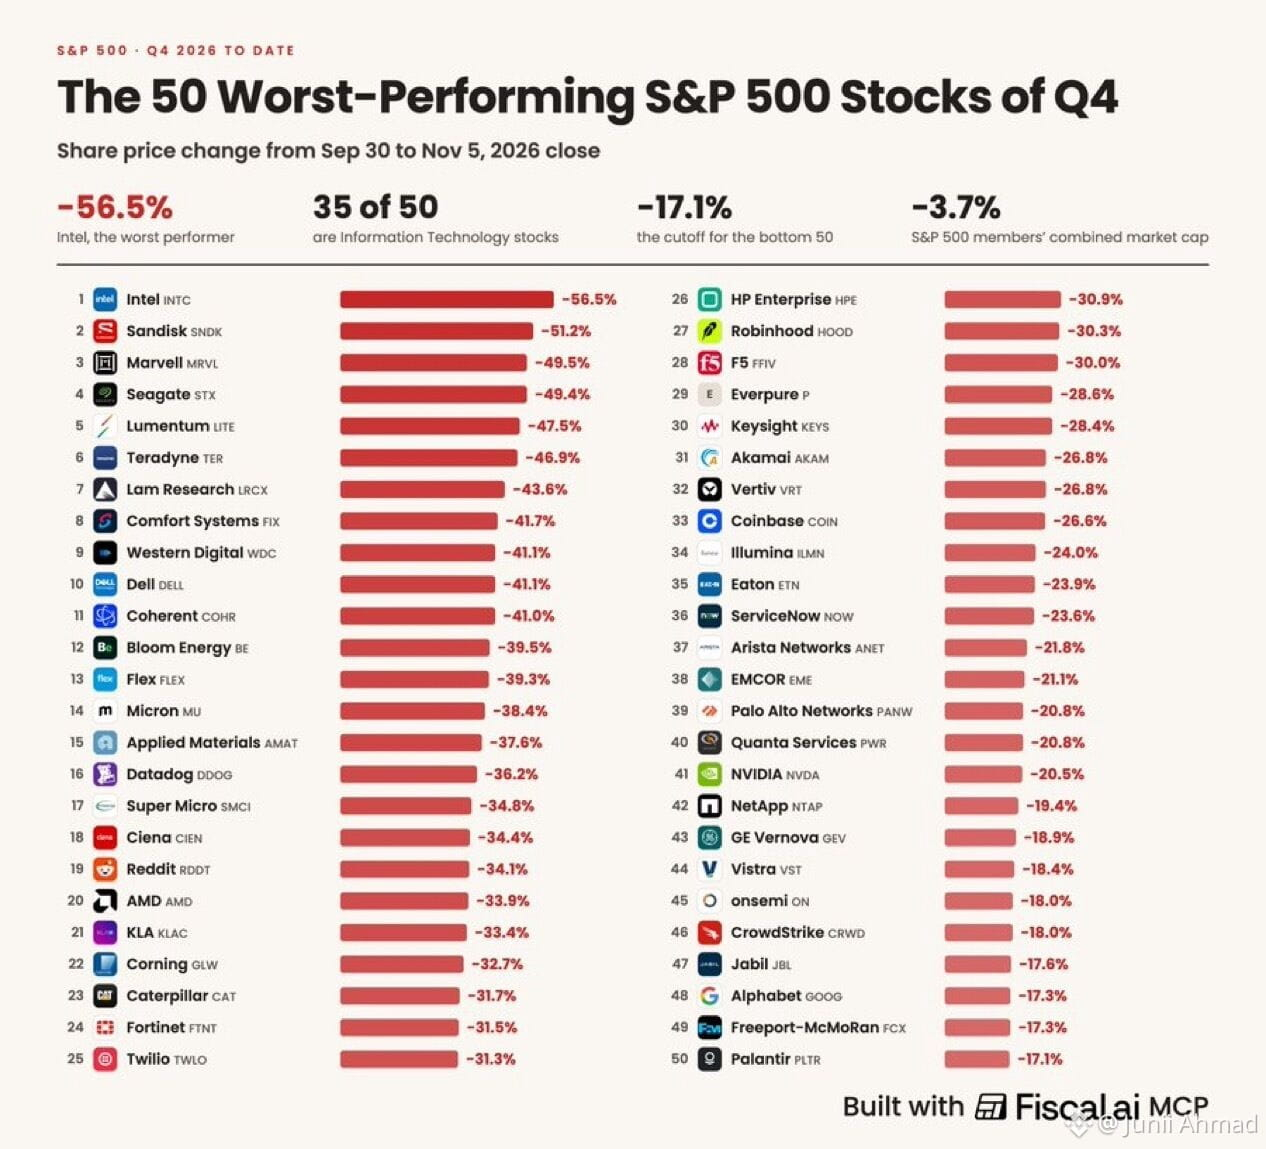
🚨ACTUALIZACIÓN: Intel encabeza las acciones con peor rendimiento del S&P 500 en el cuarto trimestre, con una caída del 56,5%; las empresas tecnológicas representan 35 de las 50 mayores caídas hasta el 5 de noviembre, según Fiscalai.
..........................?...............?.......................
#JobsReportRaisesHikeOdds #BitcoinRebounds$75KAsChipsLead #US Data Center Rules May Constrain AI Expansion #WillAnthropicListOnTime #CPITestsDecemberRateOutlook
🚨ACTUALIZACIÓN: Intel encabeza las acciones con peor rendimiento del S&P 500 en el cuarto trimestre, con una caída del 56,5%; las empresas tecnológicas representan 35 de las 50 mayores caídas hasta el 5 de noviembre, según Fiscalai.
..........................?...............?.......................
#JobsReportRaisesHikeOdds #BitcoinRebounds$75KAsChipsLead #US Data Center Rules May Constrain AI Expansion #WillAnthropicListOnTime #CPITestsDecemberRateOutlook
..........................?...............?.......................
#JobsReportRaisesHikeOdds #BitcoinRebounds$75KAsChipsLead #US Data Center Rules May Constrain AI Expansion #WillAnthropicListOnTime #CPITestsDecemberRateOutlook
393
·
--
Verificado
⚠️
ÚLTIMA HORA:
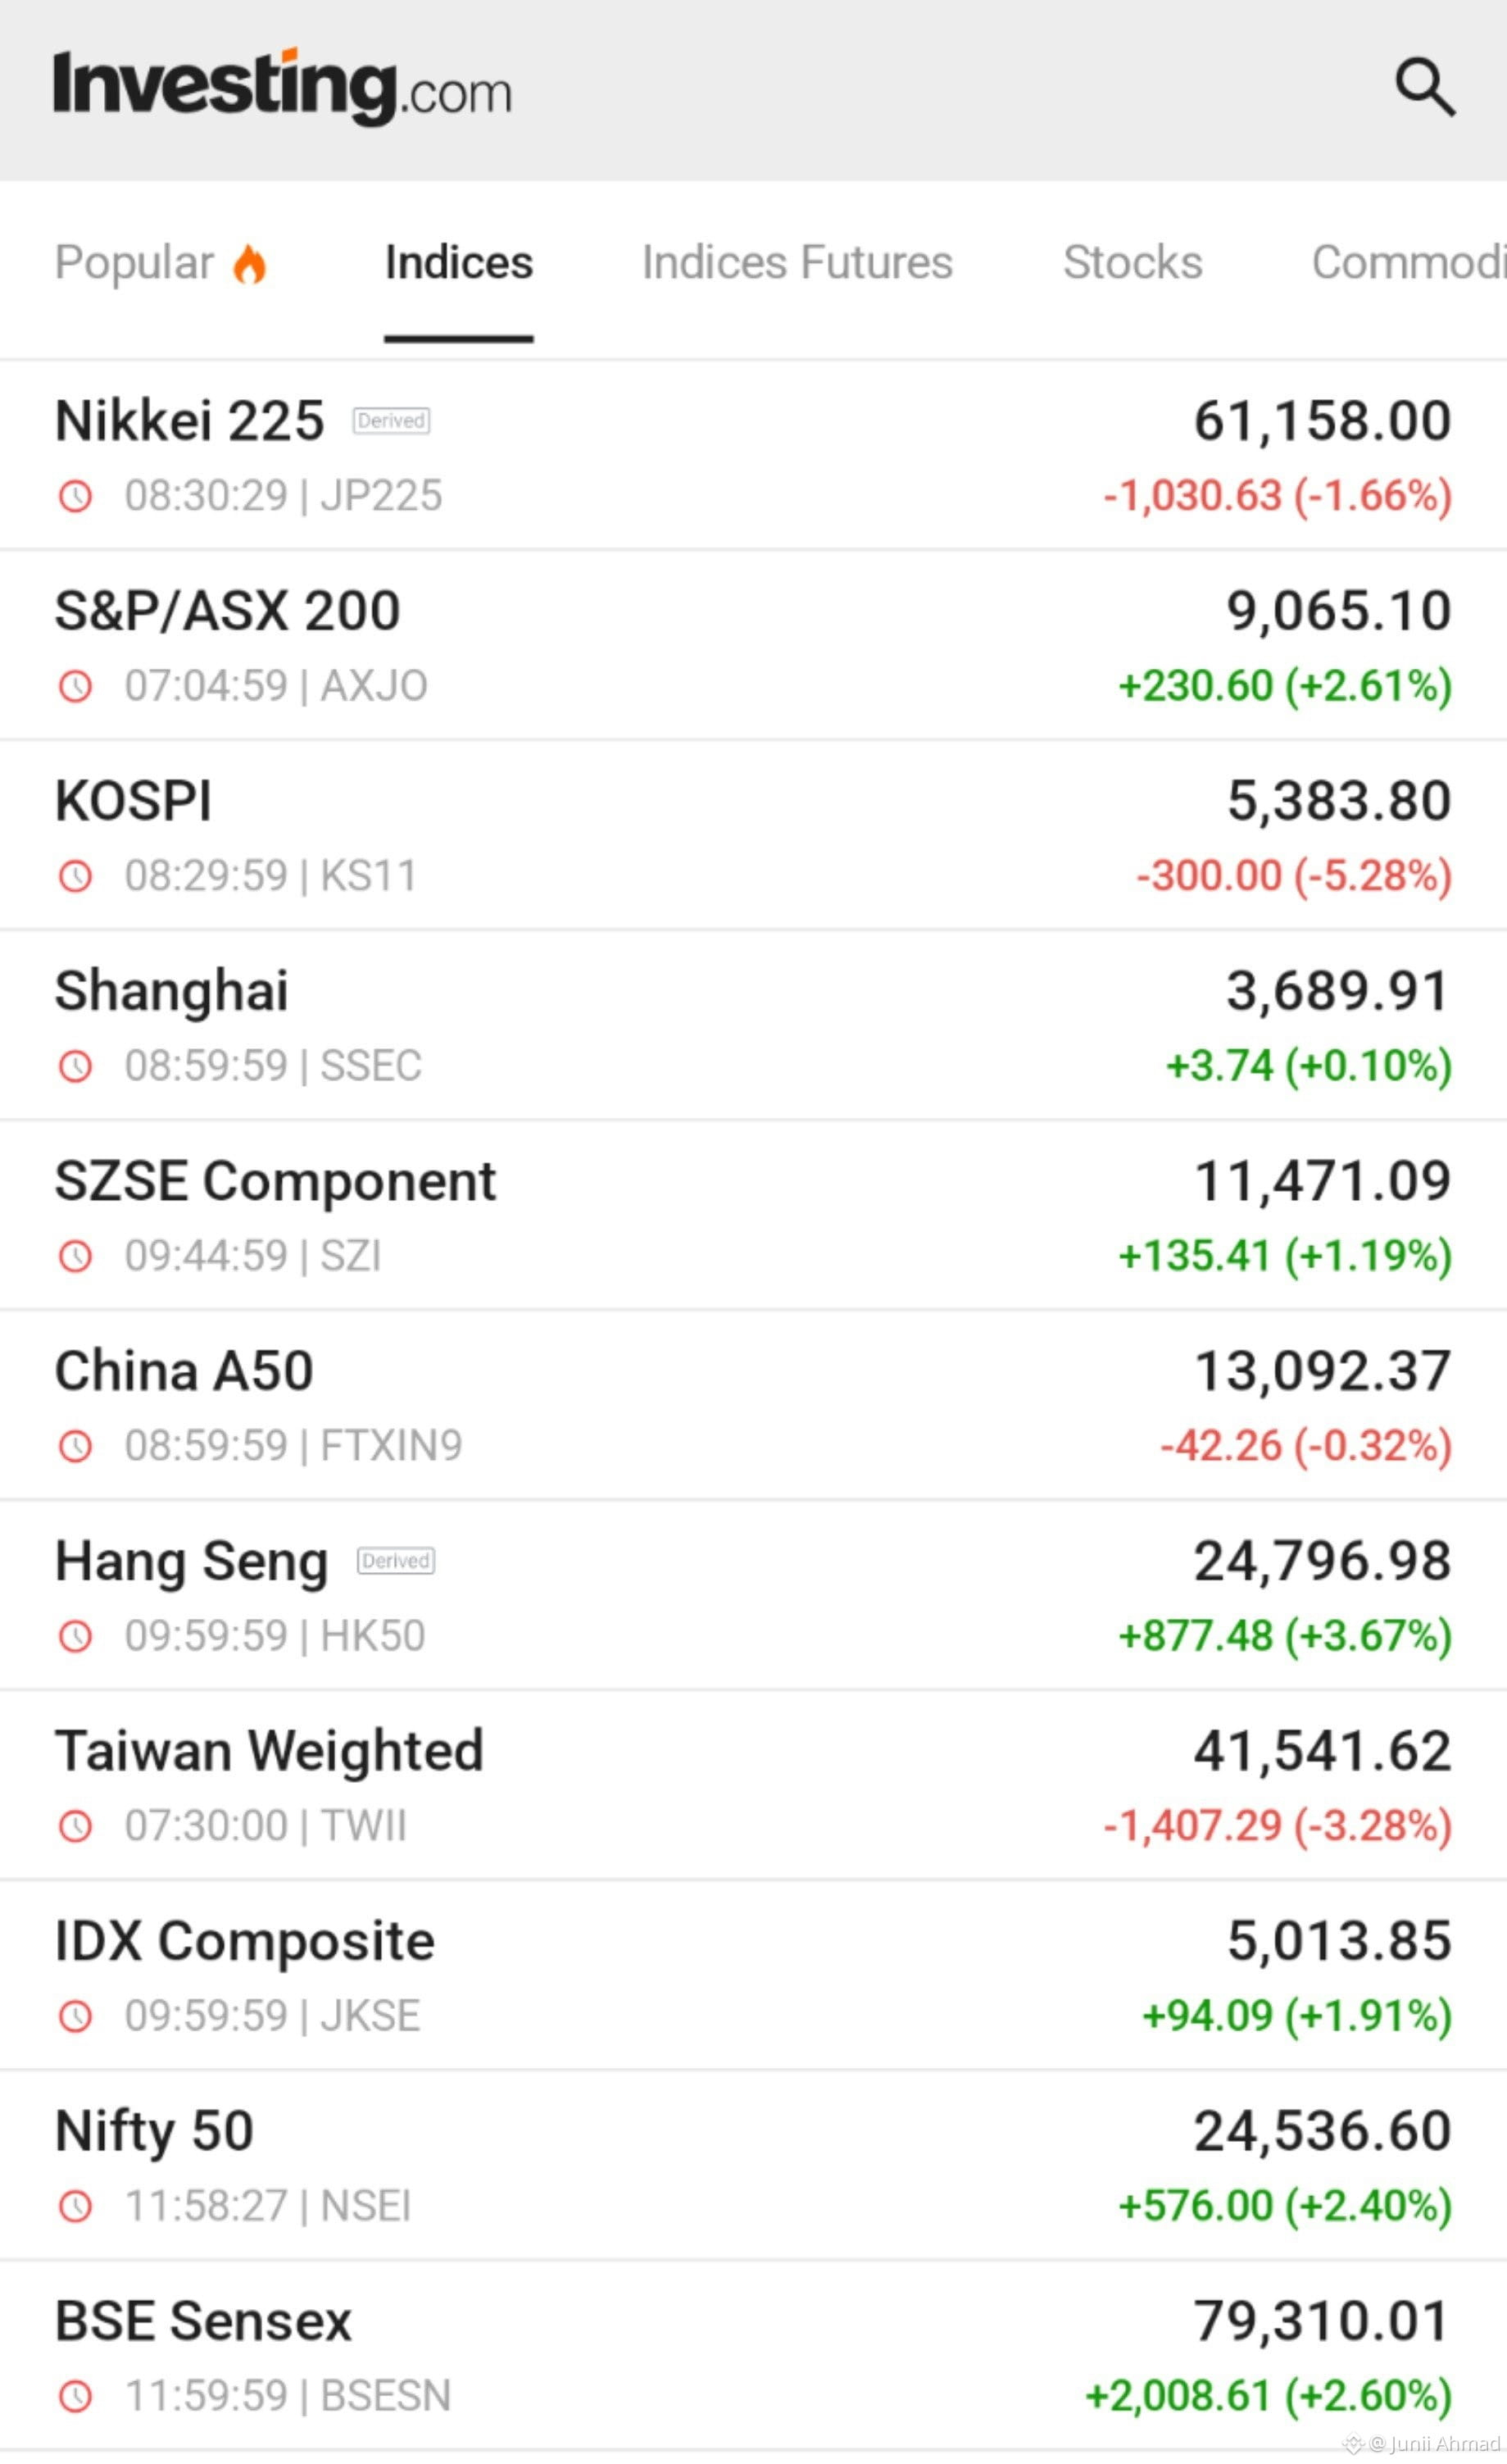
*LOS MERCADOS DE ASIA-PACÍFICO CIERRAN CON RESULTADOS DISpares EN LA REGIÓN; EL KOSPI DE COREA CAE UN 5,3 %
#BinanceReopensWithdrawalsForMoreAssets #BTCRebounds80K #Binance98PercentReplenished #ADPUSPrivateEmployersAdd86000JobsInOctober #USMidterms-WhatAreMarketsExpecting?
⚠️
ÚLTIMA HORA:
*LOS MERCADOS DE ASIA-PACÍFICO CIERRAN CON RESULTADOS DISpares EN LA REGIÓN; EL KOSPI DE COREA CAE UN 5,3 %
#BinanceReopensWithdrawalsForMoreAssets #BTCRebounds80K #Binance98PercentReplenished #ADPUSPrivateEmployersAdd86000JobsInOctober #USMidterms-WhatAreMarketsExpecting?
ÚLTIMA HORA:
*LOS MERCADOS DE ASIA-PACÍFICO CIERRAN CON RESULTADOS DISpares EN LA REGIÓN; EL KOSPI DE COREA CAE UN 5,3 %
#BinanceReopensWithdrawalsForMoreAssets #BTCRebounds80K #Binance98PercentReplenished #ADPUSPrivateEmployersAdd86000JobsInOctober #USMidterms-WhatAreMarketsExpecting?
42
·
--
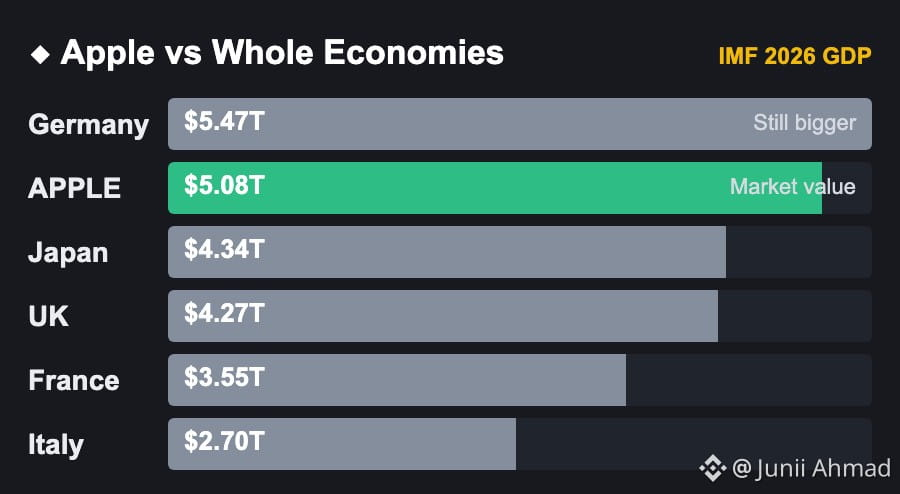
APPLE AHORA VALE 5,08 BILLONES DE DÓLARES.
Más que toda la economía anual de:
Japón: 4,34 billones de dólares
Reino Unido: 4,27 billones de dólares
Francia: 3,55 billones de dólares
Italia: 2,70 billones de dólares
Solo tres países son más grandes: Estados Unidos, China y Alemania.
Una sola empresa de telefonía.
#BinanceReopensWithdrawalsForMoreAssets #BTCRebounds80K #Binance98PercentReplenished #ADPUSPrivateEmployersAdd86000JobsInOctober #USMidterms-WhatAreMarketsExpecting?
APPLE AHORA VALE 5,08 BILLONES DE DÓLARES.
Más que toda la economía anual de:
Japón: 4,34 billones de dólares
Reino Unido: 4,27 billones de dólares
Francia: 3,55 billones de dólares
Italia: 2,70 billones de dólares
Solo tres países son más grandes: Estados Unidos, China y Alemania.
Una sola empresa de telefonía.
#BinanceReopensWithdrawalsForMoreAssets #BTCRebounds80K #Binance98PercentReplenished #ADPUSPrivateEmployersAdd86000JobsInOctober #USMidterms-WhatAreMarketsExpecting?
Más que toda la economía anual de:
Japón: 4,34 billones de dólares
Reino Unido: 4,27 billones de dólares
Francia: 3,55 billones de dólares
Italia: 2,70 billones de dólares
Solo tres países son más grandes: Estados Unidos, China y Alemania.
Una sola empresa de telefonía.
#BinanceReopensWithdrawalsForMoreAssets #BTCRebounds80K #Binance98PercentReplenished #ADPUSPrivateEmployersAdd86000JobsInOctober #USMidterms-WhatAreMarketsExpecting?
203
·
--
Verificado
🚨
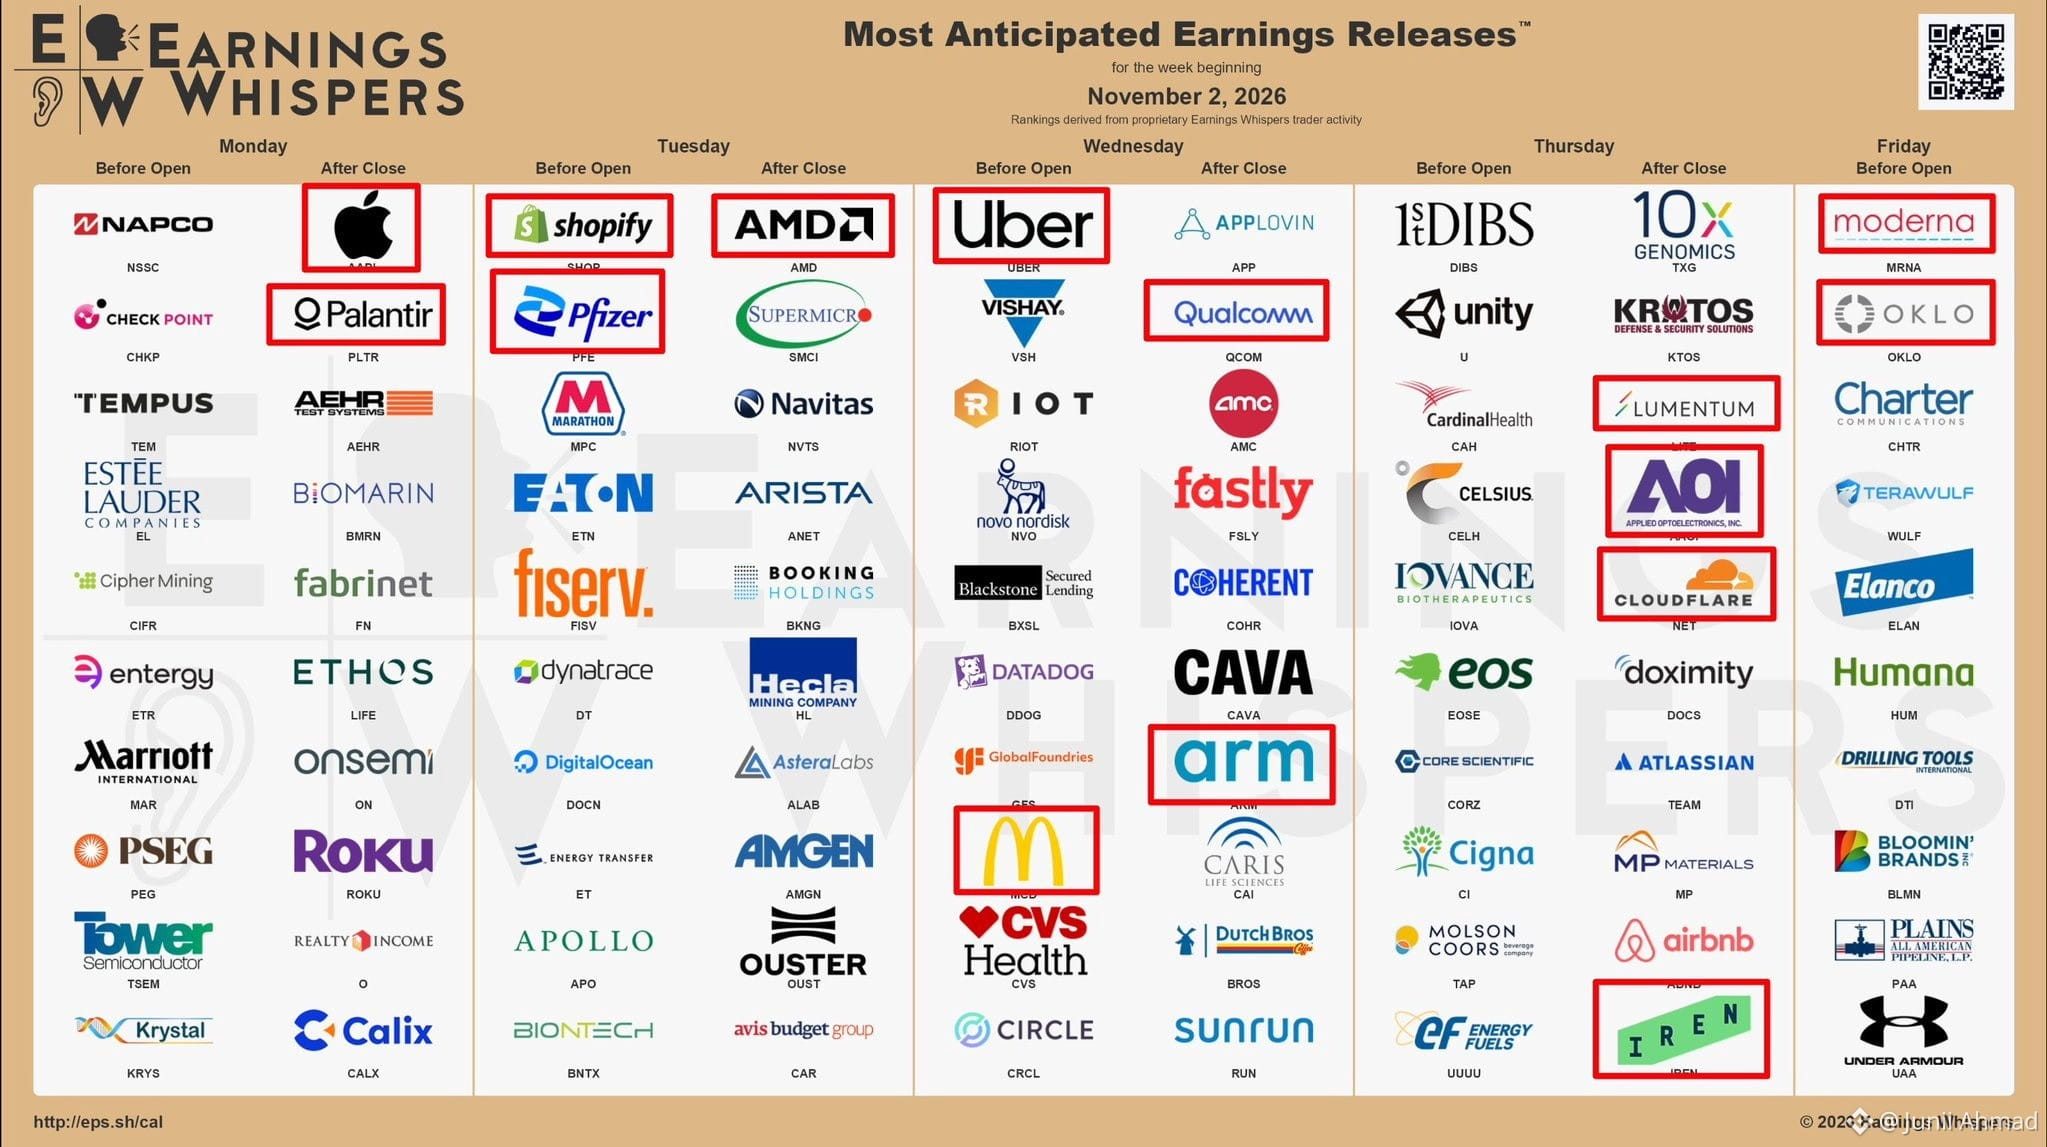
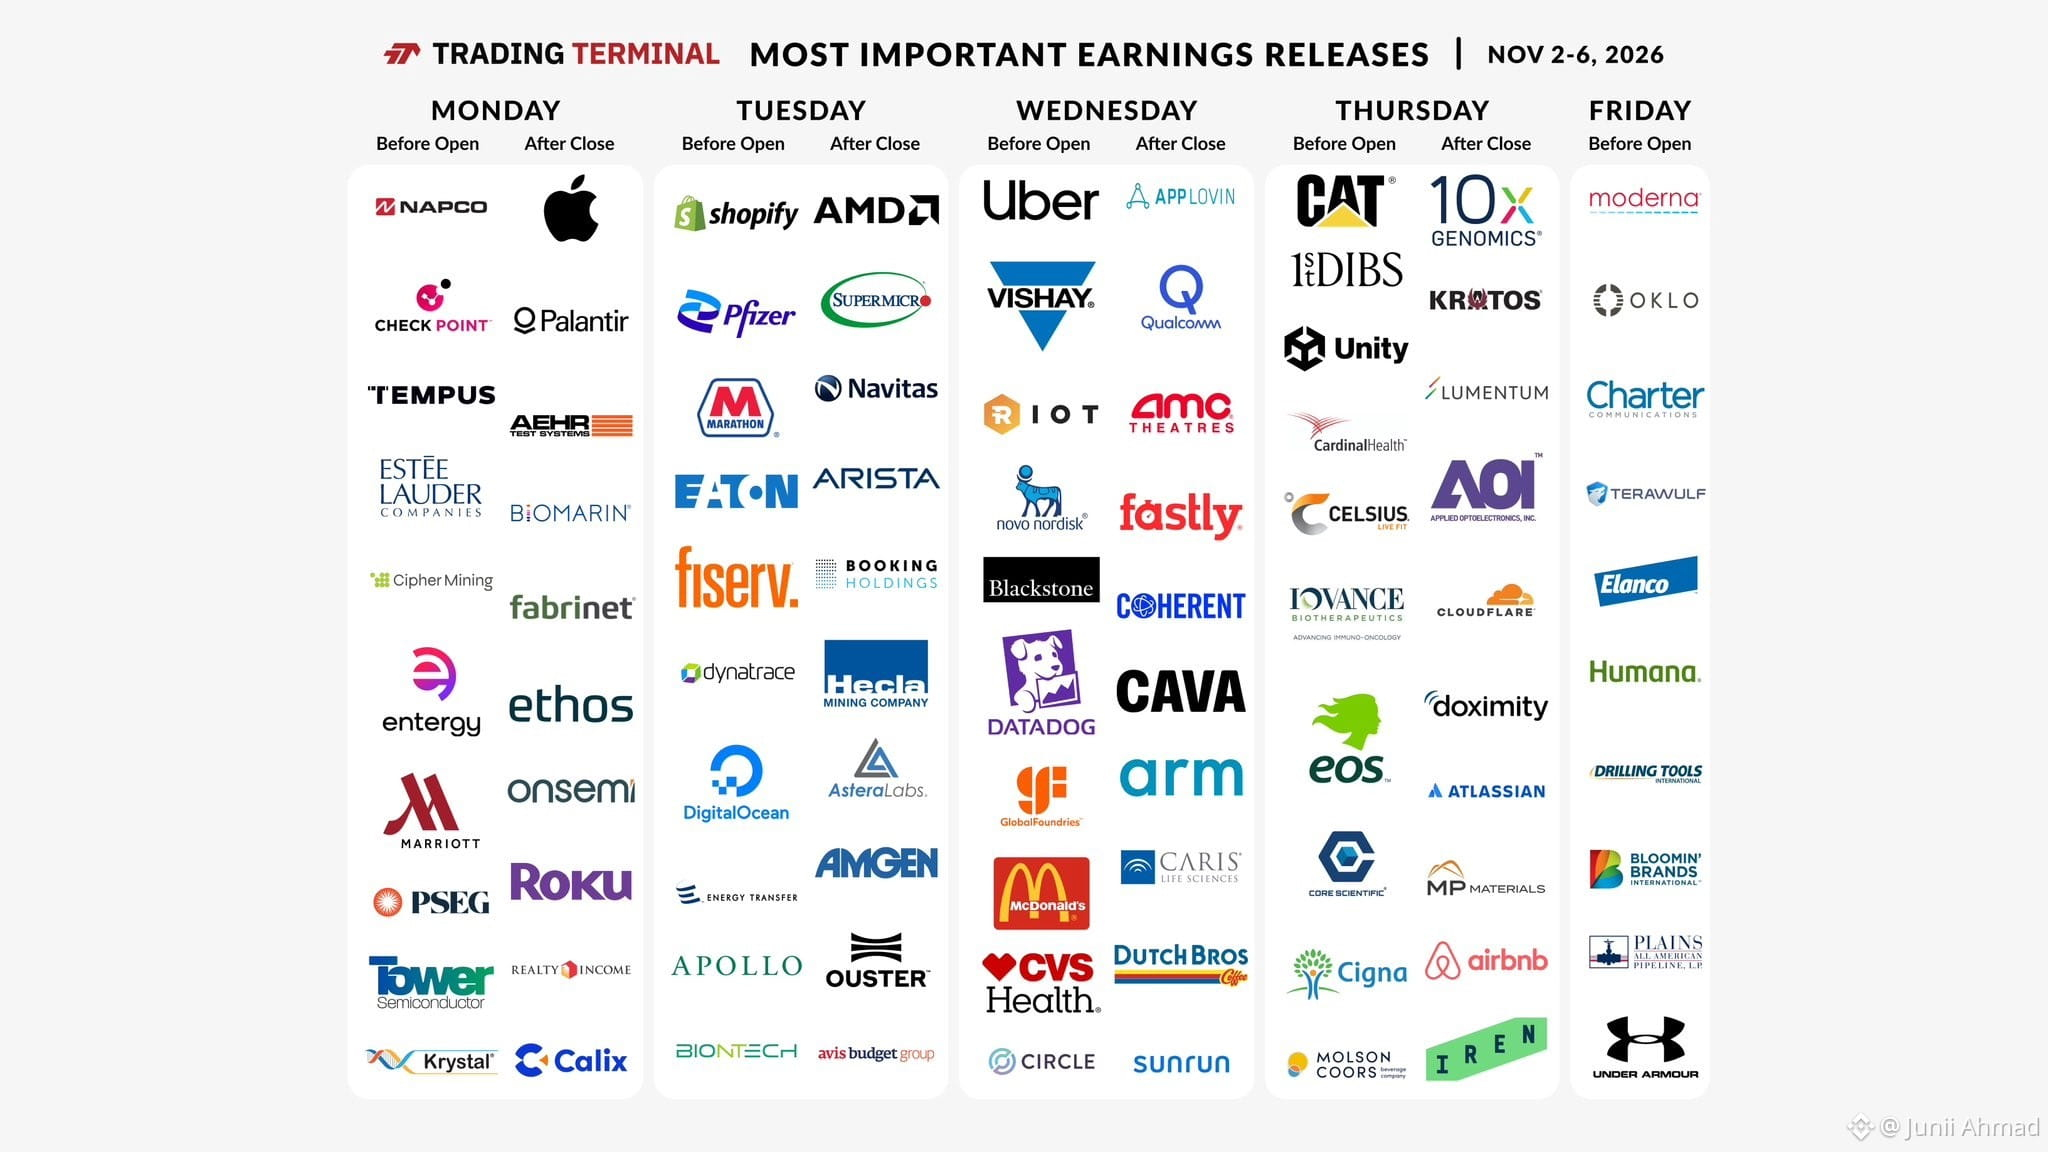
Prepárate para un jueves ajetreado:
• Resultados: Lumentum
$LITE , Cloudflare $NET.US , Iren $IREN , Applied Optoelectronics $AAOI
• Solicitudes de subsidio por desempleo
• Ponentes de la Reserva Federal: Barkin, Hammack
#BinanceReopensWithdrawalsForMoreAssets #BTCRebounds80K #Binance98PercentReplenished #ADPUSPrivateEmployersAdd86000JobsInOctober #USMidterms-WhatAreMarketsExpecting?
🚨
Prepárate para un jueves ajetreado:
• Resultados: Lumentum
$LITE , Cloudflare $NET.US , Iren $IREN , Applied Optoelectronics $AAOI
• Solicitudes de subsidio por desempleo
• Ponentes de la Reserva Federal: Barkin, Hammack
#BinanceReopensWithdrawalsForMoreAssets #BTCRebounds80K #Binance98PercentReplenished #ADPUSPrivateEmployersAdd86000JobsInOctober #USMidterms-WhatAreMarketsExpecting?
Prepárate para un jueves ajetreado:
• Resultados: Lumentum
$LITE , Cloudflare $NET.US , Iren $IREN , Applied Optoelectronics $AAOI
• Solicitudes de subsidio por desempleo
• Ponentes de la Reserva Federal: Barkin, Hammack
#BinanceReopensWithdrawalsForMoreAssets #BTCRebounds80K #Binance98PercentReplenished #ADPUSPrivateEmployersAdd86000JobsInOctober #USMidterms-WhatAreMarketsExpecting?
997
·
--
Artículo
Por qué el trading es matemáticasEstás a punto de descubrir algo que el mercado ha intentado enseñarte desde tu primera operación: al mercado no le importa tu opinión. No le importa tu predicción sobre lo que sucederá el próximo trimestre. Desde luego, tampoco le importa la historia que te has inventado para explicar por qué una acción en particular se disparará o se desplomará. El mercado funciona con números y, si quieres obtener beneficios de forma constante, tienes que hablar su idioma. Ese idioma son las matemáticas.
Esta es la introducción de mi libro «El trading es matemáticas»
Por qué el trading es matemáticas
Estás a punto de descubrir algo que el mercado ha intentado enseñarte desde tu primera operación: al mercado no le importa tu opinión. No le importa tu predicción sobre lo que sucederá el próximo trimestre. Desde luego, tampoco le importa la historia que te has inventado para explicar por qué una acción en particular se disparará o se desplomará. El mercado funciona con números y, si quieres obtener beneficios de forma constante, tienes que hablar su idioma. Ese idioma son las matemáticas.
Esta es la introducción de mi libro «El trading es matemáticas»
Esta es la introducción de mi libro «El trading es matemáticas»
67
·
--

Artículo
Cómo está programado tu cerebro para cometer errores al operarDescubre cómo los sesgos cognitivos influyen silenciosamente en tus decisiones y cómo reducir su impacto
Psicología cognitiva: El cerebro humano evolucionó para sobrevivir, no para tomar decisiones basadas en probabilidades.
Aquí tienes el capítulo 12 de mi libro: Cómo operar como un científico: utiliza los principios de la ciencia para crear, probar y mejorar continuamente un sistema de trading rentable.
El cerebro humano evolucionó para sobrevivir a la incertidumbre, no para gestionar probabilidades. Durante cientos de miles de años, mantenerse con vida significaba tomar decisiones rápidas con información limitada. El cerebro aprendió a detectar el peligro rápidamente, recordar vívidamente las experiencias dolorosas y permanecer cerca de la seguridad del grupo. Esos instintos mantuvieron con vida a las personas en la sabana. Los mercados financieros recompensan comportamientos casi opuestos.
Cómo está programado tu cerebro para cometer errores al operar
Descubre cómo los sesgos cognitivos influyen silenciosamente en tus decisiones y cómo reducir su impacto
Psicología cognitiva: El cerebro humano evolucionó para sobrevivir, no para tomar decisiones basadas en probabilidades.
Aquí tienes el capítulo 12 de mi libro: Cómo operar como un científico: utiliza los principios de la ciencia para crear, probar y mejorar continuamente un sistema de trading rentable.
El cerebro humano evolucionó para sobrevivir a la incertidumbre, no para gestionar probabilidades. Durante cientos de miles de años, mantenerse con vida significaba tomar decisiones rápidas con información limitada. El cerebro aprendió a detectar el peligro rápidamente, recordar vívidamente las experiencias dolorosas y permanecer cerca de la seguridad del grupo. Esos instintos mantuvieron con vida a las personas en la sabana. Los mercados financieros recompensan comportamientos casi opuestos.
Psicología cognitiva: El cerebro humano evolucionó para sobrevivir, no para tomar decisiones basadas en probabilidades.
Aquí tienes el capítulo 12 de mi libro: Cómo operar como un científico: utiliza los principios de la ciencia para crear, probar y mejorar continuamente un sistema de trading rentable.
El cerebro humano evolucionó para sobrevivir a la incertidumbre, no para gestionar probabilidades. Durante cientos de miles de años, mantenerse con vida significaba tomar decisiones rápidas con información limitada. El cerebro aprendió a detectar el peligro rápidamente, recordar vívidamente las experiencias dolorosas y permanecer cerca de la seguridad del grupo. Esos instintos mantuvieron con vida a las personas en la sabana. Los mercados financieros recompensan comportamientos casi opuestos.
78
·
--
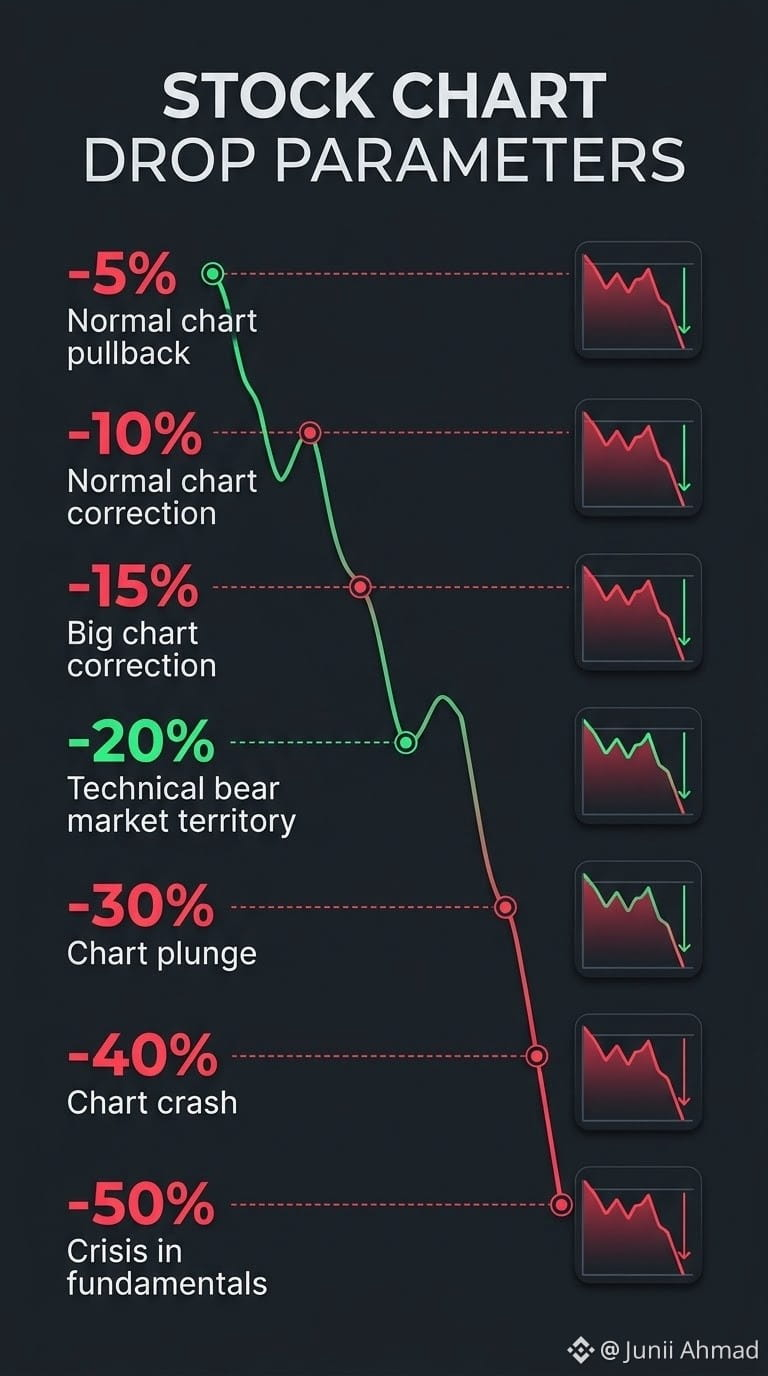
Parámetros de caída del patrón gráfico:
-5% = Retroceso normal del gráfico
-10% = Corrección normal del gráfico
-15% = Corrección importante del gráfico
-20% = Territorio de mercado bajista técnico
-30% = Desplome del gráfico
-40% = Crac del gráfico
-50% = Crisis en los fundamentos
#USMidtermElections #BinanceRestores28FiatWithdrawals #USOctoberNFP-AreRateCutsStillPossible #BinanceWithdrawalScamWarning #AppleEarningsAhead-CanStockHitNewHigh
Parámetros de caída del patrón gráfico:
-5% = Retroceso normal del gráfico
-10% = Corrección normal del gráfico
-15% = Corrección importante del gráfico
-20% = Territorio de mercado bajista técnico
-30% = Desplome del gráfico
-40% = Crac del gráfico
-50% = Crisis en los fundamentos
#USMidtermElections #BinanceRestores28FiatWithdrawals #USOctoberNFP-AreRateCutsStillPossible #BinanceWithdrawalScamWarning #AppleEarningsAhead-CanStockHitNewHigh
-5% = Retroceso normal del gráfico
-10% = Corrección normal del gráfico
-15% = Corrección importante del gráfico
-20% = Territorio de mercado bajista técnico
-30% = Desplome del gráfico
-40% = Crac del gráfico
-50% = Crisis en los fundamentos
#USMidtermElections #BinanceRestores28FiatWithdrawals #USOctoberNFP-AreRateCutsStillPossible #BinanceWithdrawalScamWarning #AppleEarningsAhead-CanStockHitNewHigh
2
67
·
--
Alcista
Verificado
[JUNII AHMAD](https://www.binance.com/register?ref=1025949147)
vía
@Junaid_Ahmad1
$AAPLB PL $PLTRB LTR $AAPLB MD $SHOP $MRNA $SMCI $TXG $UBER $LITE $COHR $DIBS $APP $AEHR $QCOM $AMC $CAVA $RIOT $BKNG $TEAM $NVO $ABNB $ETN $BXSL $MPC $FN $GFS $DDOG $MP $U $IREN $FISV $BROS $RUN $ALAB $ARM $CHKP $KTOS $NVTS $ANET $FSLY $AAOI $BMRN $VSH $NET $OKLO $DOCS $TEM $PFE $CIFR $EL
#BinanceRestores28FiatWithdrawals #BinanceProcesses$4.65BWithdrawals #BitcoinClosesAbove50WeekMAFor7thStraightWeek #BitcoinSpotETFsPost$203MWeeklyOutflow #ETHFalls16.1%InOctober
JUNII AHMAD
vía
@Junii Ahmad
$AAPLB PL $PLTRB LTR $AAPLB MD $SHOP $MRNA $SMCI $TXG $UBER $LITE $COHR $DIBS $APP $AEHR $QCOM $AMC $CAVA $RIOT $BKNG $TEAM $NVO $ABNB $ETN $BXSL $MPC $FN $GFS $DDOG $MP $U $IREN $FISV $BROS $RUN $ALAB $ARM $CHKP $KTOS $NVTS $ANET $FSLY $AAOI $BMRN $VSH $NET $OKLO $DOCS $TEM $PFE $CIFR $EL
#BinanceRestores28FiatWithdrawals #BinanceProcesses$4.65BWithdrawals #BitcoinClosesAbove50WeekMAFor7thStraightWeek #BitcoinSpotETFsPost$203MWeeklyOutflow #ETHFalls16.1%InOctober
vía
@Junii Ahmad
$AAPLB PL $PLTRB LTR $AAPLB MD $SHOP $MRNA $SMCI $TXG $UBER $LITE $COHR $DIBS $APP $AEHR $QCOM $AMC $CAVA $RIOT $BKNG $TEAM $NVO $ABNB $ETN $BXSL $MPC $FN $GFS $DDOG $MP $U $IREN $FISV $BROS $RUN $ALAB $ARM $CHKP $KTOS $NVTS $ANET $FSLY $AAOI $BMRN $VSH $NET $OKLO $DOCS $TEM $PFE $CIFR $EL
#BinanceRestores28FiatWithdrawals #BinanceProcesses$4.65BWithdrawals #BitcoinClosesAbove50WeekMAFor7thStraightWeek #BitcoinSpotETFsPost$203MWeeklyOutflow #ETHFalls16.1%InOctober
1
1.1k
·
--

Artículo
Las matemáticas de las grandes empresasEste es el capítulo 6 de mi libro: Cómo elegir acciones de crecimiento como un matemático: usar la lógica, la probabilidad y los datos para encontrar las próximas grandes ganadoras del mercado bursátil
BQS = (ROIC/15) + (Margen bruto/40) + (LTV/CAC/3) + (Crecimiento de los ingresos operativos/Crecimiento de los ingresos) + (FCF/Ingresos netos)
BQS = Puntuación de calidad empresarial
ROIC = Rentabilidad sobre el capital invertido dividida entre 15 (tu umbral mínimo de ROIC)
Margen bruto dividido entre 40 (tu umbral mínimo de margen bruto)
LTV/CAC dividido entre 3 (tu umbral mínimo de LTV/CAC)
Crecimiento de los ingresos operativos dividido entre el crecimiento de los ingresos (la ratio de apalancamiento operativo)
Las matemáticas de las grandes empresas
Este es el capítulo 6 de mi libro: Cómo elegir acciones de crecimiento como un matemático: usar la lógica, la probabilidad y los datos para encontrar las próximas grandes ganadoras del mercado bursátil
BQS = (ROIC/15) + (Margen bruto/40) + (LTV/CAC/3) + (Crecimiento de los ingresos operativos/Crecimiento de los ingresos) + (FCF/Ingresos netos)
BQS = Puntuación de calidad empresarial
ROIC = Rentabilidad sobre el capital invertido dividida entre 15 (tu umbral mínimo de ROIC)
Margen bruto dividido entre 40 (tu umbral mínimo de margen bruto)
LTV/CAC dividido entre 3 (tu umbral mínimo de LTV/CAC)
Crecimiento de los ingresos operativos dividido entre el crecimiento de los ingresos (la ratio de apalancamiento operativo)
BQS = (ROIC/15) + (Margen bruto/40) + (LTV/CAC/3) + (Crecimiento de los ingresos operativos/Crecimiento de los ingresos) + (FCF/Ingresos netos)
BQS = Puntuación de calidad empresarial
ROIC = Rentabilidad sobre el capital invertido dividida entre 15 (tu umbral mínimo de ROIC)
Margen bruto dividido entre 40 (tu umbral mínimo de margen bruto)
LTV/CAC dividido entre 3 (tu umbral mínimo de LTV/CAC)
Crecimiento de los ingresos operativos dividido entre el crecimiento de los ingresos (la ratio de apalancamiento operativo)
1
1
84
·
--
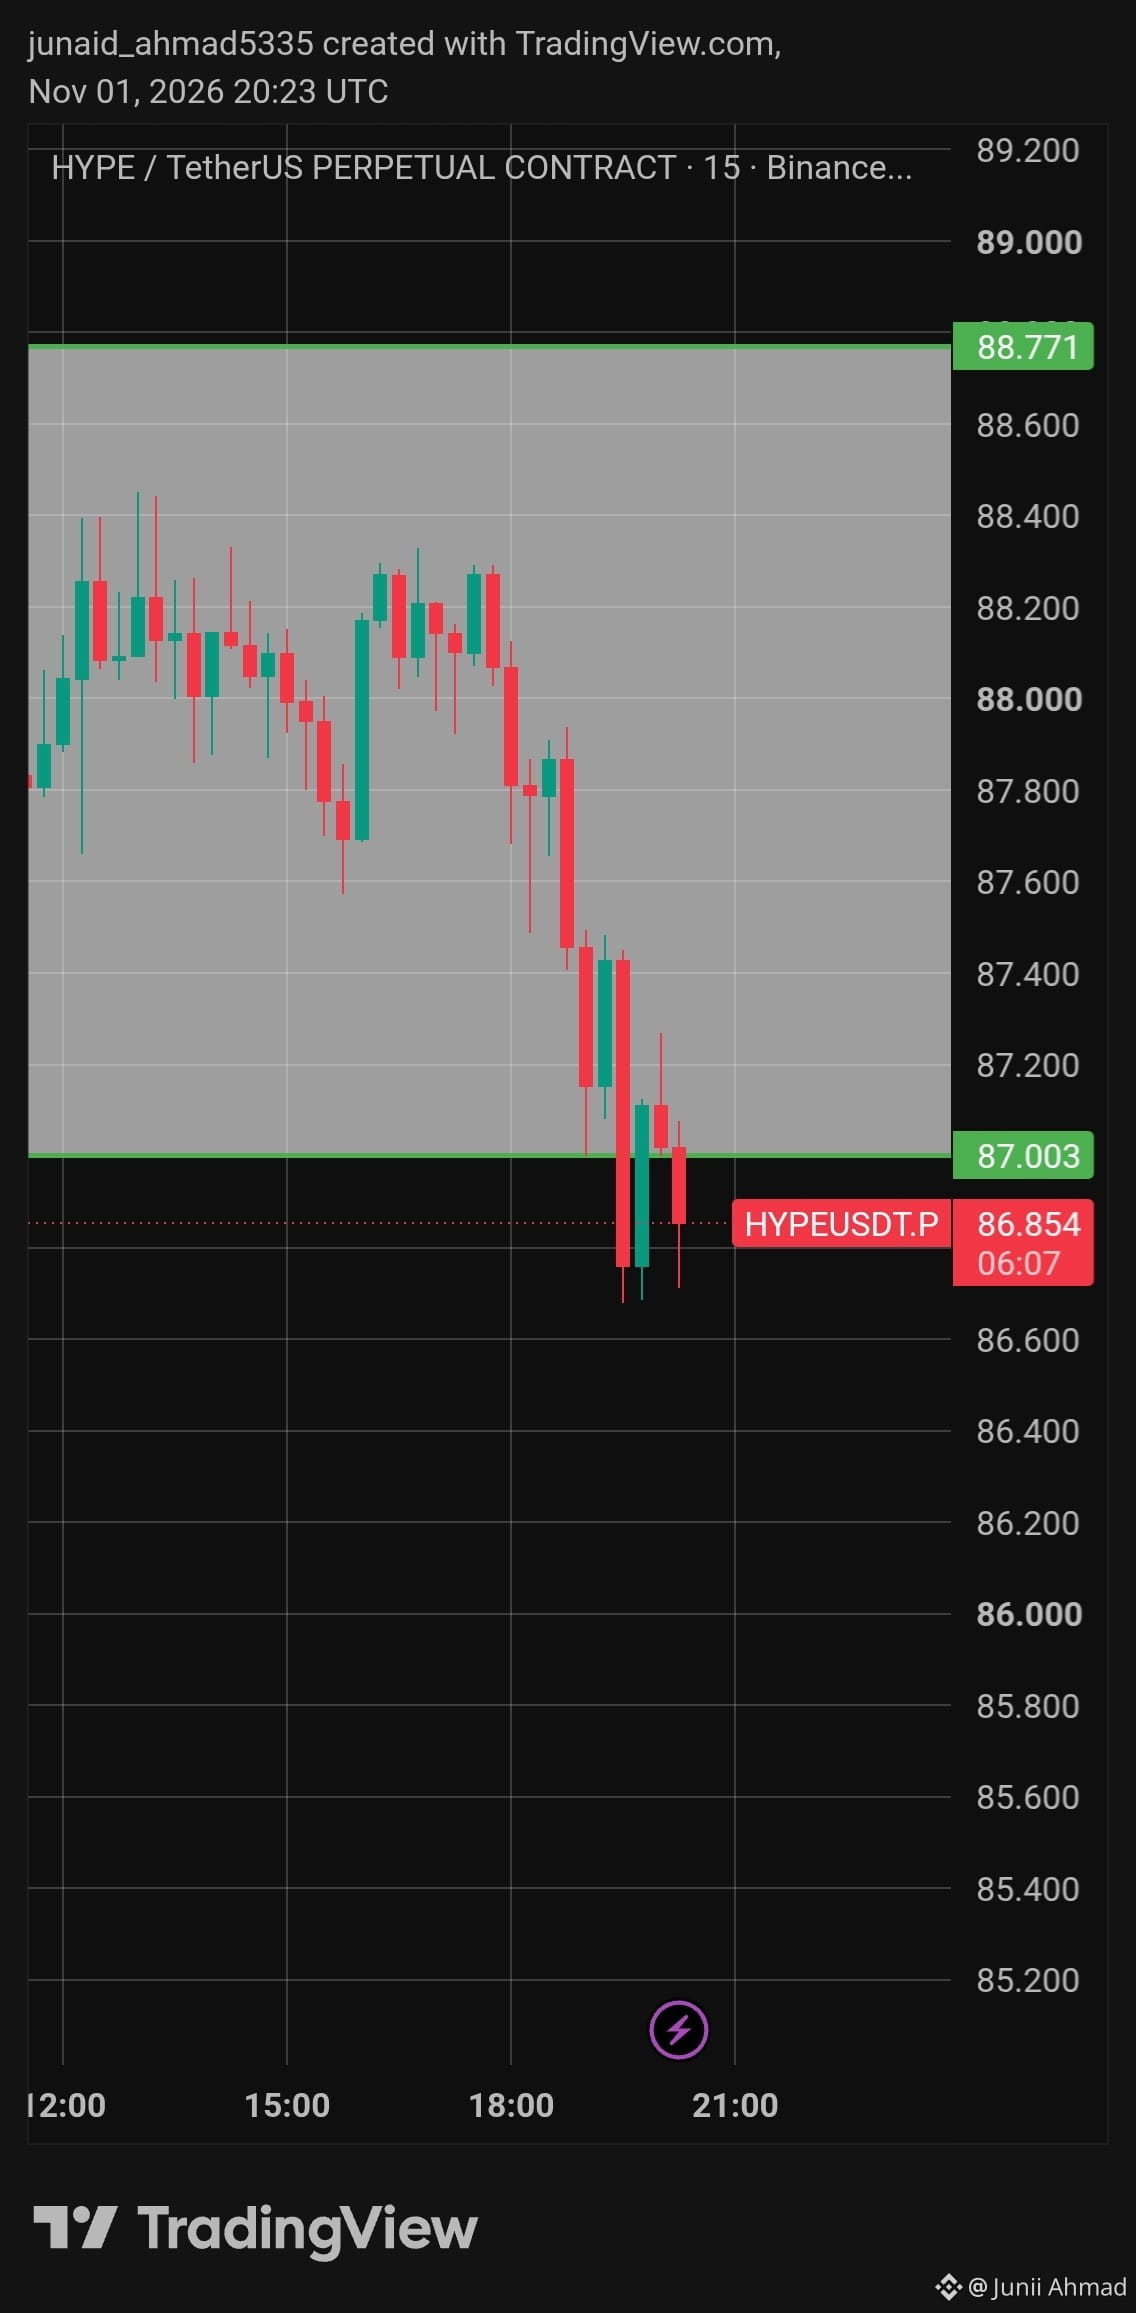
$HYPE /USDT acaba de romper el nivel de apertura de hoy y ha formado dos sólidas velas rojas en el gráfico de 15 minutos. Al observar la evolución general de su precio durante los últimos días, espero una caída clara a partir de aquí. Buena oportunidad para abrir una posición corta, por si alguien quiere aprovecharla.
#hype #BinanceToResumePhaseOneOfWithdrawals #IntelHasItsWorstDaySince1974 #BinanceUpdatesProofofReservesAddresses #B14gReportsUnauthorizedTransferOfAbout97MCORE
$HYPE /USDT acaba de romper el nivel de apertura de hoy y ha formado dos sólidas velas rojas en el gráfico de 15 minutos. Al observar la evolución general de su precio durante los últimos días, espero una caída clara a partir de aquí. Buena oportunidad para abrir una posición corta, por si alguien quiere aprovecharla.
#hype #BinanceToResumePhaseOneOfWithdrawals #IntelHasItsWorstDaySince1974 #BinanceUpdatesProofofReservesAddresses #B14gReportsUnauthorizedTransferOfAbout97MCORE
#hype #BinanceToResumePhaseOneOfWithdrawals #IntelHasItsWorstDaySince1974 #BinanceUpdatesProofofReservesAddresses #B14gReportsUnauthorizedTransferOfAbout97MCORE
1
2
420
·
--

Artículo
10 libros que leen las personas de clase alta y que las de clase media y trabajadora casi nunca abrenEl título es intencionalmente provocador. Los hábitos de lectura no clasifican claramente a las personas según sus ingresos, y cualquiera puede tomar prestado un libro difícil en una biblioteca, comprarlo en una librería o leerlo en el teléfono.
Sin embargo, ciertos títulos aparecen una y otra vez en conversaciones entre inversionistas, fundadores, ejecutivos y personas que administran dinero. Tratan sobre incentivos, capital, criterio, historia y poder. Exigen más del lector que una lección rápida sobre cómo ahorrar dinero o buscar motivación. Por eso vale la pena abrirlos, leerlos, releerlos y comentarlos con personas que aspiran a alcanzar niveles más altos de éxito.
10 libros que leen las personas de clase alta y que las de clase media y trabajadora casi nunca abren
El título es intencionalmente provocador. Los hábitos de lectura no clasifican claramente a las personas según sus ingresos, y cualquiera puede tomar prestado un libro difícil en una biblioteca, comprarlo en una librería o leerlo en el teléfono.
Sin embargo, ciertos títulos aparecen una y otra vez en conversaciones entre inversionistas, fundadores, ejecutivos y personas que administran dinero. Tratan sobre incentivos, capital, criterio, historia y poder. Exigen más del lector que una lección rápida sobre cómo ahorrar dinero o buscar motivación. Por eso vale la pena abrirlos, leerlos, releerlos y comentarlos con personas que aspiran a alcanzar niveles más altos de éxito.
Sin embargo, ciertos títulos aparecen una y otra vez en conversaciones entre inversionistas, fundadores, ejecutivos y personas que administran dinero. Tratan sobre incentivos, capital, criterio, historia y poder. Exigen más del lector que una lección rápida sobre cómo ahorrar dinero o buscar motivación. Por eso vale la pena abrirlos, leerlos, releerlos y comentarlos con personas que aspiran a alcanzar niveles más altos de éxito.
2
364
·
--
Artículo
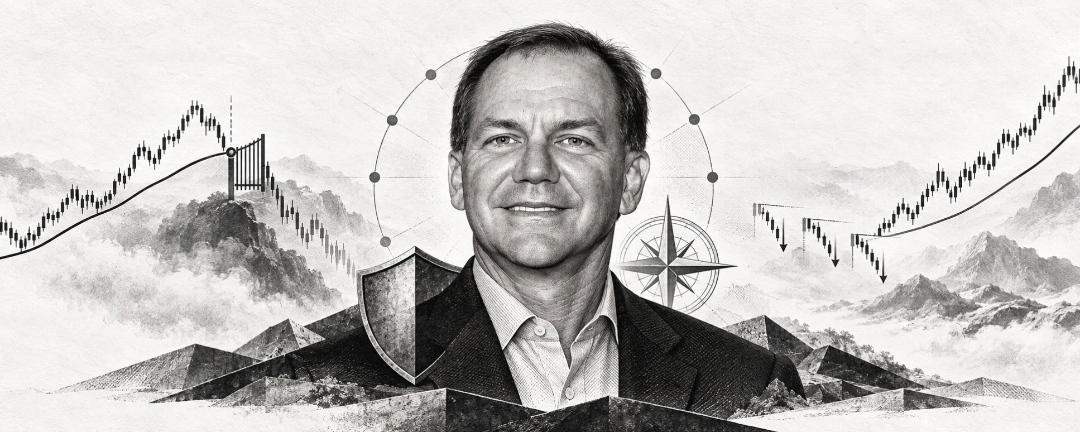
Las 10 mejores citas de Paul Tudor Jones sobre el trading de acción del precio@Junaid_Ahmad1
Paul Tudor Jones es uno de los mejores operadores e inversores de su generación. Durante décadas, no ha tenido ningún año con pérdidas en su fondo principal. Más que duplicó el capital que gestionaba durante el crac del Lunes Negro de 1987, mientras otros sufrían grandes pérdidas y veían sus cuentas arruinadas. Forbes lo sitúa en el puesto 477 entre las personas más ricas del mundo. Su patrimonio neto ronda los 8.100 millones de dólares y sigue creciendo. Los operadores de todos los niveles deberían escuchar lo que este hombre tiene que decir sobre el trading.
«No hay ningún tipo de formación, ni en un aula ni de otra manera, que pueda prepararte para operar el último tercio de un movimiento, ya sea el final de un mercado alcista o el final de uno bajista». - Paul Tudor Jones
Las 10 mejores citas de Paul Tudor Jones sobre el trading de acción del precio
@Junii Ahmad
Paul Tudor Jones es uno de los mejores operadores e inversores de su generación. Durante décadas, no ha tenido ningún año con pérdidas en su fondo principal. Más que duplicó el capital que gestionaba durante el crac del Lunes Negro de 1987, mientras otros sufrían grandes pérdidas y veían sus cuentas arruinadas. Forbes lo sitúa en el puesto 477 entre las personas más ricas del mundo. Su patrimonio neto ronda los 8.100 millones de dólares y sigue creciendo. Los operadores de todos los niveles deberían escuchar lo que este hombre tiene que decir sobre el trading.
«No hay ningún tipo de formación, ni en un aula ni de otra manera, que pueda prepararte para operar el último tercio de un movimiento, ya sea el final de un mercado alcista o el final de uno bajista». - Paul Tudor Jones
Paul Tudor Jones es uno de los mejores operadores e inversores de su generación. Durante décadas, no ha tenido ningún año con pérdidas en su fondo principal. Más que duplicó el capital que gestionaba durante el crac del Lunes Negro de 1987, mientras otros sufrían grandes pérdidas y veían sus cuentas arruinadas. Forbes lo sitúa en el puesto 477 entre las personas más ricas del mundo. Su patrimonio neto ronda los 8.100 millones de dólares y sigue creciendo. Los operadores de todos los niveles deberían escuchar lo que este hombre tiene que decir sobre el trading.
«No hay ningún tipo de formación, ni en un aula ni de otra manera, que pueda prepararte para operar el último tercio de un movimiento, ya sea el final de un mercado alcista o el final de uno bajista». - Paul Tudor Jones
1
193
·
--
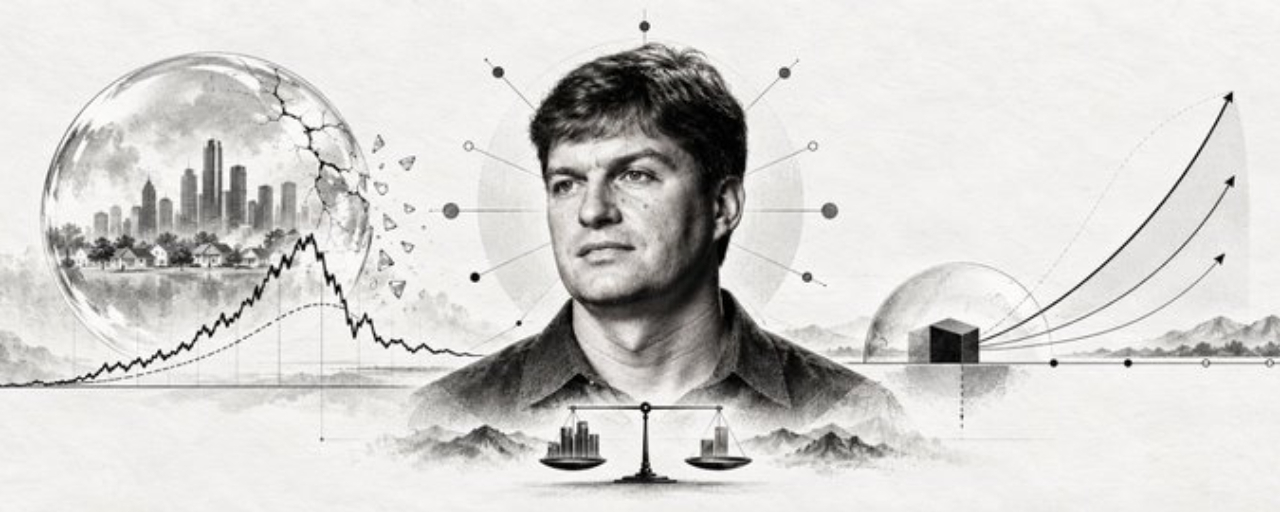
Artículo
Las 10 mejores citas de Michael Burry sobre trading de acción del precioMichael J. Burry fue médico y luego gestor del fondo de cobertura Scion Capital desde 2000 hasta 2008, antes de cerrarlo para centrarse en sus propias inversiones y operaciones personales. Michael Burry se hizo famoso gracias a su representación en la película «La gran apuesta», protagonizada por Christian Bale y basada en el libro de Michael Lewis. El Sr. Burry fue una de las primeras personas en reconocer la crisis de las hipotecas subprime de 2008-2009 y obtener grandes beneficios de ella.
Aquí tienes diez de las mejores citas sobre trading e inversión que podrían ser de gran ayuda para entender su proceso de inversión y operaciones. Burry ha sido tanto un inversor en valor en acciones como un operador de swaps de incumplimiento crediticio. Siempre es estupendo escuchar a personas que hicieron una fortuna en los mercados mientras la mayoría perdió mucho dinero. Hace falta genialidad para apostar contra la mayoría en el momento adecuado.
Las 10 mejores citas de Michael Burry sobre trading de acción del precio
Michael J. Burry fue médico y luego gestor del fondo de cobertura Scion Capital desde 2000 hasta 2008, antes de cerrarlo para centrarse en sus propias inversiones y operaciones personales. Michael Burry se hizo famoso gracias a su representación en la película «La gran apuesta», protagonizada por Christian Bale y basada en el libro de Michael Lewis. El Sr. Burry fue una de las primeras personas en reconocer la crisis de las hipotecas subprime de 2008-2009 y obtener grandes beneficios de ella.
Aquí tienes diez de las mejores citas sobre trading e inversión que podrían ser de gran ayuda para entender su proceso de inversión y operaciones. Burry ha sido tanto un inversor en valor en acciones como un operador de swaps de incumplimiento crediticio. Siempre es estupendo escuchar a personas que hicieron una fortuna en los mercados mientras la mayoría perdió mucho dinero. Hace falta genialidad para apostar contra la mayoría en el momento adecuado.
Aquí tienes diez de las mejores citas sobre trading e inversión que podrían ser de gran ayuda para entender su proceso de inversión y operaciones. Burry ha sido tanto un inversor en valor en acciones como un operador de swaps de incumplimiento crediticio. Siempre es estupendo escuchar a personas que hicieron una fortuna en los mercados mientras la mayoría perdió mucho dinero. Hace falta genialidad para apostar contra la mayoría en el momento adecuado.
2
2
796
·
--

Artículo
10 libros que leen los ricos y que los pobres casi nunca abrenEl estudio de Tom Corley, que hizo un seguimiento de los hábitos de 233 millonarios, reveló una marcada diferencia entre ellos y la mayoría de las demás personas: al 88 % de las personas adineradas les encanta leer para superarse. Las personas con ingresos más bajos (aquellas con ingresos anuales de $35,000 o menos y un patrimonio neto líquido de $5,000 o menos) leen principalmente por entretenimiento. El contraste no es meramente académico: influye directamente en la creación de riqueza.
Los siguientes libros no solo son populares entre los ricos: multimillonarios como Warren Buffett, Bill Gates y Jeff Bezos los consideran herramientas fundamentales que les ayudaron a crear sus fortunas.
10 libros que leen los ricos y que los pobres casi nunca abren
El estudio de Tom Corley, que hizo un seguimiento de los hábitos de 233 millonarios, reveló una marcada diferencia entre ellos y la mayoría de las demás personas: al 88 % de las personas adineradas les encanta leer para superarse. Las personas con ingresos más bajos (aquellas con ingresos anuales de $35,000 o menos y un patrimonio neto líquido de $5,000 o menos) leen principalmente por entretenimiento. El contraste no es meramente académico: influye directamente en la creación de riqueza.
Los siguientes libros no solo son populares entre los ricos: multimillonarios como Warren Buffett, Bill Gates y Jeff Bezos los consideran herramientas fundamentales que les ayudaron a crear sus fortunas.
Los siguientes libros no solo son populares entre los ricos: multimillonarios como Warren Buffett, Bill Gates y Jeff Bezos los consideran herramientas fundamentales que les ayudaron a crear sus fortunas.
2
9
2.4k
Inicia sesión para explorar más contenidos
Únete a usuarios globales de criptomonedas en Binance Square
⚡️ Obtén información útil y actualizada sobre criptos.
💬 Avalado por el mayor exchange de criptomonedas en el mundo.
👍 Descubre perspectivas reales de creadores verificados.
Email/número de teléfono
Temas populares
WhoWillSucceedJensenHuangatNvidia?
37,573 vistas
538 están debatiendo
Nvidia afirma que no hay conversaciones para elegir director ejecutivo mientras la petición «Apoyemos a Jensen» supera las 77.900 firmas
Binance News
·14 me gusta
·18.5k vistas
WhatWillDriveCryptoandStocks’NextRebound?
350,951 vistas
2,505 están debatiendo
USPPIMissMayEaseBTCPressure
160,568 vistas
1,758 están debatiendo