
Tony Lin
110 Posts

Tony Lin
Report
Block User
AI玩Crypto|认真搞钱|日常玩梗|币安高返邀请码:TONYLIN
Open Trade

BTC Holder
Frequent Trader
5.4 Years
21 Following
122 Followers
110 Liked
Posts
Portfolio
All
Quotes
Videos
·
--
$BTC 🎯 Ambush on the left side
🧭 I want to pick up BTC on the pullback, but I won’t chase if it’s above 86,800.
In the morning, over the past four hours it closed up about 0.59%, and price is still edging higher; the issue is that volume is only around 64% of the average volume of the previous 20 four-hour candles. The bias is strong, but the reasons to chase higher have not thickened in step.
📍 The position I’m truly willing to take risk on is around 86,000, which was tested repeatedly today.
Long zone on the left: 86,050—86,200
Support: 85,948.50—86,089.90; next level: 85,080
Resistance: 86,963.40 / 87,385.10
The earlier support comes from this morning’s hourly lows, and the later level is yesterday’s retracement low. It’s not that you buy just because price touches it: within the range, after completing a 15-minute probe-low and recovery—closing bullish with active buy volume exceeding sell volume—then you can consider entering. If the rebound leaves the range, you let this setup go.
✅ Initial protection: if the trade price at 85,750 triggers an exit.
This is the analysis buffer reserved beyond this morning’s low. Afterwards, if the hourly close breaks above 87,385.10, then activate a trailing take-profit. The current reference pullback distance is about 1,015 USDT—so I won’t mechanically sell it all at the first resistance level.
🧯 If before entry the hourly breaks below 85,948.50, this shallow-pullback plan is canceled. The 4-hour RSI is already around 76; what we most need to guard against is allowing strong consolidation to turn into a deeper correction before committing to the next leg.
$BTC 🎯 Ambush on the left side
🧭 I want to pick up BTC on the pullback, but I won’t chase if it’s above 86,800.
In the morning, over the past four hours it closed up about 0.59%, and price is still edging higher; the issue is that volume is only around 64% of the average volume of the previous 20 four-hour candles. The bias is strong, but the reasons to chase higher have not thickened in step.
📍 The position I’m truly willing to take risk on is around 86,000, which was tested repeatedly today.
Long zone on the left: 86,050—86,200
Support: 85,948.50—86,089.90; next level: 85,080
Resistance: 86,963.40 / 87,385.10
The earlier support comes from this morning’s hourly lows, and the later level is yesterday’s retracement low. It’s not that you buy just because price touches it: within the range, after completing a 15-minute probe-low and recovery—closing bullish with active buy volume exceeding sell volume—then you can consider entering. If the rebound leaves the range, you let this setup go.
✅ Initial protection: if the trade price at 85,750 triggers an exit.
This is the analysis buffer reserved beyond this morning’s low. Afterwards, if the hourly close breaks above 87,385.10, then activate a trailing take-profit. The current reference pullback distance is about 1,015 USDT—so I won’t mechanically sell it all at the first resistance level.
🧯 If before entry the hourly breaks below 85,948.50, this shallow-pullback plan is canceled. The 4-hour RSI is already around 76; what we most need to guard against is allowing strong consolidation to turn into a deeper correction before committing to the next leg.
🧭 I want to pick up BTC on the pullback, but I won’t chase if it’s above 86,800.
In the morning, over the past four hours it closed up about 0.59%, and price is still edging higher; the issue is that volume is only around 64% of the average volume of the previous 20 four-hour candles. The bias is strong, but the reasons to chase higher have not thickened in step.
📍 The position I’m truly willing to take risk on is around 86,000, which was tested repeatedly today.
Long zone on the left: 86,050—86,200
Support: 85,948.50—86,089.90; next level: 85,080
Resistance: 86,963.40 / 87,385.10
The earlier support comes from this morning’s hourly lows, and the later level is yesterday’s retracement low. It’s not that you buy just because price touches it: within the range, after completing a 15-minute probe-low and recovery—closing bullish with active buy volume exceeding sell volume—then you can consider entering. If the rebound leaves the range, you let this setup go.
✅ Initial protection: if the trade price at 85,750 triggers an exit.
This is the analysis buffer reserved beyond this morning’s low. Afterwards, if the hourly close breaks above 87,385.10, then activate a trailing take-profit. The current reference pullback distance is about 1,015 USDT—so I won’t mechanically sell it all at the first resistance level.
🧯 If before entry the hourly breaks below 85,948.50, this shallow-pullback plan is canceled. The 4-hour RSI is already around 76; what we most need to guard against is allowing strong consolidation to turn into a deeper correction before committing to the next leg.
284
·
--
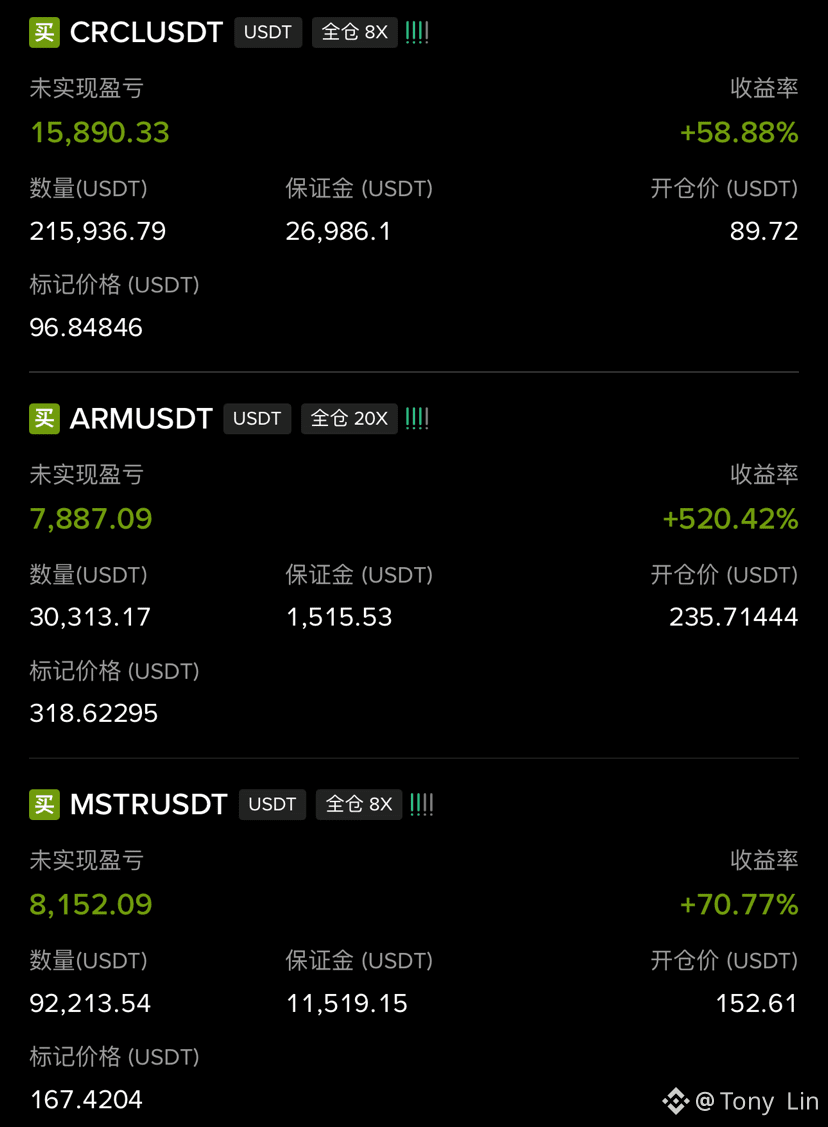
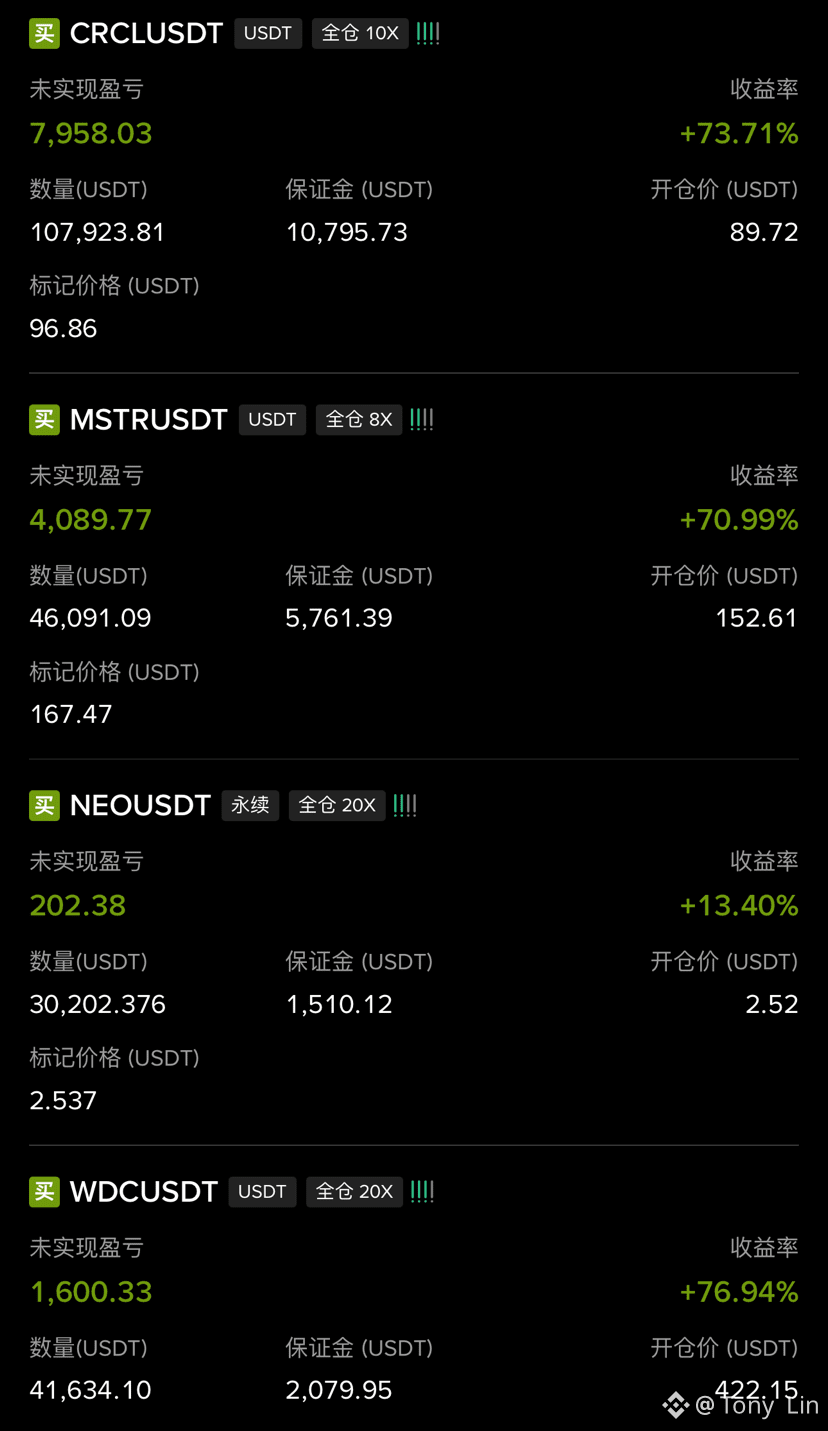
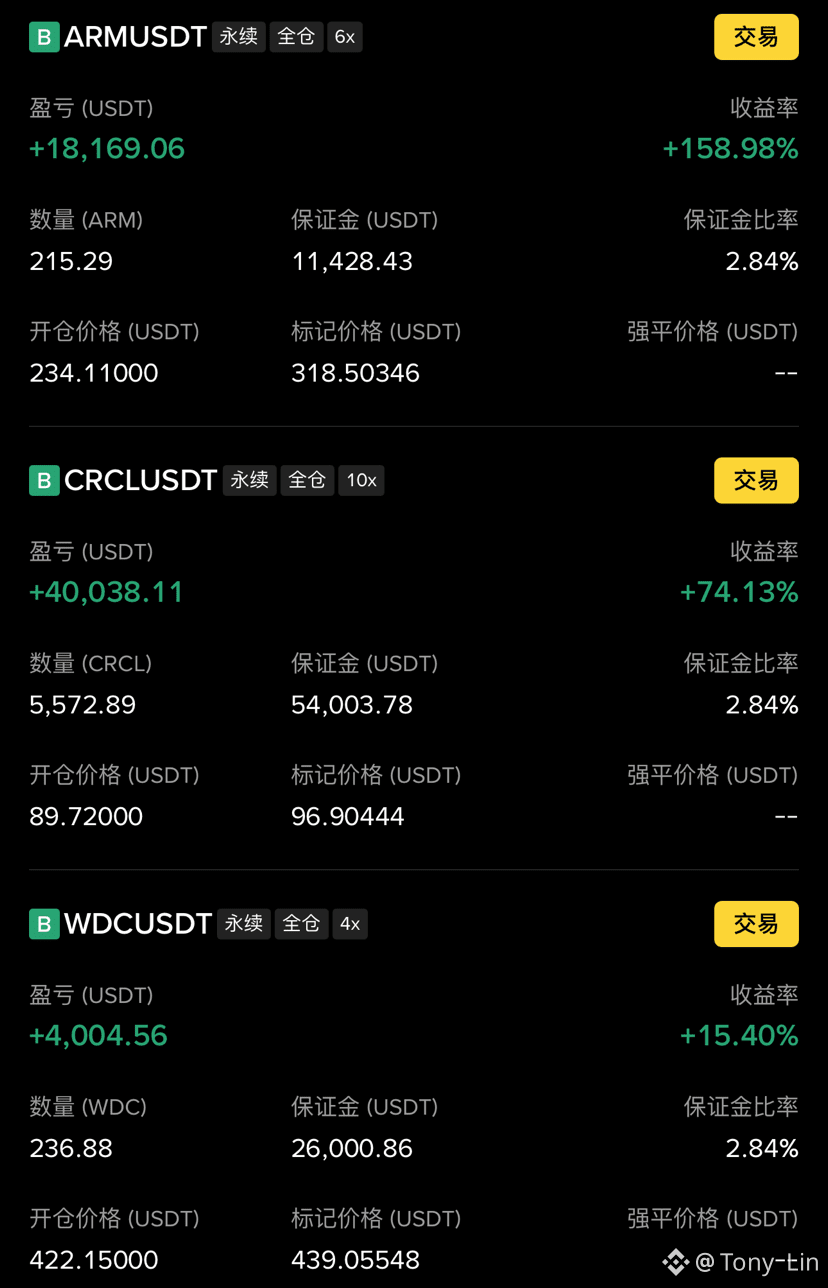
$MSTR left side trading feels awesome
When the trend is right, the market comes in strong
Follow Tony right now and let’s trade on the left together
$MSTR left side trading feels awesome
When the trend is right, the market comes in strong
Follow Tony right now and let’s trade on the left together
When the trend is right, the market comes in strong
Follow Tony right now and let’s trade on the left together
1
128
·
--
$MSTR 🚨Left Side Trading🚨
4 hours ago if you see this article
And if you can understand how to get in, bro, congratulations—you’ve made money again 😎
$MSTR 🚨Left Side Trading🚨
4 hours ago if you see this article
And if you can understand how to get in, bro, congratulations—you’ve made money again 😎
4 hours ago if you see this article
And if you can understand how to get in, bro, congratulations—you’ve made money again 😎
Tony Lin
·
--
$MSTR 🎯This pullback this time, I’ll wait for the 161—162 zone!
🧭 At around midnight it surged to 170.50, but during the morning it crushed the 4-hour close back to 164.75. In that stretch it dropped about 2.86%; the open interest basically didn’t change. From 11—12, the passive vs. active buy/sell imbalance was only 0.784, and the sellers still held the advantage.
So I keep the idea of a pullback that’s more likely to offer buying opportunities, but I won’t treat the sideways action near 164 as a support-to-stop-the-fall point. Next, I’m more inclined to first test whether there’s support underneath, and then discuss a return to the prior high.
📍 Left-side long zones: 161.30—162.20
This corresponds to yesterday afternoon’s accelerated 15-minute low of 161.19, as well as the two evening hourly pullback lows at 162.17 and 162.19. Choosing this area gives us older trade structure to verify—it isn’t just taking the current price and subtracting a few points.
Near support: 163.12—163.61
Key support: 161.19—162.19
Deeper support: 158.60—160.00
On the upside, first watch the resistance at 165.90—166.73, then 169.65—170.50. These are places to observe the bounce quality—there’s no fixed “take profit at X” full-exit price.
✅ Once price reaches the buying zone, wait for a 15-minute candle to probe low and close bullish; the close should come back to 161.60—162.20, and the active buy volume should exceed sell volume. After confirmation, and only if the quoted price is still within the buying zone, consider execution.
BTC also can’t break the structure in sync: if the latest completed hourly candle closes below 84724.90, then I’ll cancel the MSTR re-entry plan this time. I won’t rely on it to hold the whole market on its own.
🔄 Use a moving protection so the rebound has room to keep going.
At entry, keep the 158.20 initial protective stop-loss—place it below the old broken support, including the volatility buffer built into the analysis setting.
After entry, if an hourly close moves back above 166.73, trigger a moving take-profit/stop-loss: the protection price takes the highest value among “the original protection price, the actual entry price plus transaction costs, and (the highest executed price after entry minus 2× hourly ATR).”
Currently the hourly ATR is about 2.27, implying a tracking distance of about $4.55. The protection price updates once per hour. It can only move upward; once triggered, exit immediately—don’t wait for the candle to close. If the move extends upward, let the protection price follow.
🧯 If, before entry, the hourly breaks below 161.19, cancel this support pullback plan and reassess the deeper area—don’t add more position further down.
The biggest risk right now is that this pullback turns from a normal repair into a deeper correction. You can wait patiently for the buy price, but the stop-loss can’t be delayed by “let’s see.”
🧭 At around midnight it surged to 170.50, but during the morning it crushed the 4-hour close back to 164.75. In that stretch it dropped about 2.86%; the open interest basically didn’t change. From 11—12, the passive vs. active buy/sell imbalance was only 0.784, and the sellers still held the advantage.
So I keep the idea of a pullback that’s more likely to offer buying opportunities, but I won’t treat the sideways action near 164 as a support-to-stop-the-fall point. Next, I’m more inclined to first test whether there’s support underneath, and then discuss a return to the prior high.
📍 Left-side long zones: 161.30—162.20
This corresponds to yesterday afternoon’s accelerated 15-minute low of 161.19, as well as the two evening hourly pullback lows at 162.17 and 162.19. Choosing this area gives us older trade structure to verify—it isn’t just taking the current price and subtracting a few points.
Near support: 163.12—163.61
Key support: 161.19—162.19
Deeper support: 158.60—160.00
On the upside, first watch the resistance at 165.90—166.73, then 169.65—170.50. These are places to observe the bounce quality—there’s no fixed “take profit at X” full-exit price.
✅ Once price reaches the buying zone, wait for a 15-minute candle to probe low and close bullish; the close should come back to 161.60—162.20, and the active buy volume should exceed sell volume. After confirmation, and only if the quoted price is still within the buying zone, consider execution.
BTC also can’t break the structure in sync: if the latest completed hourly candle closes below 84724.90, then I’ll cancel the MSTR re-entry plan this time. I won’t rely on it to hold the whole market on its own.
🔄 Use a moving protection so the rebound has room to keep going.
At entry, keep the 158.20 initial protective stop-loss—place it below the old broken support, including the volatility buffer built into the analysis setting.
After entry, if an hourly close moves back above 166.73, trigger a moving take-profit/stop-loss: the protection price takes the highest value among “the original protection price, the actual entry price plus transaction costs, and (the highest executed price after entry minus 2× hourly ATR).”
Currently the hourly ATR is about 2.27, implying a tracking distance of about $4.55. The protection price updates once per hour. It can only move upward; once triggered, exit immediately—don’t wait for the candle to close. If the move extends upward, let the protection price follow.
🧯 If, before entry, the hourly breaks below 161.19, cancel this support pullback plan and reassess the deeper area—don’t add more position further down.
The biggest risk right now is that this pullback turns from a normal repair into a deeper correction. You can wait patiently for the buy price, but the stop-loss can’t be delayed by “let’s see.”
32
·
--
$MSTR 🎯This pullback this time, I’ll wait for the 161—162 zone!
🧭 At around midnight it surged to 170.50, but during the morning it crushed the 4-hour close back to 164.75. In that stretch it dropped about 2.86%; the open interest basically didn’t change. From 11—12, the passive vs. active buy/sell imbalance was only 0.784, and the sellers still held the advantage.
So I keep the idea of a pullback that’s more likely to offer buying opportunities, but I won’t treat the sideways action near 164 as a support-to-stop-the-fall point. Next, I’m more inclined to first test whether there’s support underneath, and then discuss a return to the prior high.
📍 Left-side long zones: 161.30—162.20
This corresponds to yesterday afternoon’s accelerated 15-minute low of 161.19, as well as the two evening hourly pullback lows at 162.17 and 162.19. Choosing this area gives us older trade structure to verify—it isn’t just taking the current price and subtracting a few points.
Near support: 163.12—163.61
Key support: 161.19—162.19
Deeper support: 158.60—160.00
On the upside, first watch the resistance at 165.90—166.73, then 169.65—170.50. These are places to observe the bounce quality—there’s no fixed “take profit at X” full-exit price.
✅ Once price reaches the buying zone, wait for a 15-minute candle to probe low and close bullish; the close should come back to 161.60—162.20, and the active buy volume should exceed sell volume. After confirmation, and only if the quoted price is still within the buying zone, consider execution.
BTC also can’t break the structure in sync: if the latest completed hourly candle closes below 84724.90, then I’ll cancel the MSTR re-entry plan this time. I won’t rely on it to hold the whole market on its own.
🔄 Use a moving protection so the rebound has room to keep going.
At entry, keep the 158.20 initial protective stop-loss—place it below the old broken support, including the volatility buffer built into the analysis setting.
After entry, if an hourly close moves back above 166.73, trigger a moving take-profit/stop-loss: the protection price takes the highest value among “the original protection price, the actual entry price plus transaction costs, and (the highest executed price after entry minus 2× hourly ATR).”
Currently the hourly ATR is about 2.27, implying a tracking distance of about $4.55. The protection price updates once per hour. It can only move upward; once triggered, exit immediately—don’t wait for the candle to close. If the move extends upward, let the protection price follow.
🧯 If, before entry, the hourly breaks below 161.19, cancel this support pullback plan and reassess the deeper area—don’t add more position further down.
The biggest risk right now is that this pullback turns from a normal repair into a deeper correction. You can wait patiently for the buy price, but the stop-loss can’t be delayed by “let’s see.”
$MSTR 🎯This pullback this time, I’ll wait for the 161—162 zone!
🧭 At around midnight it surged to 170.50, but during the morning it crushed the 4-hour close back to 164.75. In that stretch it dropped about 2.86%; the open interest basically didn’t change. From 11—12, the passive vs. active buy/sell imbalance was only 0.784, and the sellers still held the advantage.
So I keep the idea of a pullback that’s more likely to offer buying opportunities, but I won’t treat the sideways action near 164 as a support-to-stop-the-fall point. Next, I’m more inclined to first test whether there’s support underneath, and then discuss a return to the prior high.
📍 Left-side long zones: 161.30—162.20
This corresponds to yesterday afternoon’s accelerated 15-minute low of 161.19, as well as the two evening hourly pullback lows at 162.17 and 162.19. Choosing this area gives us older trade structure to verify—it isn’t just taking the current price and subtracting a few points.
Near support: 163.12—163.61
Key support: 161.19—162.19
Deeper support: 158.60—160.00
On the upside, first watch the resistance at 165.90—166.73, then 169.65—170.50. These are places to observe the bounce quality—there’s no fixed “take profit at X” full-exit price.
✅ Once price reaches the buying zone, wait for a 15-minute candle to probe low and close bullish; the close should come back to 161.60—162.20, and the active buy volume should exceed sell volume. After confirmation, and only if the quoted price is still within the buying zone, consider execution.
BTC also can’t break the structure in sync: if the latest completed hourly candle closes below 84724.90, then I’ll cancel the MSTR re-entry plan this time. I won’t rely on it to hold the whole market on its own.
🔄 Use a moving protection so the rebound has room to keep going.
At entry, keep the 158.20 initial protective stop-loss—place it below the old broken support, including the volatility buffer built into the analysis setting.
After entry, if an hourly close moves back above 166.73, trigger a moving take-profit/stop-loss: the protection price takes the highest value among “the original protection price, the actual entry price plus transaction costs, and (the highest executed price after entry minus 2× hourly ATR).”
Currently the hourly ATR is about 2.27, implying a tracking distance of about $4.55. The protection price updates once per hour. It can only move upward; once triggered, exit immediately—don’t wait for the candle to close. If the move extends upward, let the protection price follow.
🧯 If, before entry, the hourly breaks below 161.19, cancel this support pullback plan and reassess the deeper area—don’t add more position further down.
The biggest risk right now is that this pullback turns from a normal repair into a deeper correction. You can wait patiently for the buy price, but the stop-loss can’t be delayed by “let’s see.”
🧭 At around midnight it surged to 170.50, but during the morning it crushed the 4-hour close back to 164.75. In that stretch it dropped about 2.86%; the open interest basically didn’t change. From 11—12, the passive vs. active buy/sell imbalance was only 0.784, and the sellers still held the advantage.
So I keep the idea of a pullback that’s more likely to offer buying opportunities, but I won’t treat the sideways action near 164 as a support-to-stop-the-fall point. Next, I’m more inclined to first test whether there’s support underneath, and then discuss a return to the prior high.
📍 Left-side long zones: 161.30—162.20
This corresponds to yesterday afternoon’s accelerated 15-minute low of 161.19, as well as the two evening hourly pullback lows at 162.17 and 162.19. Choosing this area gives us older trade structure to verify—it isn’t just taking the current price and subtracting a few points.
Near support: 163.12—163.61
Key support: 161.19—162.19
Deeper support: 158.60—160.00
On the upside, first watch the resistance at 165.90—166.73, then 169.65—170.50. These are places to observe the bounce quality—there’s no fixed “take profit at X” full-exit price.
✅ Once price reaches the buying zone, wait for a 15-minute candle to probe low and close bullish; the close should come back to 161.60—162.20, and the active buy volume should exceed sell volume. After confirmation, and only if the quoted price is still within the buying zone, consider execution.
BTC also can’t break the structure in sync: if the latest completed hourly candle closes below 84724.90, then I’ll cancel the MSTR re-entry plan this time. I won’t rely on it to hold the whole market on its own.
🔄 Use a moving protection so the rebound has room to keep going.
At entry, keep the 158.20 initial protective stop-loss—place it below the old broken support, including the volatility buffer built into the analysis setting.
After entry, if an hourly close moves back above 166.73, trigger a moving take-profit/stop-loss: the protection price takes the highest value among “the original protection price, the actual entry price plus transaction costs, and (the highest executed price after entry minus 2× hourly ATR).”
Currently the hourly ATR is about 2.27, implying a tracking distance of about $4.55. The protection price updates once per hour. It can only move upward; once triggered, exit immediately—don’t wait for the candle to close. If the move extends upward, let the protection price follow.
🧯 If, before entry, the hourly breaks below 161.19, cancel this support pullback plan and reassess the deeper area—don’t add more position further down.
The biggest risk right now is that this pullback turns from a normal repair into a deeper correction. You can wait patiently for the buy price, but the stop-loss can’t be delayed by “let’s see.”
1
240
·
--
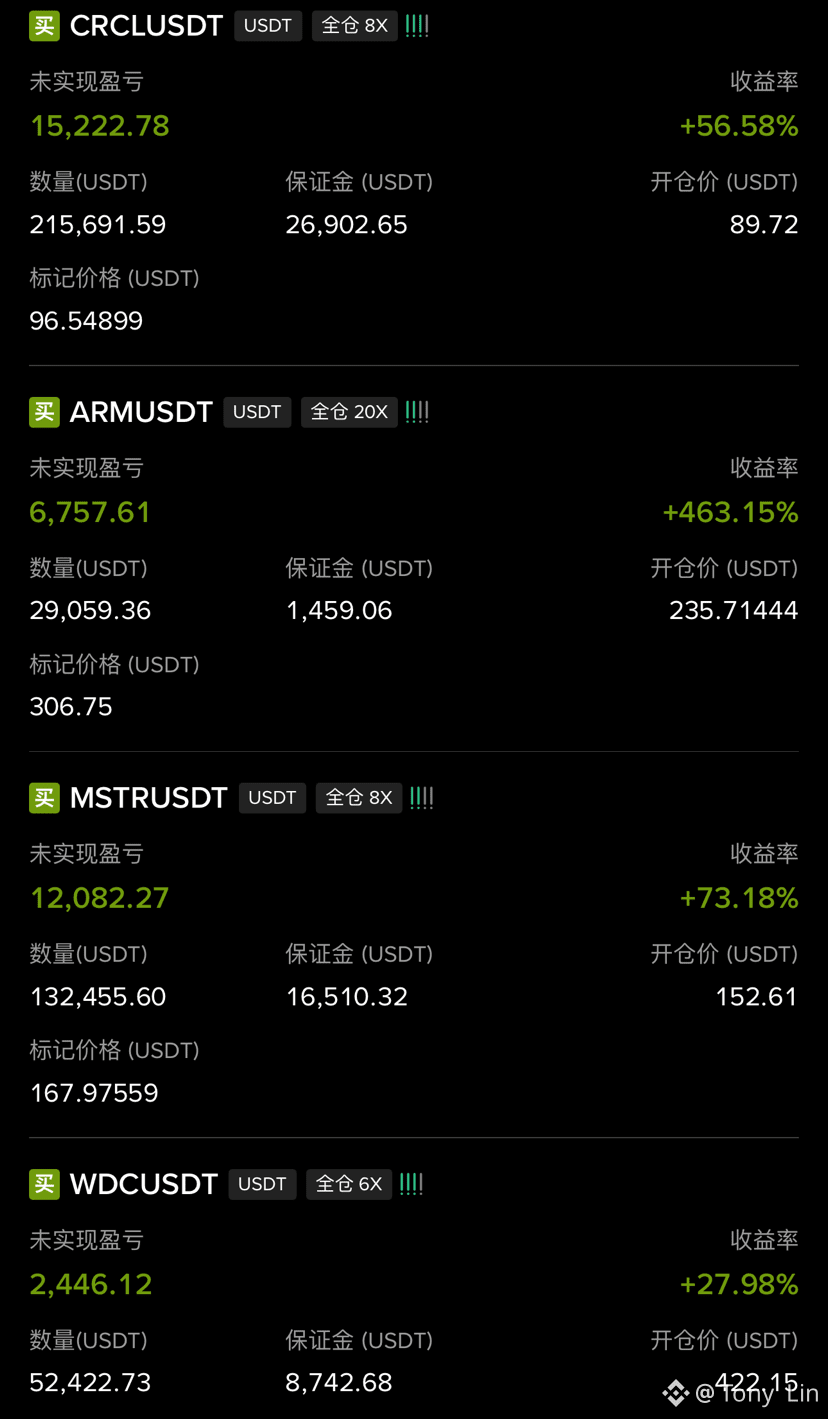
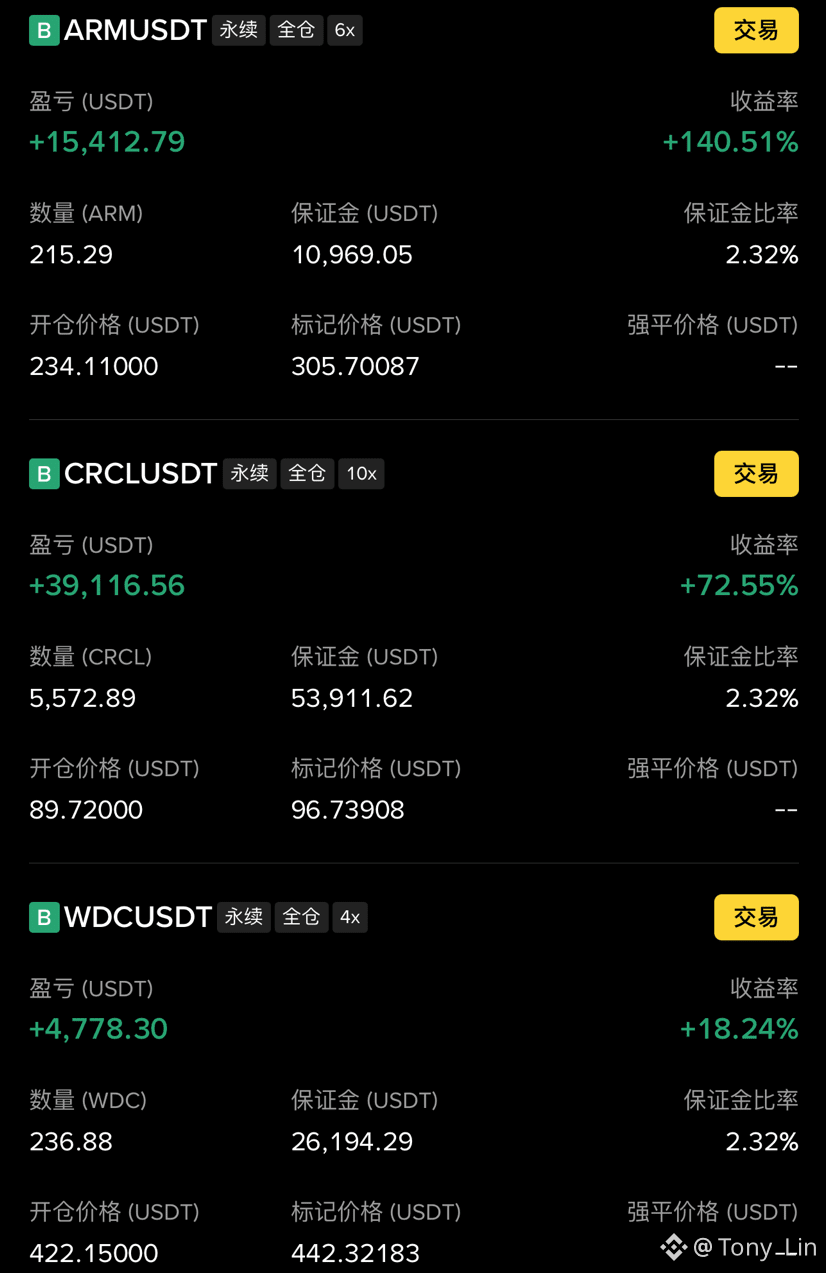
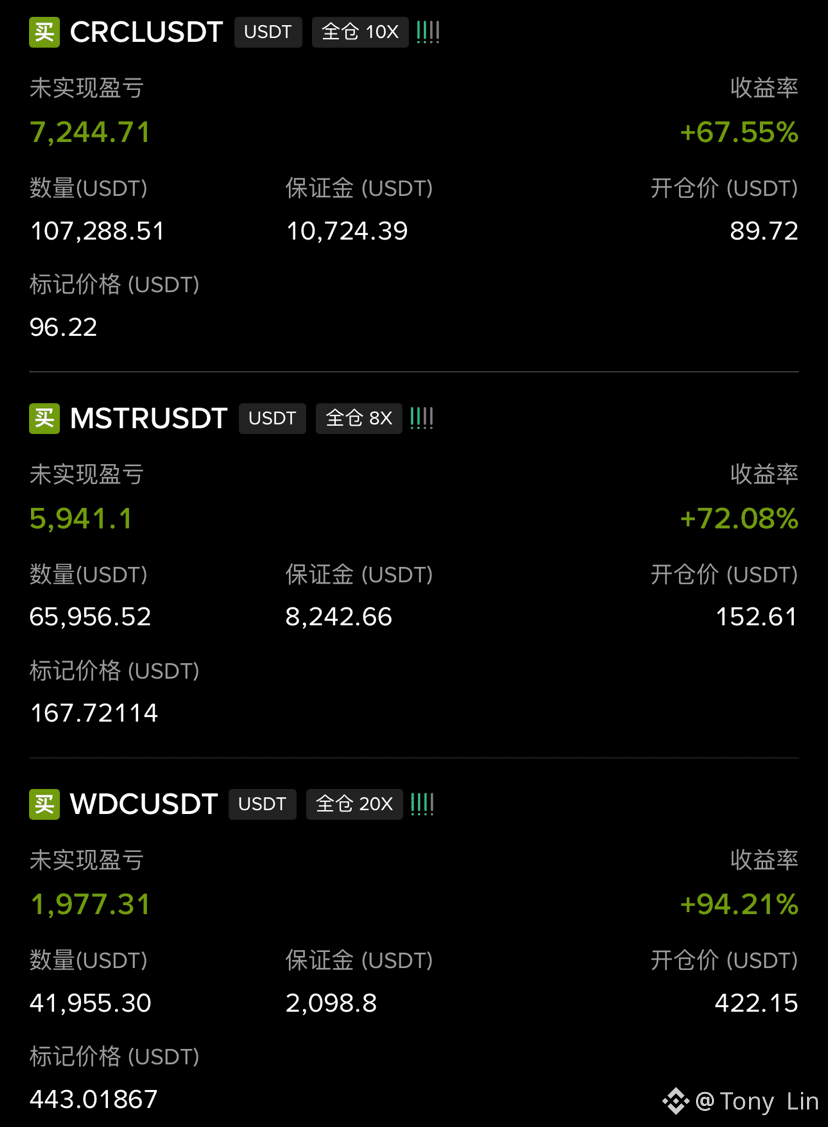
Let me tell you a painful truth
If you can’t make money in a market like this,
Tony advises you to go work in a factory and screw things together as soon as possible 😂
$CRCL $WDC $MSTR
Let me tell you a painful truth
If you can’t make money in a market like this,
Tony advises you to go work in a factory and screw things together as soon as possible 😂
$CRCL $WDC $MSTR
If you can’t make money in a market like this,
Tony advises you to go work in a factory and screw things together as soon as possible 😂
$CRCL $WDC $MSTR
458
·
--
$MSTR 🎯 On the left-side trade, I want to catch this move around 154.
🧭 Last night, MSTR probed the low at 151.09, then rebounded; this morning it surged to 159.03, then pulled back to 154.06. The 10:00–11:00 hourly candle I just closed raised the low to 154.39 and closed at 155.61.
I’m more bullish and expecting this pullback to repair. The reason: the lows have started to rise, but in the 10:00–11:00 window, the aggressive buy/sell imbalance is only 0.968—buyers don’t yet have a clear advantage. There’s no need to reach early at 155.74.
📍 Long zone on the left: 154.10—154.50
First support: 154.06—154.46, from two pullbacks this morning; the next level: 153.31—153.37, the low zone left over yesterday.
Above, first it should meet 156.43—156.46, then look for 158.60—159.03 formed by the morning spike.
Hard stop-loss: 153.20
First scale-out: 156.40
Second target: 158.50
✅ Once price reaches the buy zone, watch the 15-minute candles: after probing around 154.20 or lower, look for a bullish close back to 154.30—154.50, and make sure that candle’s aggressive buy volume exceeds sell volume. Only if price still stays within the buy zone after confirmation should you execute; if it just runs away upward directly, then give up.
BTC also needs to cooperate: the latest completed hourly candle must not close below today’s low 80819.40. This MSTR setup is a long on a pullback during a rebound; it can’t be treated in isolation from the broader market as a standalone “catch-up.”
🧯 Before entering: if MSTR first shows an hourly close below 154.06, this acceptance plan is canceled. 153.20 is an analysis buffer set by combining the 15-minute ATR of about 1.14, reserved under support. It triggers at the contract execution price—trigger means stop-loss, no waiting for the candle close.
Right now US stocks are in the overnight session. Tonight at 21:30 the regular market open may reprice these levels. These prices are only for the trade in front of us; don’t carry them over unchanged into the US market open.
$MSTR 🎯 On the left-side trade, I want to catch this move around 154.
🧭 Last night, MSTR probed the low at 151.09, then rebounded; this morning it surged to 159.03, then pulled back to 154.06. The 10:00–11:00 hourly candle I just closed raised the low to 154.39 and closed at 155.61.
I’m more bullish and expecting this pullback to repair. The reason: the lows have started to rise, but in the 10:00–11:00 window, the aggressive buy/sell imbalance is only 0.968—buyers don’t yet have a clear advantage. There’s no need to reach early at 155.74.
📍 Long zone on the left: 154.10—154.50
First support: 154.06—154.46, from two pullbacks this morning; the next level: 153.31—153.37, the low zone left over yesterday.
Above, first it should meet 156.43—156.46, then look for 158.60—159.03 formed by the morning spike.
Hard stop-loss: 153.20
First scale-out: 156.40
Second target: 158.50
✅ Once price reaches the buy zone, watch the 15-minute candles: after probing around 154.20 or lower, look for a bullish close back to 154.30—154.50, and make sure that candle’s aggressive buy volume exceeds sell volume. Only if price still stays within the buy zone after confirmation should you execute; if it just runs away upward directly, then give up.
BTC also needs to cooperate: the latest completed hourly candle must not close below today’s low 80819.40. This MSTR setup is a long on a pullback during a rebound; it can’t be treated in isolation from the broader market as a standalone “catch-up.”
🧯 Before entering: if MSTR first shows an hourly close below 154.06, this acceptance plan is canceled. 153.20 is an analysis buffer set by combining the 15-minute ATR of about 1.14, reserved under support. It triggers at the contract execution price—trigger means stop-loss, no waiting for the candle close.
Right now US stocks are in the overnight session. Tonight at 21:30 the regular market open may reprice these levels. These prices are only for the trade in front of us; don’t carry them over unchanged into the US market open.
🧭 Last night, MSTR probed the low at 151.09, then rebounded; this morning it surged to 159.03, then pulled back to 154.06. The 10:00–11:00 hourly candle I just closed raised the low to 154.39 and closed at 155.61.
I’m more bullish and expecting this pullback to repair. The reason: the lows have started to rise, but in the 10:00–11:00 window, the aggressive buy/sell imbalance is only 0.968—buyers don’t yet have a clear advantage. There’s no need to reach early at 155.74.
📍 Long zone on the left: 154.10—154.50
First support: 154.06—154.46, from two pullbacks this morning; the next level: 153.31—153.37, the low zone left over yesterday.
Above, first it should meet 156.43—156.46, then look for 158.60—159.03 formed by the morning spike.
Hard stop-loss: 153.20
First scale-out: 156.40
Second target: 158.50
✅ Once price reaches the buy zone, watch the 15-minute candles: after probing around 154.20 or lower, look for a bullish close back to 154.30—154.50, and make sure that candle’s aggressive buy volume exceeds sell volume. Only if price still stays within the buy zone after confirmation should you execute; if it just runs away upward directly, then give up.
BTC also needs to cooperate: the latest completed hourly candle must not close below today’s low 80819.40. This MSTR setup is a long on a pullback during a rebound; it can’t be treated in isolation from the broader market as a standalone “catch-up.”
🧯 Before entering: if MSTR first shows an hourly close below 154.06, this acceptance plan is canceled. 153.20 is an analysis buffer set by combining the 15-minute ATR of about 1.14, reserved under support. It triggers at the contract execution price—trigger means stop-loss, no waiting for the candle close.
Right now US stocks are in the overnight session. Tonight at 21:30 the regular market open may reprice these levels. These prices are only for the trade in front of us; don’t carry them over unchanged into the US market open.
217
·
--
$CRCL 🎯 CRCL this time, I’m more inclined to sell the pullback.
🧭 The news about the Arc mainnet going live carries weight, but it’s already from September 16. Today, CRCL fell from around 92, rebounded to 90.58, then got pushed back down; afterward, the hourly high kept making lower highs.
In the short term I’m slightly bearish. But 89.70 is right up against the intraday low—if I add a short here, any small bounce will feel uncomfortable.
📍 What I really want to do is the setup above:
Left-side short zone: 90.30—90.50
Hard stop-loss: 90.80
First partial take-profit: 89.75; second target: 89.35
Resistance to watch: 90.45—90.58, from the pullback high in the morning; above that is 91.75—91.79, which was the range that got broken earlier in the day.
Support: first the day’s low at 89.57, then the September 13 daily low at 89.31.
✅ After price reaches the range, wait for the 15-minute chart to touch 90.45, then reclaim 90.30—90.40, and make sure the current candle’s active sell volume exceeds buy volume. If it drops directly away from below, then this trade won’t be for me.
🧯 Before entering: if the hourly close breaks above 90.58, first cancel the assumption that the rebound is being resisted. 90.80 is a buffer stop beyond the resistance; it will be triggered at the contract execution price.
Don’t miss this cost either: the current funding rate is about −0.0931% per 8 hours. If it’s maintained until the 16:00 settlement, shorts will have to pay. Stocks don’t trade over the weekend, so this should only be treated as a short-term contract trade—not something I drag into a bet for opening on Monday.
$CRCL 🎯 CRCL this time, I’m more inclined to sell the pullback.
🧭 The news about the Arc mainnet going live carries weight, but it’s already from September 16. Today, CRCL fell from around 92, rebounded to 90.58, then got pushed back down; afterward, the hourly high kept making lower highs.
In the short term I’m slightly bearish. But 89.70 is right up against the intraday low—if I add a short here, any small bounce will feel uncomfortable.
📍 What I really want to do is the setup above:
Left-side short zone: 90.30—90.50
Hard stop-loss: 90.80
First partial take-profit: 89.75; second target: 89.35
Resistance to watch: 90.45—90.58, from the pullback high in the morning; above that is 91.75—91.79, which was the range that got broken earlier in the day.
Support: first the day’s low at 89.57, then the September 13 daily low at 89.31.
✅ After price reaches the range, wait for the 15-minute chart to touch 90.45, then reclaim 90.30—90.40, and make sure the current candle’s active sell volume exceeds buy volume. If it drops directly away from below, then this trade won’t be for me.
🧯 Before entering: if the hourly close breaks above 90.58, first cancel the assumption that the rebound is being resisted. 90.80 is a buffer stop beyond the resistance; it will be triggered at the contract execution price.
Don’t miss this cost either: the current funding rate is about −0.0931% per 8 hours. If it’s maintained until the 16:00 settlement, shorts will have to pay. Stocks don’t trade over the weekend, so this should only be treated as a short-term contract trade—not something I drag into a bet for opening on Monday.
🧭 The news about the Arc mainnet going live carries weight, but it’s already from September 16. Today, CRCL fell from around 92, rebounded to 90.58, then got pushed back down; afterward, the hourly high kept making lower highs.
In the short term I’m slightly bearish. But 89.70 is right up against the intraday low—if I add a short here, any small bounce will feel uncomfortable.
📍 What I really want to do is the setup above:
Left-side short zone: 90.30—90.50
Hard stop-loss: 90.80
First partial take-profit: 89.75; second target: 89.35
Resistance to watch: 90.45—90.58, from the pullback high in the morning; above that is 91.75—91.79, which was the range that got broken earlier in the day.
Support: first the day’s low at 89.57, then the September 13 daily low at 89.31.
✅ After price reaches the range, wait for the 15-minute chart to touch 90.45, then reclaim 90.30—90.40, and make sure the current candle’s active sell volume exceeds buy volume. If it drops directly away from below, then this trade won’t be for me.
🧯 Before entering: if the hourly close breaks above 90.58, first cancel the assumption that the rebound is being resisted. 90.80 is a buffer stop beyond the resistance; it will be triggered at the contract execution price.
Don’t miss this cost either: the current funding rate is about −0.0931% per 8 hours. If it’s maintained until the 16:00 settlement, shorts will have to pay. Stocks don’t trade over the weekend, so this should only be treated as a short-term contract trade—not something I drag into a bet for opening on Monday.
431
·
--
$ARM 🎯 The uptrend is still in play, but I won’t take this one near 276.
🧭 ARM has already moved up to the prior high around 276.53, reached by the first 30 complete daily K-lines. From 09:00 to 10:00, the proactive buy volume was about 2.11 times the sell volume—there really is buy-side support in the short term. However, the hourly RSI is also above 70, so if you chase now, the first thing you’ll hit is the previous high.
I’m bullish. My approach is to wait for it to pull back to the level it repeatedly stalled at yesterday. If it doesn’t pull back, then this trade has no setup.
📍 Long entries from the left-side zone: 273.50—274.00
Support reference: 273.19—273.59/272.12. Note that this cycle lacks the corresponding near-term structure at 272.12, so only 273.19—273.59 is used as support.
Resistance to watch: 276.53—276.60; the second tier won’t be added.
✅ Hard stop-loss for the entry: 272.80. Cut some at 274.90 first, then reassess around 276.40.
Once within the long zone, wait for a 15-minute K-line that probes lower and closes up (a bullish retracement candle). Only consider it if the proactive buy volume exceeds sell volume and the成交量 (trading volume) reaches the average volume level of the prior 20 bars. The close must still be within 273.50—274.00; you can’t wait for it to bounce back to 275 before chasing.
🧯 If the prior hour closes below/breaks 273.19, the plan is canceled. The 0.39 extra buffer below that low is set by risk control: 272.80. What we’re doing here is buying the pullback after an upswing. Also, since the U.S. stock market is closed over the weekend, the rise in contracts lacks synchronous成交 (trade) validation from the underlying asset—so slippage needs to be accounted for more than usual.
$ARM 🎯 The uptrend is still in play, but I won’t take this one near 276.
🧭 ARM has already moved up to the prior high around 276.53, reached by the first 30 complete daily K-lines. From 09:00 to 10:00, the proactive buy volume was about 2.11 times the sell volume—there really is buy-side support in the short term. However, the hourly RSI is also above 70, so if you chase now, the first thing you’ll hit is the previous high.
I’m bullish. My approach is to wait for it to pull back to the level it repeatedly stalled at yesterday. If it doesn’t pull back, then this trade has no setup.
📍 Long entries from the left-side zone: 273.50—274.00
Support reference: 273.19—273.59/272.12. Note that this cycle lacks the corresponding near-term structure at 272.12, so only 273.19—273.59 is used as support.
Resistance to watch: 276.53—276.60; the second tier won’t be added.
✅ Hard stop-loss for the entry: 272.80. Cut some at 274.90 first, then reassess around 276.40.
Once within the long zone, wait for a 15-minute K-line that probes lower and closes up (a bullish retracement candle). Only consider it if the proactive buy volume exceeds sell volume and the成交量 (trading volume) reaches the average volume level of the prior 20 bars. The close must still be within 273.50—274.00; you can’t wait for it to bounce back to 275 before chasing.
🧯 If the prior hour closes below/breaks 273.19, the plan is canceled. The 0.39 extra buffer below that low is set by risk control: 272.80. What we’re doing here is buying the pullback after an upswing. Also, since the U.S. stock market is closed over the weekend, the rise in contracts lacks synchronous成交 (trade) validation from the underlying asset—so slippage needs to be accounted for more than usual.
🧭 ARM has already moved up to the prior high around 276.53, reached by the first 30 complete daily K-lines. From 09:00 to 10:00, the proactive buy volume was about 2.11 times the sell volume—there really is buy-side support in the short term. However, the hourly RSI is also above 70, so if you chase now, the first thing you’ll hit is the previous high.
I’m bullish. My approach is to wait for it to pull back to the level it repeatedly stalled at yesterday. If it doesn’t pull back, then this trade has no setup.
📍 Long entries from the left-side zone: 273.50—274.00
Support reference: 273.19—273.59/272.12. Note that this cycle lacks the corresponding near-term structure at 272.12, so only 273.19—273.59 is used as support.
Resistance to watch: 276.53—276.60; the second tier won’t be added.
✅ Hard stop-loss for the entry: 272.80. Cut some at 274.90 first, then reassess around 276.40.
Once within the long zone, wait for a 15-minute K-line that probes lower and closes up (a bullish retracement candle). Only consider it if the proactive buy volume exceeds sell volume and the成交量 (trading volume) reaches the average volume level of the prior 20 bars. The close must still be within 273.50—274.00; you can’t wait for it to bounce back to 275 before chasing.
🧯 If the prior hour closes below/breaks 273.19, the plan is canceled. The 0.39 extra buffer below that low is set by risk control: 272.80. What we’re doing here is buying the pullback after an upswing. Also, since the U.S. stock market is closed over the weekend, the rise in contracts lacks synchronous成交 (trade) validation from the underlying asset—so slippage needs to be accounted for more than usual.
119
·
--
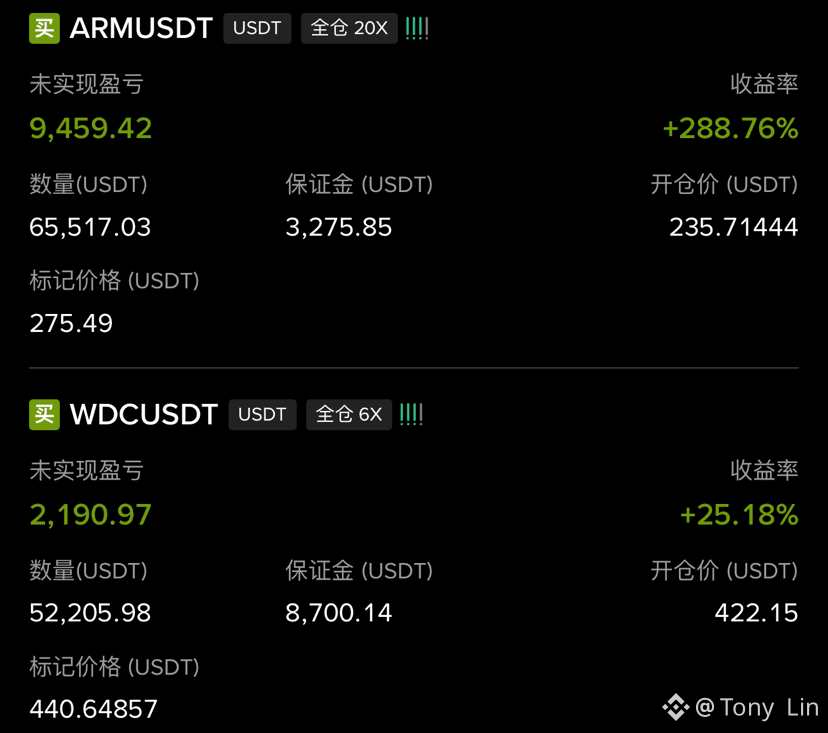
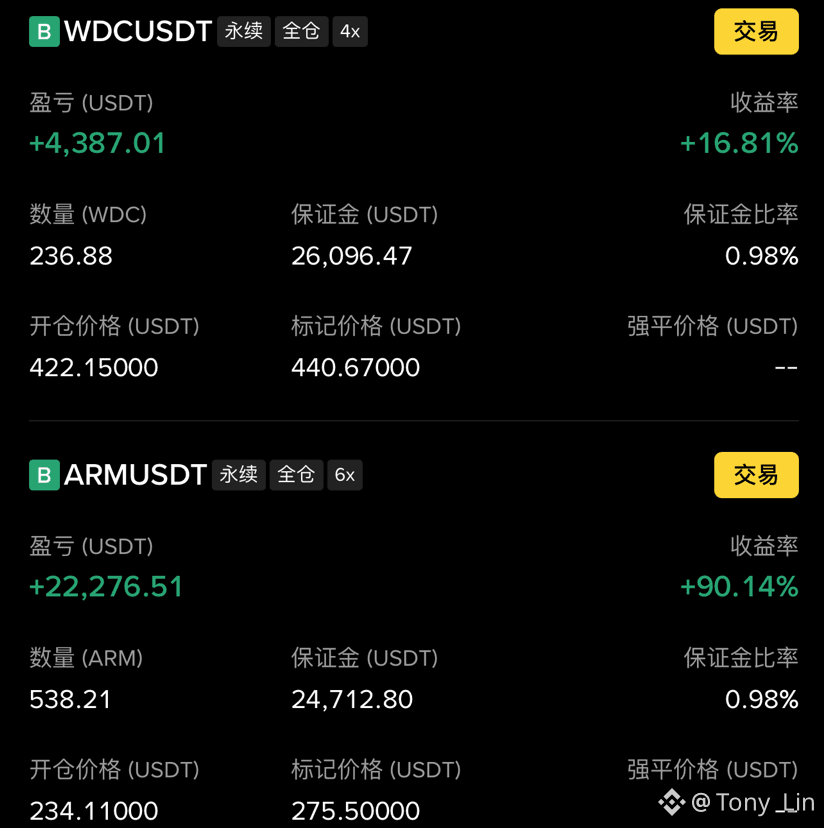
$WDC $ARM 🚨🚨🚨
If you understand the left-side trades, then go all in!
Figure out the odds, look for volatility—trust Tony and you’re right 😎
{future}(ARMUSDT)
{future}(WDCUSDT)
$WDC $ARM 🚨🚨🚨
If you understand the left-side trades, then go all in!
Figure out the odds, look for volatility—trust Tony and you’re right 😎
If you understand the left-side trades, then go all in!
Figure out the odds, look for volatility—trust Tony and you’re right 😎
1
321
·
--
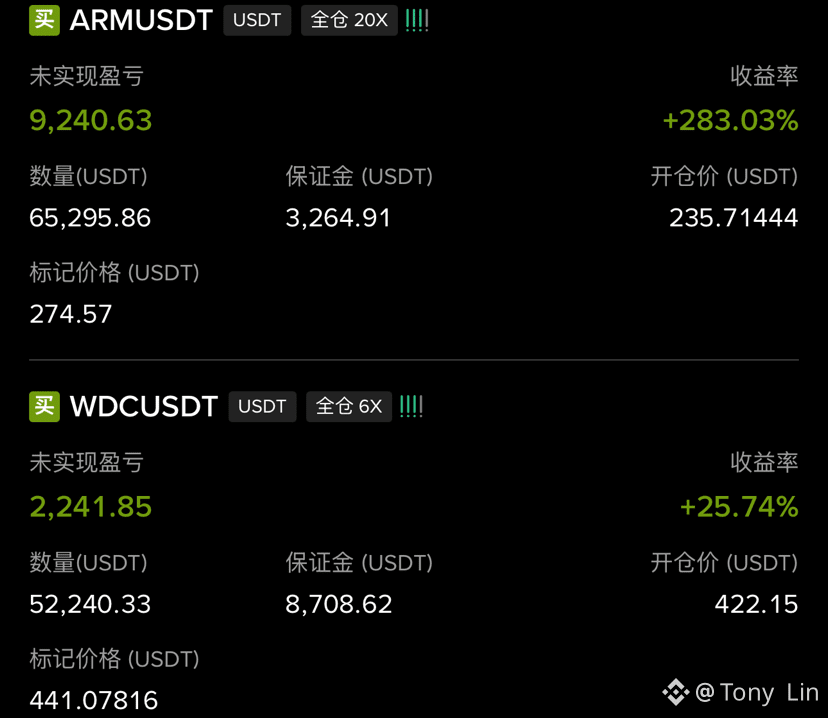
$ARM $WDC Let the storm come even fiercer ✊
{future}(ARMUSDT)
{future}(WDCUSDT)
$ARM $WDC Let the storm come even fiercer ✊
Tony Lin
·
--
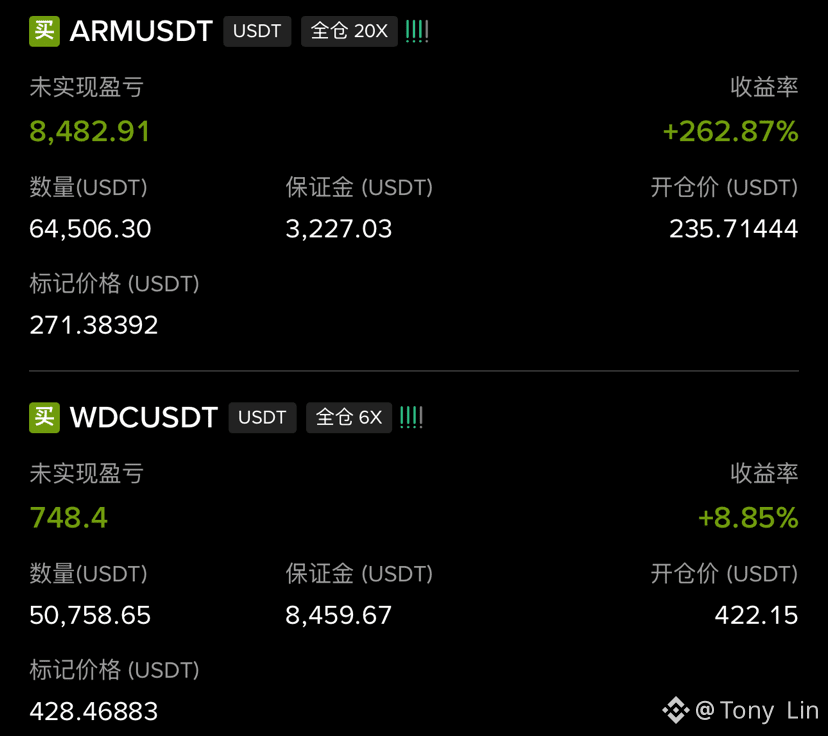
🚨$ARM $WDC Left-side trades
Brothers who joined yesterday are all feeling great today, right?
The market doesn’t wait—opportunities won’t come with explanations. Follow TonyLin and let’s fight ✊
Brothers who joined yesterday are all feeling great today, right?
The market doesn’t wait—opportunities won’t come with explanations. Follow TonyLin and let’s fight ✊
189
·
--
$ZEC says something that hits hard
Those who are empty-handed of ZEC 🐶 will shake their heads when they see it 🤦
Tony put the words here and it’s about to break 2000 immediately 🤗
Don’t ask me why—follow TonyLin or you’ll fail and die trying ✌️
$ZEC says something that hits hard
Those who are empty-handed of ZEC 🐶 will shake their heads when they see it 🤦
Tony put the words here and it’s about to break 2000 immediately 🤗
Don’t ask me why—follow TonyLin or you’ll fail and die trying ✌️
Those who are empty-handed of ZEC 🐶 will shake their heads when they see it 🤦
Tony put the words here and it’s about to break 2000 immediately 🤗
Don’t ask me why—follow TonyLin or you’ll fail and die trying ✌️
218
·
--
🚨$ARM $WDC Left-side trades
Brothers who joined yesterday are all feeling great today, right?
The market doesn’t wait—opportunities won’t come with explanations. Follow TonyLin and let’s fight ✊
{future}(WDCUSDT)
{future}(ARMUSDT)
🚨$ARM $WDC Left-side trades
Brothers who joined yesterday are all feeling great today, right?
The market doesn’t wait—opportunities won’t come with explanations. Follow TonyLin and let’s fight ✊
Brothers who joined yesterday are all feeling great today, right?
The market doesn’t wait—opportunities won’t come with explanations. Follow TonyLin and let’s fight ✊
2
1
241
·
--
$BTC broke through resistance and stabilized; trade with the trend using a light long position
BTC in the morning closed with a long upper wick and a small bullish candle; the daily chart has two consecutive bullish days
After BTC went through the “Clear Bill” but failed to pass, it then went through the Fed’s rate hike of 25 bps, and yet it has still been ranging around 7.65, unmoved and stable by staying sideways instead of dropping; since continuous negative news hasn’t dragged BTC down, it suggests BTC may have a rebound opportunity
Within the descending wedge channel, BTC repeatedly touches the upper and lower trendlines and oscillates; the most recent move was a fake breakout below the trendline that lured longs and then pulled back, returning to the channel again; now BTC is consolidating around 7.65, repeatedly accumulating
Inside the channel, BTC is moving upward along the purple trendline, forming a symmetrical converging triangle with the upper descending trendline; a confirmed breakout and stabilization above the 7.65 key resistance should trigger a rebound wave
On the right side, wait for the candlestick body to break and stabilize above 7.56; then go long with a light position aligned with the trend. Keep defense at the prior low 7.49; targets are around 7.72 and 7.82 $BTC
If you pass by, please take a moment to follow, like, and comment—your support means a lot. Thank you! The information above is only for chart analysis and not for executing trades;
Follow me so you won’t get lost. I’ll bring you the latest news, updates, and level analysis every day, plus the wealth codes you want—remember to follow and like 🫡
$BTC broke through resistance and stabilized; trade with the trend using a light long position
BTC in the morning closed with a long upper wick and a small bullish candle; the daily chart has two consecutive bullish days
After BTC went through the “Clear Bill” but failed to pass, it then went through the Fed’s rate hike of 25 bps, and yet it has still been ranging around 7.65, unmoved and stable by staying sideways instead of dropping; since continuous negative news hasn’t dragged BTC down, it suggests BTC may have a rebound opportunity
Within the descending wedge channel, BTC repeatedly touches the upper and lower trendlines and oscillates; the most recent move was a fake breakout below the trendline that lured longs and then pulled back, returning to the channel again; now BTC is consolidating around 7.65, repeatedly accumulating
Inside the channel, BTC is moving upward along the purple trendline, forming a symmetrical converging triangle with the upper descending trendline; a confirmed breakout and stabilization above the 7.65 key resistance should trigger a rebound wave
On the right side, wait for the candlestick body to break and stabilize above 7.56; then go long with a light position aligned with the trend. Keep defense at the prior low 7.49; targets are around 7.72 and 7.82 $BTC
If you pass by, please take a moment to follow, like, and comment—your support means a lot. Thank you! The information above is only for chart analysis and not for executing trades;
Follow me so you won’t get lost. I’ll bring you the latest news, updates, and level analysis every day, plus the wealth codes you want—remember to follow and like 🫡
BTC in the morning closed with a long upper wick and a small bullish candle; the daily chart has two consecutive bullish days
After BTC went through the “Clear Bill” but failed to pass, it then went through the Fed’s rate hike of 25 bps, and yet it has still been ranging around 7.65, unmoved and stable by staying sideways instead of dropping; since continuous negative news hasn’t dragged BTC down, it suggests BTC may have a rebound opportunity
Within the descending wedge channel, BTC repeatedly touches the upper and lower trendlines and oscillates; the most recent move was a fake breakout below the trendline that lured longs and then pulled back, returning to the channel again; now BTC is consolidating around 7.65, repeatedly accumulating
Inside the channel, BTC is moving upward along the purple trendline, forming a symmetrical converging triangle with the upper descending trendline; a confirmed breakout and stabilization above the 7.65 key resistance should trigger a rebound wave
On the right side, wait for the candlestick body to break and stabilize above 7.56; then go long with a light position aligned with the trend. Keep defense at the prior low 7.49; targets are around 7.72 and 7.82 $BTC
If you pass by, please take a moment to follow, like, and comment—your support means a lot. Thank you! The information above is only for chart analysis and not for executing trades;
Follow me so you won’t get lost. I’ll bring you the latest news, updates, and level analysis every day, plus the wealth codes you want—remember to follow and like 🫡
93
·
--
The essence of $BTC trading is just three sentences:
1. Use certainty to exchange for uncertainty
You pay a certain cost to bet on uncertain gains.
2. You make money from the gap in cognition + the gap in emotions
When others can’t understand, can’t hold, and panic/greed sets in—that’s your opportunity.
3. It’s not about predicting price movements; it’s about managing profit and loss
Trading doesn’t guarantee you’re right every time. It only ensures that when you are right, you make more, and when you’re wrong, you lose less.
In short:
If you can understand, control yourself, and hold steadily—*that’s* trading;
If you guess price moves, bet on luck, and follow your emotions—that’s gambling.
#交易员 #财富的本质
{future}(BTCUSDT)
The essence of $BTC trading is just three sentences:
1. Use certainty to exchange for uncertainty
You pay a certain cost to bet on uncertain gains.
2. You make money from the gap in cognition + the gap in emotions
When others can’t understand, can’t hold, and panic/greed sets in—that’s your opportunity.
3. It’s not about predicting price movements; it’s about managing profit and loss
Trading doesn’t guarantee you’re right every time. It only ensures that when you are right, you make more, and when you’re wrong, you lose less.
In short:
If you can understand, control yourself, and hold steadily—*that’s* trading;
If you guess price moves, bet on luck, and follow your emotions—that’s gambling.
#交易员 #财富的本质
1. Use certainty to exchange for uncertainty
You pay a certain cost to bet on uncertain gains.
2. You make money from the gap in cognition + the gap in emotions
When others can’t understand, can’t hold, and panic/greed sets in—that’s your opportunity.
3. It’s not about predicting price movements; it’s about managing profit and loss
Trading doesn’t guarantee you’re right every time. It only ensures that when you are right, you make more, and when you’re wrong, you lose less.
In short:
If you can understand, control yourself, and hold steadily—*that’s* trading;
If you guess price moves, bet on luck, and follow your emotions—that’s gambling.
#交易员 #财富的本质
94
·
--
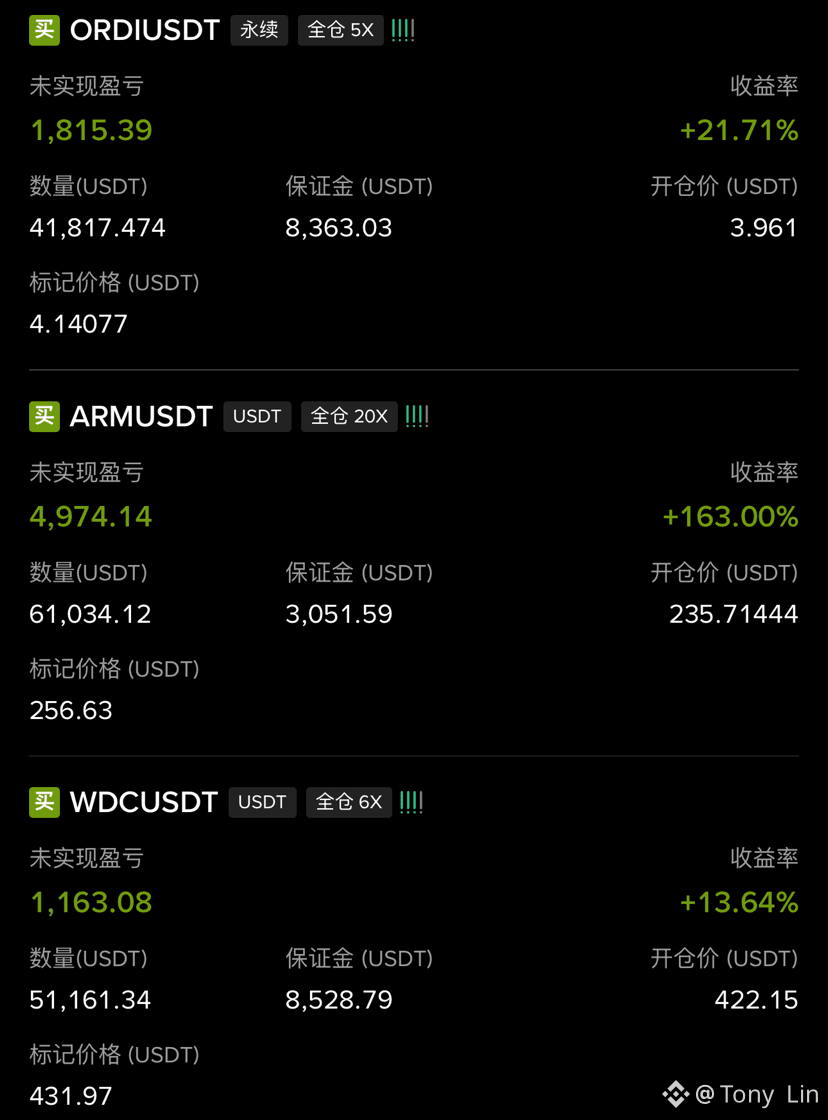
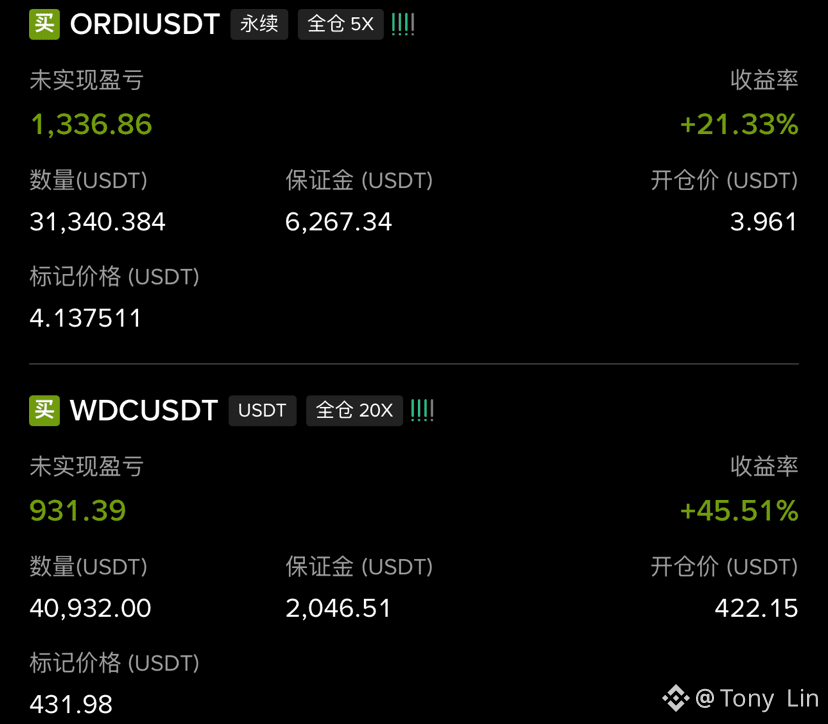
🚨 Left-side trading is just comfortable
Brothers who can understand, come fight together and eat big meat
$ORDI $ARM $WDC 🚀 🚀 🚀
{future}(WDCUSDT)
{future}(ARMUSDT)
{future}(ORDIUSDT)
🚨 Left-side trading is just comfortable
Brothers who can understand, come fight together and eat big meat
$ORDI $ARM $WDC 🚀 🚀 🚀
Brothers who can understand, come fight together and eat big meat
$ORDI $ARM $WDC 🚀 🚀 🚀
889
·
--
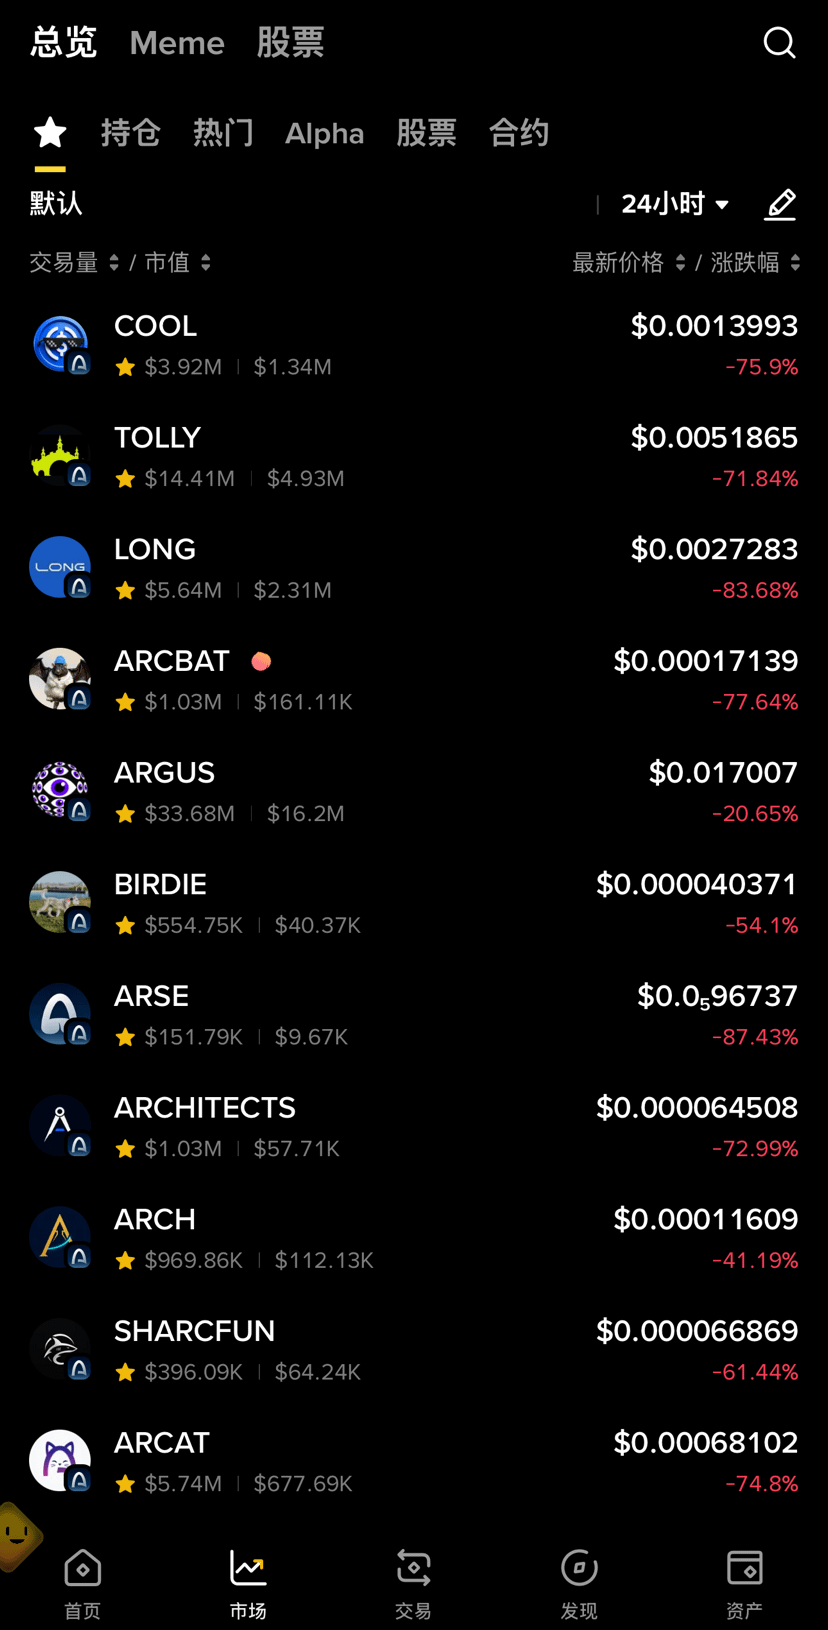
Finally understand why #ARC went on a one-day tour
It’s just a bunch of Southeast Asian dudes—who would look and not run
After getting bitten by a dog, each of them looks even poorer than Tony
Finally understand why #ARC went on a one-day tour
It’s just a bunch of Southeast Asian dudes—who would look and not run
After getting bitten by a dog, each of them looks even poorer than Tony
It’s just a bunch of Southeast Asian dudes—who would look and not run
After getting bitten by a dog, each of them looks even poorer than Tony


102
·
--
🚨Left-Side Trades
Call in first, then figure out the solution
Look for volatility, calculate the odds—still push him in with 27 😎
$ORDI $WDC $ARM
{future}(ARMUSDT)
{future}(WDCUSDT)
{future}(ORDIUSDT)
🚨Left-Side Trades
Call in first, then figure out the solution
Look for volatility, calculate the odds—still push him in with 27 😎
$ORDI $WDC $ARM
Call in first, then figure out the solution
Look for volatility, calculate the odds—still push him in with 27 😎
$ORDI $WDC $ARM
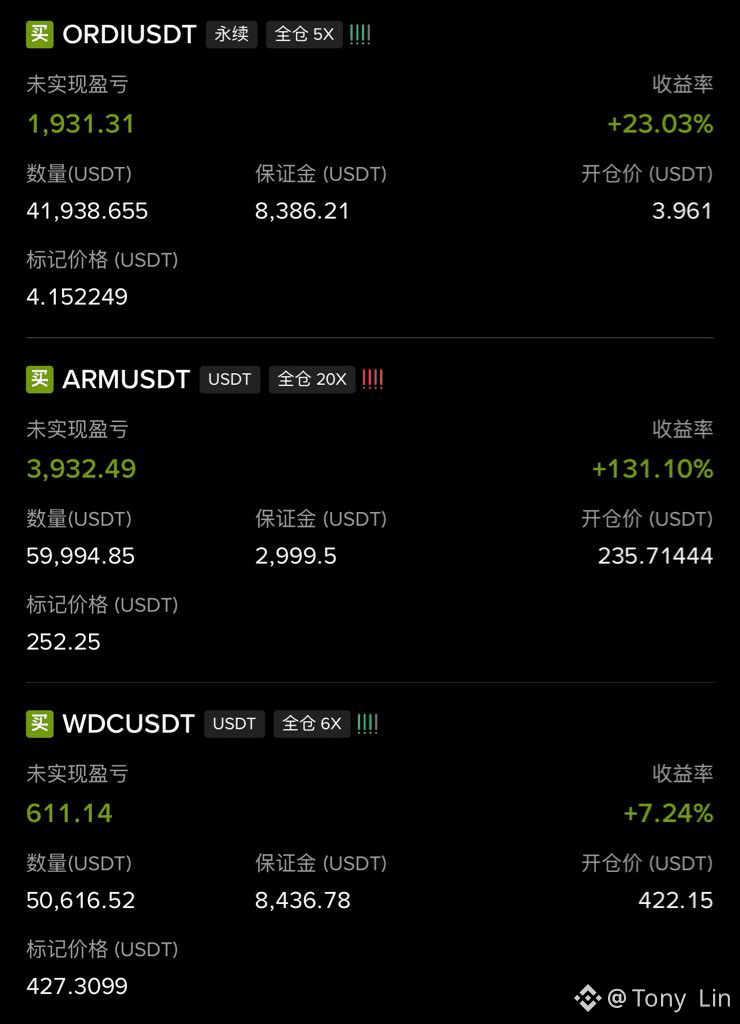
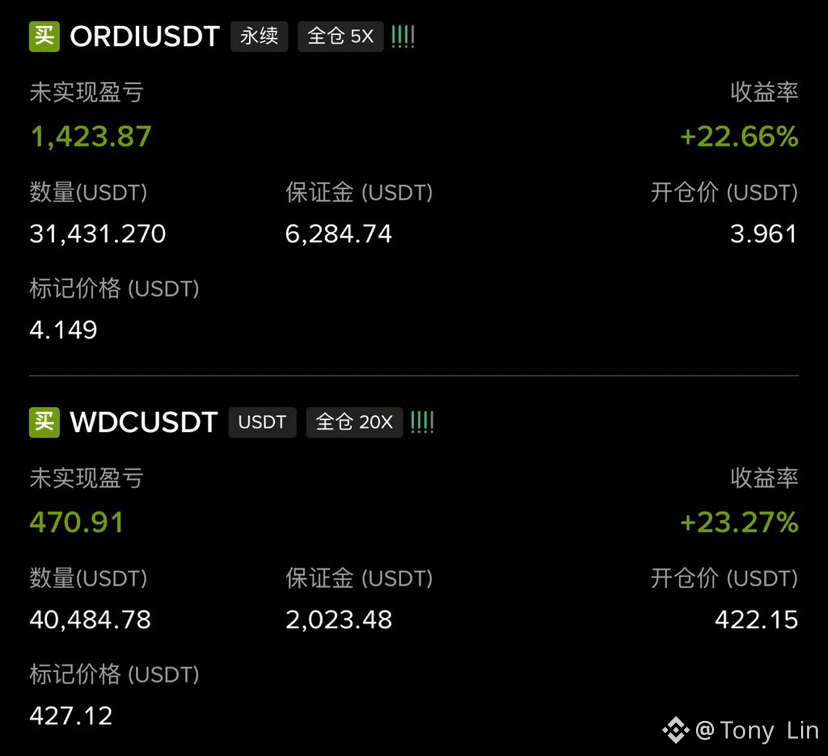
492
·
--
#Robinhood将支持Circle的Arc网络
Who understands ARC’s concentrate level?
Whether the opening is already the peak—does it matter?
Is it still allowed if what’s being hyped is louder than anything else, yet the whole thing turns out to be a one-day trip?
#Robinhood将支持Circle的Arc网络
Who understands ARC’s concentrate level?
Whether the opening is already the peak—does it matter?
Is it still allowed if what’s being hyped is louder than anything else, yet the whole thing turns out to be a one-day trip?
Who understands ARC’s concentrate level?
Whether the opening is already the peak—does it matter?
Is it still allowed if what’s being hyped is louder than anything else, yet the whole thing turns out to be a one-day trip?
117
·
--
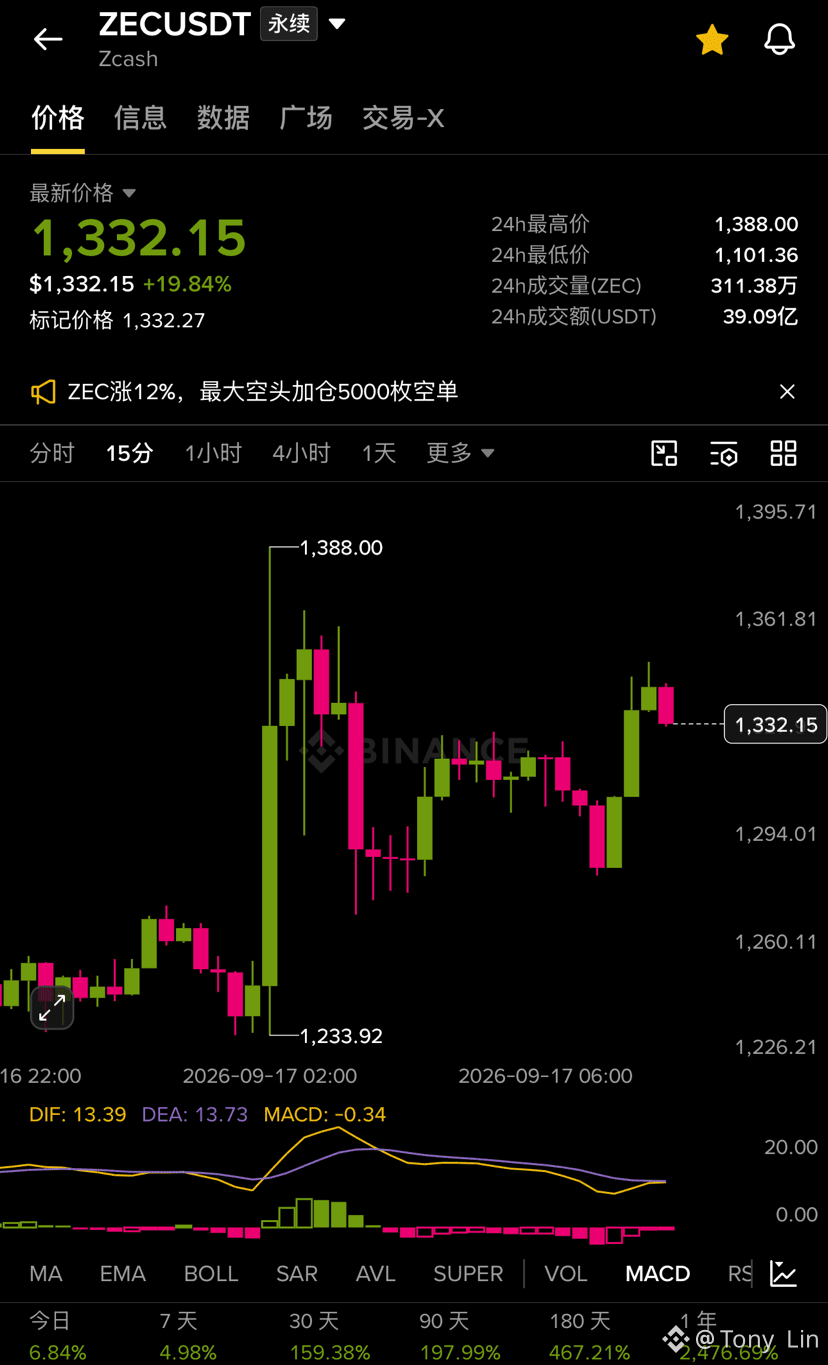
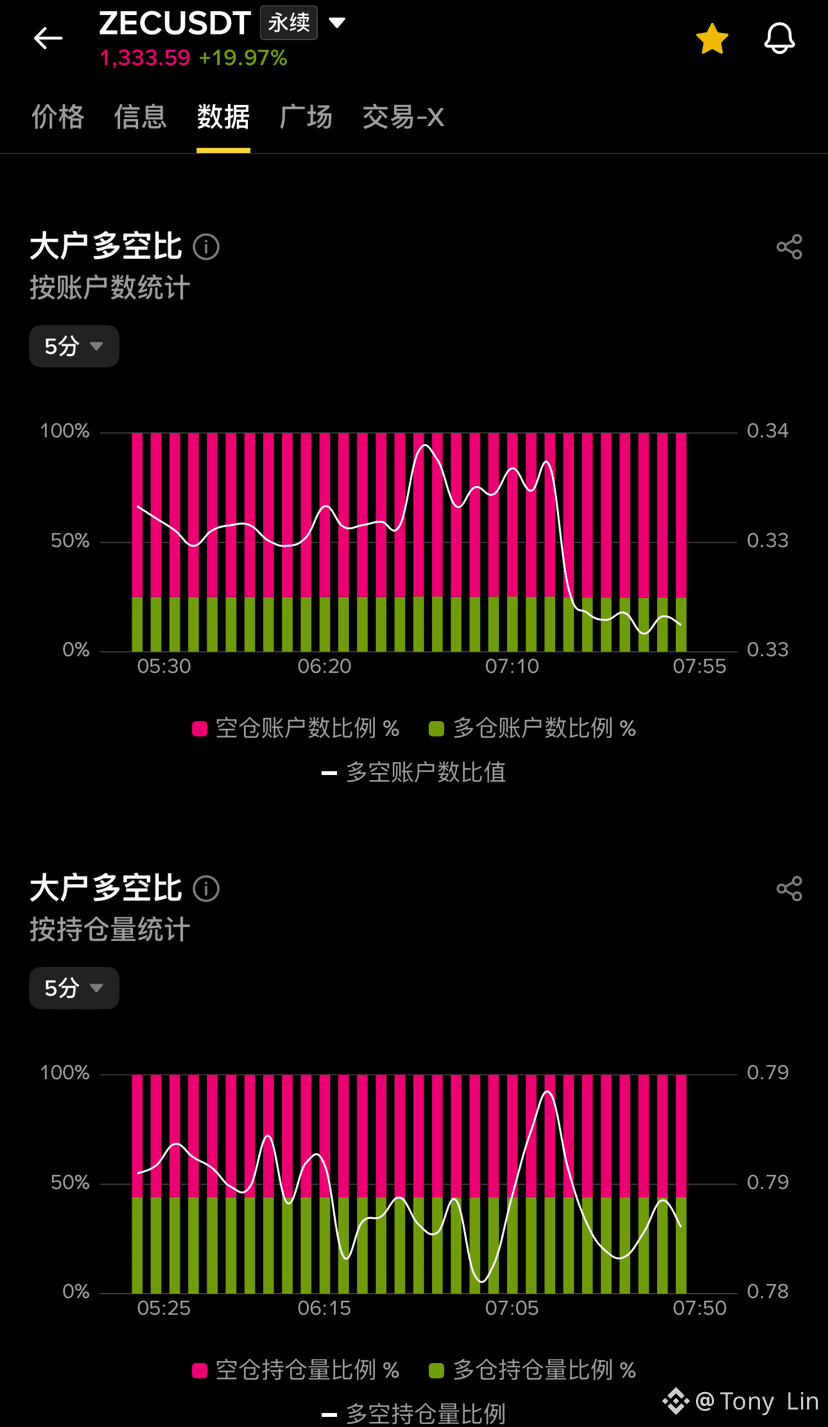
$ZEC
It is the nightmare of all air forces
Like a strict father teaching his child
So that you have no fight left—ask you if you surrender 😂😂😂
$ZEC
It is the nightmare of all air forces
Like a strict father teaching his child
So that you have no fight left—ask you if you surrender 😂😂😂
It is the nightmare of all air forces
Like a strict father teaching his child
So that you have no fight left—ask you if you surrender 😂😂😂
239
Log in to explore more content
Join global crypto users on Binance Square
⚡️ Get latest and useful information about crypto.
💬 Trusted by the world’s largest crypto exchange.
👍 Discover real insights from verified creators.
Email / Phone number
Trending Topics
AIStocksWhatNext
1M views
7,041 Discussing
Share & Win Traffic Reward in our Trending Hashtag Campaign
✨Topic: What Other Investment Opportunities Remain as AI Stocks Keep Rising?
👉How to Join:
Publish a short post or article with hashtag #AIStocksWhatNext
Share whether you’re bullish or bearish, and post your AI stock holdings or trade — using the trade widget may improve your eligibility.
You can also strengthen your post by sharing data or charts, and avoiding AI-generated images.
✍️Create content based on the below angles:
- Nvidia says chip sales will double next year, and top AI companies keep hitting record revenue, the compute spend behind it is just as staggering. Is AI demand really taking off? And how long can it last? AI stocks are up across the board. Is this a real breakout, or just a short-term bounce?
- Industry leaders are calling to slow down AI development, while Trump plans to build an “AI Force”, claiming AI could account for 25% of U.S. GDP in the future. Whose side are you on? Will state-level backing be a long-term win for AI stocks?
- Are you buying AI stocks? Share your AI-related trade/holdings with our trade sharing widget.
⏰Campaign Period:
- 2026-09-22 7:00 - 2026-09-24 4:00 UTC
🎁Reward:
- Qualified posts that comply with the above guidelines and contain more than 100 words will be reviewed and may receive a random traffic boost of 500 to 3,000 views. You will receive a notification from your feed secretary if your post is selected.
- Get a chance to have your article featured on Binance Square Official
Need ideas for your post? Visit the topic page #AIStocksWhatNext or the Square Guide on How to Post for Better Reach.
Binance Square Official
·611 Likes
·1.8M views
BitcoinRejectedAt$87,300Twice
0 views
0 Discussing
BCHJumps28%OnCMEFuturesListing
24,586 views
672 Discussing