

Zephyro
158 Posts

Zephyro
Report
Block User
0 Following
174 Followers
306 Liked
Posts
All
Quotes
Videos
·
--
Bearish
🚨🔴 $BTC SHORT SETUP — WATCH THIS LEVEL 🔴🚨
$BTC is showing downside pressure RIGHT NOW.
📍 BTC Mark Price: ~$83,166
📉 24H: -1.43%
⚠️ Recent 15M structure: lower highs + lower lows
📊 Futures long/short account ratio: ~1.24
🎯 BTCUSDT SHORT IDEA
Entry zone: $83,150–$83,500
🛑 Stop Loss: $83,950
🎯 TP1: $82,500
🎯 TP2: $81,900
🎯 TP3: $81,300
🔥 Confirmation: A clean rejection below $83.5K or breakdown through ~$83.1K strengthens the short setup.
❌ If BTC reclaims and holds $83.95K, invalidate the setup.
Don't blindly chase the candle. Manage leverage and position size — crypto can reverse violently.
#BTC #Bitcoin #BTCUSDT #Binance #Crypto #Trading #ShortSetup #Futures
🚨🔴 $BTC SHORT SETUP — WATCH THIS LEVEL 🔴🚨
$BTC is showing downside pressure RIGHT NOW.
📍 BTC Mark Price: ~$83,166
📉 24H: -1.43%
⚠️ Recent 15M structure: lower highs + lower lows
📊 Futures long/short account ratio: ~1.24
🎯 BTCUSDT SHORT IDEA
Entry zone: $83,150–$83,500
🛑 Stop Loss: $83,950
🎯 TP1: $82,500
🎯 TP2: $81,900
🎯 TP3: $81,300
🔥 Confirmation: A clean rejection below $83.5K or breakdown through ~$83.1K strengthens the short setup.
❌ If BTC reclaims and holds $83.95K, invalidate the setup.
Don't blindly chase the candle. Manage leverage and position size — crypto can reverse violently.
#BTC #Bitcoin #BTCUSDT #Binance #Crypto #Trading #ShortSetup #Futures
$BTC is showing downside pressure RIGHT NOW.
📍 BTC Mark Price: ~$83,166
📉 24H: -1.43%
⚠️ Recent 15M structure: lower highs + lower lows
📊 Futures long/short account ratio: ~1.24
🎯 BTCUSDT SHORT IDEA
Entry zone: $83,150–$83,500
🛑 Stop Loss: $83,950
🎯 TP1: $82,500
🎯 TP2: $81,900
🎯 TP3: $81,300
🔥 Confirmation: A clean rejection below $83.5K or breakdown through ~$83.1K strengthens the short setup.
❌ If BTC reclaims and holds $83.95K, invalidate the setup.
Don't blindly chase the candle. Manage leverage and position size — crypto can reverse violently.
#BTC #Bitcoin #BTCUSDT #Binance #Crypto #Trading #ShortSetup #Futures
79
·
--
Bullish
🚨🔥 LIVE BINANCE TRADE SETUP — $MMT 🔥🚨
$MMT is moving NOW. Price is around $0.1827, with strong volume hitting the market.
📊 Current: ~$0.1827
📈 24H: +5.97%
🔥 Recent high: ~$0.1865
⚡ Momentum: HIGH
🎯 $MMT/USDT LONG SETUP
🟢 Entry zone: $0.1825 – $0.1835
🛑 Stop Loss: $0.1795
🎯 TP1: $0.1860
🎯 TP2: $0.1895
🎯 TP3: $0.1930
Trigger: Prefer a hold/reclaim above the $0.1825–$0.1835 area rather than blindly chasing a green candle.
If $0.1795 breaks decisively, the setup is invalid.
⚠️ This is a high-volatility setup, not a guaranteed-profit signal. Manage position size and risk carefully.
🔥 Watch $MMT — volume is the key.
#MMT #MMTUSDT #Binance #BinanceSquare #Crypto #CryptoTrading #Altcoins #TradeSignal #USDT
🚨🔥 LIVE BINANCE TRADE SETUP — $MMT 🔥🚨
$MMT is moving NOW. Price is around $0.1827, with strong volume hitting the market.
📊 Current: ~$0.1827
📈 24H: +5.97%
🔥 Recent high: ~$0.1865
⚡ Momentum: HIGH
🎯 $MMT /USDT LONG SETUP
🟢 Entry zone: $0.1825 – $0.1835
🛑 Stop Loss: $0.1795
🎯 TP1: $0.1860
🎯 TP2: $0.1895
🎯 TP3: $0.1930
Trigger: Prefer a hold/reclaim above the $0.1825–$0.1835 area rather than blindly chasing a green candle.
If $0.1795 breaks decisively, the setup is invalid.
⚠️ This is a high-volatility setup, not a guaranteed-profit signal. Manage position size and risk carefully.
🔥 Watch $MMT — volume is the key.
#MMT #MMTUSDT #Binance #BinanceSquare #Crypto #CryptoTrading #Altcoins #TradeSignal #USDT
$MMT is moving NOW. Price is around $0.1827, with strong volume hitting the market.
📊 Current: ~$0.1827
📈 24H: +5.97%
🔥 Recent high: ~$0.1865
⚡ Momentum: HIGH
🎯 $MMT /USDT LONG SETUP
🟢 Entry zone: $0.1825 – $0.1835
🛑 Stop Loss: $0.1795
🎯 TP1: $0.1860
🎯 TP2: $0.1895
🎯 TP3: $0.1930
Trigger: Prefer a hold/reclaim above the $0.1825–$0.1835 area rather than blindly chasing a green candle.
If $0.1795 breaks decisively, the setup is invalid.
⚠️ This is a high-volatility setup, not a guaranteed-profit signal. Manage position size and risk carefully.
🔥 Watch $MMT — volume is the key.
#MMT #MMTUSDT #Binance #BinanceSquare #Crypto #CryptoTrading #Altcoins #TradeSignal #USDT
274
·
--
Bullish
🚨 $ARK /USDT 📈🚀
🔥 ARK is showing strong momentum on Binance’s trending feed, with notable buying activity from top traders/holders.
📍 Current: ~$0.1729
🎯 Entry zone: $0.1710–$0.1730
🎯 TP1: $0.1760
🎯 TP2: $0.1800
🛑 Invalidation: below $0.1680
⚡ Breakout trigger: sustained move above $0.1760 with volume.
Risk management matters
#ARK #Binance #cryptosignal #altcoins #cryptotrading
🚨 $ARK /USDT 📈🚀
🔥 ARK is showing strong momentum on Binance’s trending feed, with notable buying activity from top traders/holders.
📍 Current: ~$0.1729
🎯 Entry zone: $0.1710–$0.1730
🎯 TP1: $0.1760
🎯 TP2: $0.1800
🛑 Invalidation: below $0.1680
⚡ Breakout trigger: sustained move above $0.1760 with volume.
Risk management matters
#ARK #Binance #cryptosignal #altcoins #cryptotrading
🔥 ARK is showing strong momentum on Binance’s trending feed, with notable buying activity from top traders/holders.
📍 Current: ~$0.1729
🎯 Entry zone: $0.1710–$0.1730
🎯 TP1: $0.1760
🎯 TP2: $0.1800
🛑 Invalidation: below $0.1680
⚡ Breakout trigger: sustained move above $0.1760 with volume.
Risk management matters
#ARK #Binance #cryptosignal #altcoins #cryptotrading
120
·
--
Bullish
🚨 $BOME /USDT — TRENDING ENTRY WATCH
BOME is heating up 🔥
📍 Current: ~0.0011855
📈 24H: +4.64%
📊 24H Volume: ~$6.38M
🎯 Entry zone: 0.001175–0.001190
🎯 TP1: 0.001220
🎯 TP2: 0.001250
🛑 Invalidation: below 0.001150
Why watching?
• Strong recent momentum
• Heavy volume expansion during the breakout
• Binance hot-coin ranking: #3 by community focus
• Recent top-holder/trader flow has shown strong buying
⚠️ Wait for confirmation around the entry zone rather than chasing a vertical candle. Crypto is highly volatile—manage risk and size accordingly.
#BOME #BOMEUSDT #Binance #Crypto #EntrySignal #Altcoins
🚨 $BOME /USDT — TRENDING ENTRY WATCH
BOME is heating up 🔥
📍 Current: ~0.0011855
📈 24H: +4.64%
📊 24H Volume: ~$6.38M
🎯 Entry zone: 0.001175–0.001190
🎯 TP1: 0.001220
🎯 TP2: 0.001250
🛑 Invalidation: below 0.001150
Why watching?
• Strong recent momentum
• Heavy volume expansion during the breakout
• Binance hot-coin ranking: #3 by community focus
• Recent top-holder/trader flow has shown strong buying
⚠️ Wait for confirmation around the entry zone rather than chasing a vertical candle. Crypto is highly volatile—manage risk and size accordingly.
#BOME #BOMEUSDT #Binance #Crypto #EntrySignal #Altcoins
BOME is heating up 🔥
📍 Current: ~0.0011855
📈 24H: +4.64%
📊 24H Volume: ~$6.38M
🎯 Entry zone: 0.001175–0.001190
🎯 TP1: 0.001220
🎯 TP2: 0.001250
🛑 Invalidation: below 0.001150
Why watching?
• Strong recent momentum
• Heavy volume expansion during the breakout
• Binance hot-coin ranking: #3 by community focus
• Recent top-holder/trader flow has shown strong buying
⚠️ Wait for confirmation around the entry zone rather than chasing a vertical candle. Crypto is highly volatile—manage risk and size accordingly.
#BOME #BOMEUSDT #Binance #Crypto #EntrySignal #Altcoins
1
486
·
--
Article
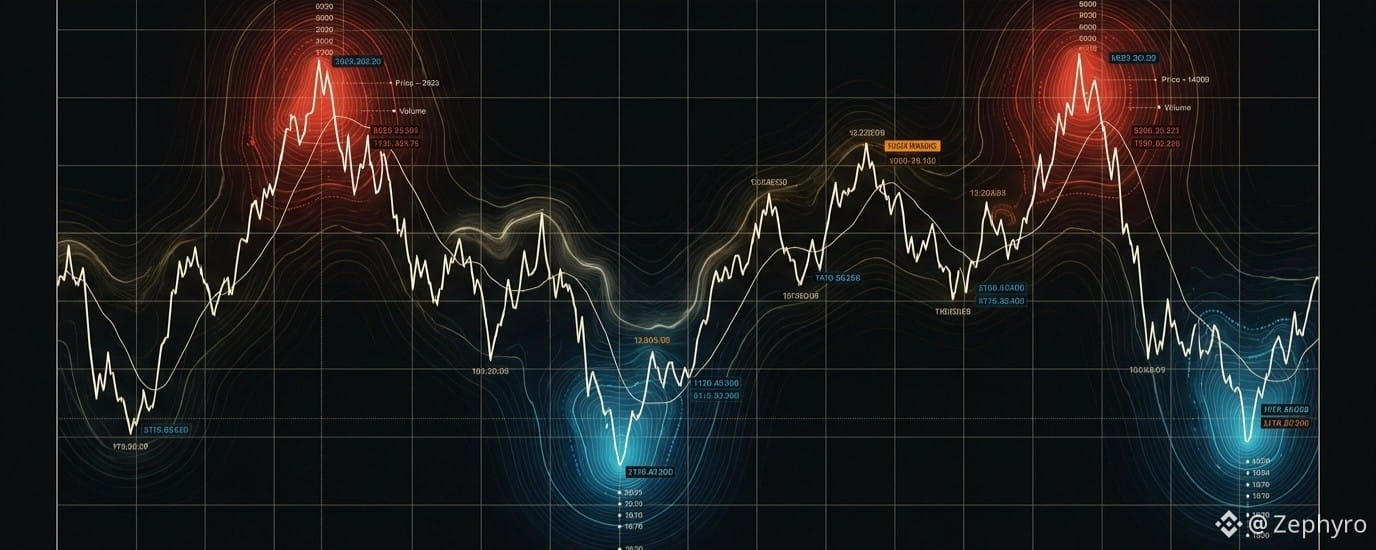
Your Stop Loss Is Someone Else's PaydayYou spot the setup. Clean support, textbook break of structure, price does exactly what the chart said it would for four beautiful minutes. Then it snaps back, clips your stop by six ticks, and rockets off in your original direction without you. You didn't lose because you were wrong. You lost because you were right on schedule — for someone else's entry.
That's the entire thesis behind what Marco Acetony calls the "Liquidity Trap," and whatever you think of the branding, the mechanic it describes is real: retail stop clusters sit in predictable places, and predictable places get visited.
Here's where most retail traders get it backwards. Support, resistance, trendlines, a clean break of structure — you were taught these are signals. In this framework they're bait. Every time price respects a level and turns away cleanly, it's not confirming strength. It's advertising exactly where the next batch of stops is parked. The market doesn't move toward "value." It moves toward wherever the resting orders are thickest, then it goes and gets them.
So throw out the rule that says "buy when price breaks above the high." That's precisely the move that gets you trapped. The actual rule is uncomfortable: you don't buy until price has already traded 'below' the recent low and swept it. You don't sell until price has traded 'above' the recent high. If the market goes your direction without clearing that liquidity first, you don't have a trade — you have a coincidence that hasn't finished punishing someone yet.
Think about what that means in practice. You watch price break to a new high, exactly the setup you've been taught to chase your whole trading life, and you do nothing. You wait. Maybe it never comes back. Maybe you watch a 40-pip move happen without you. That's the tax you pay for not being the liquidity.
The stop loss isn't collateral damage. It's the point.
Markets are zero-sum in the short term — someone's profit is funded by someone else's exit. Your stop loss isn't an unfortunate side effect of volatility; it's fuel, and the move needs fuel to run. The mechanism is almost insulting in its simplicity: price triggers a textbook bullish signal, retail buys, retail places stops eight or ten pips below entry like they were told to, and then price turns around and eats every one of those stops before doing what it was "supposed to" do in the first place. You weren't wrong about direction. You were early, and early is the same as wrong when your stop gets there first.
Once you see a chart this way, you can't unsee it. Every clean level becomes a question: who's trapped there, and has anyone come to collect yet?
Execution: 9:30 AM, and no room for hope
This isn't a "wait and predict" strategy — it's react-only. The entry trigger is the sweep itself: price violates the high or low, and you're in at market, immediately, no confirmation candle, no waiting for a retest. In futures, that entry can be surgical — within a tick or two of the swept level. In forex, spread means you pad the stop slightly, because getting stopped out by spread noise on a correct call is its own kind of stupid.
The stop goes directly on the other side of the level that just got swept — above the high for a short, below the low for a long. Tight. No room for "it might come back."
Timing matters more than most retail traders admit. The 9:30 AM EST New York open is prime real estate for this, because that's when volatility — and therefore liquidity generation — spikes hardest. And here's the part that separates this approach from conventional risk management: news events aren't something to avoid. They're a liquidity delivery system. The spike after a major release is the setup, not the thing you flatten your account to avoid trading through.
Fixed risk-to-reward ratios are a comfort blanket, not a strategy.
I'll say this part plainly because most trading education won't: a 1:3 risk-to-reward target is not a plan, it's a wish. The market has no idea what ratio you picked, and it has zero obligation to let price travel three times your risk before reversing. If the next real liquidity pool sits at 1:2.2, that's where the move ends — not at your arbitrary target. Trading a fixed RR is trading blind and calling it discipline.
What actually works is structural: trail your stop behind the newest high or low as the move develops, so the trade pays for its own risk as it goes. Take partials at the next logical liquidity pool — an opposing high or low where the next wave of traders is about to get trapped — not at a number you picked because it looked clean on a risk calculator.
Now the part nobody selling this framework wants to say out loud.
None of this is provable in the way it's usually presented. "The market wanted your stop" is a compelling story, and the mechanics — stop clusters existing, sweeps happening, price reversing after liquidity grabs — are observably real market phenomena. But "smart money is intentionally hunting you" slides quickly from description into narrative, and narrative is exactly what makes a strategy feel true regardless of whether it actually has edge. Every strategy looks obvious in hindsight on a chart someone already picked to prove the point. The real test isn't whether this explains your last losing trade — almost anything can, after the fact. It's whether it would have told you, in advance, which sweep was real and which was just noise. That's the question worth sitting with before you risk a dollar on it, not after.
Your Stop Loss Is Someone Else's Payday
You spot the setup. Clean support, textbook break of structure, price does exactly what the chart said it would for four beautiful minutes. Then it snaps back, clips your stop by six ticks, and rockets off in your original direction without you. You didn't lose because you were wrong. You lost because you were right on schedule — for someone else's entry.
That's the entire thesis behind what Marco Acetony calls the "Liquidity Trap," and whatever you think of the branding, the mechanic it describes is real: retail stop clusters sit in predictable places, and predictable places get visited.
Here's where most retail traders get it backwards. Support, resistance, trendlines, a clean break of structure — you were taught these are signals. In this framework they're bait. Every time price respects a level and turns away cleanly, it's not confirming strength. It's advertising exactly where the next batch of stops is parked. The market doesn't move toward "value." It moves toward wherever the resting orders are thickest, then it goes and gets them.
So throw out the rule that says "buy when price breaks above the high." That's precisely the move that gets you trapped. The actual rule is uncomfortable: you don't buy until price has already traded 'below' the recent low and swept it. You don't sell until price has traded 'above' the recent high. If the market goes your direction without clearing that liquidity first, you don't have a trade — you have a coincidence that hasn't finished punishing someone yet.
Think about what that means in practice. You watch price break to a new high, exactly the setup you've been taught to chase your whole trading life, and you do nothing. You wait. Maybe it never comes back. Maybe you watch a 40-pip move happen without you. That's the tax you pay for not being the liquidity.
The stop loss isn't collateral damage. It's the point.
Markets are zero-sum in the short term — someone's profit is funded by someone else's exit. Your stop loss isn't an unfortunate side effect of volatility; it's fuel, and the move needs fuel to run. The mechanism is almost insulting in its simplicity: price triggers a textbook bullish signal, retail buys, retail places stops eight or ten pips below entry like they were told to, and then price turns around and eats every one of those stops before doing what it was "supposed to" do in the first place. You weren't wrong about direction. You were early, and early is the same as wrong when your stop gets there first.
Once you see a chart this way, you can't unsee it. Every clean level becomes a question: who's trapped there, and has anyone come to collect yet?
Execution: 9:30 AM, and no room for hope
This isn't a "wait and predict" strategy — it's react-only. The entry trigger is the sweep itself: price violates the high or low, and you're in at market, immediately, no confirmation candle, no waiting for a retest. In futures, that entry can be surgical — within a tick or two of the swept level. In forex, spread means you pad the stop slightly, because getting stopped out by spread noise on a correct call is its own kind of stupid.
The stop goes directly on the other side of the level that just got swept — above the high for a short, below the low for a long. Tight. No room for "it might come back."
Timing matters more than most retail traders admit. The 9:30 AM EST New York open is prime real estate for this, because that's when volatility — and therefore liquidity generation — spikes hardest. And here's the part that separates this approach from conventional risk management: news events aren't something to avoid. They're a liquidity delivery system. The spike after a major release is the setup, not the thing you flatten your account to avoid trading through.
Fixed risk-to-reward ratios are a comfort blanket, not a strategy.
I'll say this part plainly because most trading education won't: a 1:3 risk-to-reward target is not a plan, it's a wish. The market has no idea what ratio you picked, and it has zero obligation to let price travel three times your risk before reversing. If the next real liquidity pool sits at 1:2.2, that's where the move ends — not at your arbitrary target. Trading a fixed RR is trading blind and calling it discipline.
What actually works is structural: trail your stop behind the newest high or low as the move develops, so the trade pays for its own risk as it goes. Take partials at the next logical liquidity pool — an opposing high or low where the next wave of traders is about to get trapped — not at a number you picked because it looked clean on a risk calculator.
Now the part nobody selling this framework wants to say out loud.
None of this is provable in the way it's usually presented. "The market wanted your stop" is a compelling story, and the mechanics — stop clusters existing, sweeps happening, price reversing after liquidity grabs — are observably real market phenomena. But "smart money is intentionally hunting you" slides quickly from description into narrative, and narrative is exactly what makes a strategy feel true regardless of whether it actually has edge. Every strategy looks obvious in hindsight on a chart someone already picked to prove the point. The real test isn't whether this explains your last losing trade — almost anything can, after the fact. It's whether it would have told you, in advance, which sweep was real and which was just noise. That's the question worth sitting with before you risk a dollar on it, not after.
That's the entire thesis behind what Marco Acetony calls the "Liquidity Trap," and whatever you think of the branding, the mechanic it describes is real: retail stop clusters sit in predictable places, and predictable places get visited.
Here's where most retail traders get it backwards. Support, resistance, trendlines, a clean break of structure — you were taught these are signals. In this framework they're bait. Every time price respects a level and turns away cleanly, it's not confirming strength. It's advertising exactly where the next batch of stops is parked. The market doesn't move toward "value." It moves toward wherever the resting orders are thickest, then it goes and gets them.
So throw out the rule that says "buy when price breaks above the high." That's precisely the move that gets you trapped. The actual rule is uncomfortable: you don't buy until price has already traded 'below' the recent low and swept it. You don't sell until price has traded 'above' the recent high. If the market goes your direction without clearing that liquidity first, you don't have a trade — you have a coincidence that hasn't finished punishing someone yet.
Think about what that means in practice. You watch price break to a new high, exactly the setup you've been taught to chase your whole trading life, and you do nothing. You wait. Maybe it never comes back. Maybe you watch a 40-pip move happen without you. That's the tax you pay for not being the liquidity.
The stop loss isn't collateral damage. It's the point.
Markets are zero-sum in the short term — someone's profit is funded by someone else's exit. Your stop loss isn't an unfortunate side effect of volatility; it's fuel, and the move needs fuel to run. The mechanism is almost insulting in its simplicity: price triggers a textbook bullish signal, retail buys, retail places stops eight or ten pips below entry like they were told to, and then price turns around and eats every one of those stops before doing what it was "supposed to" do in the first place. You weren't wrong about direction. You were early, and early is the same as wrong when your stop gets there first.
Once you see a chart this way, you can't unsee it. Every clean level becomes a question: who's trapped there, and has anyone come to collect yet?
Execution: 9:30 AM, and no room for hope
This isn't a "wait and predict" strategy — it's react-only. The entry trigger is the sweep itself: price violates the high or low, and you're in at market, immediately, no confirmation candle, no waiting for a retest. In futures, that entry can be surgical — within a tick or two of the swept level. In forex, spread means you pad the stop slightly, because getting stopped out by spread noise on a correct call is its own kind of stupid.
The stop goes directly on the other side of the level that just got swept — above the high for a short, below the low for a long. Tight. No room for "it might come back."
Timing matters more than most retail traders admit. The 9:30 AM EST New York open is prime real estate for this, because that's when volatility — and therefore liquidity generation — spikes hardest. And here's the part that separates this approach from conventional risk management: news events aren't something to avoid. They're a liquidity delivery system. The spike after a major release is the setup, not the thing you flatten your account to avoid trading through.
Fixed risk-to-reward ratios are a comfort blanket, not a strategy.
I'll say this part plainly because most trading education won't: a 1:3 risk-to-reward target is not a plan, it's a wish. The market has no idea what ratio you picked, and it has zero obligation to let price travel three times your risk before reversing. If the next real liquidity pool sits at 1:2.2, that's where the move ends — not at your arbitrary target. Trading a fixed RR is trading blind and calling it discipline.
What actually works is structural: trail your stop behind the newest high or low as the move develops, so the trade pays for its own risk as it goes. Take partials at the next logical liquidity pool — an opposing high or low where the next wave of traders is about to get trapped — not at a number you picked because it looked clean on a risk calculator.
Now the part nobody selling this framework wants to say out loud.
None of this is provable in the way it's usually presented. "The market wanted your stop" is a compelling story, and the mechanics — stop clusters existing, sweeps happening, price reversing after liquidity grabs — are observably real market phenomena. But "smart money is intentionally hunting you" slides quickly from description into narrative, and narrative is exactly what makes a strategy feel true regardless of whether it actually has edge. Every strategy looks obvious in hindsight on a chart someone already picked to prove the point. The real test isn't whether this explains your last losing trade — almost anything can, after the fact. It's whether it would have told you, in advance, which sweep was real and which was just noise. That's the question worth sitting with before you risk a dollar on it, not after.
120
·
--
Article
Stop Chasing the Tape: 5 Secrets from the "Universal Playbook" for Narrative-Driven TradingMost retail traders spend their days playing a high-stakes game of follow-the-leader. They mimic entries from social media gurus without a shred of understanding as to why the trade exists in the first place. It is a recipe for a blown account. If you are tired of the inconsistency, you need to stop reacting to every price tick and start reading the story the market is already telling.
Successful trading isn’t about predicting the future; it’s about mastery of the "Universal Playbook." This isn't just a collection of indicators; it is a framework for building a coherent market narrative that applies whether you are trading S&P 500 futures, crypto, or options.
1. If There Is No Story, There Is No Trade
The foundation of the Universal Playbook is the narrative. A trade is not just a candle pattern; it is a story built from three primary catalysts. If you can’t articulate the story, you have no business putting capital at risk.
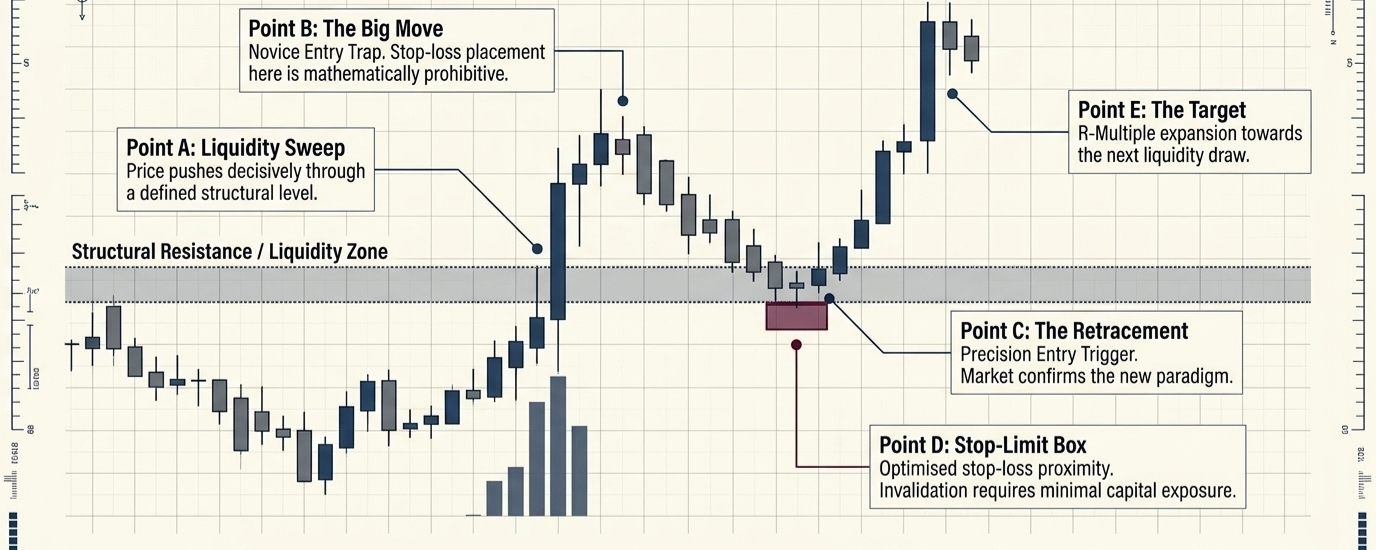
The Liquidity Catalyst: You must identify where the "Smart Money" is looking. This means tracking old highs and lows, key support levels, and fair value gaps.Market Structure Shift (MSS): This is the market’s telegraph. In an uptrend, we look for the breach of the last higher low; in a downtrend, the breach of the last lower high. This is the signal that the tide has turned.The "Big Move": This is a high-momentum price displacement. It typically serves one of two purposes: it is either a violent "sweep" of existing liquidity or a definitive drive to "target" the next major level.
A robust narrative also layers in fundamental context. The market doesn't move in a vacuum; seasonal patterns, such as the typical February weakness during the first year of an election cycle, provide the "why" behind the "what."
"If there is no story, there is no trade."
2. The Professional’s Secret: Stop Buying Breakouts
Amateurs chase green candles; professionals wait for the return. One of the most expensive mistakes a trader can make is "buying the breakout." By the time a move is obvious enough for the masses to jump in, the risk-to-reward ratio has already soured.
Entry
The Universal Playbook explicitly rejects breakout trading in favor of the Retracement Requirement. Once a liquidity event or Market Structure Shift occurs, you do not chase. You wait for the "break and retest." You let the price return to the scene of the crime—a broken trend line or a fair value gap.
Optimization
Entering on a retracement is the ultimate optimization. It allows for a significantly tighter stop-loss. By waiting for the price to come to you, your stop-limit is positioned just beyond the structural shift, providing a mathematical advantage that "chasers" will never have.
3. Why an Elite 55% Win Rate is Better Than You Think
The market doesn’t care about your ego or your need to be right. Many of the most profitable traders on the planet carry a win rate of only 50–55%. They aren't psychics; they are mathematicians who understand the R-Multiple.
R-Multiple Defined: This is simply the size of your average win relative to your average loss.The Math of Success: If your wins are three times the size of your losses, you can be wrong half the time and still build a fortune.
Letting go of the 90% win-rate fantasy provides immense psychological relief. When you focus on R-Multiples rather than perfection, a losing trade is no longer a failure—it’s just a business expense.
4. Beware the "Lookalike" Trap
A "lookalike" trade is a siren song for the undisciplined. It’s a setup that appears valid on a lower timeframe—like a random fair value gap—but lacks the weight of higher-timeframe context. Without Confluence, a setup is just noise.
To avoid the trap, you must layer technical and macro filters. A high-probability trade requires Confluence:
The 21 EMA: Is the price interacting with the mean trend?Fibonacci Levels: Does the retracement hit the 0.5 level or deeper?Divergence: Are related pairs moving in sync? If the S&P 500 is making a new high but the NASDAQ isn't, the story is lying to you.
Alignment with the higher-timeframe flow is the difference between a professional setup and a "lookalike" that exists only to take your liquidity.
5. The Most Powerful Move is Doing Nothing
The hardest part of trading isn't clicking the "buy" button; it's the discipline required to keep your hands in your pockets. If you map out a beautiful narrative and the price never retraces to your entry point, the move is gone.
Novices force the trade anyway because they fear missing out. Professionals understand that the market is a revolving door of opportunities. If the specific "story" you planned doesn't play out exactly as scripted, you walk away. The ability to "let it go" is the hallmark of a veteran.
If the specific story you planned does not play out, you must have the discipline to let the trade go.
Conclusion: Becoming the Author of Your Strategy
The shift from technical mimicry to narrative mastery is the moment you stop being a victim of market volatility and start being an informed participant. By demanding a story, waiting for the retest, and seeking confluence, you take control of the math.
Before you put your next dollar on the line, look at the chart and ask yourself: "Is your current trade based on a proven market story, or are you just hoping for a happy ending?"
Stop Chasing the Tape: 5 Secrets from the "Universal Playbook" for Narrative-Driven Trading
Most retail traders spend their days playing a high-stakes game of follow-the-leader. They mimic entries from social media gurus without a shred of understanding as to why the trade exists in the first place. It is a recipe for a blown account. If you are tired of the inconsistency, you need to stop reacting to every price tick and start reading the story the market is already telling.
Successful trading isn’t about predicting the future; it’s about mastery of the "Universal Playbook." This isn't just a collection of indicators; it is a framework for building a coherent market narrative that applies whether you are trading S&P 500 futures, crypto, or options.
1. If There Is No Story, There Is No Trade
The foundation of the Universal Playbook is the narrative. A trade is not just a candle pattern; it is a story built from three primary catalysts. If you can’t articulate the story, you have no business putting capital at risk.
The Liquidity Catalyst: You must identify where the "Smart Money" is looking. This means tracking old highs and lows, key support levels, and fair value gaps.Market Structure Shift (MSS): This is the market’s telegraph. In an uptrend, we look for the breach of the last higher low; in a downtrend, the breach of the last lower high. This is the signal that the tide has turned.The "Big Move": This is a high-momentum price displacement. It typically serves one of two purposes: it is either a violent "sweep" of existing liquidity or a definitive drive to "target" the next major level.
A robust narrative also layers in fundamental context. The market doesn't move in a vacuum; seasonal patterns, such as the typical February weakness during the first year of an election cycle, provide the "why" behind the "what."
"If there is no story, there is no trade."
2. The Professional’s Secret: Stop Buying Breakouts
Amateurs chase green candles; professionals wait for the return. One of the most expensive mistakes a trader can make is "buying the breakout." By the time a move is obvious enough for the masses to jump in, the risk-to-reward ratio has already soured.
Entry
The Universal Playbook explicitly rejects breakout trading in favor of the Retracement Requirement. Once a liquidity event or Market Structure Shift occurs, you do not chase. You wait for the "break and retest." You let the price return to the scene of the crime—a broken trend line or a fair value gap.
Optimization
Entering on a retracement is the ultimate optimization. It allows for a significantly tighter stop-loss. By waiting for the price to come to you, your stop-limit is positioned just beyond the structural shift, providing a mathematical advantage that "chasers" will never have.
3. Why an Elite 55% Win Rate is Better Than You Think
The market doesn’t care about your ego or your need to be right. Many of the most profitable traders on the planet carry a win rate of only 50–55%. They aren't psychics; they are mathematicians who understand the R-Multiple.
R-Multiple Defined: This is simply the size of your average win relative to your average loss.The Math of Success: If your wins are three times the size of your losses, you can be wrong half the time and still build a fortune.
Letting go of the 90% win-rate fantasy provides immense psychological relief. When you focus on R-Multiples rather than perfection, a losing trade is no longer a failure—it’s just a business expense.
4. Beware the "Lookalike" Trap
A "lookalike" trade is a siren song for the undisciplined. It’s a setup that appears valid on a lower timeframe—like a random fair value gap—but lacks the weight of higher-timeframe context. Without Confluence, a setup is just noise.
To avoid the trap, you must layer technical and macro filters. A high-probability trade requires Confluence:
The 21 EMA: Is the price interacting with the mean trend?Fibonacci Levels: Does the retracement hit the 0.5 level or deeper?Divergence: Are related pairs moving in sync? If the S&P 500 is making a new high but the NASDAQ isn't, the story is lying to you.
Alignment with the higher-timeframe flow is the difference between a professional setup and a "lookalike" that exists only to take your liquidity.
5. The Most Powerful Move is Doing Nothing
The hardest part of trading isn't clicking the "buy" button; it's the discipline required to keep your hands in your pockets. If you map out a beautiful narrative and the price never retraces to your entry point, the move is gone.
Novices force the trade anyway because they fear missing out. Professionals understand that the market is a revolving door of opportunities. If the specific "story" you planned doesn't play out exactly as scripted, you walk away. The ability to "let it go" is the hallmark of a veteran.
If the specific story you planned does not play out, you must have the discipline to let the trade go.
Conclusion: Becoming the Author of Your Strategy
The shift from technical mimicry to narrative mastery is the moment you stop being a victim of market volatility and start being an informed participant. By demanding a story, waiting for the retest, and seeking confluence, you take control of the math.
Before you put your next dollar on the line, look at the chart and ask yourself: "Is your current trade based on a proven market story, or are you just hoping for a happy ending?"
Successful trading isn’t about predicting the future; it’s about mastery of the "Universal Playbook." This isn't just a collection of indicators; it is a framework for building a coherent market narrative that applies whether you are trading S&P 500 futures, crypto, or options.
1. If There Is No Story, There Is No Trade
The foundation of the Universal Playbook is the narrative. A trade is not just a candle pattern; it is a story built from three primary catalysts. If you can’t articulate the story, you have no business putting capital at risk.
The Liquidity Catalyst: You must identify where the "Smart Money" is looking. This means tracking old highs and lows, key support levels, and fair value gaps.Market Structure Shift (MSS): This is the market’s telegraph. In an uptrend, we look for the breach of the last higher low; in a downtrend, the breach of the last lower high. This is the signal that the tide has turned.The "Big Move": This is a high-momentum price displacement. It typically serves one of two purposes: it is either a violent "sweep" of existing liquidity or a definitive drive to "target" the next major level.
A robust narrative also layers in fundamental context. The market doesn't move in a vacuum; seasonal patterns, such as the typical February weakness during the first year of an election cycle, provide the "why" behind the "what."
"If there is no story, there is no trade."
2. The Professional’s Secret: Stop Buying Breakouts
Amateurs chase green candles; professionals wait for the return. One of the most expensive mistakes a trader can make is "buying the breakout." By the time a move is obvious enough for the masses to jump in, the risk-to-reward ratio has already soured.
Entry
The Universal Playbook explicitly rejects breakout trading in favor of the Retracement Requirement. Once a liquidity event or Market Structure Shift occurs, you do not chase. You wait for the "break and retest." You let the price return to the scene of the crime—a broken trend line or a fair value gap.
Optimization
Entering on a retracement is the ultimate optimization. It allows for a significantly tighter stop-loss. By waiting for the price to come to you, your stop-limit is positioned just beyond the structural shift, providing a mathematical advantage that "chasers" will never have.
3. Why an Elite 55% Win Rate is Better Than You Think
The market doesn’t care about your ego or your need to be right. Many of the most profitable traders on the planet carry a win rate of only 50–55%. They aren't psychics; they are mathematicians who understand the R-Multiple.
R-Multiple Defined: This is simply the size of your average win relative to your average loss.The Math of Success: If your wins are three times the size of your losses, you can be wrong half the time and still build a fortune.
Letting go of the 90% win-rate fantasy provides immense psychological relief. When you focus on R-Multiples rather than perfection, a losing trade is no longer a failure—it’s just a business expense.
4. Beware the "Lookalike" Trap
A "lookalike" trade is a siren song for the undisciplined. It’s a setup that appears valid on a lower timeframe—like a random fair value gap—but lacks the weight of higher-timeframe context. Without Confluence, a setup is just noise.
To avoid the trap, you must layer technical and macro filters. A high-probability trade requires Confluence:
The 21 EMA: Is the price interacting with the mean trend?Fibonacci Levels: Does the retracement hit the 0.5 level or deeper?Divergence: Are related pairs moving in sync? If the S&P 500 is making a new high but the NASDAQ isn't, the story is lying to you.
Alignment with the higher-timeframe flow is the difference between a professional setup and a "lookalike" that exists only to take your liquidity.
5. The Most Powerful Move is Doing Nothing
The hardest part of trading isn't clicking the "buy" button; it's the discipline required to keep your hands in your pockets. If you map out a beautiful narrative and the price never retraces to your entry point, the move is gone.
Novices force the trade anyway because they fear missing out. Professionals understand that the market is a revolving door of opportunities. If the specific "story" you planned doesn't play out exactly as scripted, you walk away. The ability to "let it go" is the hallmark of a veteran.
If the specific story you planned does not play out, you must have the discipline to let the trade go.
Conclusion: Becoming the Author of Your Strategy
The shift from technical mimicry to narrative mastery is the moment you stop being a victim of market volatility and start being an informed participant. By demanding a story, waiting for the retest, and seeking confluence, you take control of the math.
Before you put your next dollar on the line, look at the chart and ask yourself: "Is your current trade based on a proven market story, or are you just hoping for a happy ending?"
92
·
--
Article
Beyond the Candles: The Counter-Intuitive Mechanics of How Markets Actually MoveThe retail obsession with "buyer-to-seller ratios" and candle patterns is a fundamental misunderstanding of clearinghouse mechanics. To the uninitiated, a price chart is a map of sentiment; to the professional analyst, those candles are merely lagging artifacts of a much deeper, more violent process. Traditional patterns fail because they ignore the engine behind the glass: the continuous double auction.
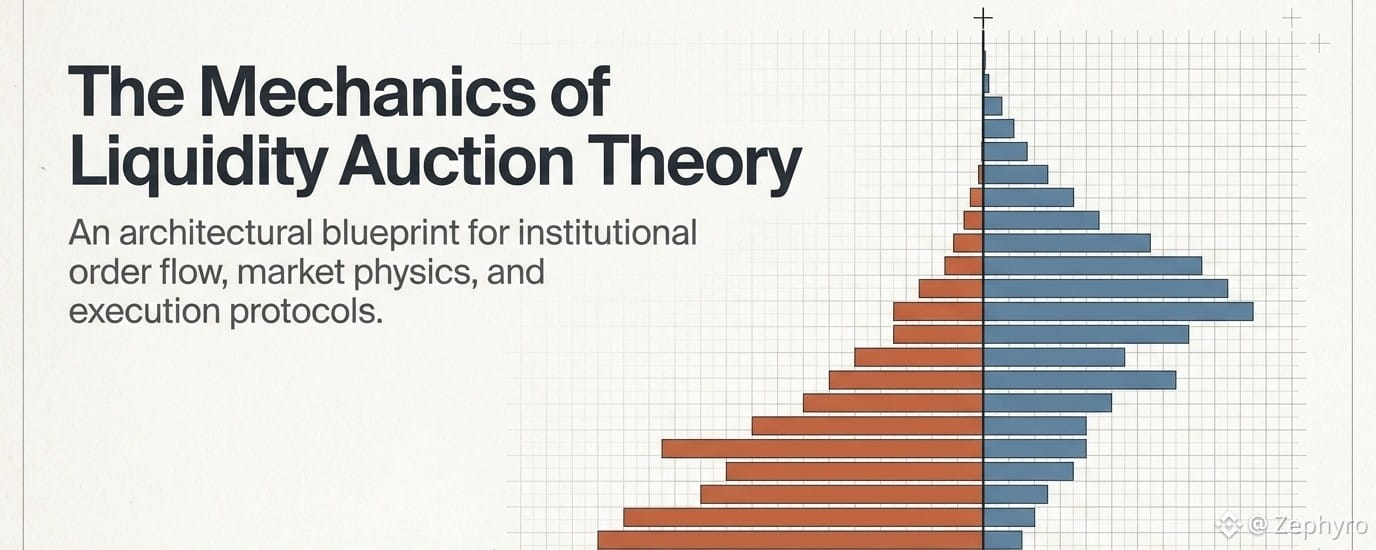
To survive in a regime dominated by high-frequency algorithms, one must look past the "price action" illusion and adopt Liquidity Auction Theory. This framework treats the market not as a series of shapes, but as a battle of order book dynamics. By shifting focus from what price is doing to how the auction is being cleared, we can identify where "smart money" is actually providing liquidity and where the retail crowd is being harvested.
1. Your Chart is Just a "Menu" (The Passive vs. Aggressive Reality)
The common retail trope that price moves because of "more buyers than sellers" is a mathematical impossibility; every trade requires a participant on both sides. Movement is actually dictated by the interaction between those providing liquidity and those consuming it.
Passive Liquidity: These are limit orders sitting on the exchange books—the "menu" of available prices.Aggressive Liquidity: These are market participants who "cannot wait," executing immediately by "hitting the bid" or "lifting the ask."
Price moves when aggressive orders "eat" through the available limit orders at a specific level, forcing the exchange to find the next available price (the spread).
Only aggressive orders—those willing to cross the spread—force the exchange to move. Passive orders, no matter how massive, act as a brake or a ceiling until they are either consumed or canceled.
2. The 70% Rule—Why Most "Action" is Just Agreement
Professional analysts prioritize Value Areas over arbitrary highs and lows. This creates a distinction between two market states: Balance (Fair Value) and Imbalance (Price Discovery). Statistically, 70% of all volume occurs within one standard deviation of the Value Area.
Contrary to retail belief, high volume at a specific price does not signal the start of a trend; it signals "agreement." It means the market has found its current "home." True moves happen during Imbalance, where "Fair Value Gaps" represent moments of urgent price discovery rather than random holes in a chart. For the professional, trading outside of these areas without a clear shift in value is simply gambling against the mean.
3. The "Failed Auction" is Often Your Best Entry
The Failed Auction is a premier mean-reversion strategy that capitalizes on the market’s tendency to return to the Value Area after an exhaustive probe.
Mechanics of Absorption A Failed Auction occurs when price attempts to break outside the Value Area but meets absorption. This is the "signature" of a limit order provider winning the battle; thousands of aggressive contracts hit the level, yet price refuses to budge. The "strong hand" is soaking up the pressure.
Fading the extremes is more logical than chasing breakouts without context.
The trigger for this entry is the appearance of a "Big Trade" bubble on the wick of a candle—representing successful absorption—followed immediately by aggressive order flow and "acceptance" back within the body of the following candle.
4. Why Your Favorite Breakout Strategy is Probably a Trap
The Opening Range Breakout (ORB) is a retail staple, typically focused on the 5-minute or 15-minute range established at the New York open. However, without Informed Order Flow as a filter, these are often liquidity traps.
A valid breakout requires seeing aggressive institutional participation in the body of the breakout candle. If you see "Big Trade" bubbles appearing on the top wick of a breakout attempt, it signals that sellers are absorbing the move, turning the breakout into a fakeout. Conversely, we look for Momentum Ignition—a form of "toxic order flow" where a massive market order (thousands of contracts) floods the book. This is predatory by nature; it is designed to trigger algorithmic cascades and force stop-outs, creating a high-probability vacuum that professionals join instantly.
5. The X-Ray Vision of Professional Tools
Professional traders utilize specialized MBO (Market By Order) data to see "behind the candles" and identify institutional footprints:
Footprint Charts: These display the exact volume of aggressive buyers versus sellers at every individual price level within a candle.Big Trade Bubbles: This visual filter strips away market noise to highlight only large institutional orders, specifically those involving 150+ contracts in the S&P 500.Liquidity Heat Map (MBO Data): This visualization of the limit order book reveals the location of large resting orders that often act as magnets or targets for price movement.Delta: This represents the final scorecard of a candle, calculating the net difference between aggressive buying and selling volume.
6. "Smart Money" has a Signature (and a Breaking Point)
Order flow allows for clinical risk management by placing stops behind the "signature" of institutional activity. Rather than using arbitrary candle lows, professionals place stops behind absorption or imbalance clusters.
This is governed by the Invalidation Rule: A trade is dead the moment price moves past the "Big Trade" bubble that initiated the move. If the "strong hand" that absorbed the market is overwhelmed, the structural premise of the trade has evaporated. To further filter noise, professionals often ignore moves unless there is a specific Participation Filter met—typically a volume of 4,000–5,000 contracts per minute in the S&P 500.
Conclusion: From Chart Reader to Auction Observer
The evolution from retail trader to market analyst requires a shift from watching what price is doing to observing how the auction is being cleared. It is the difference between reading a menu and watching the kitchen.
In consolidative "ping-pong" regimes, the objective is to fade the extremes; in trending regimes, the goal is to ride the toxic flow of momentum ignition. In a market dominated by institutional giants, the ultimate question remains: Are you following the price, or are you following the liquidity? As data transparency increases, one must wonder if the "X-ray vision" of the order book will remain an edge, or if the next frontier of microstructure will move even deeper into the shadows of dark pools and hidden liquidity.
#liquidity
Beyond the Candles: The Counter-Intuitive Mechanics of How Markets Actually Move
The retail obsession with "buyer-to-seller ratios" and candle patterns is a fundamental misunderstanding of clearinghouse mechanics. To the uninitiated, a price chart is a map of sentiment; to the professional analyst, those candles are merely lagging artifacts of a much deeper, more violent process. Traditional patterns fail because they ignore the engine behind the glass: the continuous double auction.
To survive in a regime dominated by high-frequency algorithms, one must look past the "price action" illusion and adopt Liquidity Auction Theory. This framework treats the market not as a series of shapes, but as a battle of order book dynamics. By shifting focus from what price is doing to how the auction is being cleared, we can identify where "smart money" is actually providing liquidity and where the retail crowd is being harvested.
1. Your Chart is Just a "Menu" (The Passive vs. Aggressive Reality)
The common retail trope that price moves because of "more buyers than sellers" is a mathematical impossibility; every trade requires a participant on both sides. Movement is actually dictated by the interaction between those providing liquidity and those consuming it.
Passive Liquidity: These are limit orders sitting on the exchange books—the "menu" of available prices.Aggressive Liquidity: These are market participants who "cannot wait," executing immediately by "hitting the bid" or "lifting the ask."
Price moves when aggressive orders "eat" through the available limit orders at a specific level, forcing the exchange to find the next available price (the spread).
Only aggressive orders—those willing to cross the spread—force the exchange to move. Passive orders, no matter how massive, act as a brake or a ceiling until they are either consumed or canceled.
2. The 70% Rule—Why Most "Action" is Just Agreement
Professional analysts prioritize Value Areas over arbitrary highs and lows. This creates a distinction between two market states: Balance (Fair Value) and Imbalance (Price Discovery). Statistically, 70% of all volume occurs within one standard deviation of the Value Area.
Contrary to retail belief, high volume at a specific price does not signal the start of a trend; it signals "agreement." It means the market has found its current "home." True moves happen during Imbalance, where "Fair Value Gaps" represent moments of urgent price discovery rather than random holes in a chart. For the professional, trading outside of these areas without a clear shift in value is simply gambling against the mean.
3. The "Failed Auction" is Often Your Best Entry
The Failed Auction is a premier mean-reversion strategy that capitalizes on the market’s tendency to return to the Value Area after an exhaustive probe.
Mechanics of Absorption A Failed Auction occurs when price attempts to break outside the Value Area but meets absorption. This is the "signature" of a limit order provider winning the battle; thousands of aggressive contracts hit the level, yet price refuses to budge. The "strong hand" is soaking up the pressure.
Fading the extremes is more logical than chasing breakouts without context.
The trigger for this entry is the appearance of a "Big Trade" bubble on the wick of a candle—representing successful absorption—followed immediately by aggressive order flow and "acceptance" back within the body of the following candle.
4. Why Your Favorite Breakout Strategy is Probably a Trap
The Opening Range Breakout (ORB) is a retail staple, typically focused on the 5-minute or 15-minute range established at the New York open. However, without Informed Order Flow as a filter, these are often liquidity traps.
A valid breakout requires seeing aggressive institutional participation in the body of the breakout candle. If you see "Big Trade" bubbles appearing on the top wick of a breakout attempt, it signals that sellers are absorbing the move, turning the breakout into a fakeout. Conversely, we look for Momentum Ignition—a form of "toxic order flow" where a massive market order (thousands of contracts) floods the book. This is predatory by nature; it is designed to trigger algorithmic cascades and force stop-outs, creating a high-probability vacuum that professionals join instantly.
5. The X-Ray Vision of Professional Tools
Professional traders utilize specialized MBO (Market By Order) data to see "behind the candles" and identify institutional footprints:
Footprint Charts: These display the exact volume of aggressive buyers versus sellers at every individual price level within a candle.Big Trade Bubbles: This visual filter strips away market noise to highlight only large institutional orders, specifically those involving 150+ contracts in the S&P 500.Liquidity Heat Map (MBO Data): This visualization of the limit order book reveals the location of large resting orders that often act as magnets or targets for price movement.Delta: This represents the final scorecard of a candle, calculating the net difference between aggressive buying and selling volume.
6. "Smart Money" has a Signature (and a Breaking Point)
Order flow allows for clinical risk management by placing stops behind the "signature" of institutional activity. Rather than using arbitrary candle lows, professionals place stops behind absorption or imbalance clusters.
This is governed by the Invalidation Rule: A trade is dead the moment price moves past the "Big Trade" bubble that initiated the move. If the "strong hand" that absorbed the market is overwhelmed, the structural premise of the trade has evaporated. To further filter noise, professionals often ignore moves unless there is a specific Participation Filter met—typically a volume of 4,000–5,000 contracts per minute in the S&P 500.
Conclusion: From Chart Reader to Auction Observer
The evolution from retail trader to market analyst requires a shift from watching what price is doing to observing how the auction is being cleared. It is the difference between reading a menu and watching the kitchen.
In consolidative "ping-pong" regimes, the objective is to fade the extremes; in trending regimes, the goal is to ride the toxic flow of momentum ignition. In a market dominated by institutional giants, the ultimate question remains: Are you following the price, or are you following the liquidity? As data transparency increases, one must wonder if the "X-ray vision" of the order book will remain an edge, or if the next frontier of microstructure will move even deeper into the shadows of dark pools and hidden liquidity.
#liquidity
To survive in a regime dominated by high-frequency algorithms, one must look past the "price action" illusion and adopt Liquidity Auction Theory. This framework treats the market not as a series of shapes, but as a battle of order book dynamics. By shifting focus from what price is doing to how the auction is being cleared, we can identify where "smart money" is actually providing liquidity and where the retail crowd is being harvested.
1. Your Chart is Just a "Menu" (The Passive vs. Aggressive Reality)
The common retail trope that price moves because of "more buyers than sellers" is a mathematical impossibility; every trade requires a participant on both sides. Movement is actually dictated by the interaction between those providing liquidity and those consuming it.
Passive Liquidity: These are limit orders sitting on the exchange books—the "menu" of available prices.Aggressive Liquidity: These are market participants who "cannot wait," executing immediately by "hitting the bid" or "lifting the ask."
Price moves when aggressive orders "eat" through the available limit orders at a specific level, forcing the exchange to find the next available price (the spread).
Only aggressive orders—those willing to cross the spread—force the exchange to move. Passive orders, no matter how massive, act as a brake or a ceiling until they are either consumed or canceled.
2. The 70% Rule—Why Most "Action" is Just Agreement
Professional analysts prioritize Value Areas over arbitrary highs and lows. This creates a distinction between two market states: Balance (Fair Value) and Imbalance (Price Discovery). Statistically, 70% of all volume occurs within one standard deviation of the Value Area.
Contrary to retail belief, high volume at a specific price does not signal the start of a trend; it signals "agreement." It means the market has found its current "home." True moves happen during Imbalance, where "Fair Value Gaps" represent moments of urgent price discovery rather than random holes in a chart. For the professional, trading outside of these areas without a clear shift in value is simply gambling against the mean.
3. The "Failed Auction" is Often Your Best Entry
The Failed Auction is a premier mean-reversion strategy that capitalizes on the market’s tendency to return to the Value Area after an exhaustive probe.
Mechanics of Absorption A Failed Auction occurs when price attempts to break outside the Value Area but meets absorption. This is the "signature" of a limit order provider winning the battle; thousands of aggressive contracts hit the level, yet price refuses to budge. The "strong hand" is soaking up the pressure.
Fading the extremes is more logical than chasing breakouts without context.
The trigger for this entry is the appearance of a "Big Trade" bubble on the wick of a candle—representing successful absorption—followed immediately by aggressive order flow and "acceptance" back within the body of the following candle.
4. Why Your Favorite Breakout Strategy is Probably a Trap
The Opening Range Breakout (ORB) is a retail staple, typically focused on the 5-minute or 15-minute range established at the New York open. However, without Informed Order Flow as a filter, these are often liquidity traps.
A valid breakout requires seeing aggressive institutional participation in the body of the breakout candle. If you see "Big Trade" bubbles appearing on the top wick of a breakout attempt, it signals that sellers are absorbing the move, turning the breakout into a fakeout. Conversely, we look for Momentum Ignition—a form of "toxic order flow" where a massive market order (thousands of contracts) floods the book. This is predatory by nature; it is designed to trigger algorithmic cascades and force stop-outs, creating a high-probability vacuum that professionals join instantly.
5. The X-Ray Vision of Professional Tools
Professional traders utilize specialized MBO (Market By Order) data to see "behind the candles" and identify institutional footprints:
Footprint Charts: These display the exact volume of aggressive buyers versus sellers at every individual price level within a candle.Big Trade Bubbles: This visual filter strips away market noise to highlight only large institutional orders, specifically those involving 150+ contracts in the S&P 500.Liquidity Heat Map (MBO Data): This visualization of the limit order book reveals the location of large resting orders that often act as magnets or targets for price movement.Delta: This represents the final scorecard of a candle, calculating the net difference between aggressive buying and selling volume.
6. "Smart Money" has a Signature (and a Breaking Point)
Order flow allows for clinical risk management by placing stops behind the "signature" of institutional activity. Rather than using arbitrary candle lows, professionals place stops behind absorption or imbalance clusters.
This is governed by the Invalidation Rule: A trade is dead the moment price moves past the "Big Trade" bubble that initiated the move. If the "strong hand" that absorbed the market is overwhelmed, the structural premise of the trade has evaporated. To further filter noise, professionals often ignore moves unless there is a specific Participation Filter met—typically a volume of 4,000–5,000 contracts per minute in the S&P 500.
Conclusion: From Chart Reader to Auction Observer
The evolution from retail trader to market analyst requires a shift from watching what price is doing to observing how the auction is being cleared. It is the difference between reading a menu and watching the kitchen.
In consolidative "ping-pong" regimes, the objective is to fade the extremes; in trending regimes, the goal is to ride the toxic flow of momentum ignition. In a market dominated by institutional giants, the ultimate question remains: Are you following the price, or are you following the liquidity? As data transparency increases, one must wonder if the "X-ray vision" of the order book will remain an edge, or if the next frontier of microstructure will move even deeper into the shadows of dark pools and hidden liquidity.
#liquidity
120
·
--

Article
🔥 Trending Topic for May 4, 2026 — To hit 100 USDC from a single postHere's the research breakdown and the ready-to-post content:
📊 Why This Topic Will Trend Tomorrow
Based on live market data right now:
BTC dominance is sitting at 58.5%, close to a historic 60% resistance ceiling — the same level that in 2021 preceded explosive altcoin rallies of 300–1,000%. Meanwhile, the Fear & Greed Index hit a low of 8/100 in early April 2026 — and historically, every time it dropped below 10, Bitcoin averaged +48% in the following 90 days. This creates an irresistible narrative for tomorrow.
The hottest angle: "Is altcoin season starting RIGHT NOW?" — it has actionable cashtags ($BTC, $ETH, $XRP, $SOL, $BNB), triggers reader urgency, and directly pushes people to trade.
⚙️ How Write to Earn Actually Pays
You earn 20% of trading fees when readers click a cashtag in your post and trade. If you rank in the top 30 creators, that jumps to 50%. Payouts are in USDC every Thursday. Your post is valid for commissions for 7 days only. To hit 100 USDC from a single post, you need high-volume traders clicking your cashtags — so the topic must be urgent and actionable.
✍️ Your Ready-to-Post Content (Copy & Paste)
🚨 ALTCOIN SEASON SIGNAL FIRING — Are You Positioned? [May 4, 2026]
Right now, three signals are aligning simultaneously that have historically preceded explosive altcoin moves. Here's what the data says:
📍 Signal 1 — BTC Dominance at 58.5%
$BTC dominance is approaching the critical 60% ceiling. In April 2021, the last time dominance hit 60% and got rejected, ETH tripled and SOL ran 10x over two months. We're at that same threshold today.
📍 Signal 2 — Fear & Greed at 39 (recovering from 8)
The index bottomed at 8/100 in early April — the third time in crypto history RSI fell below 30. The prior two occurrences (BTC at $200 in 2015, $3,500 in 2018) both preceded multi-year bull runs. Every sub-10 reading has historically produced +48% BTC gains within 90 days.
📍 Signal 3 — Whale Accumulation at 7-Year Lows
Whales bought 270,000 $BTC (~$21B) through March/April while exchange reserves dropped to a 6-year low. Smart money is loading up while retail panics.
🎯 The Rotation Play:
When BTC dominance rolls over from 60%, capital floods into:
→ $ETH — targeting $7,500 (Standard Chartered), strong DeFi TVL
→ $XRP — $1.21B institutional ETF inflows, CLARITY Act progress bullish
→ $SOL — Alpenglow upgrade incoming, Ethereum's closest competitor
→ $BNB — BNB Chain ecosystem growth, low fees attracting developers
⚠️ Risk to watch: BTC has a sell wall between $79K–$82K. A rejection there could delay the rotation. Dollar-cost averaging (DCA) into altcoins remains the safest strategy over lump-sum buying.
The bottom line: You don't need to time the exact top of BTC dominance. History says this zone is where patient altcoin holders get rewarded.
Are you accumulating or waiting? Drop your bags below 👇
#AltcoinSeason #BTC #ETH #XRP #SOL #BNB #CryptoMarket #Binance #WriteToEarn
💡 Why This Post Is Built to Earn 100+ USDC
Here's what makes it optimized for Write to Earn:
Multiple cashtags ($BTC, $ETH, $XRP, $SOL, $BNB) — each one is a clickable trade trigger. Using cashtags naturally within analysis, paired with direct reasoning and price context, builds reader trust and makes them more likely to act. (BitcoinEthereumNews.com)
Urgency + Data — real May 2026 numbers (BTC at $78K, Fear & Greed 39, whale data) make it feel credible and timely.
Call to action — the "drop your bags below" comment prompt boosts engagement, which the Binance Square algorithm rewards with wider distribution.
Actionable trade idea — earnings rise when your content influences actual trading activity, so linking real trade reasoning (not just hype) is the key advanced strategy.
⚡ Realistic earnings note: Top creators have reported 422 USDC in a single week. Mid-level creators earn $10–$50/day. Hitting 100 USDC from one post requires strong follower engagement + high-volume traders in your audience. The more established your following, the higher the chance of clearing that threshold.
#Write2Earn
🔥 Trending Topic for May 4, 2026 — To hit 100 USDC from a single post
Here's the research breakdown and the ready-to-post content:
📊 Why This Topic Will Trend Tomorrow
Based on live market data right now:
BTC dominance is sitting at 58.5%, close to a historic 60% resistance ceiling — the same level that in 2021 preceded explosive altcoin rallies of 300–1,000%. Meanwhile, the Fear & Greed Index hit a low of 8/100 in early April 2026 — and historically, every time it dropped below 10, Bitcoin averaged +48% in the following 90 days. This creates an irresistible narrative for tomorrow.
The hottest angle: "Is altcoin season starting RIGHT NOW?" — it has actionable cashtags ($BTC, $ETH , $XRP , $SOL , $BNB), triggers reader urgency, and directly pushes people to trade.
⚙️ How Write to Earn Actually Pays
You earn 20% of trading fees when readers click a cashtag in your post and trade. If you rank in the top 30 creators, that jumps to 50%. Payouts are in USDC every Thursday. Your post is valid for commissions for 7 days only. To hit 100 USDC from a single post, you need high-volume traders clicking your cashtags — so the topic must be urgent and actionable.
✍️ Your Ready-to-Post Content (Copy & Paste)
🚨 ALTCOIN SEASON SIGNAL FIRING — Are You Positioned? [May 4, 2026]
Right now, three signals are aligning simultaneously that have historically preceded explosive altcoin moves. Here's what the data says:
📍 Signal 1 — BTC Dominance at 58.5%
$BTC dominance is approaching the critical 60% ceiling. In April 2021, the last time dominance hit 60% and got rejected, ETH tripled and SOL ran 10x over two months. We're at that same threshold today.
📍 Signal 2 — Fear & Greed at 39 (recovering from 8)
The index bottomed at 8/100 in early April — the third time in crypto history RSI fell below 30. The prior two occurrences (BTC at $200 in 2015, $3,500 in 2018) both preceded multi-year bull runs. Every sub-10 reading has historically produced +48% BTC gains within 90 days.
📍 Signal 3 — Whale Accumulation at 7-Year Lows
Whales bought 270,000 $BTC (~$21B) through March/April while exchange reserves dropped to a 6-year low. Smart money is loading up while retail panics.
🎯 The Rotation Play:
When BTC dominance rolls over from 60%, capital floods into:
→ $ETH — targeting $7,500 (Standard Chartered), strong DeFi TVL
→ $XRP — $1.21B institutional ETF inflows, CLARITY Act progress bullish
→ $SOL — Alpenglow upgrade incoming, Ethereum's closest competitor
→ $BNB — BNB Chain ecosystem growth, low fees attracting developers
⚠️ Risk to watch: BTC has a sell wall between $79K–$82K. A rejection there could delay the rotation. Dollar-cost averaging (DCA) into altcoins remains the safest strategy over lump-sum buying.
The bottom line: You don't need to time the exact top of BTC dominance. History says this zone is where patient altcoin holders get rewarded.
Are you accumulating or waiting? Drop your bags below 👇
#AltcoinSeason #BTC #ETH #XRP #SOL #BNB #CryptoMarket #Binance #WriteToEarn
💡 Why This Post Is Built to Earn 100+ USDC
Here's what makes it optimized for Write to Earn:
Multiple cashtags ($BTC, $ETH , $XRP , $SOL , $BNB) — each one is a clickable trade trigger. Using cashtags naturally within analysis, paired with direct reasoning and price context, builds reader trust and makes them more likely to act. (BitcoinEthereumNews.com)
Urgency + Data — real May 2026 numbers (BTC at $78K, Fear & Greed 39, whale data) make it feel credible and timely.
Call to action — the "drop your bags below" comment prompt boosts engagement, which the Binance Square algorithm rewards with wider distribution.
Actionable trade idea — earnings rise when your content influences actual trading activity, so linking real trade reasoning (not just hype) is the key advanced strategy.
⚡ Realistic earnings note: Top creators have reported 422 USDC in a single week. Mid-level creators earn $10–$50/day. Hitting 100 USDC from one post requires strong follower engagement + high-volume traders in your audience. The more established your following, the higher the chance of clearing that threshold.
#Write2Earn
📊 Why This Topic Will Trend Tomorrow
Based on live market data right now:
BTC dominance is sitting at 58.5%, close to a historic 60% resistance ceiling — the same level that in 2021 preceded explosive altcoin rallies of 300–1,000%. Meanwhile, the Fear & Greed Index hit a low of 8/100 in early April 2026 — and historically, every time it dropped below 10, Bitcoin averaged +48% in the following 90 days. This creates an irresistible narrative for tomorrow.
The hottest angle: "Is altcoin season starting RIGHT NOW?" — it has actionable cashtags ($BTC, $ETH , $XRP , $SOL , $BNB), triggers reader urgency, and directly pushes people to trade.
⚙️ How Write to Earn Actually Pays
You earn 20% of trading fees when readers click a cashtag in your post and trade. If you rank in the top 30 creators, that jumps to 50%. Payouts are in USDC every Thursday. Your post is valid for commissions for 7 days only. To hit 100 USDC from a single post, you need high-volume traders clicking your cashtags — so the topic must be urgent and actionable.
✍️ Your Ready-to-Post Content (Copy & Paste)
🚨 ALTCOIN SEASON SIGNAL FIRING — Are You Positioned? [May 4, 2026]
Right now, three signals are aligning simultaneously that have historically preceded explosive altcoin moves. Here's what the data says:
📍 Signal 1 — BTC Dominance at 58.5%
$BTC dominance is approaching the critical 60% ceiling. In April 2021, the last time dominance hit 60% and got rejected, ETH tripled and SOL ran 10x over two months. We're at that same threshold today.
📍 Signal 2 — Fear & Greed at 39 (recovering from 8)
The index bottomed at 8/100 in early April — the third time in crypto history RSI fell below 30. The prior two occurrences (BTC at $200 in 2015, $3,500 in 2018) both preceded multi-year bull runs. Every sub-10 reading has historically produced +48% BTC gains within 90 days.
📍 Signal 3 — Whale Accumulation at 7-Year Lows
Whales bought 270,000 $BTC (~$21B) through March/April while exchange reserves dropped to a 6-year low. Smart money is loading up while retail panics.
🎯 The Rotation Play:
When BTC dominance rolls over from 60%, capital floods into:
→ $ETH — targeting $7,500 (Standard Chartered), strong DeFi TVL
→ $XRP — $1.21B institutional ETF inflows, CLARITY Act progress bullish
→ $SOL — Alpenglow upgrade incoming, Ethereum's closest competitor
→ $BNB — BNB Chain ecosystem growth, low fees attracting developers
⚠️ Risk to watch: BTC has a sell wall between $79K–$82K. A rejection there could delay the rotation. Dollar-cost averaging (DCA) into altcoins remains the safest strategy over lump-sum buying.
The bottom line: You don't need to time the exact top of BTC dominance. History says this zone is where patient altcoin holders get rewarded.
Are you accumulating or waiting? Drop your bags below 👇
#AltcoinSeason #BTC #ETH #XRP #SOL #BNB #CryptoMarket #Binance #WriteToEarn
💡 Why This Post Is Built to Earn 100+ USDC
Here's what makes it optimized for Write to Earn:
Multiple cashtags ($BTC, $ETH , $XRP , $SOL , $BNB) — each one is a clickable trade trigger. Using cashtags naturally within analysis, paired with direct reasoning and price context, builds reader trust and makes them more likely to act. (BitcoinEthereumNews.com)
Urgency + Data — real May 2026 numbers (BTC at $78K, Fear & Greed 39, whale data) make it feel credible and timely.
Call to action — the "drop your bags below" comment prompt boosts engagement, which the Binance Square algorithm rewards with wider distribution.
Actionable trade idea — earnings rise when your content influences actual trading activity, so linking real trade reasoning (not just hype) is the key advanced strategy.
⚡ Realistic earnings note: Top creators have reported 422 USDC in a single week. Mid-level creators earn $10–$50/day. Hitting 100 USDC from one post requires strong follower engagement + high-volume traders in your audience. The more established your following, the higher the chance of clearing that threshold.
#Write2Earn
1
127
·
--
Bearish
I learned this one the hard way: I don’t chase low-cap breakouts anymore, no matter how “early” it feels.
There was a phase where I thought catching a 5M → 50M market cap run was the fastest way to level up. And yeah, it can happen — but what I didn’t understand back then was how easily those moves are engineered. A couple of coordinated wallets, thin liquidity, and suddenly the chart looks like “organic demand.” In reality, it’s just whales painting candles and baiting retail into exit liquidity.
The turning point for me was getting trapped in one of those runs. Price was flying, volume looked insane, and I aped in thinking I’d ride the next leg. Instead, the spread widened, buys slowed for a few minutes, and then one large sell nuked the chart. Slippage kicked in, liquidity vanished, and I couldn’t even exit near my stop — classic cascade. What looked like strength was actually distribution.
Now my rule is simple: if a move depends on hype + low liquidity, I’m out. I’d rather miss a 10x than get farmed by mechanics I can’t control. Sustainable trends leave footprints — manipulated pumps leave traps.
#kernel
I learned this one the hard way: I don’t chase low-cap breakouts anymore, no matter how “early” it feels.
There was a phase where I thought catching a 5M → 50M market cap run was the fastest way to level up. And yeah, it can happen — but what I didn’t understand back then was how easily those moves are engineered. A couple of coordinated wallets, thin liquidity, and suddenly the chart looks like “organic demand.” In reality, it’s just whales painting candles and baiting retail into exit liquidity.
The turning point for me was getting trapped in one of those runs. Price was flying, volume looked insane, and I aped in thinking I’d ride the next leg. Instead, the spread widened, buys slowed for a few minutes, and then one large sell nuked the chart. Slippage kicked in, liquidity vanished, and I couldn’t even exit near my stop — classic cascade. What looked like strength was actually distribution.
Now my rule is simple: if a move depends on hype + low liquidity, I’m out. I’d rather miss a 10x than get farmed by mechanics I can’t control. Sustainable trends leave footprints — manipulated pumps leave traps.
#kernel
There was a phase where I thought catching a 5M → 50M market cap run was the fastest way to level up. And yeah, it can happen — but what I didn’t understand back then was how easily those moves are engineered. A couple of coordinated wallets, thin liquidity, and suddenly the chart looks like “organic demand.” In reality, it’s just whales painting candles and baiting retail into exit liquidity.
The turning point for me was getting trapped in one of those runs. Price was flying, volume looked insane, and I aped in thinking I’d ride the next leg. Instead, the spread widened, buys slowed for a few minutes, and then one large sell nuked the chart. Slippage kicked in, liquidity vanished, and I couldn’t even exit near my stop — classic cascade. What looked like strength was actually distribution.
Now my rule is simple: if a move depends on hype + low liquidity, I’m out. I’d rather miss a 10x than get farmed by mechanics I can’t control. Sustainable trends leave footprints — manipulated pumps leave traps.
#kernel
218
·
--
Google is integrating directly with $HIGH — powered by Highstreet infrastructure — bridging real-world AI rails with decentralized ownership.
We’ve seen this playbook before with $EDU .
Adoption follows utility. Utility follows distribution. Distribution just got unlocked.
The problem was always fragmentation.
→ Identity was siloed
→ Data was extractive
→ Incentives were misaligned
Now:
→ Unified on-chain identity primitives
→ Permissioned AI data layers with user ownership
→ Programmable incentives aligned at protocol level
At the stack level, this hits differently:
→ Modular AI inference plugged into decentralized compute layers
→ zk-verified identity + reputation oracles
→ Cross-chain asset routing with native liquidity abstraction
→ Smart contract middleware syncing off-chain intelligence in real time
This isn’t just another “partnership.”
This is infrastructure convergence.
The lines between Web2 distribution and Web3 ownership just collapsed.
$HIGH isn’t chasing narratives anymore.
It’s becoming the base layer for them.
This is where AI meets sovereignty.
This is where networks become economies.
This is the shift.
That’s where the unlock is.
#CryptoAi #Web3 #futureoftech
Google is integrating directly with $HIGH — powered by Highstreet infrastructure — bridging real-world AI rails with decentralized ownership.
We’ve seen this playbook before with $EDU .
Adoption follows utility. Utility follows distribution. Distribution just got unlocked.
The problem was always fragmentation.
→ Identity was siloed
→ Data was extractive
→ Incentives were misaligned
Now:
→ Unified on-chain identity primitives
→ Permissioned AI data layers with user ownership
→ Programmable incentives aligned at protocol level
At the stack level, this hits differently:
→ Modular AI inference plugged into decentralized compute layers
→ zk-verified identity + reputation oracles
→ Cross-chain asset routing with native liquidity abstraction
→ Smart contract middleware syncing off-chain intelligence in real time
This isn’t just another “partnership.”
This is infrastructure convergence.
The lines between Web2 distribution and Web3 ownership just collapsed.
$HIGH isn’t chasing narratives anymore.
It’s becoming the base layer for them.
This is where AI meets sovereignty.
This is where networks become economies.
This is the shift.
That’s where the unlock is.
#CryptoAi #Web3 #futureoftech
We’ve seen this playbook before with $EDU .
Adoption follows utility. Utility follows distribution. Distribution just got unlocked.
The problem was always fragmentation.
→ Identity was siloed
→ Data was extractive
→ Incentives were misaligned
Now:
→ Unified on-chain identity primitives
→ Permissioned AI data layers with user ownership
→ Programmable incentives aligned at protocol level
At the stack level, this hits differently:
→ Modular AI inference plugged into decentralized compute layers
→ zk-verified identity + reputation oracles
→ Cross-chain asset routing with native liquidity abstraction
→ Smart contract middleware syncing off-chain intelligence in real time
This isn’t just another “partnership.”
This is infrastructure convergence.
The lines between Web2 distribution and Web3 ownership just collapsed.
$HIGH isn’t chasing narratives anymore.
It’s becoming the base layer for them.
This is where AI meets sovereignty.
This is where networks become economies.
This is the shift.
That’s where the unlock is.
#CryptoAi #Web3 #futureoftech

585
·
--
🚀 $CHIP just exploded to $0.087 and I’m calling $0.12 next—am I crazy or early? 🔥 Drop your predictions below NOW… who’s got the next target? 💰
Whoever nails the closest price gets a $120 “alpha tip” from me 😏
🚀 $CHIP just exploded to $0.087 and I’m calling $0.12 next—am I crazy or early? 🔥 Drop your predictions below NOW… who’s got the next target? 💰
Whoever nails the closest price gets a $120 “alpha tip” from me 😏
Whoever nails the closest price gets a $120 “alpha tip” from me 😏
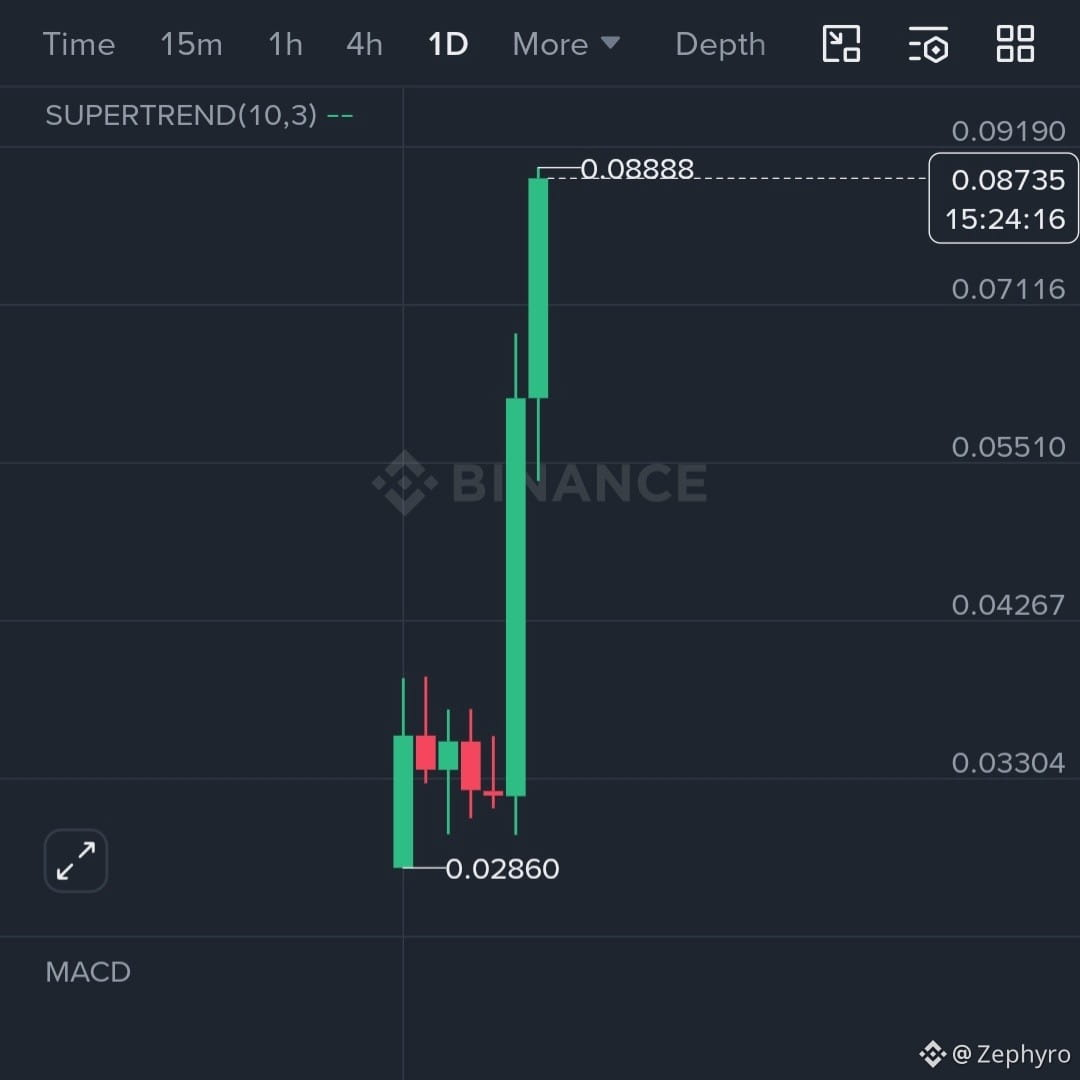
3
2
545
·
--
$RAVE just hit "HTF support" after that massive flush. 📉
Wanna see a bounce here and a retest of the moving averages to confirm the bottom. Either way, keeping bids ready for a deeper dip toward the $0.80 - $1.00 green zone. Otherwise likely to visit previous breakout levels before the next leg up.
One of the biggest runners this cycle, don’t fade the recovery.
🚀 #RAVE
$RAVE just hit "HTF support" after that massive flush. 📉
Wanna see a bounce here and a retest of the moving averages to confirm the bottom. Either way, keeping bids ready for a deeper dip toward the $0.80 - $1.00 green zone. Otherwise likely to visit previous breakout levels before the next leg up.
One of the biggest runners this cycle, don’t fade the recovery.
🚀 #RAVE
Wanna see a bounce here and a retest of the moving averages to confirm the bottom. Either way, keeping bids ready for a deeper dip toward the $0.80 - $1.00 green zone. Otherwise likely to visit previous breakout levels before the next leg up.
One of the biggest runners this cycle, don’t fade the recovery.
🚀 #RAVE
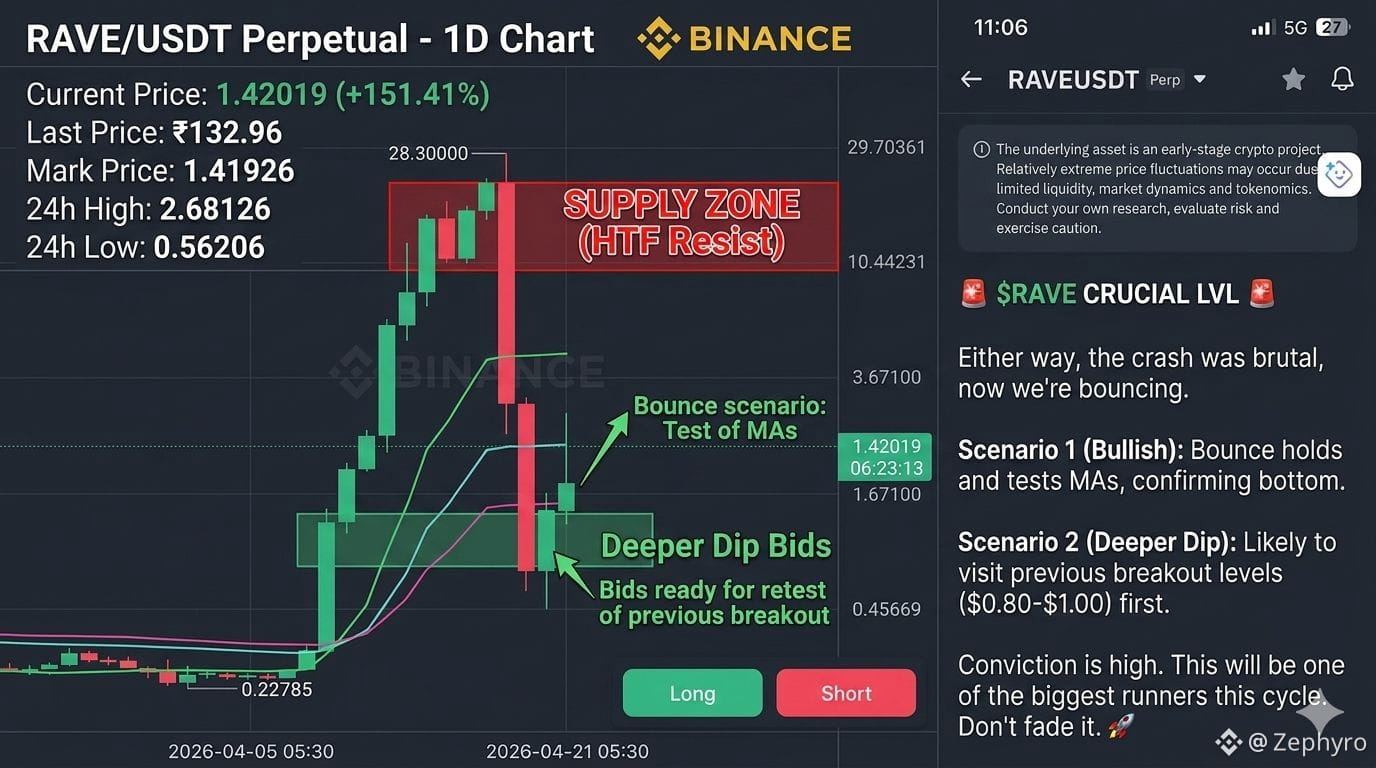
197
·
--
Bullish
$KERNEL USDT ~0.069, bouncing off intraday lows after a flush — Binance perp flow showing ~184M KERNEL 24h volume, clear signs of dip-buyers stepping in after RSI reset sub-30.
Catalyst still intact: KernelDAO riding the restaking + multi-chain yield narrative, with fresh attention around ETH/BTC/BNB capital efficiency plays — desks positioning ahead of next DeFi rotation.
Technicals:
• Resistance: 0.078 (MA100 + recent breakdown zone)
• Breakout target: 0.095+ if reclaim holds and structure flips
• Support: 0.062 — last defended demand before full trend invalidation
Structure looks like a deviation below range support, now attempting reclaim — if bulls flip 0.078, momentum likely hits overdrive fast.
Ecosystem watch: Kernel pushing cross-chain restaking vault integrations, expanding yield routes across chains — more TVL stickiness, more narrative fuel.
Momentum building quietly — this is where reversals start if demand sustains.
#KERNEL #DeFi #Crypto
$KERNEL USDT ~0.069, bouncing off intraday lows after a flush — Binance perp flow showing ~184M KERNEL 24h volume, clear signs of dip-buyers stepping in after RSI reset sub-30.
Catalyst still intact: KernelDAO riding the restaking + multi-chain yield narrative, with fresh attention around ETH/BTC/BNB capital efficiency plays — desks positioning ahead of next DeFi rotation.
Technicals:
• Resistance: 0.078 (MA100 + recent breakdown zone)
• Breakout target: 0.095+ if reclaim holds and structure flips
• Support: 0.062 — last defended demand before full trend invalidation
Structure looks like a deviation below range support, now attempting reclaim — if bulls flip 0.078, momentum likely hits overdrive fast.
Ecosystem watch: Kernel pushing cross-chain restaking vault integrations, expanding yield routes across chains — more TVL stickiness, more narrative fuel.
Momentum building quietly — this is where reversals start if demand sustains.
#KERNEL #DeFi #Crypto
Catalyst still intact: KernelDAO riding the restaking + multi-chain yield narrative, with fresh attention around ETH/BTC/BNB capital efficiency plays — desks positioning ahead of next DeFi rotation.
Technicals:
• Resistance: 0.078 (MA100 + recent breakdown zone)
• Breakout target: 0.095+ if reclaim holds and structure flips
• Support: 0.062 — last defended demand before full trend invalidation
Structure looks like a deviation below range support, now attempting reclaim — if bulls flip 0.078, momentum likely hits overdrive fast.
Ecosystem watch: Kernel pushing cross-chain restaking vault integrations, expanding yield routes across chains — more TVL stickiness, more narrative fuel.
Momentum building quietly — this is where reversals start if demand sustains.
#KERNEL #DeFi #Crypto
73
·
--
Article
I’ve watched people turn $10 into $1,000…
and $1,000 into $10.Give me just 5 minutes ❤️
Not to hype you.
Not to sell you anything.
Just real talk.
I’ve watched people turn $10 into $1,000…
and $1,000 into $10.
Same market.
Different behavior.
That’s the part nobody wants to hear.
Success here isn’t luck.
It’s discipline dressed like boring decisions.
And most people hate boring.
The biggest mistake?
Thinking more trades = more money.
No.
Overtrading is slow suicide.
You don’t need 20 setups.
You need 2 clean ones.
Sit. Wait. Strike.
Patience is your real edge.
Another rule most ignore
Small losses are your protection.
You cut $10 fast…
or watch it bleed into $100.
Ego turns scratches into wounds.
Close it. Move on.
Survival is the game.
The uncomfortable truth?
You’re not underfunded.
You’re undisciplined.
I’ve seen $50 accounts grow steady…
because the trader respected risk.
And I’ve seen $5,000 vanish…
because someone chased candles.
Money doesn’t fix habits.
Habits print money.
The trap nobody talks about
Winning too fast.
You flip $100 to $300…
and suddenly you feel invincible.
That’s when you size up.
That’s when you lose it all.
Fast wins create slow destruction.
Control > excitement.
Let me say this gently…
If you keep blowing accounts,
it’s not because the market is against you.
It’s because you haven’t faced yourself yet.
No shame in that.
We’ve all been there.
But staying there?
That’s a choice.
This game rewards the calm.
Not the loud.
So here’s your reset:
• Trade less
• Risk smaller
• Think longer
Do that…
and everything changes.
Slowly at first.
Then all at once.
$RAVE $UAI $WAI
I’ve watched people turn $10 into $1,000… and $1,000 into $10.
Give me just 5 minutes ❤️
Not to hype you.
Not to sell you anything.
Just real talk.
I’ve watched people turn $10 into $1,000…
and $1,000 into $10.
Same market.
Different behavior.
That’s the part nobody wants to hear.
Success here isn’t luck.
It’s discipline dressed like boring decisions.
And most people hate boring.
The biggest mistake?
Thinking more trades = more money.
No.
Overtrading is slow suicide.
You don’t need 20 setups.
You need 2 clean ones.
Sit. Wait. Strike.
Patience is your real edge.
Another rule most ignore
Small losses are your protection.
You cut $10 fast…
or watch it bleed into $100.
Ego turns scratches into wounds.
Close it. Move on.
Survival is the game.
The uncomfortable truth?
You’re not underfunded.
You’re undisciplined.
I’ve seen $50 accounts grow steady…
because the trader respected risk.
And I’ve seen $5,000 vanish…
because someone chased candles.
Money doesn’t fix habits.
Habits print money.
The trap nobody talks about
Winning too fast.
You flip $100 to $300…
and suddenly you feel invincible.
That’s when you size up.
That’s when you lose it all.
Fast wins create slow destruction.
Control > excitement.
Let me say this gently…
If you keep blowing accounts,
it’s not because the market is against you.
It’s because you haven’t faced yourself yet.
No shame in that.
We’ve all been there.
But staying there?
That’s a choice.
This game rewards the calm.
Not the loud.
So here’s your reset:
• Trade less
• Risk smaller
• Think longer
Do that…
and everything changes.
Slowly at first.
Then all at once.
$RAVE $UAI $WAI
Not to hype you.
Not to sell you anything.
Just real talk.
I’ve watched people turn $10 into $1,000…
and $1,000 into $10.
Same market.
Different behavior.
That’s the part nobody wants to hear.
Success here isn’t luck.
It’s discipline dressed like boring decisions.
And most people hate boring.
The biggest mistake?
Thinking more trades = more money.
No.
Overtrading is slow suicide.
You don’t need 20 setups.
You need 2 clean ones.
Sit. Wait. Strike.
Patience is your real edge.
Another rule most ignore
Small losses are your protection.
You cut $10 fast…
or watch it bleed into $100.
Ego turns scratches into wounds.
Close it. Move on.
Survival is the game.
The uncomfortable truth?
You’re not underfunded.
You’re undisciplined.
I’ve seen $50 accounts grow steady…
because the trader respected risk.
And I’ve seen $5,000 vanish…
because someone chased candles.
Money doesn’t fix habits.
Habits print money.
The trap nobody talks about
Winning too fast.
You flip $100 to $300…
and suddenly you feel invincible.
That’s when you size up.
That’s when you lose it all.
Fast wins create slow destruction.
Control > excitement.
Let me say this gently…
If you keep blowing accounts,
it’s not because the market is against you.
It’s because you haven’t faced yourself yet.
No shame in that.
We’ve all been there.
But staying there?
That’s a choice.
This game rewards the calm.
Not the loud.
So here’s your reset:
• Trade less
• Risk smaller
• Think longer
Do that…
and everything changes.
Slowly at first.
Then all at once.
$RAVE $UAI $WAI
33
6
98
79.1k
·
--
Bearish
📉 $BZ The "Bear Trap" is Set. Are You Ready?
While the crowd is chasing the pump, the smart money is looking at the overhead resistance. We just witnessed a massive rejection, and the momentum is shifting back to the bears. If you missed the initial drop, this is your second chance.
🔍 The Strategy:
Why This Works
The chart shows a classic rejection from the dynamic resistance zone (the grey cloud).
The Trend: We saw a violent sell-off followed by a weak "dead cat" bounce.
The Signal: The price has just hit the bottom of the resistance ribbon and failed to break through.
The Result: A high-probability short opportunity as the price prepares to hunt the previous lows.
🎯 The Trade Setup
Entry Zone: $88.50 - $88.60 (Current Market Price)
Stop Loss (SL): $89.59 (Protect your capital—if it breaks this, the setup is void)
Take Profit (TP): $84.50 (Potential for massive RR)
Risk/Reward Ratio: Approximately 1:4 (Risk 1 unit to make 4).
{future}(BZUSDT)
💡 Pro Tip for Beginners
Don't FOMO. The market rewards the patient. We are entering at the "ceiling." If the price hits our Stop Loss, we lose a little. If it hits our Take Profit, we win big. That is how professional trading is done.
🚀 Want more high-accuracy setups like this?
I track the charts so you don't have to. Hit that [FOLLOW] button now and turn on notifications to never miss an entry.
Drop a "READY" in the comments if you’re riding this move with me! 👇
#BİNANCESQUARE #TradingSignals #ShortSqueeze #TechnicalAnalysis #TradingTips
📉 $BZ The "Bear Trap" is Set. Are You Ready?
While the crowd is chasing the pump, the smart money is looking at the overhead resistance. We just witnessed a massive rejection, and the momentum is shifting back to the bears. If you missed the initial drop, this is your second chance.
🔍 The Strategy:
Why This Works
The chart shows a classic rejection from the dynamic resistance zone (the grey cloud).
The Trend: We saw a violent sell-off followed by a weak "dead cat" bounce.
The Signal: The price has just hit the bottom of the resistance ribbon and failed to break through.
The Result: A high-probability short opportunity as the price prepares to hunt the previous lows.
🎯 The Trade Setup
Entry Zone: $88.50 - $88.60 (Current Market Price)
Stop Loss (SL): $89.59 (Protect your capital—if it breaks this, the setup is void)
Take Profit (TP): $84.50 (Potential for massive RR)
Risk/Reward Ratio: Approximately 1:4 (Risk 1 unit to make 4).
💡 Pro Tip for Beginners
Don't FOMO. The market rewards the patient. We are entering at the "ceiling." If the price hits our Stop Loss, we lose a little. If it hits our Take Profit, we win big. That is how professional trading is done.
🚀 Want more high-accuracy setups like this?
I track the charts so you don't have to. Hit that [FOLLOW] button now and turn on notifications to never miss an entry.
Drop a "READY" in the comments if you’re riding this move with me! 👇
#BİNANCESQUARE #TradingSignals #ShortSqueeze #TechnicalAnalysis #TradingTips
While the crowd is chasing the pump, the smart money is looking at the overhead resistance. We just witnessed a massive rejection, and the momentum is shifting back to the bears. If you missed the initial drop, this is your second chance.
🔍 The Strategy:
Why This Works
The chart shows a classic rejection from the dynamic resistance zone (the grey cloud).
The Trend: We saw a violent sell-off followed by a weak "dead cat" bounce.
The Signal: The price has just hit the bottom of the resistance ribbon and failed to break through.
The Result: A high-probability short opportunity as the price prepares to hunt the previous lows.
🎯 The Trade Setup
Entry Zone: $88.50 - $88.60 (Current Market Price)
Stop Loss (SL): $89.59 (Protect your capital—if it breaks this, the setup is void)
Take Profit (TP): $84.50 (Potential for massive RR)
Risk/Reward Ratio: Approximately 1:4 (Risk 1 unit to make 4).
💡 Pro Tip for Beginners
Don't FOMO. The market rewards the patient. We are entering at the "ceiling." If the price hits our Stop Loss, we lose a little. If it hits our Take Profit, we win big. That is how professional trading is done.
🚀 Want more high-accuracy setups like this?
I track the charts so you don't have to. Hit that [FOLLOW] button now and turn on notifications to never miss an entry.
Drop a "READY" in the comments if you’re riding this move with me! 👇
#BİNANCESQUARE #TradingSignals #ShortSqueeze #TechnicalAnalysis #TradingTips
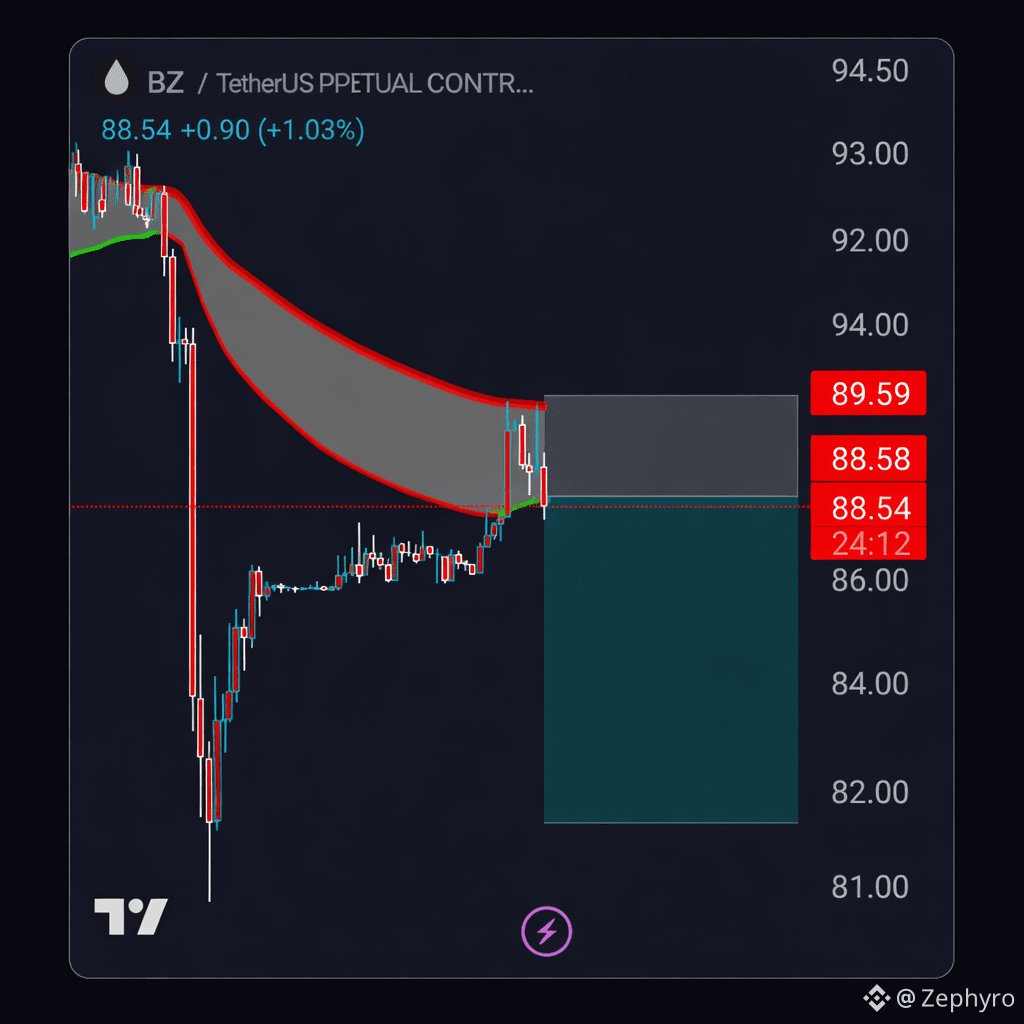
221
·
--
Privacy is a human right. Bitcoin is the tool. ⚡
The connection between the original Cypherpunks and modern finance is underrated. Without the foresight of people like Hal Finney, we wouldn’t have the decentralized world we’re living in today.
$BTC isn't just "digital gold"—it’s a defense mechanism against a surveillance-heavy world.
Are we losing sight of the "Punk" in Cypherpunk? Let’s discuss below. 👇
#crypto #FinancialFreedom #halfinney #blockchain
Privacy is a human right. Bitcoin is the tool. ⚡
The connection between the original Cypherpunks and modern finance is underrated. Without the foresight of people like Hal Finney, we wouldn’t have the decentralized world we’re living in today.
$BTC isn't just "digital gold"—it’s a defense mechanism against a surveillance-heavy world.
Are we losing sight of the "Punk" in Cypherpunk? Let’s discuss below. 👇
#crypto #FinancialFreedom #halfinney #blockchain
The connection between the original Cypherpunks and modern finance is underrated. Without the foresight of people like Hal Finney, we wouldn’t have the decentralized world we’re living in today.
$BTC isn't just "digital gold"—it’s a defense mechanism against a surveillance-heavy world.
Are we losing sight of the "Punk" in Cypherpunk? Let’s discuss below. 👇
#crypto #FinancialFreedom #halfinney #blockchain
148
·
--
Bullish
$ETH
I've always believed 'the use' of these POS networks is 'the tell'. If they are being used (because the price people have to pay for its use is reasonable) that will show in the data & the trend. If trend is growing, it will be reflected in price. Trend looks uppy, for now.
$ETH
I've always believed 'the use' of these POS networks is 'the tell'. If they are being used (because the price people have to pay for its use is reasonable) that will show in the data & the trend. If trend is growing, it will be reflected in price. Trend looks uppy, for now.
I've always believed 'the use' of these POS networks is 'the tell'. If they are being used (because the price people have to pay for its use is reasonable) that will show in the data & the trend. If trend is growing, it will be reflected in price. Trend looks uppy, for now.
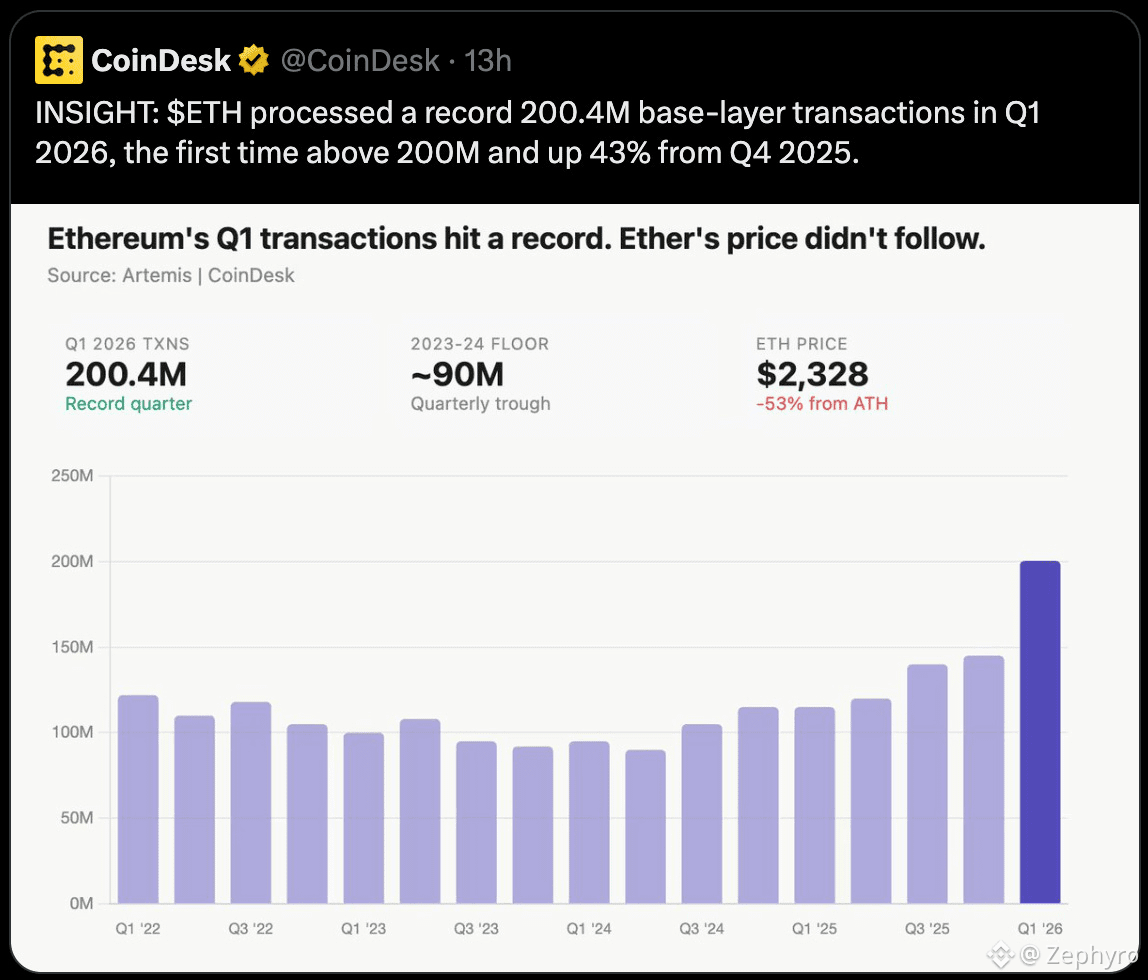
2
152
Log in to explore more content
Join global crypto users on Binance Square
⚡️ Get latest and useful information about crypto.
💬 Trusted by the world’s largest crypto exchange.
👍 Discover real insights from verified creators.
Email / Phone number
Trending Topics
BitcoinClears$85200
10,967 views
207 Discussing
We got the move, and $BTC is standing exactly where we were before the data. That’s what actual patience for a trade looks like.
The data came in mixed but with some important numbers. ADP Non-Farm Employment Change came at 90K vs 73K forecast, while Core PCE came in at 0.2% vs 0.3% expected. Final GDP was also stronger at 2.2% vs 1.5% forecast, while Personal Spending came in at 0.9% vs 0.8% expected. At the same time, Personal Income missed at 0.2% vs 0.5% forecast.
BTC initially surged to $85,600 and is now back where it needs to be. I’m still looking toward the lower ranges at $82,759 and the $80,000 liquidity, because the overhead liquidity is done and dusted.
We had a live session during the data, and during that session we saw the market at $83,800, then $85,600, and then back toward $83,000 and we still didn’t enter a trade.
That’s what patience is.
We can’t force an entry when the market has no clear direction. The same range is still in focus, and we’ll wait for the market to give us the setup.
Let me know, guys, how was the session? And should we have more regular sessions with our respected members so we can have proper discussions regarding the market?
#BitcoinClears$85200 #AltcoinSeasonIndexHoldsAbove60For5Days #USADPAdds90000JobsInSeptember #BitcoinSlipsBelow$84000 #SECToClarifyOnChainFundraisingRules
Crypto_LUX
·25 Likes
·18k views
AltcoinSeasonIndexHoldsAbove60For5Days
54,981 views
1,146 Discussing
USADPAdds90000JobsInSeptember
25,865 views
645 Discussing