
Finance with Zaib
161 Posts

Finance with Zaib
Report
Block User
Forex | Crypto | Trading Education
Open Trade
Frequent Trader
2.2 Years
17 Following
541 Followers
935 Liked
Posts
Portfolio
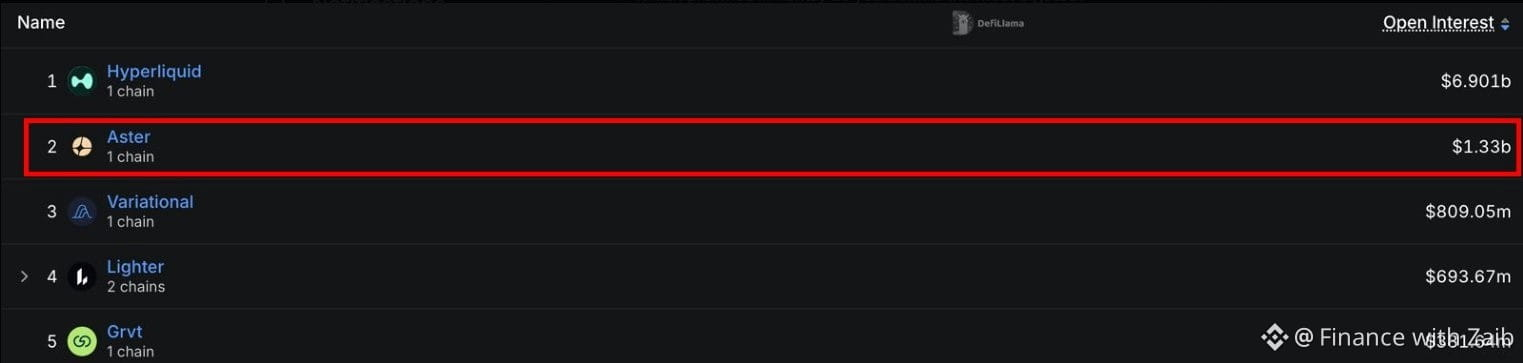
🚀 ASTER RANKS SECOND AMONG PERP DEX PLATFORMS BY OPEN INTEREST!
Aster is making waves in the derivatives market, currently holding the #2 spot with approximately $1.33 billion in open interest, according to the DeFiLlama data shown.
📊 PERP DEX RANKINGS:
🥇 Hyperliquid ( $HYPE ): $6.90B
🥈 Aster ( $ASTER ): $1.33B
🥉 Variational: $809.05M
4️⃣ Lighter: $693.67M
5️⃣ GRVT: $381.64M
Hyperliquid is still leading by a significant margin, but Aster has managed to secure a strong second position, leaving the other platforms behind.
What's particularly interesting is that Aster is maintaining this position despite challenging market conditions.
👀 The big question: Is Aster building lasting momentum in the perp DEX space, or is this just a temporary surge?
What do you think about $ASTER ?
#ASTER #Hyperliquid #DeFi #PerpDEX #BinanceSquare
{spot}(HYPEUSDT)
{spot}(ASTERUSDT)
🚀 ASTER RANKS SECOND AMONG PERP DEX PLATFORMS BY OPEN INTEREST!
Aster is making waves in the derivatives market, currently holding the #2 spot with approximately $1.33 billion in open interest, according to the DeFiLlama data shown.
📊 PERP DEX RANKINGS:
🥇 Hyperliquid ( $HYPE ): $6.90B
🥈 Aster ( $ASTER ): $1.33B
🥉 Variational: $809.05M
4️⃣ Lighter: $693.67M
5️⃣ GRVT: $381.64M
Hyperliquid is still leading by a significant margin, but Aster has managed to secure a strong second position, leaving the other platforms behind.
What's particularly interesting is that Aster is maintaining this position despite challenging market conditions.
👀 The big question: Is Aster building lasting momentum in the perp DEX space, or is this just a temporary surge?
What do you think about $ASTER ?
#ASTER #Hyperliquid #DeFi #PerpDEX #BinanceSquare
Aster is making waves in the derivatives market, currently holding the #2 spot with approximately $1.33 billion in open interest, according to the DeFiLlama data shown.
📊 PERP DEX RANKINGS:
🥇 Hyperliquid ( $HYPE ): $6.90B
🥈 Aster ( $ASTER ): $1.33B
🥉 Variational: $809.05M
4️⃣ Lighter: $693.67M
5️⃣ GRVT: $381.64M
Hyperliquid is still leading by a significant margin, but Aster has managed to secure a strong second position, leaving the other platforms behind.
What's particularly interesting is that Aster is maintaining this position despite challenging market conditions.
👀 The big question: Is Aster building lasting momentum in the perp DEX space, or is this just a temporary surge?
What do you think about $ASTER ?
#ASTER #Hyperliquid #DeFi #PerpDEX #BinanceSquare
226
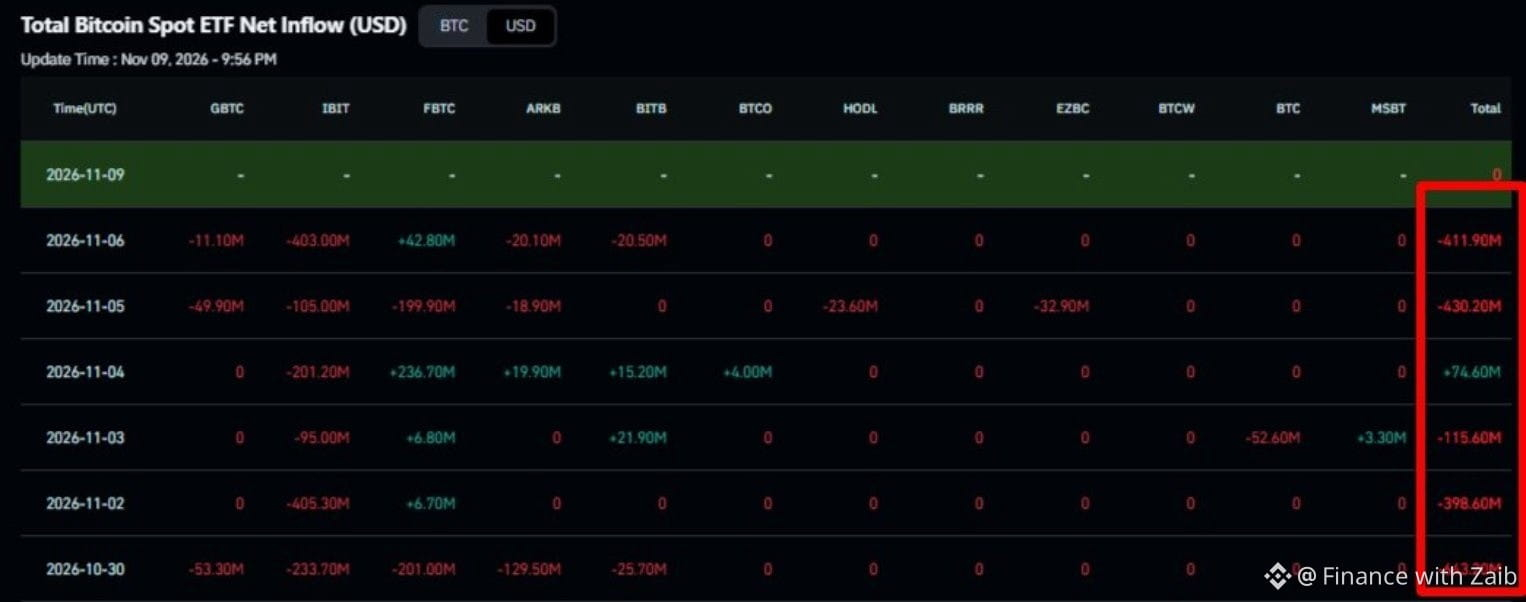
🚨 BITCOIN ETF OUTFLOWS HIT $1.92 BILLION IN JUST 6 TRADING DAYS!
Bitcoin spot ETFs have seen approximately $1.92 billion in net outflows over the past six trading sessions.
But here's where things get interesting…
Despite the heavy ETF selling, buyers in the spot market appear to be stepping in around key support levels and absorbing some of that selling pressure.
📊 Two very different trends are playing out:
🔴 Spot ETFs are experiencing significant outflows.
🟢 Meanwhile, spot buyers are showing interest at lower price levels.
This raises an important question: Are investors losing confidence, or are other market participants quietly accumulating BTC?
One side could be getting the market direction wrong.
👀 What's your strategy right now?
Are you buying the dip, taking profits, or waiting for a clearer signal?
#Bitcoin #BTC #BitcoinETF #CryptoNews #BinanceSquare
⚠️ DYOR | NFA | $BTC
{spot}(BTCUSDT)
🚨 BITCOIN ETF OUTFLOWS HIT $1.92 BILLION IN JUST 6 TRADING DAYS!
Bitcoin spot ETFs have seen approximately $1.92 billion in net outflows over the past six trading sessions.
But here's where things get interesting…
Despite the heavy ETF selling, buyers in the spot market appear to be stepping in around key support levels and absorbing some of that selling pressure.
📊 Two very different trends are playing out:
🔴 Spot ETFs are experiencing significant outflows.
🟢 Meanwhile, spot buyers are showing interest at lower price levels.
This raises an important question: Are investors losing confidence, or are other market participants quietly accumulating BTC?
One side could be getting the market direction wrong.
👀 What's your strategy right now?
Are you buying the dip, taking profits, or waiting for a clearer signal?
#Bitcoin #BTC #BitcoinETF #CryptoNews #BinanceSquare
⚠️ DYOR | NFA | $BTC
Bitcoin spot ETFs have seen approximately $1.92 billion in net outflows over the past six trading sessions.
But here's where things get interesting…
Despite the heavy ETF selling, buyers in the spot market appear to be stepping in around key support levels and absorbing some of that selling pressure.
📊 Two very different trends are playing out:
🔴 Spot ETFs are experiencing significant outflows.
🟢 Meanwhile, spot buyers are showing interest at lower price levels.
This raises an important question: Are investors losing confidence, or are other market participants quietly accumulating BTC?
One side could be getting the market direction wrong.
👀 What's your strategy right now?
Are you buying the dip, taking profits, or waiting for a clearer signal?
#Bitcoin #BTC #BitcoinETF #CryptoNews #BinanceSquare
⚠️ DYOR | NFA | $BTC
84
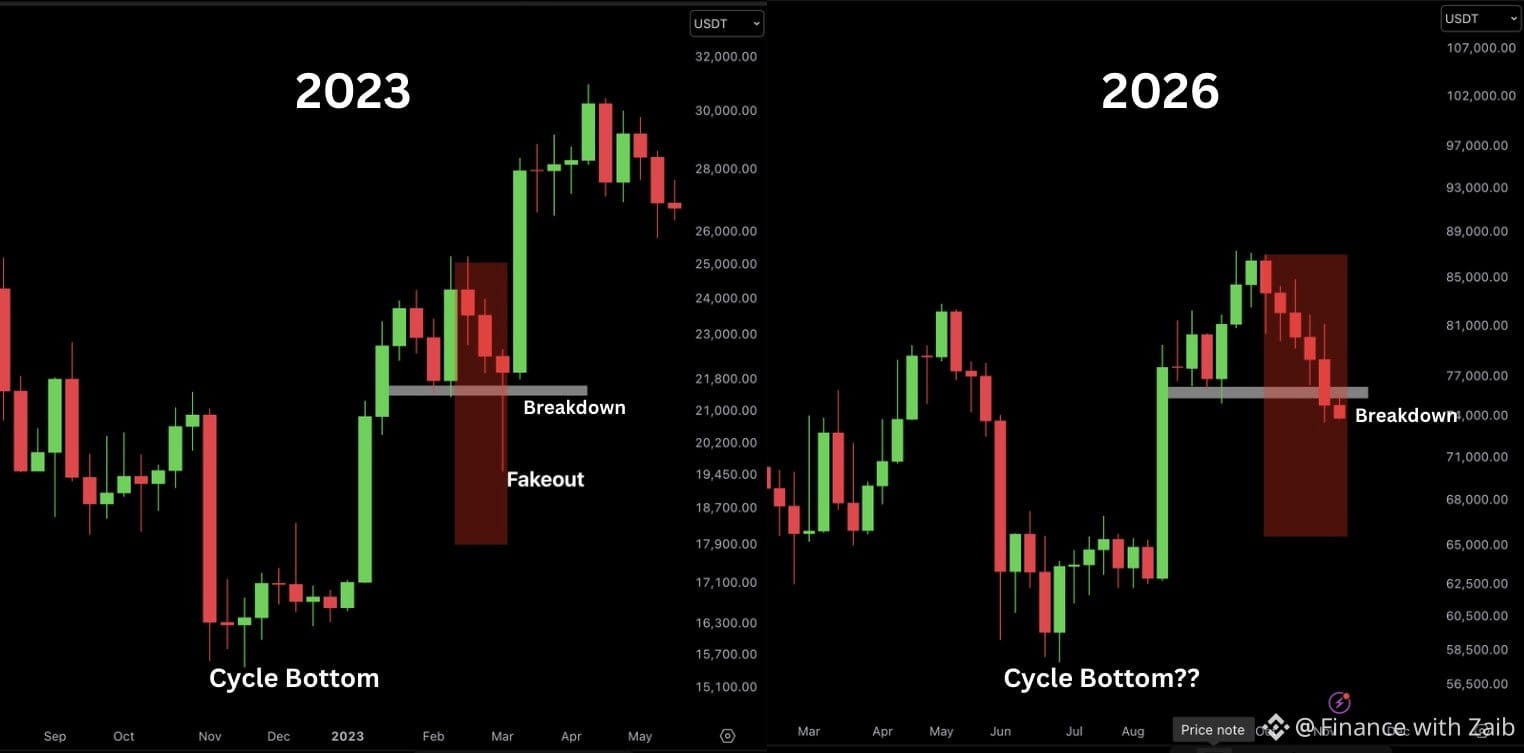
👀 IS BITCOIN FOLLOWING THE SAME PATTERN WE SAW IN 2023?
Something interesting is happening on the $BTC chart.
When we look back at 2023, Bitcoin went through a similar phase before making another strong move to new highs.
Here's how that pattern played out:
1️⃣ Cycle Bottom: $BTC found its bottom and started a powerful recovery.
2️⃣ Consolidation: Price moved sideways for several months, building momentum.
3️⃣ Fake Breakdown: Bitcoin briefly dropped below an important support level, trapping bearish traders before recovering.
4️⃣ New Highs: After reclaiming support, BTC continued its rally and pushed towards new highs.
📊 WHERE ARE WE NOW?
The current chart appears to be showing a similar setup. Bitcoin has already experienced a strong recovery and consolidation, and now it's testing an important support zone.
Could this be another fakeout before the next major rally?
Of course, history doesn't always repeat itself, and the pattern is not guaranteed to play out the same way.
But it's definitely worth keeping an eye on.
💬 What's your view?
Are we watching another 2023-style shakeout before BTC makes its next move higher, or is this time different?
#Bitcoin #BTC #BitcoinAnalysis #CryptoTrading #BinanceSquare
{spot}(BTCUSDT)
👀 IS BITCOIN FOLLOWING THE SAME PATTERN WE SAW IN 2023?
Something interesting is happening on the $BTC chart.
When we look back at 2023, Bitcoin went through a similar phase before making another strong move to new highs.
Here's how that pattern played out:
1️⃣ Cycle Bottom: $BTC found its bottom and started a powerful recovery.
2️⃣ Consolidation: Price moved sideways for several months, building momentum.
3️⃣ Fake Breakdown: Bitcoin briefly dropped below an important support level, trapping bearish traders before recovering.
4️⃣ New Highs: After reclaiming support, BTC continued its rally and pushed towards new highs.
📊 WHERE ARE WE NOW?
The current chart appears to be showing a similar setup. Bitcoin has already experienced a strong recovery and consolidation, and now it's testing an important support zone.
Could this be another fakeout before the next major rally?
Of course, history doesn't always repeat itself, and the pattern is not guaranteed to play out the same way.
But it's definitely worth keeping an eye on.
💬 What's your view?
Are we watching another 2023-style shakeout before BTC makes its next move higher, or is this time different?
#Bitcoin #BTC #BitcoinAnalysis #CryptoTrading #BinanceSquare
Something interesting is happening on the $BTC chart.
When we look back at 2023, Bitcoin went through a similar phase before making another strong move to new highs.
Here's how that pattern played out:
1️⃣ Cycle Bottom: $BTC found its bottom and started a powerful recovery.
2️⃣ Consolidation: Price moved sideways for several months, building momentum.
3️⃣ Fake Breakdown: Bitcoin briefly dropped below an important support level, trapping bearish traders before recovering.
4️⃣ New Highs: After reclaiming support, BTC continued its rally and pushed towards new highs.
📊 WHERE ARE WE NOW?
The current chart appears to be showing a similar setup. Bitcoin has already experienced a strong recovery and consolidation, and now it's testing an important support zone.
Could this be another fakeout before the next major rally?
Of course, history doesn't always repeat itself, and the pattern is not guaranteed to play out the same way.
But it's definitely worth keeping an eye on.
💬 What's your view?
Are we watching another 2023-style shakeout before BTC makes its next move higher, or is this time different?
#Bitcoin #BTC #BitcoinAnalysis #CryptoTrading #BinanceSquare
105
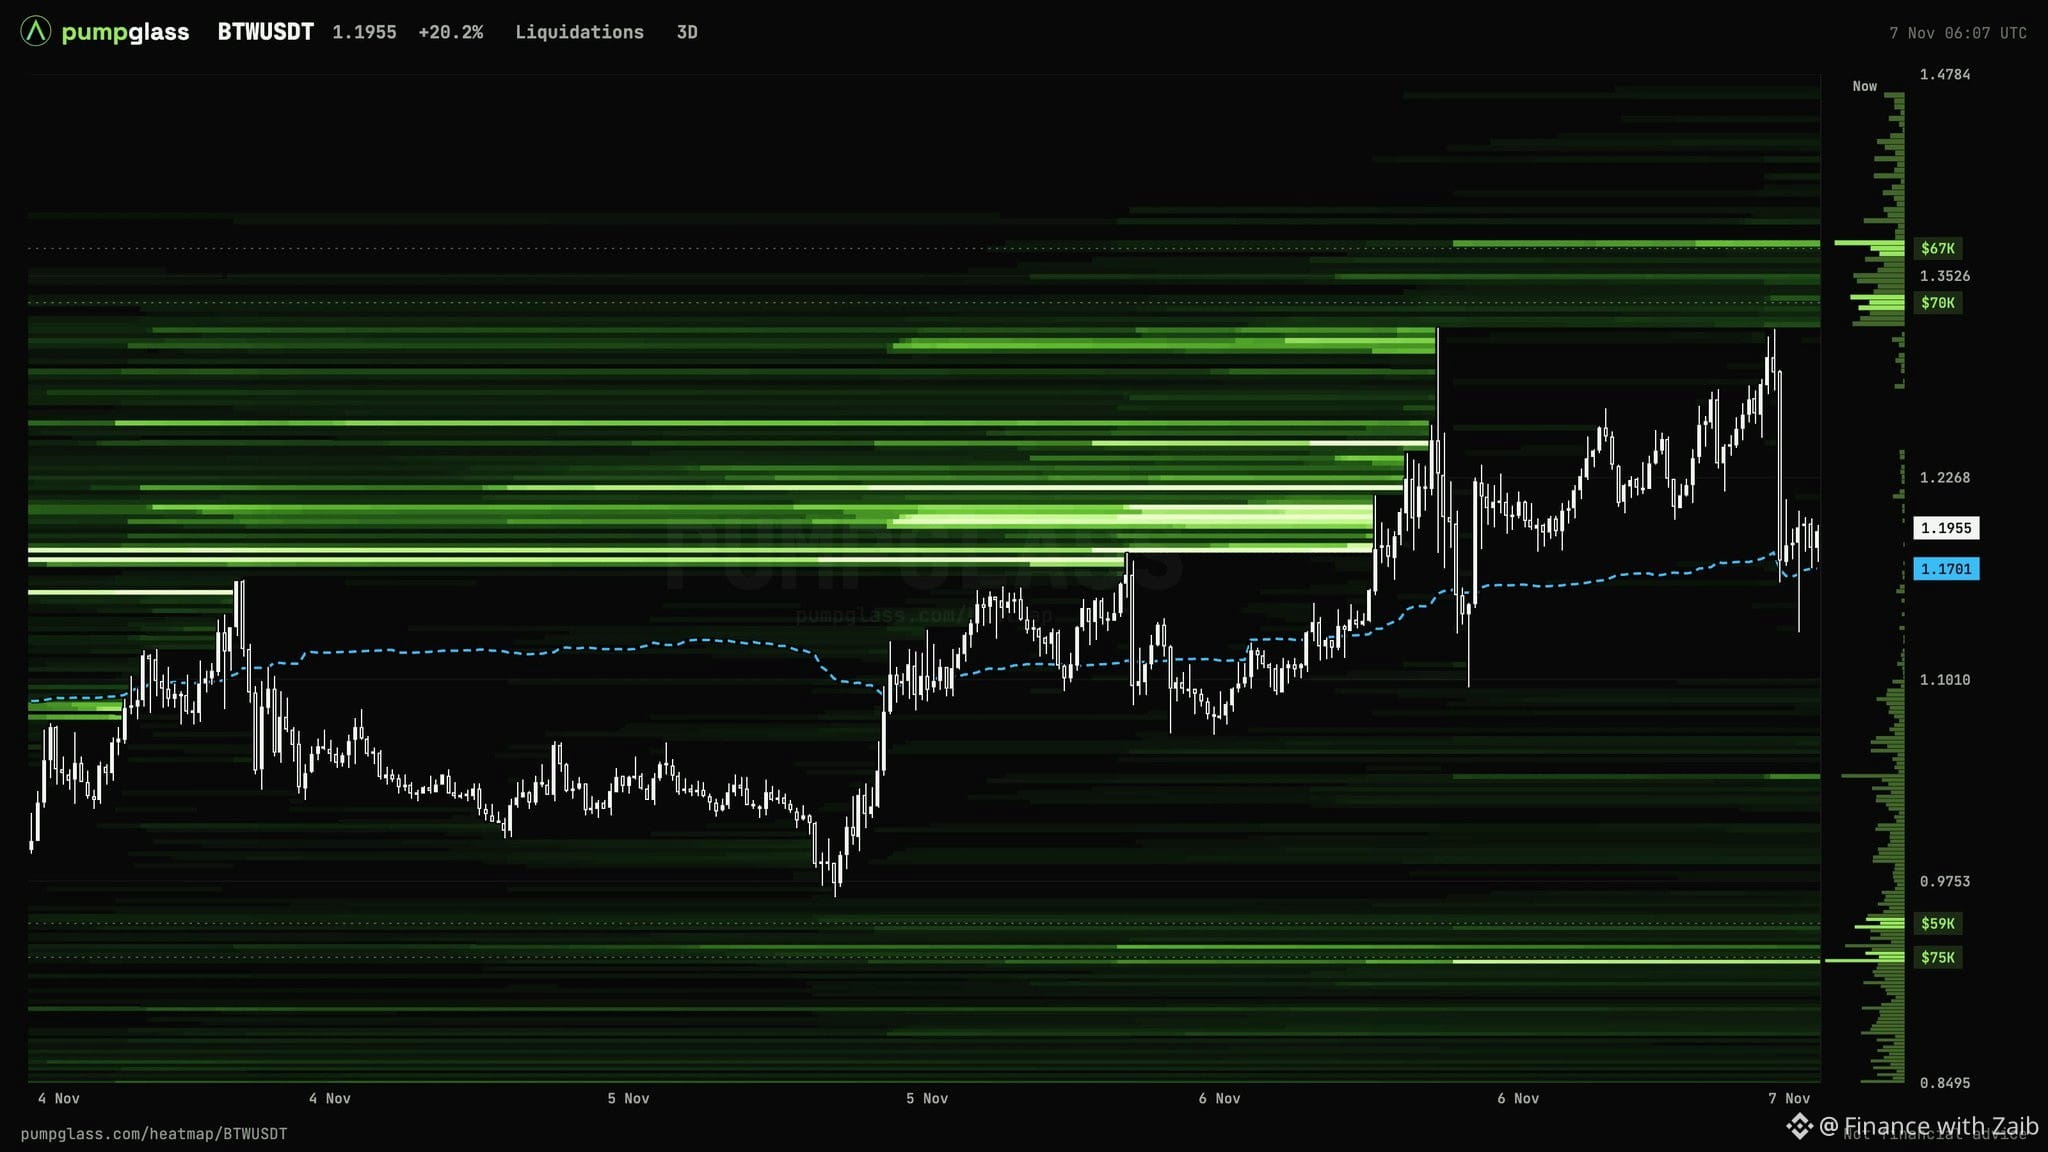
🐋 $BTW: WHALES ARE LOADING UP, BUT THERE'S A CATCH!
$BTW made a strong move after breaking through the $1.08–$1.09 resistance zone, triggering short liquidations all the way up to $1.32.
That's an impressive 52% gain from Tuesday's low of $0.87.
However, the price has now pulled back to around $1.19.
Here's where things get interesting:
📊 The number of large long-position holders increased from 80 to 105 as the price rallied.
📈 Their average entry price also moved higher, from $1.09 to $1.17.
⚠️ With BTW trading around $1.19, price is now only about 2% above their average entry.
This puts these large long positions relatively close to breakeven, making the current price area worth watching.
👀 The big question: Will buyers defend this level and push BTW higher, or could another wave of selling put pressure on these long positions?
What's your take?
#BTW #CryptoWhales #Altcoins #CryptoMarket #BinanceSquare
DYOR | NFA
{future}(BTWUSDT)
🐋 $BTW : WHALES ARE LOADING UP, BUT THERE'S A CATCH!
$BTW made a strong move after breaking through the $1.08–$1.09 resistance zone, triggering short liquidations all the way up to $1.32.
That's an impressive 52% gain from Tuesday's low of $0.87.
However, the price has now pulled back to around $1.19.
Here's where things get interesting:
📊 The number of large long-position holders increased from 80 to 105 as the price rallied.
📈 Their average entry price also moved higher, from $1.09 to $1.17.
⚠️ With BTW trading around $1.19, price is now only about 2% above their average entry.
This puts these large long positions relatively close to breakeven, making the current price area worth watching.
👀 The big question: Will buyers defend this level and push BTW higher, or could another wave of selling put pressure on these long positions?
What's your take?
#BTW #CryptoWhales #Altcoins #CryptoMarket #BinanceSquare
DYOR | NFA
$BTW made a strong move after breaking through the $1.08–$1.09 resistance zone, triggering short liquidations all the way up to $1.32.
That's an impressive 52% gain from Tuesday's low of $0.87.
However, the price has now pulled back to around $1.19.
Here's where things get interesting:
📊 The number of large long-position holders increased from 80 to 105 as the price rallied.
📈 Their average entry price also moved higher, from $1.09 to $1.17.
⚠️ With BTW trading around $1.19, price is now only about 2% above their average entry.
This puts these large long positions relatively close to breakeven, making the current price area worth watching.
👀 The big question: Will buyers defend this level and push BTW higher, or could another wave of selling put pressure on these long positions?
What's your take?
#BTW #CryptoWhales #Altcoins #CryptoMarket #BinanceSquare
DYOR | NFA
358
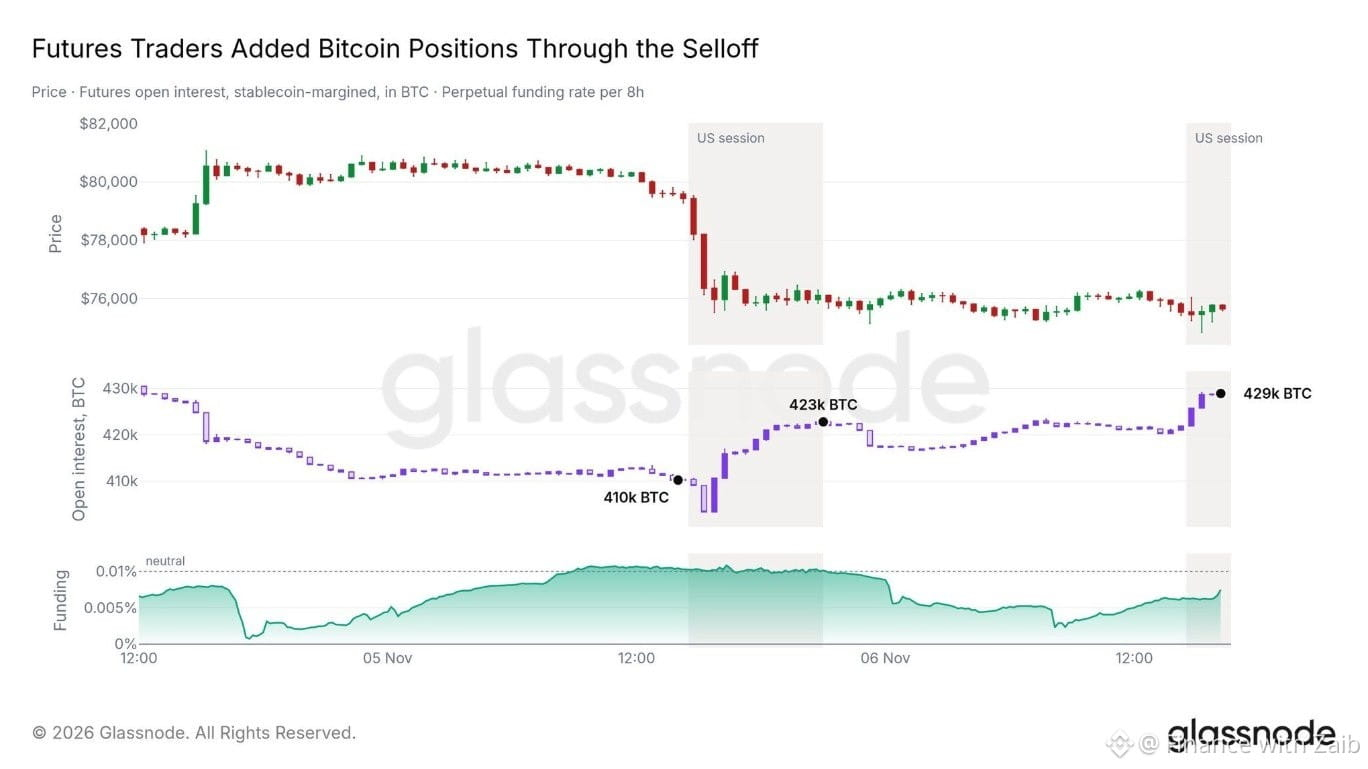
🚨 BITCOIN OPEN INTEREST JUMPS BY $1.5 BILLION DURING THE SELLOFF!
According to Glassnode, $BTC open interest increased by approximately $1.5 billion even as Bitcoin prices continued to fall.
This suggests traders were opening new leveraged positions instead of stepping aside during the decline.
But what does this mean for the market?
📈 It could indicate that some traders are confident in a potential rebound and are positioning themselves for a recovery.
📉 On the other hand, rising leverage during a selloff can create a crowded market, increasing the risk of sudden liquidations if prices move against traders.
👀 The big question: Are traders positioning for a Bitcoin recovery, or is another major liquidation wave building up?
What do you think?
#Bitcoin #OpenInterest #CryptoTrading #Glassnode #BinanceSquare
⚠️ DYOR | NFA
{spot}(BTCUSDT)
🚨 BITCOIN OPEN INTEREST JUMPS BY $1.5 BILLION DURING THE SELLOFF!
According to Glassnode, $BTC open interest increased by approximately $1.5 billion even as Bitcoin prices continued to fall.
This suggests traders were opening new leveraged positions instead of stepping aside during the decline.
But what does this mean for the market?
📈 It could indicate that some traders are confident in a potential rebound and are positioning themselves for a recovery.
📉 On the other hand, rising leverage during a selloff can create a crowded market, increasing the risk of sudden liquidations if prices move against traders.
👀 The big question: Are traders positioning for a Bitcoin recovery, or is another major liquidation wave building up?
What do you think?
#Bitcoin #OpenInterest #CryptoTrading #Glassnode #BinanceSquare
⚠️ DYOR | NFA
According to Glassnode, $BTC open interest increased by approximately $1.5 billion even as Bitcoin prices continued to fall.
This suggests traders were opening new leveraged positions instead of stepping aside during the decline.
But what does this mean for the market?
📈 It could indicate that some traders are confident in a potential rebound and are positioning themselves for a recovery.
📉 On the other hand, rising leverage during a selloff can create a crowded market, increasing the risk of sudden liquidations if prices move against traders.
👀 The big question: Are traders positioning for a Bitcoin recovery, or is another major liquidation wave building up?
What do you think?
#Bitcoin #OpenInterest #CryptoTrading #Glassnode #BinanceSquare
⚠️ DYOR | NFA
92
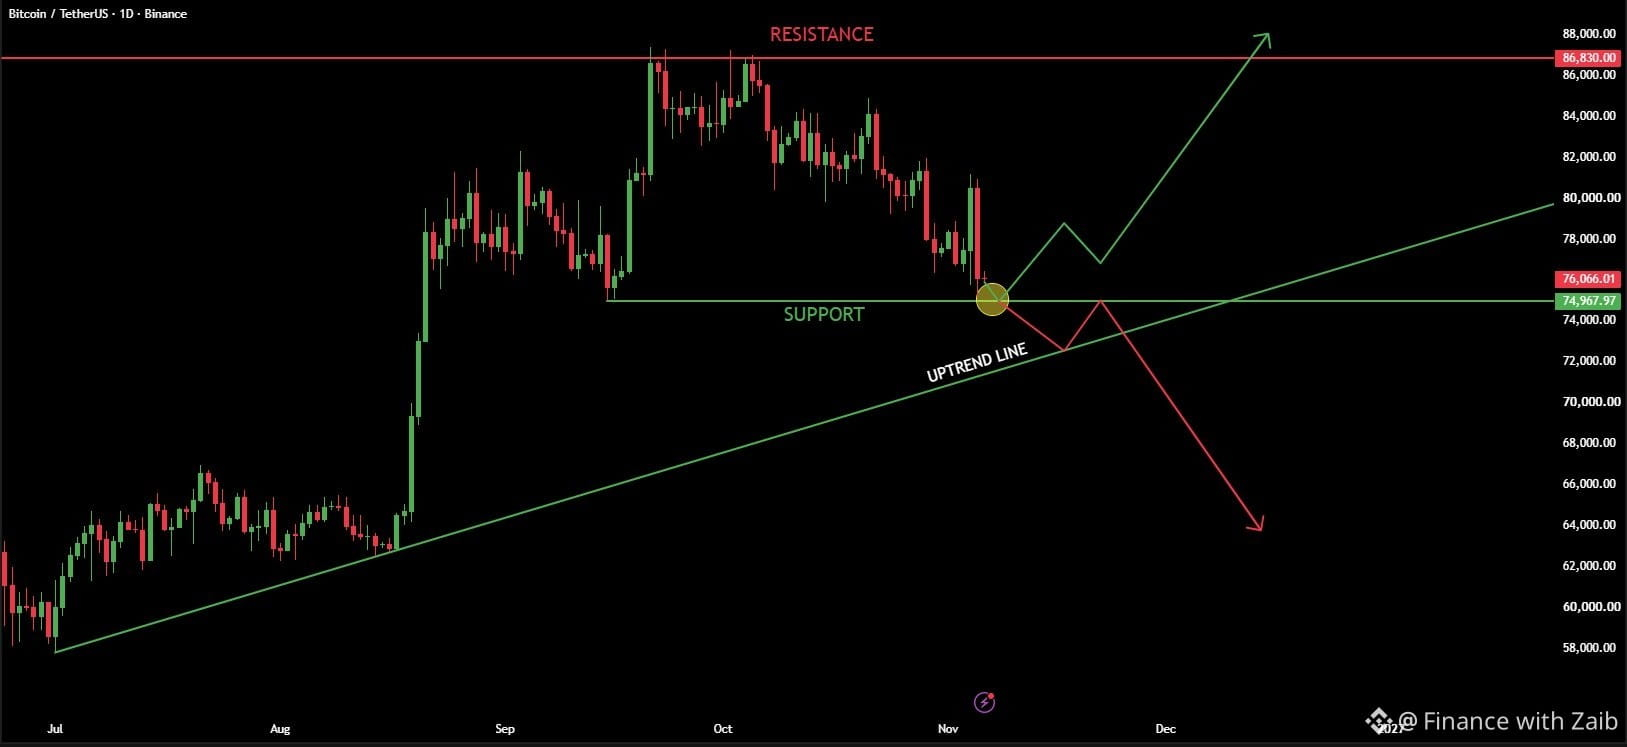
🚨 BITCOIN AT A CRITICAL SUPPORT ZONE!
$BTC is currently trading around $76,066, with price approaching an important support level near $74,967.
The next move could determine Bitcoin's short-term direction.
📈 BULLISH SCENARIO:
If buyers manage to defend the $74.9K support zone, BTC could bounce towards $79K.
A successful recovery and formation of a higher low could open the door for another move towards $86.8K, which is the next major resistance area.
📉 BEARISH SCENARIO:
If Bitcoin loses $74.9K, the next area to watch is the ascending trendline around $72.5K–$73.5K.
If that support also fails, BTC could face further downside towards $64K.
👀 MY TAKE:
The $74.9K level is extremely important for Bitcoin right now. I'd rather watch how price reacts around this zone than rush into a trade.
💬 What's your strategy?
Are you buying the bounce, or waiting for confirmation before entering?
#Bitcoin #CryptoMarket #BitcoinAnalysis #TechnicalAnalysis #BinanceSquare
⚠️ DYOR | NFA
{spot}(BTCUSDT)
🚨 BITCOIN AT A CRITICAL SUPPORT ZONE!
$BTC is currently trading around $76,066, with price approaching an important support level near $74,967.
The next move could determine Bitcoin's short-term direction.
📈 BULLISH SCENARIO:
If buyers manage to defend the $74.9K support zone, BTC could bounce towards $79K.
A successful recovery and formation of a higher low could open the door for another move towards $86.8K, which is the next major resistance area.
📉 BEARISH SCENARIO:
If Bitcoin loses $74.9K, the next area to watch is the ascending trendline around $72.5K–$73.5K.
If that support also fails, BTC could face further downside towards $64K.
👀 MY TAKE:
The $74.9K level is extremely important for Bitcoin right now. I'd rather watch how price reacts around this zone than rush into a trade.
💬 What's your strategy?
Are you buying the bounce, or waiting for confirmation before entering?
#Bitcoin #CryptoMarket #BitcoinAnalysis #TechnicalAnalysis #BinanceSquare
⚠️ DYOR | NFA
$BTC is currently trading around $76,066, with price approaching an important support level near $74,967.
The next move could determine Bitcoin's short-term direction.
📈 BULLISH SCENARIO:
If buyers manage to defend the $74.9K support zone, BTC could bounce towards $79K.
A successful recovery and formation of a higher low could open the door for another move towards $86.8K, which is the next major resistance area.
📉 BEARISH SCENARIO:
If Bitcoin loses $74.9K, the next area to watch is the ascending trendline around $72.5K–$73.5K.
If that support also fails, BTC could face further downside towards $64K.
👀 MY TAKE:
The $74.9K level is extremely important for Bitcoin right now. I'd rather watch how price reacts around this zone than rush into a trade.
💬 What's your strategy?
Are you buying the bounce, or waiting for confirmation before entering?
#Bitcoin #CryptoMarket #BitcoinAnalysis #TechnicalAnalysis #BinanceSquare
⚠️ DYOR | NFA
53
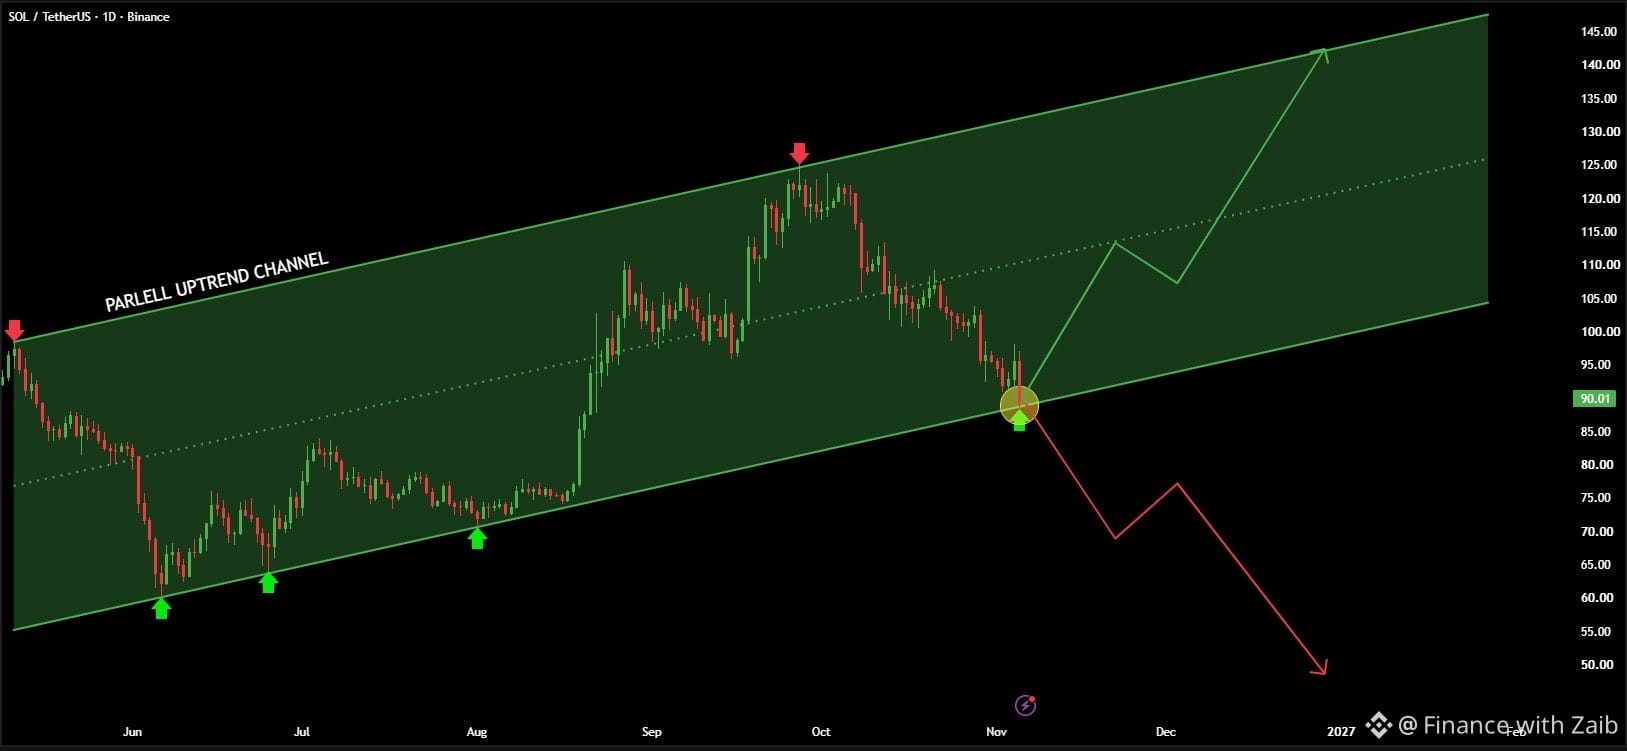
👀 $SOL AT A CRITICAL SUPPORT LEVEL!
Solana is testing the lower boundary of its ascending channel for the fourth time, with price currently around $90.01.
This is an important level that could determine its next major move.
📈 Bullish Scenario:
If SOL manages to hold above $90, the channel structure remains intact, with potential upside targets around $140–$145.
📉 Bearish Scenario:
If buyers fail to defend $90 and price breaks below the channel, the next major downside area could be around $50.
⚠️ Why this matters:
This is the fourth test of the same support zone. Another successful bounce could strengthen the bullish setup, but a breakdown could change the entire picture.
💬 What's your view?
Will SOL defend $90 and move towards $140, or are we heading towards $50?
#Solana #CryptoTrading #TechnicalAnalysis #Altcoins #BinanceSquare
DYOR | NFA
{spot}(SOLUSDT)
👀 $SOL AT A CRITICAL SUPPORT LEVEL!
Solana is testing the lower boundary of its ascending channel for the fourth time, with price currently around $90.01.
This is an important level that could determine its next major move.
📈 Bullish Scenario:
If SOL manages to hold above $90, the channel structure remains intact, with potential upside targets around $140–$145.
📉 Bearish Scenario:
If buyers fail to defend $90 and price breaks below the channel, the next major downside area could be around $50.
⚠️ Why this matters:
This is the fourth test of the same support zone. Another successful bounce could strengthen the bullish setup, but a breakdown could change the entire picture.
💬 What's your view?
Will SOL defend $90 and move towards $140, or are we heading towards $50?
#Solana #CryptoTrading #TechnicalAnalysis #Altcoins #BinanceSquare
DYOR | NFA
Solana is testing the lower boundary of its ascending channel for the fourth time, with price currently around $90.01.
This is an important level that could determine its next major move.
📈 Bullish Scenario:
If SOL manages to hold above $90, the channel structure remains intact, with potential upside targets around $140–$145.
📉 Bearish Scenario:
If buyers fail to defend $90 and price breaks below the channel, the next major downside area could be around $50.
⚠️ Why this matters:
This is the fourth test of the same support zone. Another successful bounce could strengthen the bullish setup, but a breakdown could change the entire picture.
💬 What's your view?
Will SOL defend $90 and move towards $140, or are we heading towards $50?
#Solana #CryptoTrading #TechnicalAnalysis #Altcoins #BinanceSquare
DYOR | NFA
163
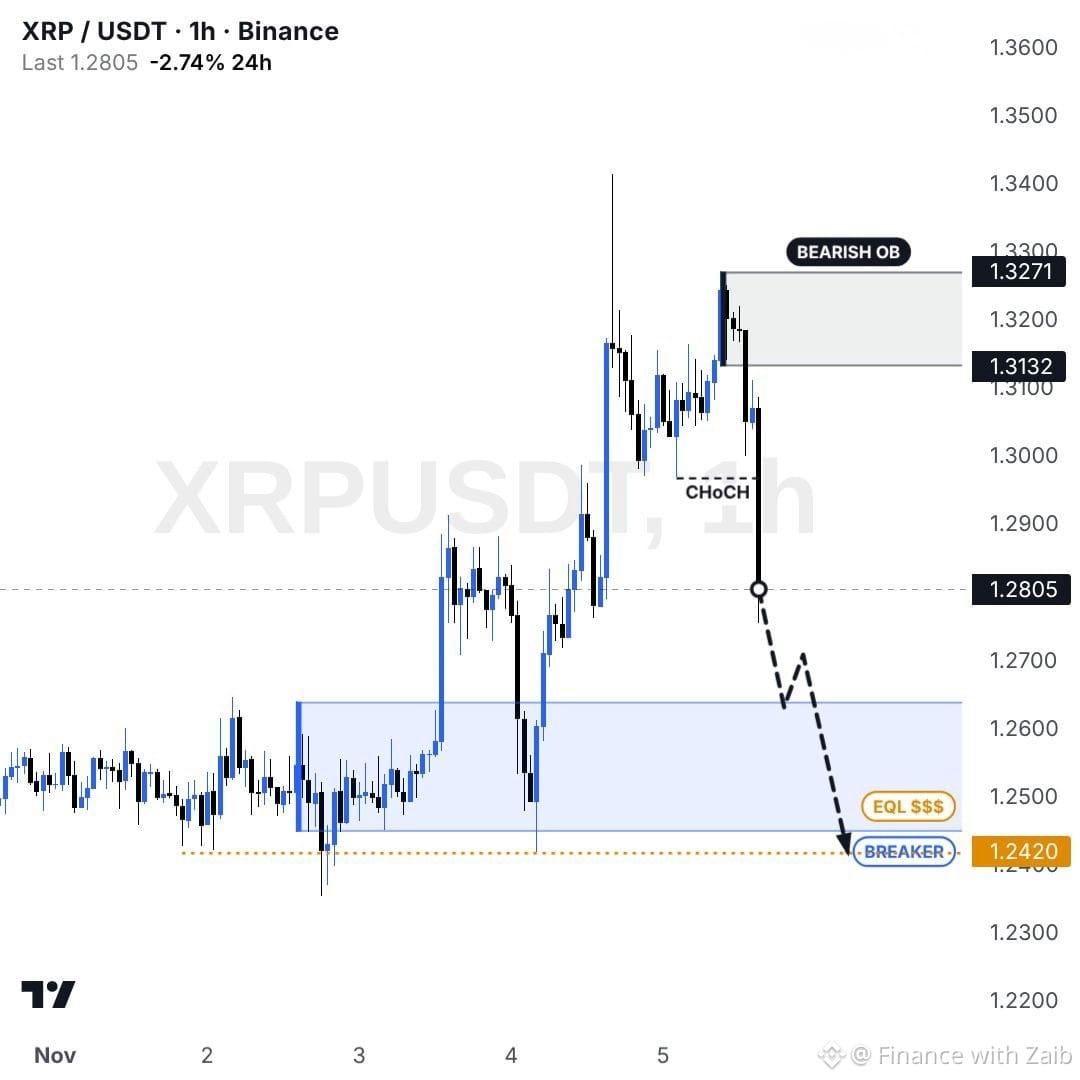
🔻 $XRP LOSES THE $1.30 SUPPORT LEVEL!
XRP is currently trading around $1.28, showing signs of continued weakness.
There's a potential selling zone between $1.31 and $1.33, where sellers could step back in.
📉 Bearish Scenario:
If XRP fails to reclaim the $1.31–$1.33 zone, the next downside target could be around $1.24.
📈 Bullish Invalidation:
A strong close above $1.33 would invalidate this bearish setup.
👀 My take: XRP is at an important level. I'll be watching how price reacts around resistance before considering any trade.
💬 Do you think XRP will drop towards $1.24 or reclaim $1.33?
#XRP #Ripple #TechnicalAnalysis #CryptoMarket #BinanceSquare
⚠️ DYOR | NFA
{spot}(XRPUSDT)
🔻 $XRP LOSES THE $1.30 SUPPORT LEVEL!
XRP is currently trading around $1.28, showing signs of continued weakness.
There's a potential selling zone between $1.31 and $1.33, where sellers could step back in.
📉 Bearish Scenario:
If XRP fails to reclaim the $1.31–$1.33 zone, the next downside target could be around $1.24.
📈 Bullish Invalidation:
A strong close above $1.33 would invalidate this bearish setup.
👀 My take: XRP is at an important level. I'll be watching how price reacts around resistance before considering any trade.
💬 Do you think XRP will drop towards $1.24 or reclaim $1.33?
#XRP #Ripple #TechnicalAnalysis #CryptoMarket #BinanceSquare
⚠️ DYOR | NFA
XRP is currently trading around $1.28, showing signs of continued weakness.
There's a potential selling zone between $1.31 and $1.33, where sellers could step back in.
📉 Bearish Scenario:
If XRP fails to reclaim the $1.31–$1.33 zone, the next downside target could be around $1.24.
📈 Bullish Invalidation:
A strong close above $1.33 would invalidate this bearish setup.
👀 My take: XRP is at an important level. I'll be watching how price reacts around resistance before considering any trade.
💬 Do you think XRP will drop towards $1.24 or reclaim $1.33?
#XRP #Ripple #TechnicalAnalysis #CryptoMarket #BinanceSquare
⚠️ DYOR | NFA
59
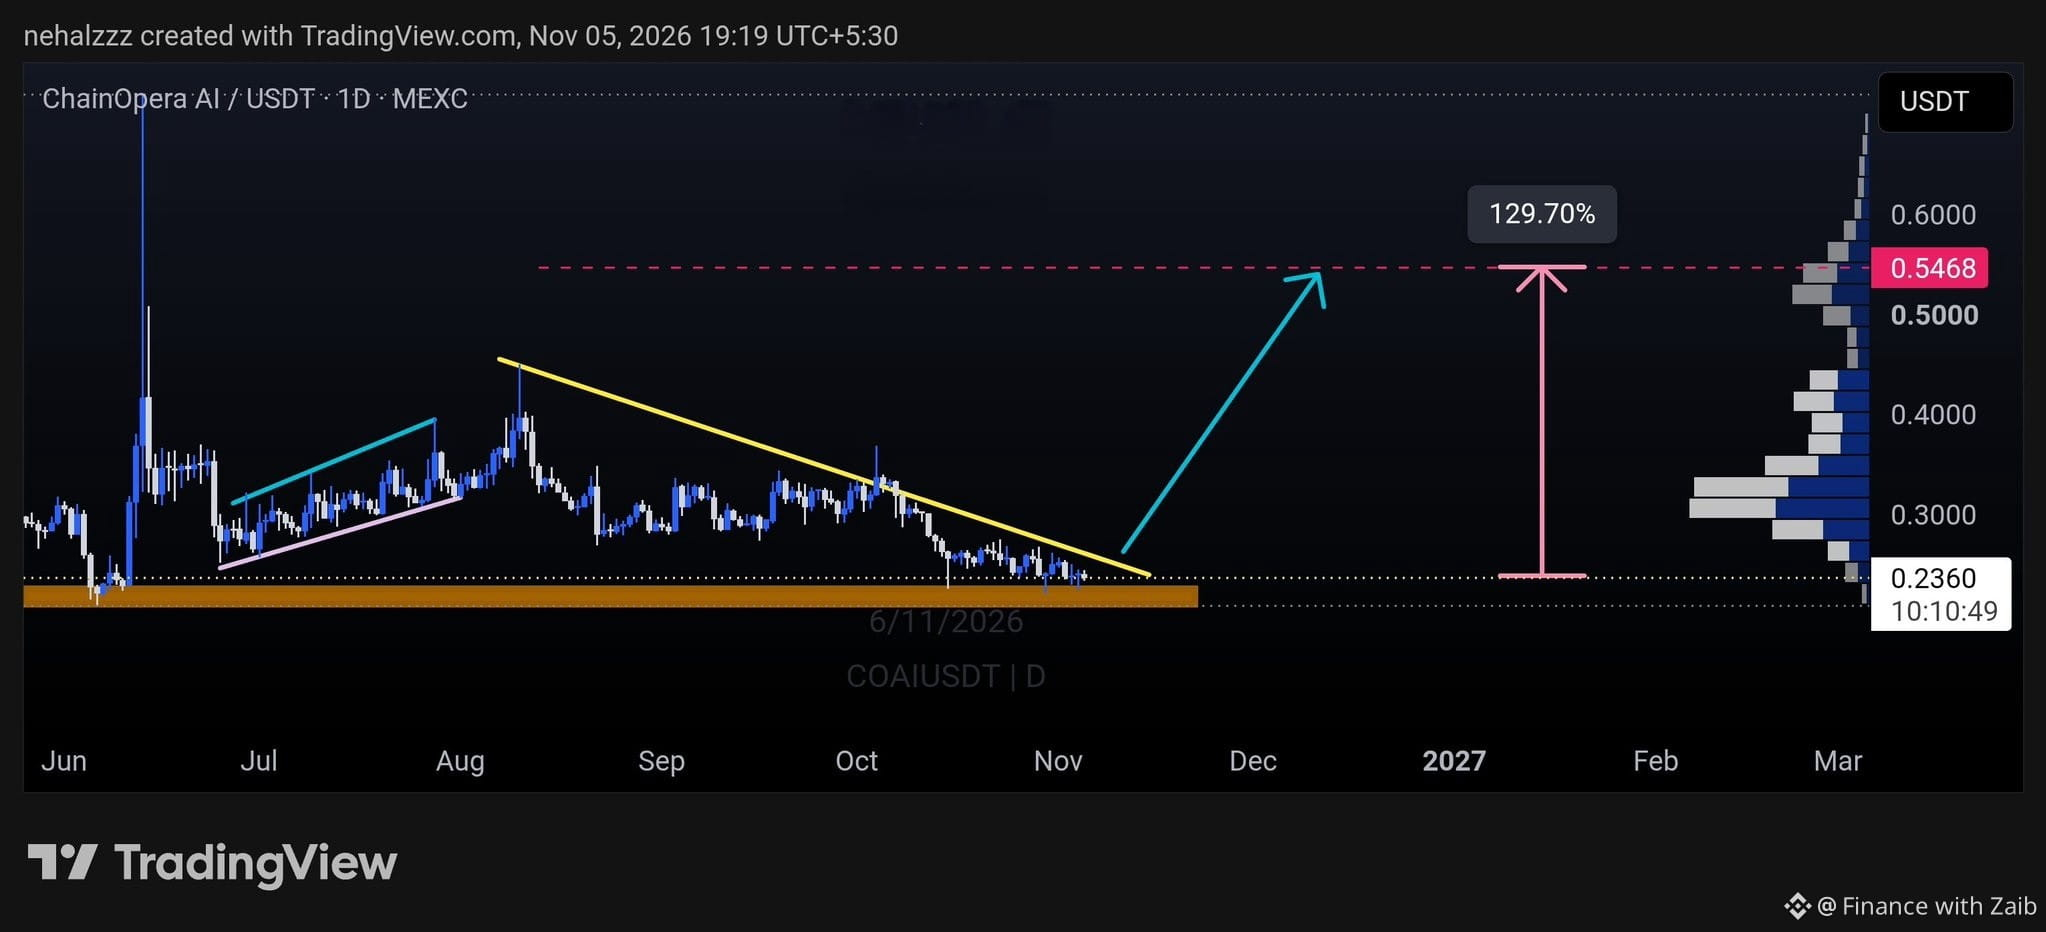
👀 $COAI IS APPROACHING AN INTERESTING ZONE!
COAI is currently holding above an important support area between $0.22 and $0.24, while price continues to consolidate below a descending resistance trendline.
A clean breakout above this trendline could open the door for a strong recovery.
🎯 Next major target: $0.5468
From the current reference price of $0.2360, that's a potential upside of approximately 129.7%.
For now, I'm keeping $COAI on my watchlist and waiting for a confirmed breakout before making any moves.
💬 Do you think COAI is preparing for a major rally?
#COAI #Altcoins #TechnicalAnalysis #CryptoTrading #BinanceSquare
⚠️ Potential upside is a technical scenario, not a guaranteed return. DYOR. NFA.
{future}(COAIUSDT)
👀 $COAI IS APPROACHING AN INTERESTING ZONE!
COAI is currently holding above an important support area between $0.22 and $0.24, while price continues to consolidate below a descending resistance trendline.
A clean breakout above this trendline could open the door for a strong recovery.
🎯 Next major target: $0.5468
From the current reference price of $0.2360, that's a potential upside of approximately 129.7%.
For now, I'm keeping $COAI on my watchlist and waiting for a confirmed breakout before making any moves.
💬 Do you think COAI is preparing for a major rally?
#COAI #Altcoins #TechnicalAnalysis #CryptoTrading #BinanceSquare
⚠️ Potential upside is a technical scenario, not a guaranteed return. DYOR. NFA.
COAI is currently holding above an important support area between $0.22 and $0.24, while price continues to consolidate below a descending resistance trendline.
A clean breakout above this trendline could open the door for a strong recovery.
🎯 Next major target: $0.5468
From the current reference price of $0.2360, that's a potential upside of approximately 129.7%.
For now, I'm keeping $COAI on my watchlist and waiting for a confirmed breakout before making any moves.
💬 Do you think COAI is preparing for a major rally?
#COAI #Altcoins #TechnicalAnalysis #CryptoTrading #BinanceSquare
⚠️ Potential upside is a technical scenario, not a guaranteed return. DYOR. NFA.
1
3
709
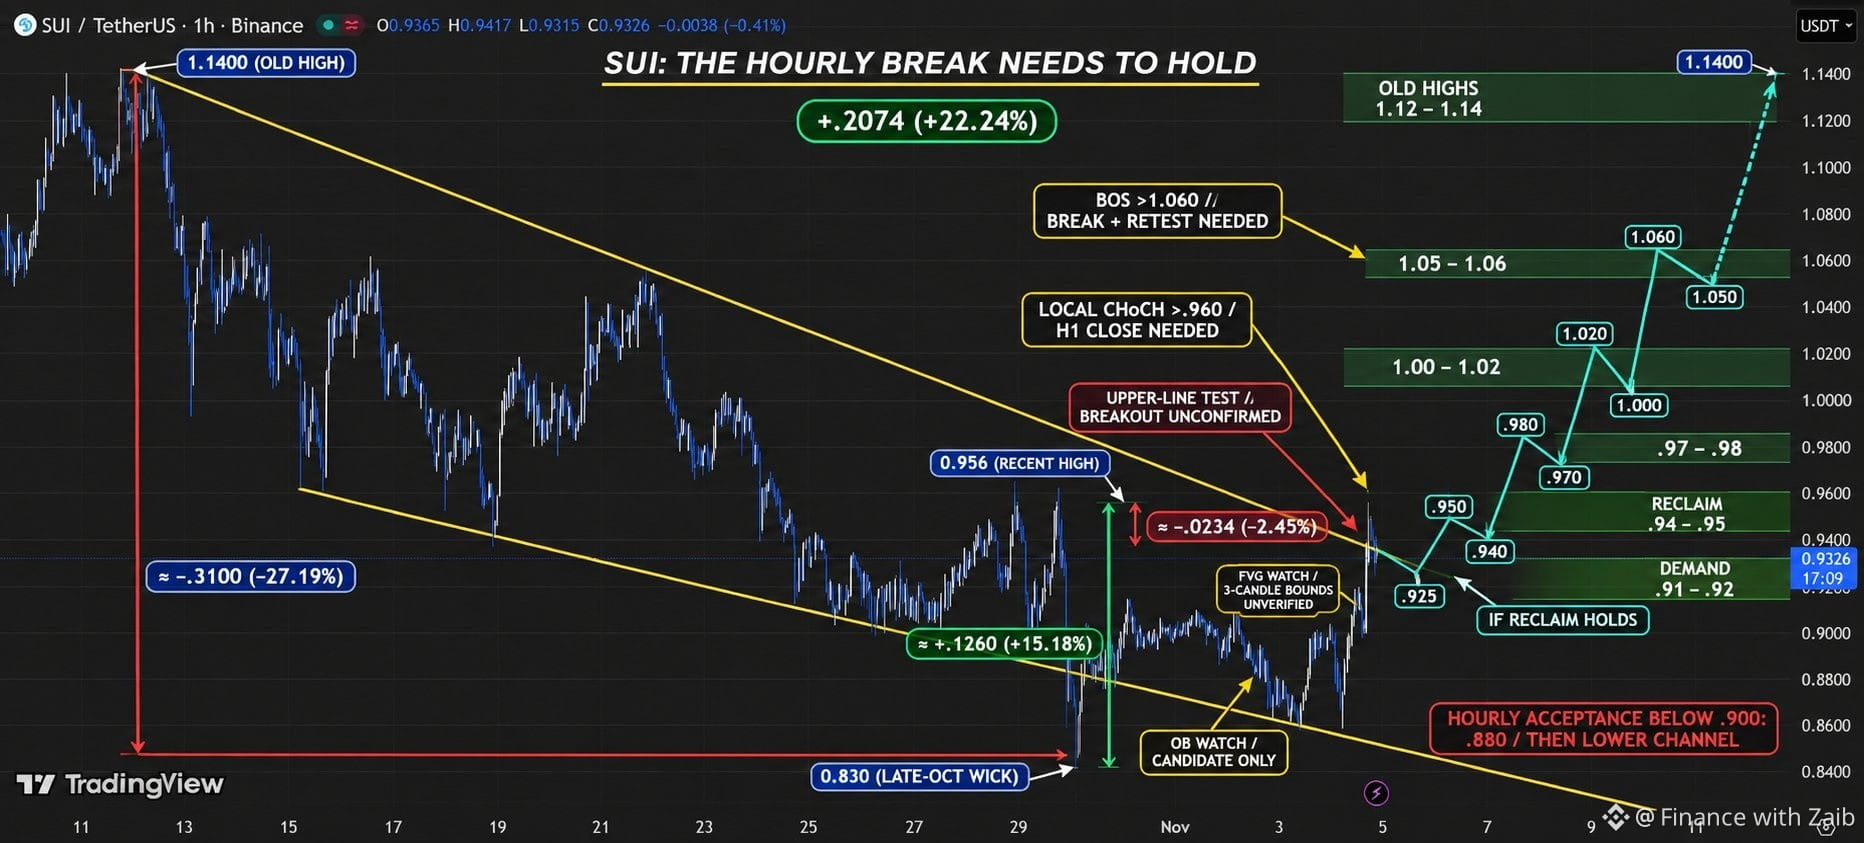
📊 $SUI PRICE UPDATE: BREAKOUT OR ANOTHER REJECTION?
SUI is currently trading around $0.9326, after bouncing back towards the upper boundary of its descending channel.
Price has moved above the trendline, but it's still too early to call it a confirmed breakout. Buyers need to prove they can hold this level.
🎯 KEY LEVELS TO WATCH
🟢 Bullish Scenario:
$0.94–$0.95: Important breakout zone.
$0.97–$0.98: First upside target.
$1.00–$1.02: Next resistance area.
$1.05–$1.06: Further upside target.
$1.12–$1.14: Major recovery zone.
For a stronger bullish move, SUI needs to close above $0.95 on the hourly chart and successfully retest that level as support.
🔴 Bearish Scenario:
$0.91–$0.92: Immediate support.
Below $0.90: Bullish setup starts weakening.
$0.88: Next downside level.
$0.86: Lower channel support.
MY TAKE 👀
SUI is approaching an important turning point. A confirmed breakout above $0.95 could open the door for further upside, but failure to hold support may bring sellers back into control.
Don't rush into a trade before confirmation. Watch the hourly candles and volume.
💬 What do you think? Can SUI break above $1.00 this time?
#SUI #SuiNetwork #Altcoins #TechnicalAnalysis #BinanceSquare
⚠️ Not financial advice. Always do your own research.
{spot}(SUIUSDT)
📊 $SUI PRICE UPDATE: BREAKOUT OR ANOTHER REJECTION?
SUI is currently trading around $0.9326, after bouncing back towards the upper boundary of its descending channel.
Price has moved above the trendline, but it's still too early to call it a confirmed breakout. Buyers need to prove they can hold this level.
🎯 KEY LEVELS TO WATCH
🟢 Bullish Scenario:
$0.94–$0.95: Important breakout zone.
$0.97–$0.98: First upside target.
$1.00–$1.02: Next resistance area.
$1.05–$1.06: Further upside target.
$1.12–$1.14: Major recovery zone.
For a stronger bullish move, SUI needs to close above $0.95 on the hourly chart and successfully retest that level as support.
🔴 Bearish Scenario:
$0.91–$0.92: Immediate support.
Below $0.90: Bullish setup starts weakening.
$0.88: Next downside level.
$0.86: Lower channel support.
MY TAKE 👀
SUI is approaching an important turning point. A confirmed breakout above $0.95 could open the door for further upside, but failure to hold support may bring sellers back into control.
Don't rush into a trade before confirmation. Watch the hourly candles and volume.
💬 What do you think? Can SUI break above $1.00 this time?
#SUI #SuiNetwork #Altcoins #TechnicalAnalysis #BinanceSquare
⚠️ Not financial advice. Always do your own research.
SUI is currently trading around $0.9326, after bouncing back towards the upper boundary of its descending channel.
Price has moved above the trendline, but it's still too early to call it a confirmed breakout. Buyers need to prove they can hold this level.
🎯 KEY LEVELS TO WATCH
🟢 Bullish Scenario:
$0.94–$0.95: Important breakout zone.
$0.97–$0.98: First upside target.
$1.00–$1.02: Next resistance area.
$1.05–$1.06: Further upside target.
$1.12–$1.14: Major recovery zone.
For a stronger bullish move, SUI needs to close above $0.95 on the hourly chart and successfully retest that level as support.
🔴 Bearish Scenario:
$0.91–$0.92: Immediate support.
Below $0.90: Bullish setup starts weakening.
$0.88: Next downside level.
$0.86: Lower channel support.
MY TAKE 👀
SUI is approaching an important turning point. A confirmed breakout above $0.95 could open the door for further upside, but failure to hold support may bring sellers back into control.
Don't rush into a trade before confirmation. Watch the hourly candles and volume.
💬 What do you think? Can SUI break above $1.00 this time?
#SUI #SuiNetwork #Altcoins #TechnicalAnalysis #BinanceSquare
⚠️ Not financial advice. Always do your own research.
795
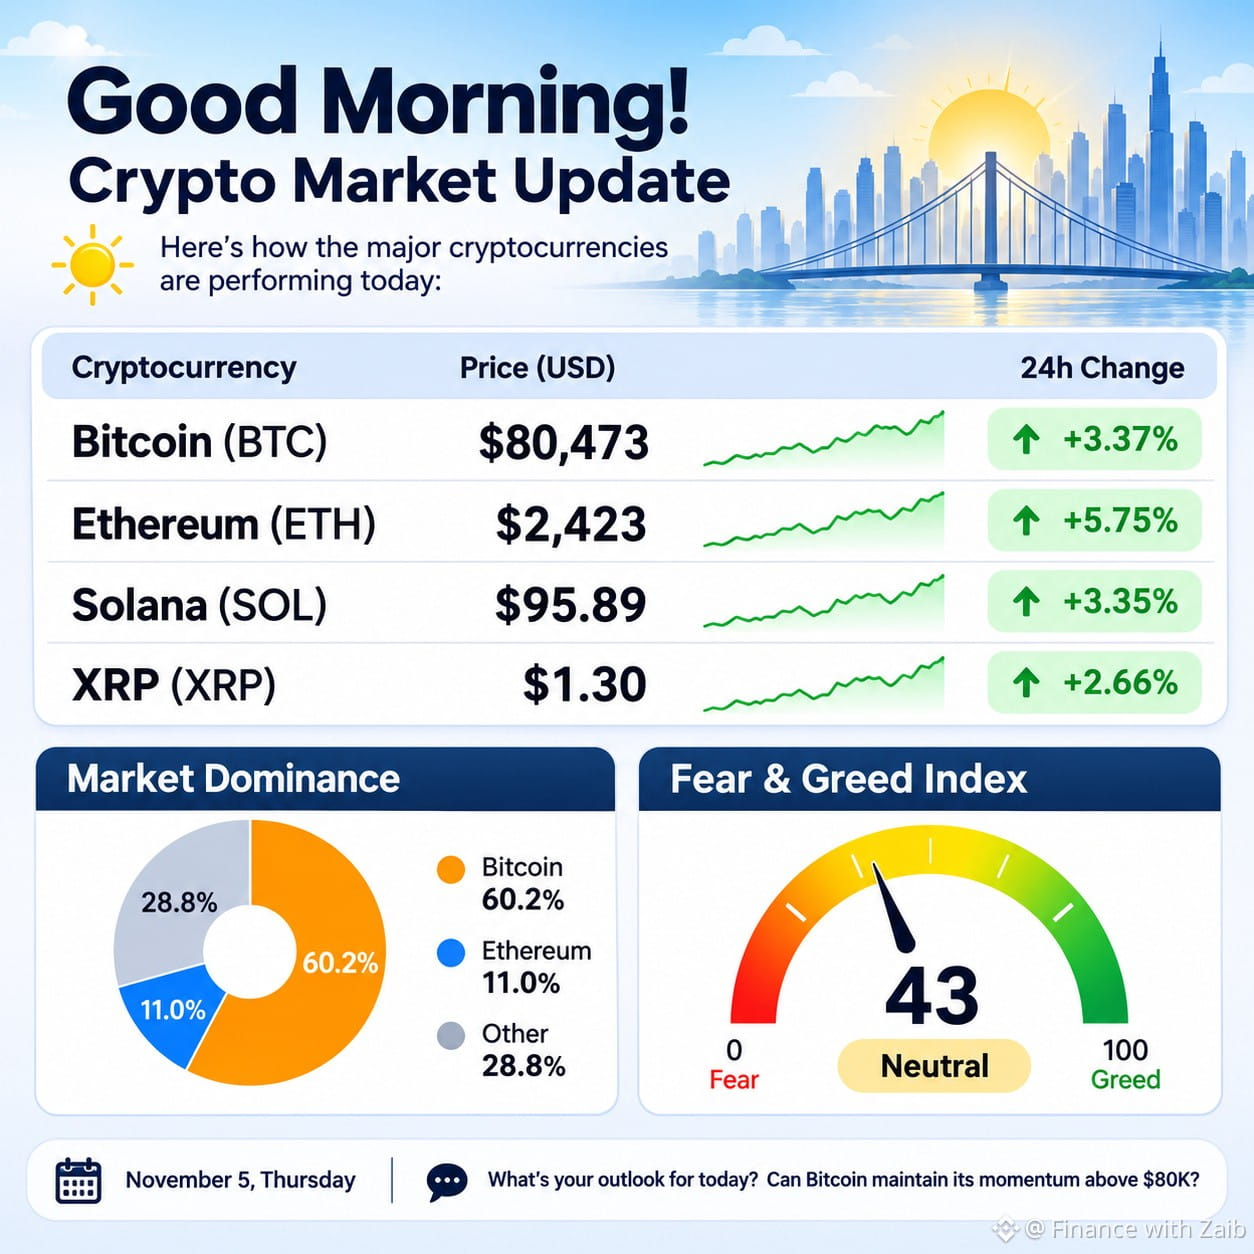
☀️ GOOD MORNING, CRYPTO MARKET!
The crypto market is starting the day on a positive note, with major cryptocurrencies posting gains.
📊 LATEST MARKET PRICES
🟢 $BTC : $80,473 (+3.37%)
🟢 $ETH : $2,423 (+5.75%)
🟢 $SOL : $95.89 (+3.35%)
🟢 $XRP : $1.30 (+2.66%)
📈 MARKET DOMINANCE
₿ Bitcoin: 60.2%
♦️ Ethereum: 11.0%
🌐 Other cryptocurrencies: 28.8%
😐 FEAR & GREED INDEX
43 — Neutral
💡 MARKET OUTLOOK
Ethereum is leading today's gains among the major cryptocurrencies, while Bitcoin continues to hold the largest share of the overall market.
With market sentiment sitting in neutral territory, it will be interesting to see whether this recovery gains further momentum.
💬 Do you think the market is preparing for another bullish move?
#CryptoMorning #Bitcoin #Ethereum #Solana #BinanceSquare
{spot}(BTCUSDT)
{spot}(ETHUSDT)
{spot}(SOLUSDT)
☀️ GOOD MORNING, CRYPTO MARKET!
The crypto market is starting the day on a positive note, with major cryptocurrencies posting gains.
📊 LATEST MARKET PRICES
🟢 $BTC : $80,473 (+3.37%)
🟢 $ETH : $2,423 (+5.75%)
🟢 $SOL : $95.89 (+3.35%)
🟢 $XRP : $1.30 (+2.66%)
📈 MARKET DOMINANCE
₿ Bitcoin: 60.2%
♦️ Ethereum: 11.0%
🌐 Other cryptocurrencies: 28.8%
😐 FEAR & GREED INDEX
43 — Neutral
💡 MARKET OUTLOOK
Ethereum is leading today's gains among the major cryptocurrencies, while Bitcoin continues to hold the largest share of the overall market.
With market sentiment sitting in neutral territory, it will be interesting to see whether this recovery gains further momentum.
💬 Do you think the market is preparing for another bullish move?
#CryptoMorning #Bitcoin #Ethereum #Solana #BinanceSquare
The crypto market is starting the day on a positive note, with major cryptocurrencies posting gains.
📊 LATEST MARKET PRICES
🟢 $BTC : $80,473 (+3.37%)
🟢 $ETH : $2,423 (+5.75%)
🟢 $SOL : $95.89 (+3.35%)
🟢 $XRP : $1.30 (+2.66%)
📈 MARKET DOMINANCE
₿ Bitcoin: 60.2%
♦️ Ethereum: 11.0%
🌐 Other cryptocurrencies: 28.8%
😐 FEAR & GREED INDEX
43 — Neutral
💡 MARKET OUTLOOK
Ethereum is leading today's gains among the major cryptocurrencies, while Bitcoin continues to hold the largest share of the overall market.
With market sentiment sitting in neutral territory, it will be interesting to see whether this recovery gains further momentum.
💬 Do you think the market is preparing for another bullish move?
#CryptoMorning #Bitcoin #Ethereum #Solana #BinanceSquare
106
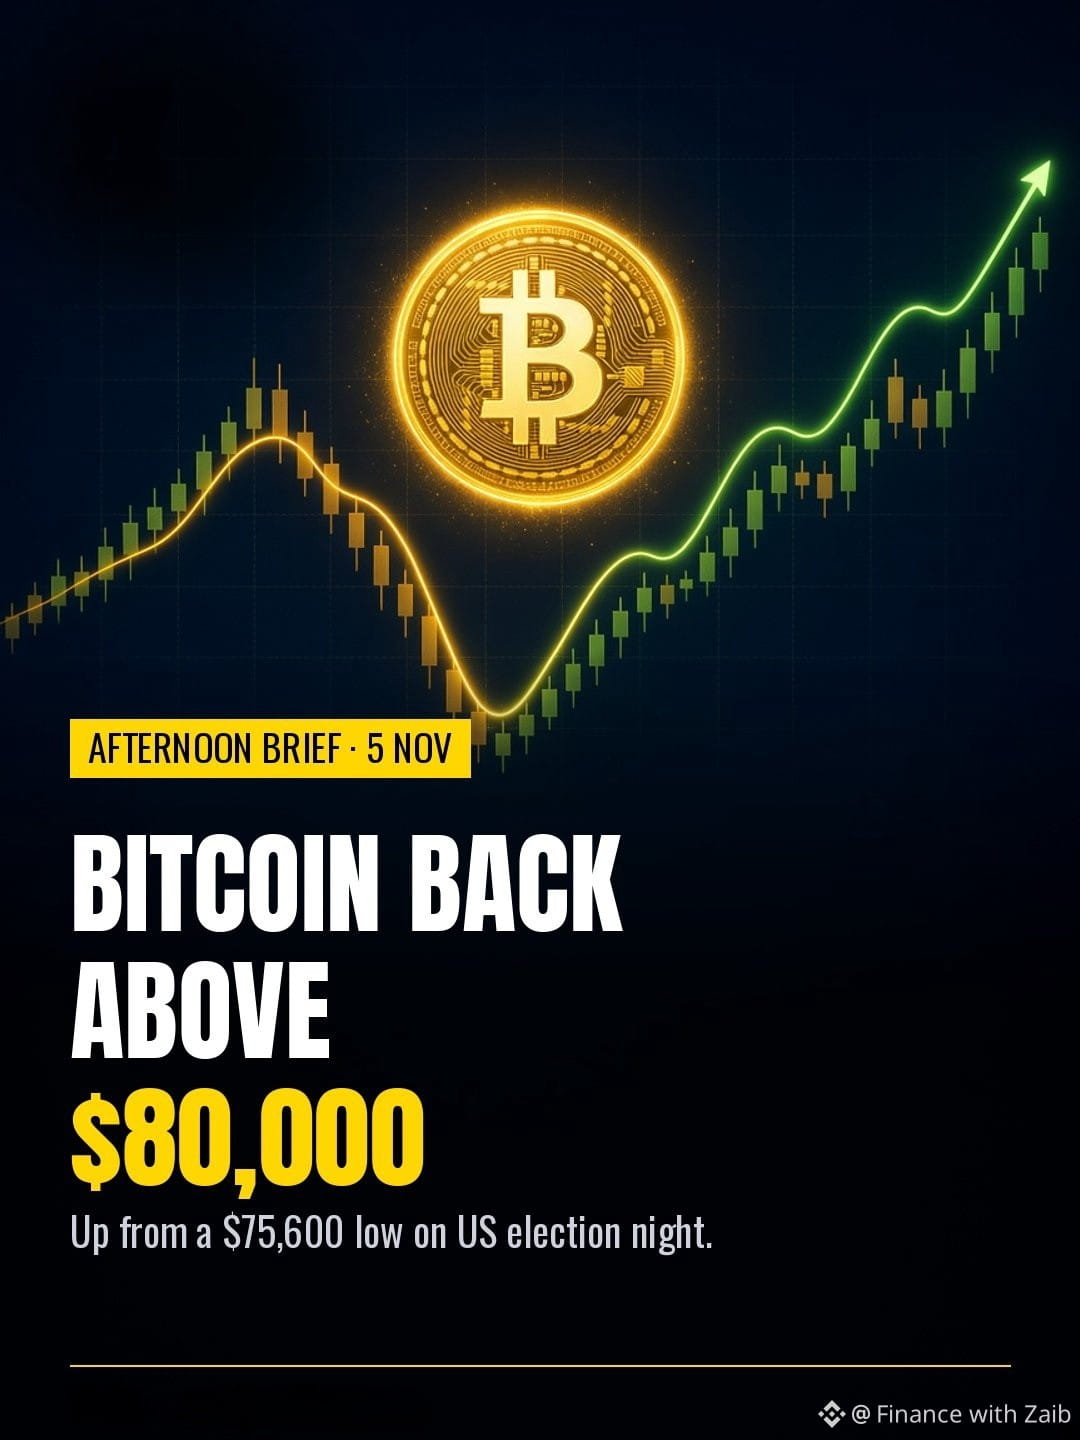
🚀 BITCOIN REBOUNDS ABOVE $80K AS CRYPTO MARKET RECOVERS!
Bitcoin is showing signs of recovery after falling to around $75,600 on election night.
$BTC has climbed approximately 3.5%, trading near $80,500, while Ethereum has gained around 6%, bringing fresh optimism to the crypto market.
According to reports, the market rally comes after Democrats secured control of Congress.
Bitwise also believes the recent Binance security incident had a relatively limited impact on the broader market. However, a Democratic-controlled House could bring stricter crypto regulations in the future.
Here's what else is happening in the market:
🔹 Trump-linked tokens are among the biggest losers in the top 100 cryptocurrencies, despite the broader market recovery.
🔹 Crypto-focused super PACs reportedly spent more than $176 million during the midterm elections.
🔹 Mercado Bitcoin plans to gradually reopen on Monday and says it will cover customer losses.
🔹 Snap shares dropped more than 10% following disappointing third-quarter revenue results.
📊 THE BIG PICTURE
Bitcoin's recovery above $80K is encouraging, but regulatory uncertainty and broader market developments remain important factors to watch.
Will BTC manage to hold above $80K and continue its recovery, or is another pullback coming?
💬 What's your outlook?
#Bitcoin #Ethereum #CryptoNews #CryptoMarket #BinanceSquare
{spot}(BTCUSDT)
🚀 BITCOIN REBOUNDS ABOVE $80K AS CRYPTO MARKET RECOVERS!
Bitcoin is showing signs of recovery after falling to around $75,600 on election night.
$BTC has climbed approximately 3.5%, trading near $80,500, while Ethereum has gained around 6%, bringing fresh optimism to the crypto market.
According to reports, the market rally comes after Democrats secured control of Congress.
Bitwise also believes the recent Binance security incident had a relatively limited impact on the broader market. However, a Democratic-controlled House could bring stricter crypto regulations in the future.
Here's what else is happening in the market:
🔹 Trump-linked tokens are among the biggest losers in the top 100 cryptocurrencies, despite the broader market recovery.
🔹 Crypto-focused super PACs reportedly spent more than $176 million during the midterm elections.
🔹 Mercado Bitcoin plans to gradually reopen on Monday and says it will cover customer losses.
🔹 Snap shares dropped more than 10% following disappointing third-quarter revenue results.
📊 THE BIG PICTURE
Bitcoin's recovery above $80K is encouraging, but regulatory uncertainty and broader market developments remain important factors to watch.
Will BTC manage to hold above $80K and continue its recovery, or is another pullback coming?
💬 What's your outlook?
#Bitcoin #Ethereum #CryptoNews #CryptoMarket #BinanceSquare
Bitcoin is showing signs of recovery after falling to around $75,600 on election night.
$BTC has climbed approximately 3.5%, trading near $80,500, while Ethereum has gained around 6%, bringing fresh optimism to the crypto market.
According to reports, the market rally comes after Democrats secured control of Congress.
Bitwise also believes the recent Binance security incident had a relatively limited impact on the broader market. However, a Democratic-controlled House could bring stricter crypto regulations in the future.
Here's what else is happening in the market:
🔹 Trump-linked tokens are among the biggest losers in the top 100 cryptocurrencies, despite the broader market recovery.
🔹 Crypto-focused super PACs reportedly spent more than $176 million during the midterm elections.
🔹 Mercado Bitcoin plans to gradually reopen on Monday and says it will cover customer losses.
🔹 Snap shares dropped more than 10% following disappointing third-quarter revenue results.
📊 THE BIG PICTURE
Bitcoin's recovery above $80K is encouraging, but regulatory uncertainty and broader market developments remain important factors to watch.
Will BTC manage to hold above $80K and continue its recovery, or is another pullback coming?
💬 What's your outlook?
#Bitcoin #Ethereum #CryptoNews #CryptoMarket #BinanceSquare
87
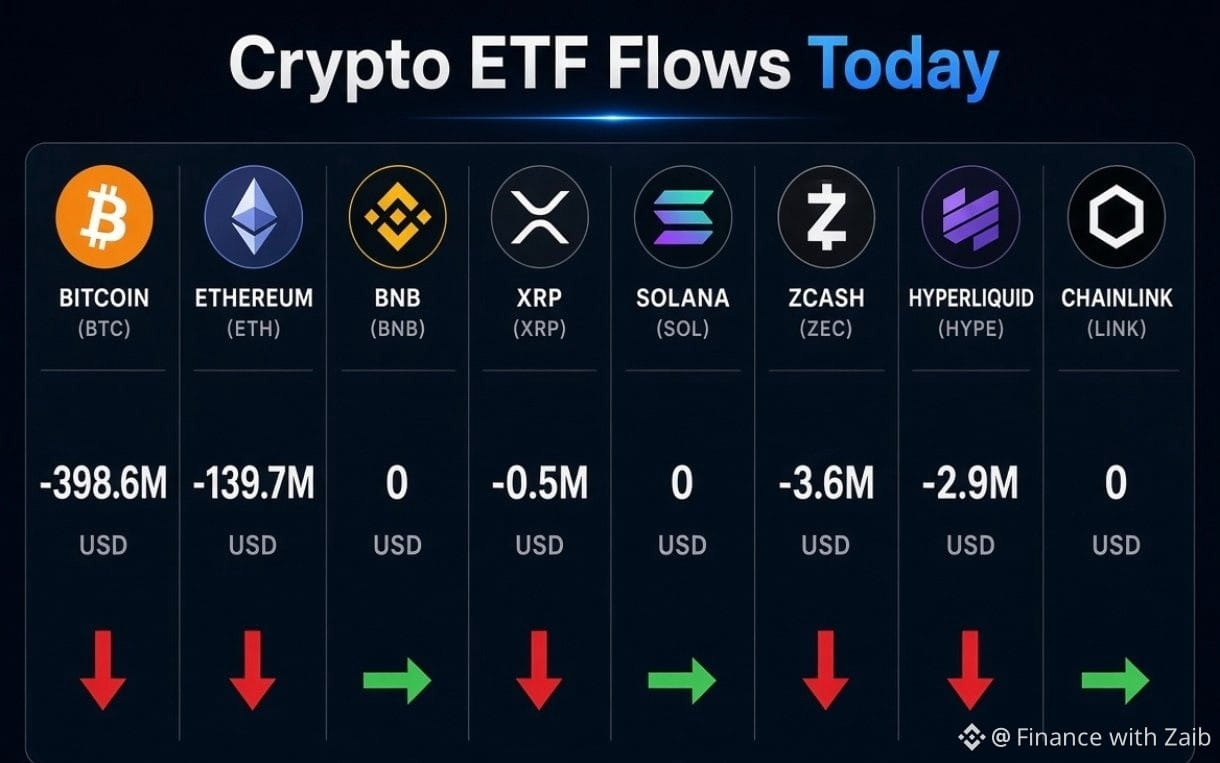
📊 CRYPTO ETF FLOWS: TODAY'S UPDATE
Crypto ETFs are seeing mixed flows today, with Bitcoin and Ethereum recording the largest outflows.
Here's the breakdown:
🔴 $BTC : $398.6M
🔴 $ETH : $139.7M
🟢 $BNB : $0M
🔴 $XRP: $0.5M
🟢 $SOL: $0M
🔴 $ZEC: $3.6M
🔴 $HYPE: $2.9M
🟢 $LINK: $0M
📉 Bitcoin and Ethereum are leading the outflows, suggesting weaker institutional demand in today's ETF session.
Meanwhile, the other listed assets recorded no net flows.
👀 Institutional money flows are worth watching. Will we see buyers step back in, or will outflows continue?
⚠️ For informational purposes only. Not financial advice.
#CryptoETF #Bitcoin #ETH #CryptoMarket #BinanceSquare
{spot}(BTCUSDT)
{spot}(ETHUSDT)
{spot}(BNBUSDT)
📊 CRYPTO ETF FLOWS: TODAY'S UPDATE
Crypto ETFs are seeing mixed flows today, with Bitcoin and Ethereum recording the largest outflows.
Here's the breakdown:
🔴 $BTC : $398.6M
🔴 $ETH : $139.7M
🟢 $BNB : $0M
🔴 $XRP: $0.5M
🟢 $SOL: $0M
🔴 $ZEC: $3.6M
🔴 $HYPE: $2.9M
🟢 $LINK: $0M
📉 Bitcoin and Ethereum are leading the outflows, suggesting weaker institutional demand in today's ETF session.
Meanwhile, the other listed assets recorded no net flows.
👀 Institutional money flows are worth watching. Will we see buyers step back in, or will outflows continue?
⚠️ For informational purposes only. Not financial advice.
#CryptoETF #Bitcoin #ETH #CryptoMarket #BinanceSquare
Crypto ETFs are seeing mixed flows today, with Bitcoin and Ethereum recording the largest outflows.
Here's the breakdown:
🔴 $BTC : $398.6M
🔴 $ETH : $139.7M
🟢 $BNB : $0M
🔴 $XRP: $0.5M
🟢 $SOL: $0M
🔴 $ZEC: $3.6M
🔴 $HYPE: $2.9M
🟢 $LINK: $0M
📉 Bitcoin and Ethereum are leading the outflows, suggesting weaker institutional demand in today's ETF session.
Meanwhile, the other listed assets recorded no net flows.
👀 Institutional money flows are worth watching. Will we see buyers step back in, or will outflows continue?
⚠️ For informational purposes only. Not financial advice.
#CryptoETF #Bitcoin #ETH #CryptoMarket #BinanceSquare
113
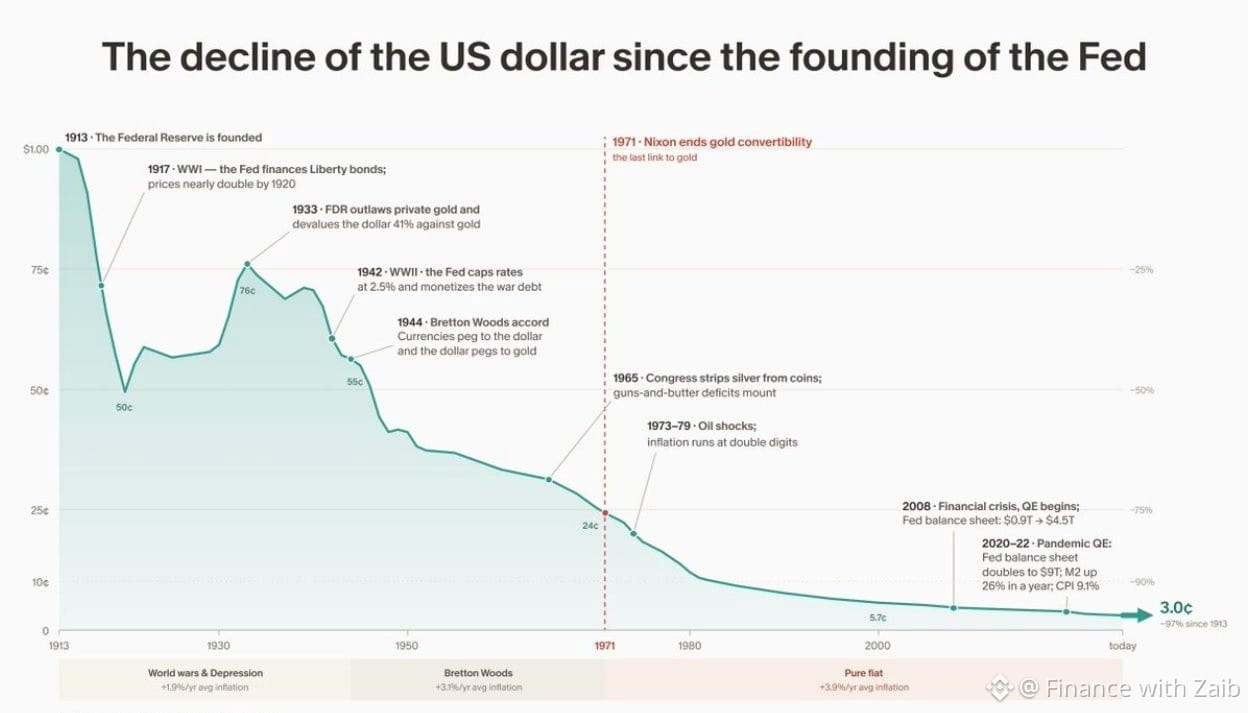
The Federal Reserve was established in 1913 with the goal of maintaining monetary stability.
Yet, since its creation, the US dollar has lost around 97% of its purchasing power.
Interestingly, some of its strongest periods of appreciation came during major economic downturns.
A lot has changed since 1913, but one question remains:
Has the system really delivered on its original promise of keeping money stable?
Something worth thinking about. 🤔
#FederalReserve #USD #Inflation #Economy #Finance
{future}(USDCUSDT)
The Federal Reserve was established in 1913 with the goal of maintaining monetary stability.
Yet, since its creation, the US dollar has lost around 97% of its purchasing power.
Interestingly, some of its strongest periods of appreciation came during major economic downturns.
A lot has changed since 1913, but one question remains:
Has the system really delivered on its original promise of keeping money stable?
Something worth thinking about. 🤔
#FederalReserve #USD #Inflation #Economy #Finance
Yet, since its creation, the US dollar has lost around 97% of its purchasing power.
Interestingly, some of its strongest periods of appreciation came during major economic downturns.
A lot has changed since 1913, but one question remains:
Has the system really delivered on its original promise of keeping money stable?
Something worth thinking about. 🤔
#FederalReserve #USD #Inflation #Economy #Finance
153
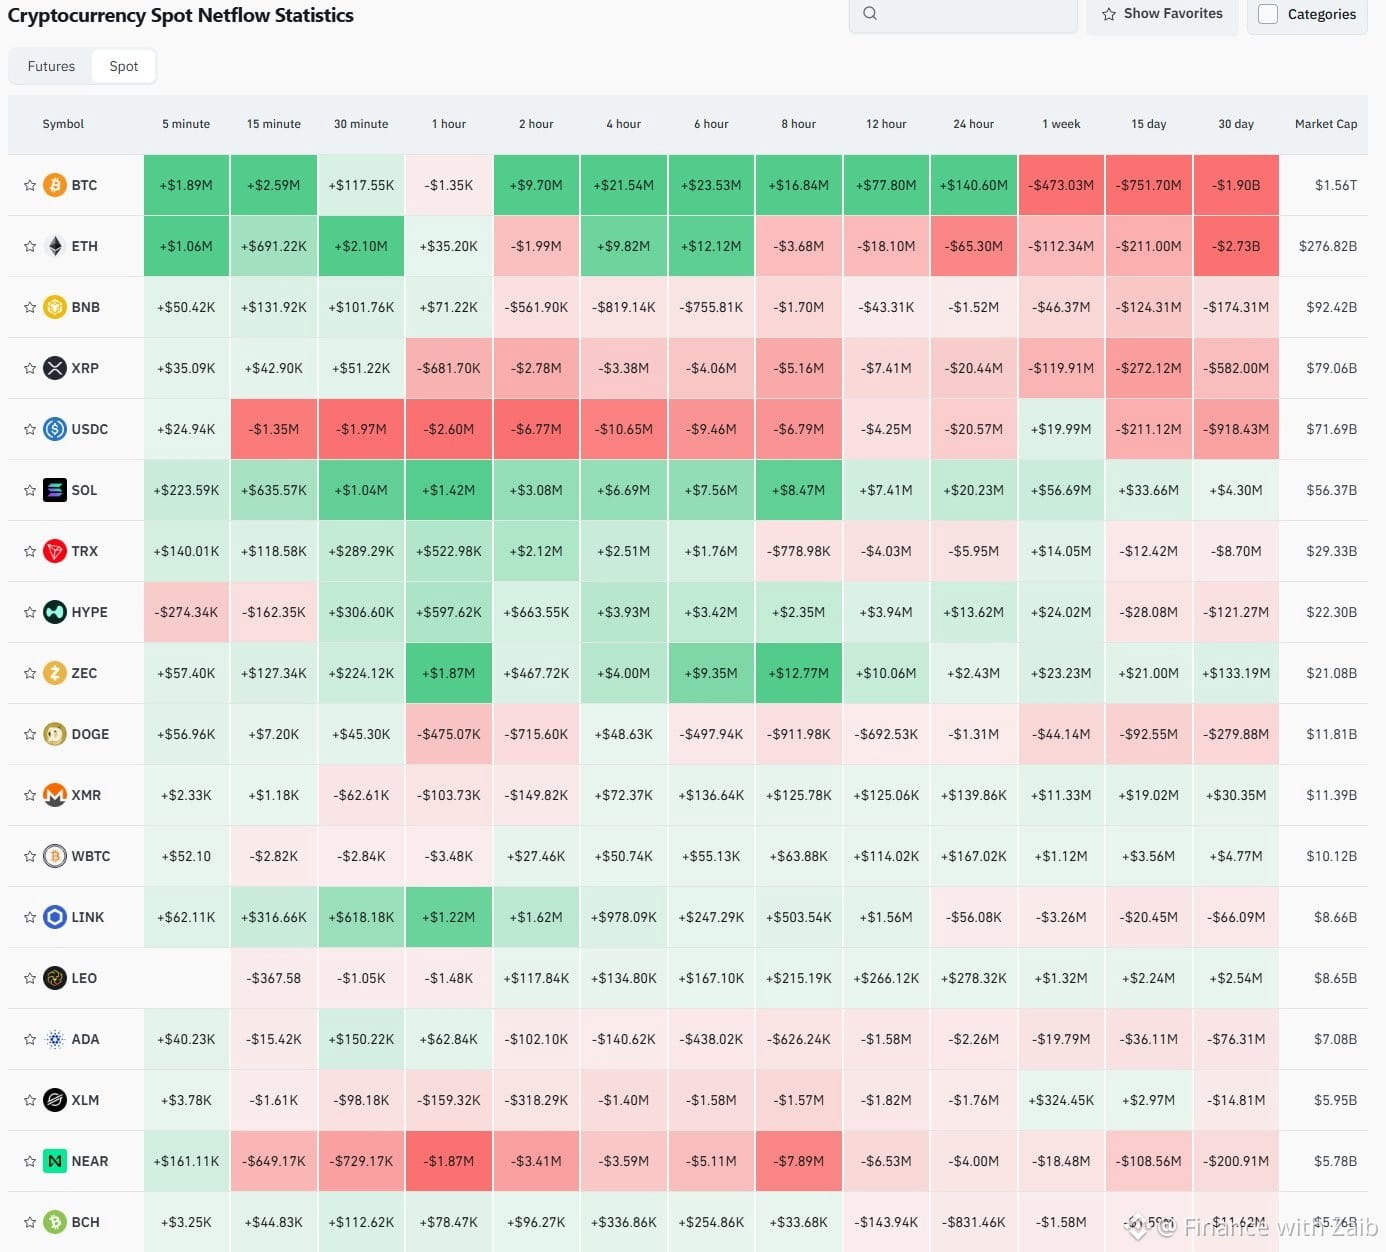
📊 BUYING INTEREST IS PICKING UP IN THESE CRYPTO ASSETS!
Over the past 24 hours, $BTC, $SOL, $HYPE, and $ZEC have recorded net inflows in the spot market.
This suggests that fresh capital is moving into these assets, with buyers starting to show interest after the recent price declines.
👀 Coins to keep on your watchlist:
₿ $BTC
◎ $SOL
🔥 $HYPE
⚡ $ZEC
Could this be an early sign of a recovery, or just a short-term bounce?
Let's see how the market reacts over the next 24 hours.
💬 Which of these coins are you watching?
#Bitcoin #HYPE #ZEC #CryptoMarket #BinanceSquare
{spot}(ZECUSDT)
{spot}(SOLUSDT)
📊 BUYING INTEREST IS PICKING UP IN THESE CRYPTO ASSETS!
Over the past 24 hours, $BTC, $SOL , $HYPE, and $ZEC have recorded net inflows in the spot market.
This suggests that fresh capital is moving into these assets, with buyers starting to show interest after the recent price declines.
👀 Coins to keep on your watchlist:
₿ $BTC
◎ $SOL
🔥 $HYPE
⚡ $ZEC
Could this be an early sign of a recovery, or just a short-term bounce?
Let's see how the market reacts over the next 24 hours.
💬 Which of these coins are you watching?
#Bitcoin #HYPE #ZEC #CryptoMarket #BinanceSquare
Over the past 24 hours, $BTC, $SOL , $HYPE, and $ZEC have recorded net inflows in the spot market.
This suggests that fresh capital is moving into these assets, with buyers starting to show interest after the recent price declines.
👀 Coins to keep on your watchlist:
₿ $BTC
◎ $SOL
🔥 $HYPE
⚡ $ZEC
Could this be an early sign of a recovery, or just a short-term bounce?
Let's see how the market reacts over the next 24 hours.
💬 Which of these coins are you watching?
#Bitcoin #HYPE #ZEC #CryptoMarket #BinanceSquare
217
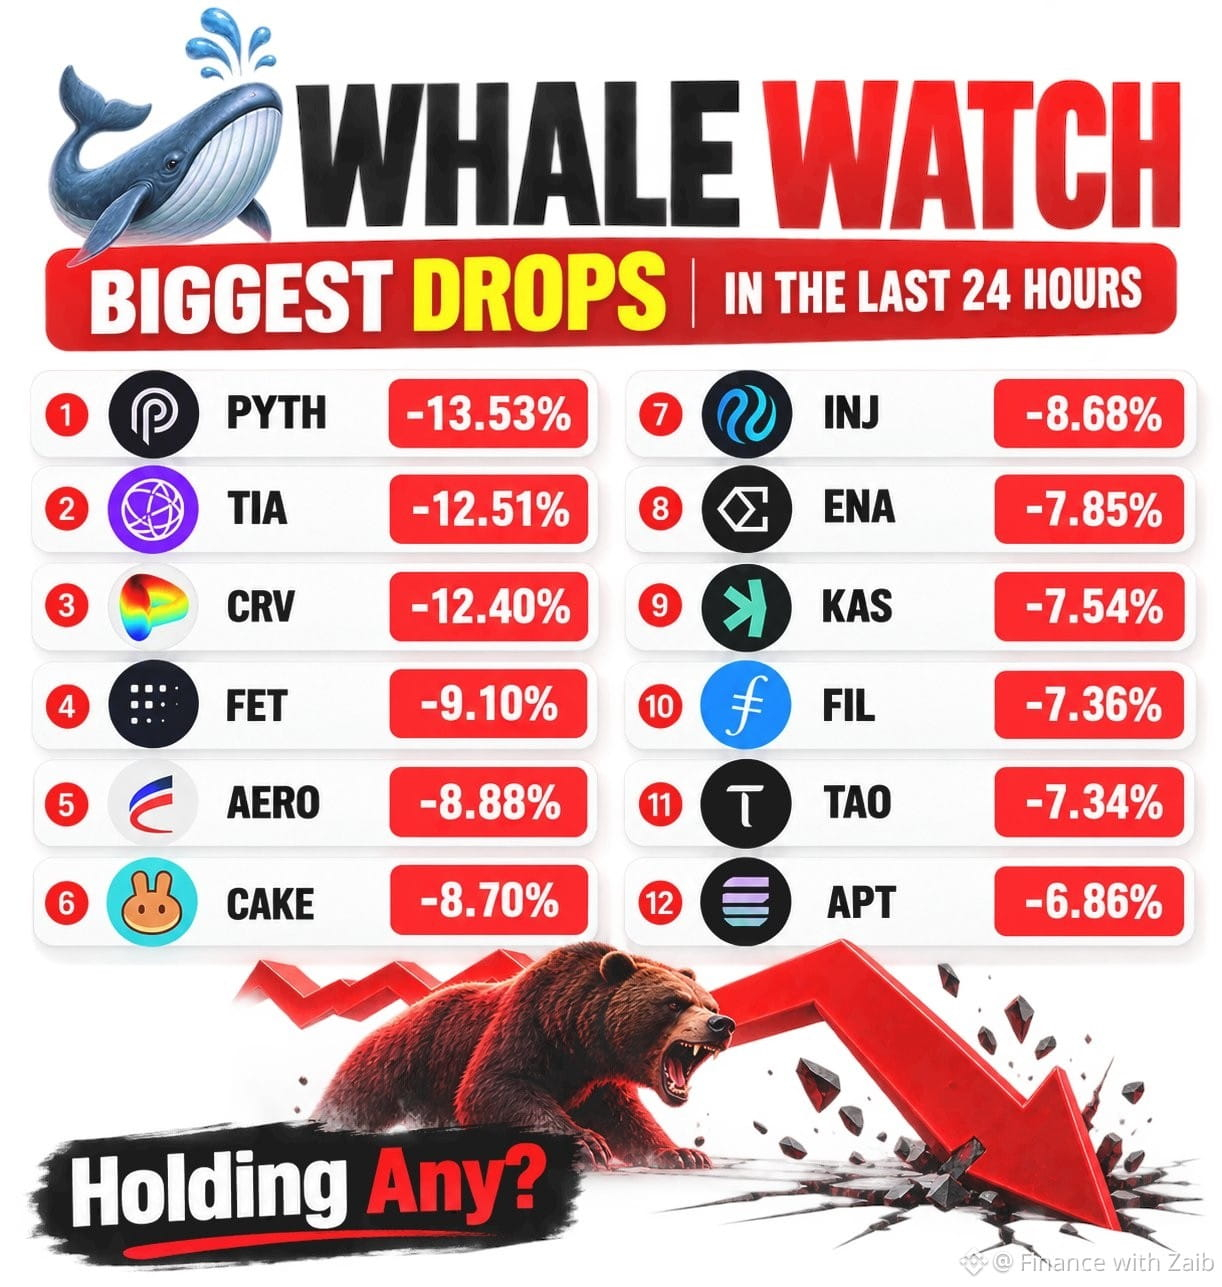
k🐋 WHALE WATCH: TOP CRYPTO LOSERS IN THE LAST 24 HOURS 📉
It's been a rough 24 hours for several altcoins, with some major tokens recording significant losses.
Here's a look at the biggest decliners:
🔻 $PYTH : -13.53%
🔻 $TIA : -12.51%
🔻 $CRV : -12.40%
🔻 $FET: -9.10%
🔻 $AERO: -8.88%
🔻 $CAKE: -8.70%
🔻 $INJ: -8.68%
🔻 $ENA: -7.85%
🔻 $KAS: -7.54%
🔻 $FIL: -7.36%
🔻 $TAO: -7.34%
🔻 $APT: -6.86%
⚠️ WHAT DOES THIS TELL US?
Altcoins are facing considerable selling pressure, and traders should pay close attention to support levels and trading volume.
A sharp drop doesn't automatically mean a buying opportunity. Sometimes, waiting for confirmation is the smarter move.
💬 Let's talk!
Are you holding any of these tokens, or have you already moved out?
Which altcoin do you think could recover first?
#CryptoMarket #WhaleWatch #Altcoins #CryptoNews #BinanceSquare
{spot}(PYTHUSDT)
{spot}(CRVUSDT)
k🐋 WHALE WATCH: TOP CRYPTO LOSERS IN THE LAST 24 HOURS 📉
It's been a rough 24 hours for several altcoins, with some major tokens recording significant losses.
Here's a look at the biggest decliners:
🔻 $PYTH : -13.53%
🔻 $TIA : -12.51%
🔻 $CRV : -12.40%
🔻 $FET: -9.10%
🔻 $AERO: -8.88%
🔻 $CAKE: -8.70%
🔻 $INJ: -8.68%
🔻 $ENA: -7.85%
🔻 $KAS: -7.54%
🔻 $FIL: -7.36%
🔻 $TAO: -7.34%
🔻 $APT: -6.86%
⚠️ WHAT DOES THIS TELL US?
Altcoins are facing considerable selling pressure, and traders should pay close attention to support levels and trading volume.
A sharp drop doesn't automatically mean a buying opportunity. Sometimes, waiting for confirmation is the smarter move.
💬 Let's talk!
Are you holding any of these tokens, or have you already moved out?
Which altcoin do you think could recover first?
#CryptoMarket #WhaleWatch #Altcoins #CryptoNews #BinanceSquare
It's been a rough 24 hours for several altcoins, with some major tokens recording significant losses.
Here's a look at the biggest decliners:
🔻 $PYTH : -13.53%
🔻 $TIA : -12.51%
🔻 $CRV : -12.40%
🔻 $FET: -9.10%
🔻 $AERO: -8.88%
🔻 $CAKE: -8.70%
🔻 $INJ: -8.68%
🔻 $ENA: -7.85%
🔻 $KAS: -7.54%
🔻 $FIL: -7.36%
🔻 $TAO: -7.34%
🔻 $APT: -6.86%
⚠️ WHAT DOES THIS TELL US?
Altcoins are facing considerable selling pressure, and traders should pay close attention to support levels and trading volume.
A sharp drop doesn't automatically mean a buying opportunity. Sometimes, waiting for confirmation is the smarter move.
💬 Let's talk!
Are you holding any of these tokens, or have you already moved out?
Which altcoin do you think could recover first?
#CryptoMarket #WhaleWatch #Altcoins #CryptoNews #BinanceSquare
2.1k
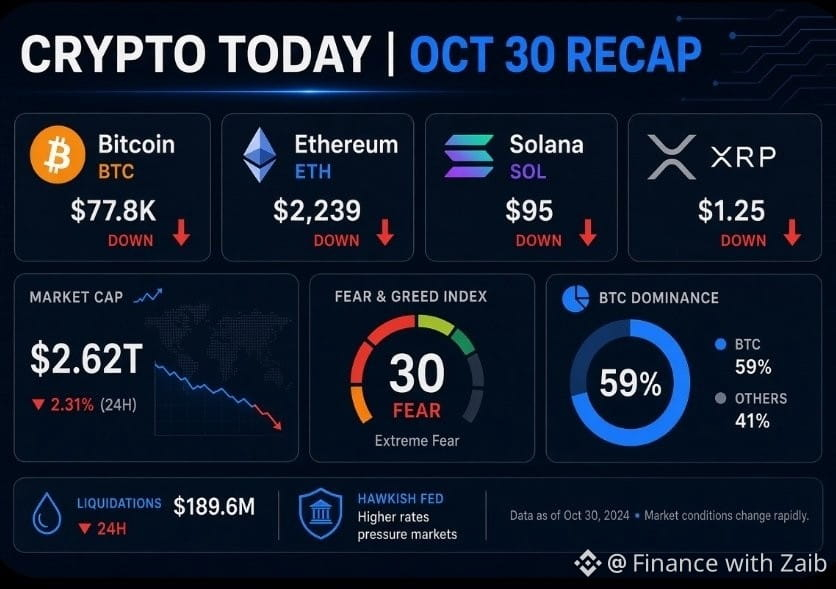
🚀 CRYPTO MARKET UPDATE | OCTOBER 30
Bitcoin has lost its $80K level, and traders are now watching the next major support zone.
Here's where the major cryptocurrencies stand:
₿ $BTC : $76.4K–$78K
Ξ $ETH : $2,220–$2,250
◎ $SOL : $95–$97
✕ $XRP : $1.24–$1.26
📊 KEY MARKET DATA
• Total crypto market cap: ~$2.62 trillion
• Bitcoin dominance: ~59%
• Fear & Greed Index: 30 (Fear)
• 24-hour liquidations: Over $1.5 billion, mostly long positions.
WHAT'S DRIVING THE MARKET?
The Federal Reserve's latest decision to keep interest rates unchanged came with a hawkish tone, adding pressure to risk assets.
Meanwhile, reported security concerns surrounding Binance and heavy leveraged liquidations have added to market uncertainty.
BITCOIN: LEVELS TO WATCH 🎯
$76K–$77K is the immediate support area.
A strong recovery above $80K could improve short-term sentiment, while a breakdown below support may increase downside risk.
Interestingly, Bitcoin spot ETFs recorded approximately $17 million in net inflows on October 29, led by BlackRock's IBIT.
MY TAKE:
The next few sessions could be important for Bitcoin. Watch how price reacts around support rather than rushing into leveraged positions.
⚠️ DYOR | NFA
What do you think — can BTC reclaim $80K, or are we heading lower?
#Bitcoin #Ethereum #SOL #CryptoNews #BitcoinETF
{spot}(XRPUSDT)
{spot}(SOLUSDT)
🚀 CRYPTO MARKET UPDATE | OCTOBER 30
Bitcoin has lost its $80K level, and traders are now watching the next major support zone.
Here's where the major cryptocurrencies stand:
₿ $BTC : $76.4K–$78K
Ξ $ETH : $2,220–$2,250
◎ $SOL : $95–$97
✕ $XRP : $1.24–$1.26
📊 KEY MARKET DATA
• Total crypto market cap: ~$2.62 trillion
• Bitcoin dominance: ~59%
• Fear & Greed Index: 30 (Fear)
• 24-hour liquidations: Over $1.5 billion, mostly long positions.
WHAT'S DRIVING THE MARKET?
The Federal Reserve's latest decision to keep interest rates unchanged came with a hawkish tone, adding pressure to risk assets.
Meanwhile, reported security concerns surrounding Binance and heavy leveraged liquidations have added to market uncertainty.
BITCOIN: LEVELS TO WATCH 🎯
$76K–$77K is the immediate support area.
A strong recovery above $80K could improve short-term sentiment, while a breakdown below support may increase downside risk.
Interestingly, Bitcoin spot ETFs recorded approximately $17 million in net inflows on October 29, led by BlackRock's IBIT.
MY TAKE:
The next few sessions could be important for Bitcoin. Watch how price reacts around support rather than rushing into leveraged positions.
⚠️ DYOR | NFA
What do you think — can BTC reclaim $80K, or are we heading lower?
#Bitcoin #Ethereum #SOL #CryptoNews #BitcoinETF
Bitcoin has lost its $80K level, and traders are now watching the next major support zone.
Here's where the major cryptocurrencies stand:
₿ $BTC : $76.4K–$78K
Ξ $ETH : $2,220–$2,250
◎ $SOL : $95–$97
✕ $XRP : $1.24–$1.26
📊 KEY MARKET DATA
• Total crypto market cap: ~$2.62 trillion
• Bitcoin dominance: ~59%
• Fear & Greed Index: 30 (Fear)
• 24-hour liquidations: Over $1.5 billion, mostly long positions.
WHAT'S DRIVING THE MARKET?
The Federal Reserve's latest decision to keep interest rates unchanged came with a hawkish tone, adding pressure to risk assets.
Meanwhile, reported security concerns surrounding Binance and heavy leveraged liquidations have added to market uncertainty.
BITCOIN: LEVELS TO WATCH 🎯
$76K–$77K is the immediate support area.
A strong recovery above $80K could improve short-term sentiment, while a breakdown below support may increase downside risk.
Interestingly, Bitcoin spot ETFs recorded approximately $17 million in net inflows on October 29, led by BlackRock's IBIT.
MY TAKE:
The next few sessions could be important for Bitcoin. Watch how price reacts around support rather than rushing into leveraged positions.
⚠️ DYOR | NFA
What do you think — can BTC reclaim $80K, or are we heading lower?
#Bitcoin #Ethereum #SOL #CryptoNews #BitcoinETF
134
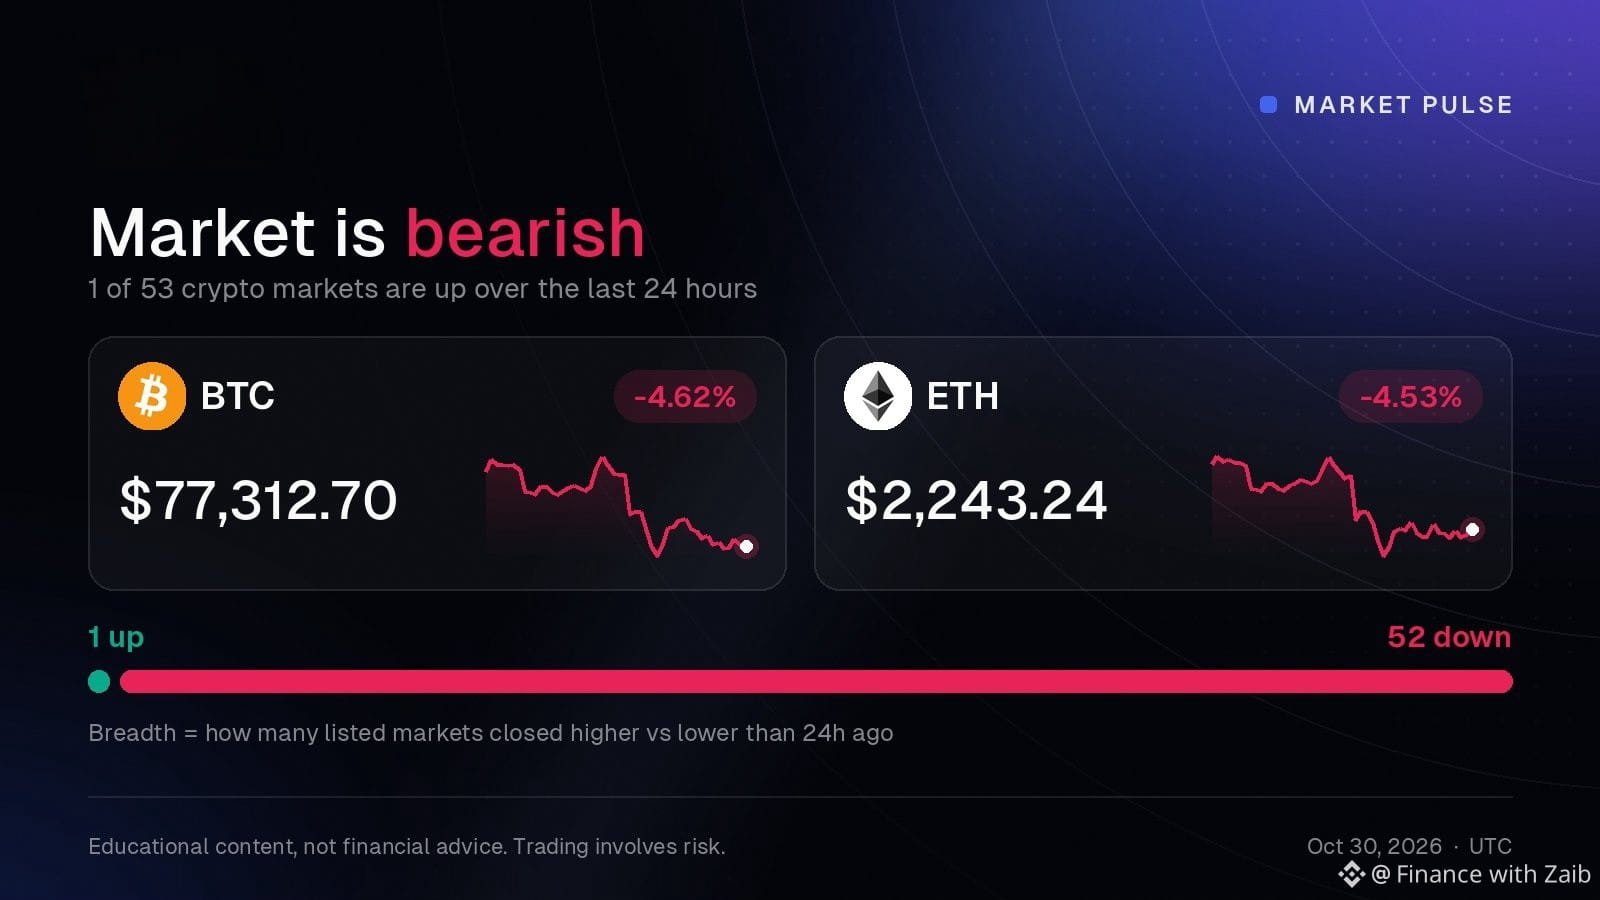
🚨 CRYPTO MARKET IS TURNING BEARISH! 📉
Have you noticed what's happening in the market today?
Bitcoin ( $BTC ) is trading around $77,313, down 4.62%.
Ethereum ( $ETH ) is sitting near $2,243, down 4.53%.
And the broader market looks even worse:
🔴 Only 1 listed asset is showing gains today.
🔴 52 assets are trading in the red.
📉 Overall market sentiment is clearly bearish.
What's concerning isn't just BTC and ETH dropping — it's how widespread the selling pressure has become.
When almost the entire market turns red, it shows that buyers are struggling to maintain momentum.
My take: This is a time to stay cautious, manage risk, and avoid chasing trades out of fear.
The big question is:
Are we heading towards another leg down, or is this just a temporary correction before the next recovery?
What's your prediction? 👇
#Bitcoin #Ethereum #CryptoMarket #BearishMarket #BinanceSquare
{spot}(ETHUSDT)
{spot}(BTCUSDT)
🚨 CRYPTO MARKET IS TURNING BEARISH! 📉
Have you noticed what's happening in the market today?
Bitcoin ( $BTC ) is trading around $77,313, down 4.62%.
Ethereum ( $ETH ) is sitting near $2,243, down 4.53%.
And the broader market looks even worse:
🔴 Only 1 listed asset is showing gains today.
🔴 52 assets are trading in the red.
📉 Overall market sentiment is clearly bearish.
What's concerning isn't just BTC and ETH dropping — it's how widespread the selling pressure has become.
When almost the entire market turns red, it shows that buyers are struggling to maintain momentum.
My take: This is a time to stay cautious, manage risk, and avoid chasing trades out of fear.
The big question is:
Are we heading towards another leg down, or is this just a temporary correction before the next recovery?
What's your prediction? 👇
#Bitcoin #Ethereum #CryptoMarket #BearishMarket #BinanceSquare
Have you noticed what's happening in the market today?
Bitcoin ( $BTC ) is trading around $77,313, down 4.62%.
Ethereum ( $ETH ) is sitting near $2,243, down 4.53%.
And the broader market looks even worse:
🔴 Only 1 listed asset is showing gains today.
🔴 52 assets are trading in the red.
📉 Overall market sentiment is clearly bearish.
What's concerning isn't just BTC and ETH dropping — it's how widespread the selling pressure has become.
When almost the entire market turns red, it shows that buyers are struggling to maintain momentum.
My take: This is a time to stay cautious, manage risk, and avoid chasing trades out of fear.
The big question is:
Are we heading towards another leg down, or is this just a temporary correction before the next recovery?
What's your prediction? 👇
#Bitcoin #Ethereum #CryptoMarket #BearishMarket #BinanceSquare
143
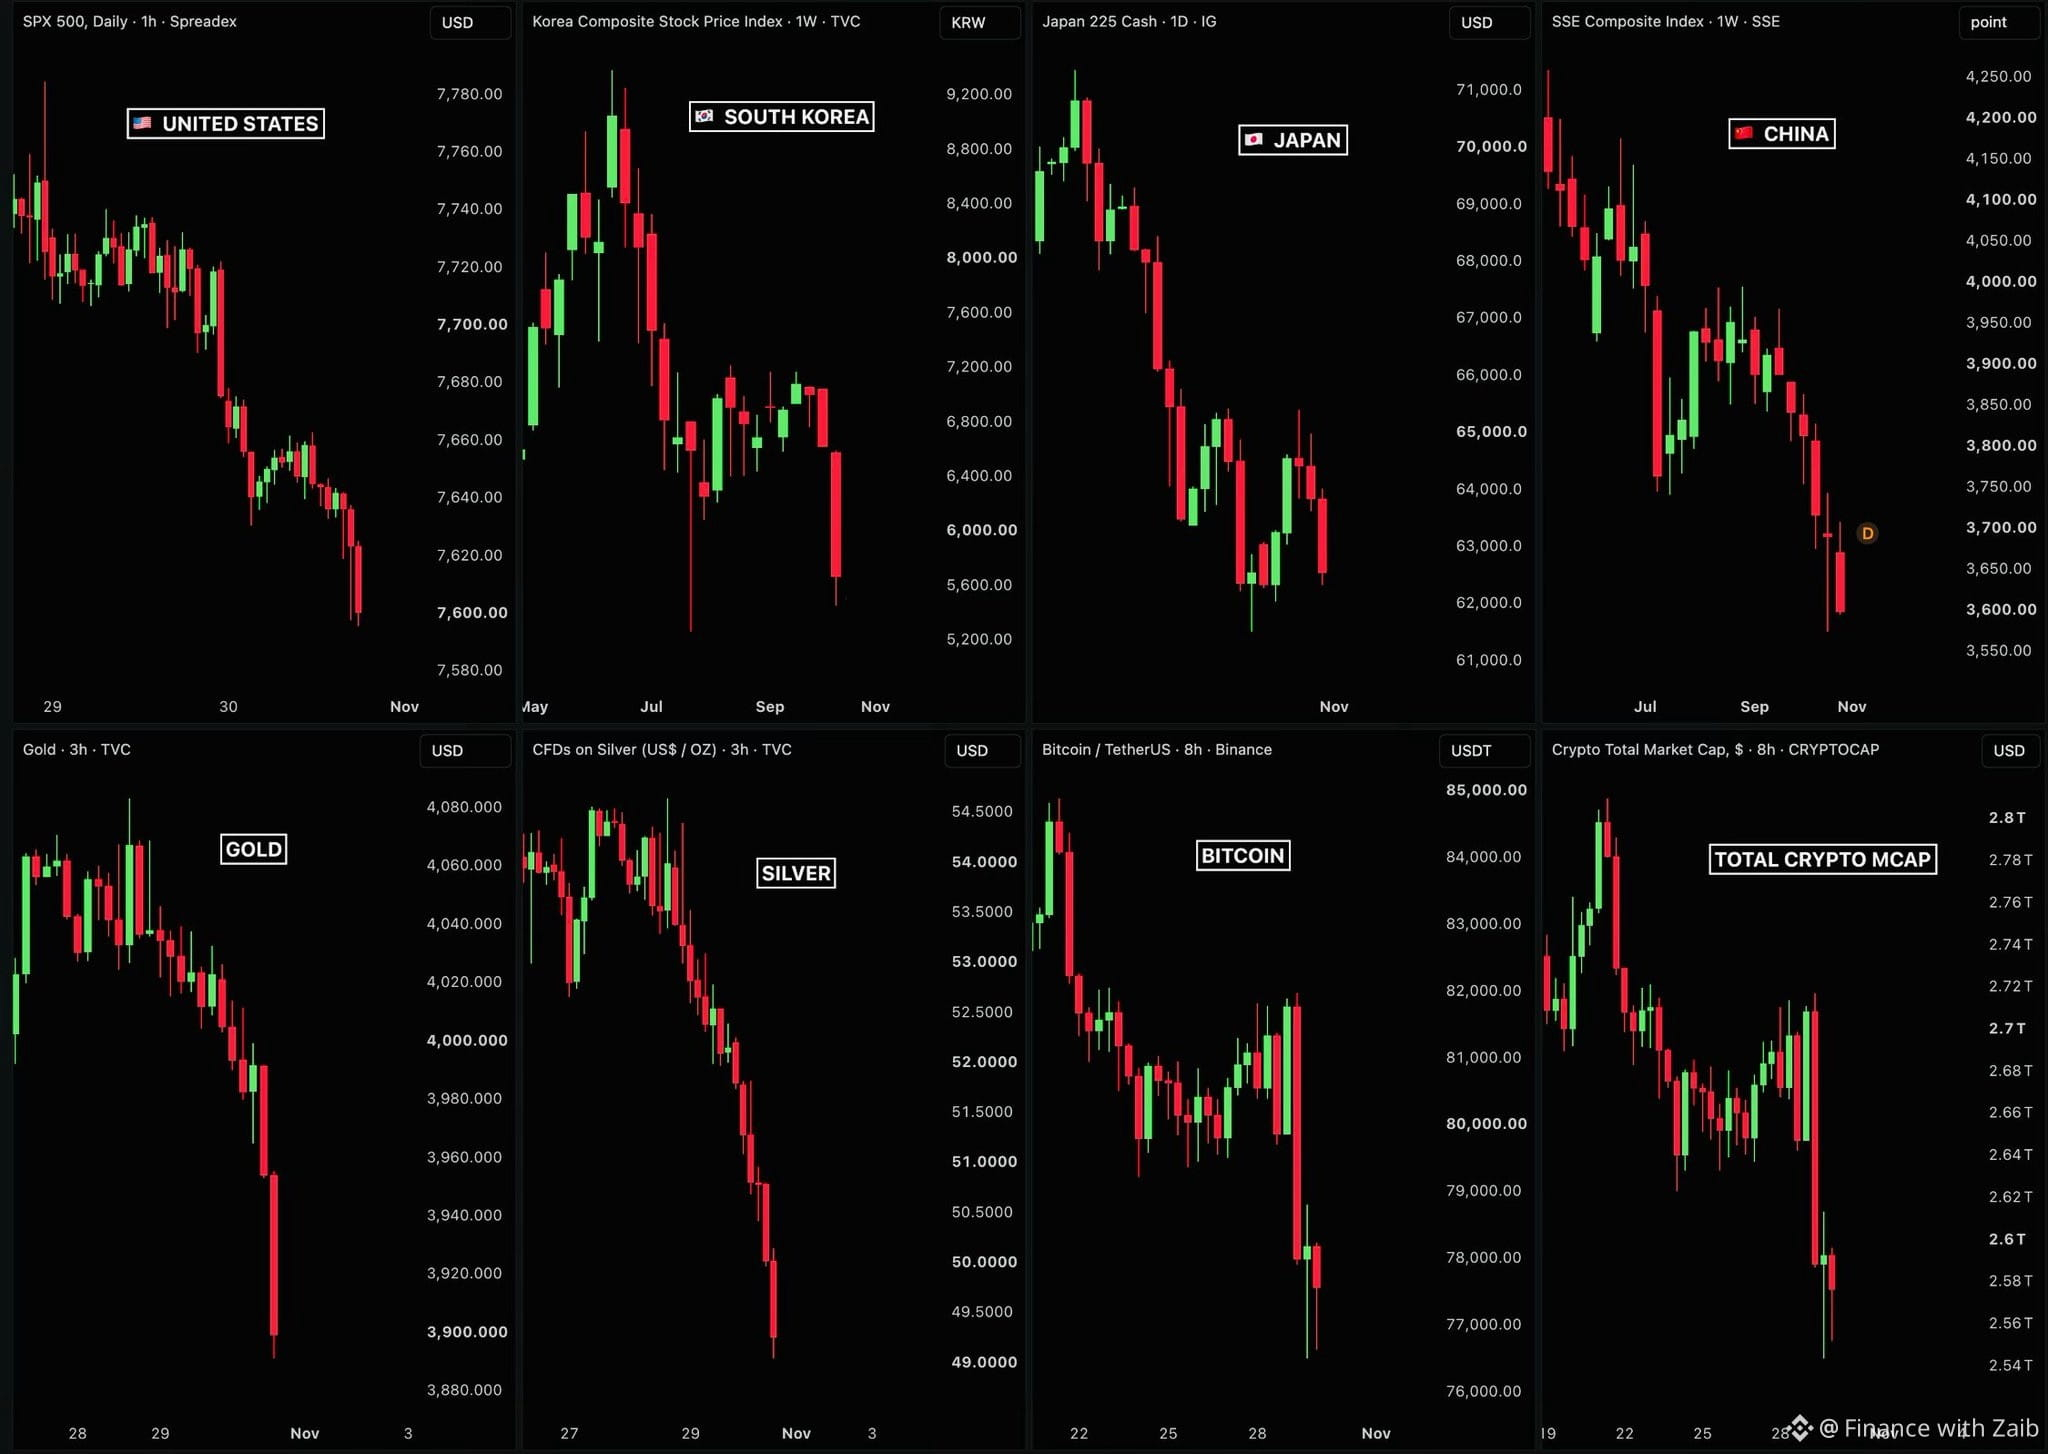
🚨 BLOODY FRIDAY: GLOBAL MARKETS ARE SELLING OFF! 📉
Global markets are under serious pressure today, and crypto isn't being spared.
🌎 STOCKS: Major markets across the US, Japan, South Korea, China, Taiwan, and Turkey are reportedly seeing massive losses.
🥇 $GOLD.US & SILVER: Precious metals are facing a sharp sell-off, raising questions about investor confidence and market sentiment.
₿ CRYPTO: Nearly $140 billion has reportedly disappeared from the crypto market, while concerns over a reported Binance security breach are adding to the uncertainty.
📉 BONDS: US Treasury yields are another key indicator to watch as investors reassess risk across financial markets.
BUT HERE'S THE BIG QUESTION 👇
Why are so many markets under pressure at the same time?
Is this simply a wave of panic selling, or are investors preparing for something bigger?
Geopolitical tensions, uncertainty around US politics, and fears of renewed US-Iran conflict could all be contributing to market anxiety — but none of these should be treated as the confirmed cause without stronger evidence.
⚠️ My take: In times like these, emotional decisions can be costly. Watch Bitcoin's price action, market liquidity, and trading volume before making a move. Don't assume every dip is a buying opportunity.
💬 What do you think?
Are we looking at a temporary market correction, or could this sell-off get worse?
#BinanceSquare #Crypto #Bitcoin #CryptoMarket #MarketCrash
$BTC
{spot}(BTCUSDT)
🚨 BLOODY FRIDAY: GLOBAL MARKETS ARE SELLING OFF! 📉
Global markets are under serious pressure today, and crypto isn't being spared.
🌎 STOCKS: Major markets across the US, Japan, South Korea, China, Taiwan, and Turkey are reportedly seeing massive losses.
🥇 $GOLD.US & SILVER: Precious metals are facing a sharp sell-off, raising questions about investor confidence and market sentiment.
₿ CRYPTO: Nearly $140 billion has reportedly disappeared from the crypto market, while concerns over a reported Binance security breach are adding to the uncertainty.
📉 BONDS: US Treasury yields are another key indicator to watch as investors reassess risk across financial markets.
BUT HERE'S THE BIG QUESTION 👇
Why are so many markets under pressure at the same time?
Is this simply a wave of panic selling, or are investors preparing for something bigger?
Geopolitical tensions, uncertainty around US politics, and fears of renewed US-Iran conflict could all be contributing to market anxiety — but none of these should be treated as the confirmed cause without stronger evidence.
⚠️ My take: In times like these, emotional decisions can be costly. Watch Bitcoin's price action, market liquidity, and trading volume before making a move. Don't assume every dip is a buying opportunity.
💬 What do you think?
Are we looking at a temporary market correction, or could this sell-off get worse?
#BinanceSquare #Crypto #Bitcoin #CryptoMarket #MarketCrash
$BTC
Global markets are under serious pressure today, and crypto isn't being spared.
🌎 STOCKS: Major markets across the US, Japan, South Korea, China, Taiwan, and Turkey are reportedly seeing massive losses.
🥇 $GOLD.US & SILVER: Precious metals are facing a sharp sell-off, raising questions about investor confidence and market sentiment.
₿ CRYPTO: Nearly $140 billion has reportedly disappeared from the crypto market, while concerns over a reported Binance security breach are adding to the uncertainty.
📉 BONDS: US Treasury yields are another key indicator to watch as investors reassess risk across financial markets.
BUT HERE'S THE BIG QUESTION 👇
Why are so many markets under pressure at the same time?
Is this simply a wave of panic selling, or are investors preparing for something bigger?
Geopolitical tensions, uncertainty around US politics, and fears of renewed US-Iran conflict could all be contributing to market anxiety — but none of these should be treated as the confirmed cause without stronger evidence.
⚠️ My take: In times like these, emotional decisions can be costly. Watch Bitcoin's price action, market liquidity, and trading volume before making a move. Don't assume every dip is a buying opportunity.
💬 What do you think?
Are we looking at a temporary market correction, or could this sell-off get worse?
#BinanceSquare #Crypto #Bitcoin #CryptoMarket #MarketCrash
$BTC
857
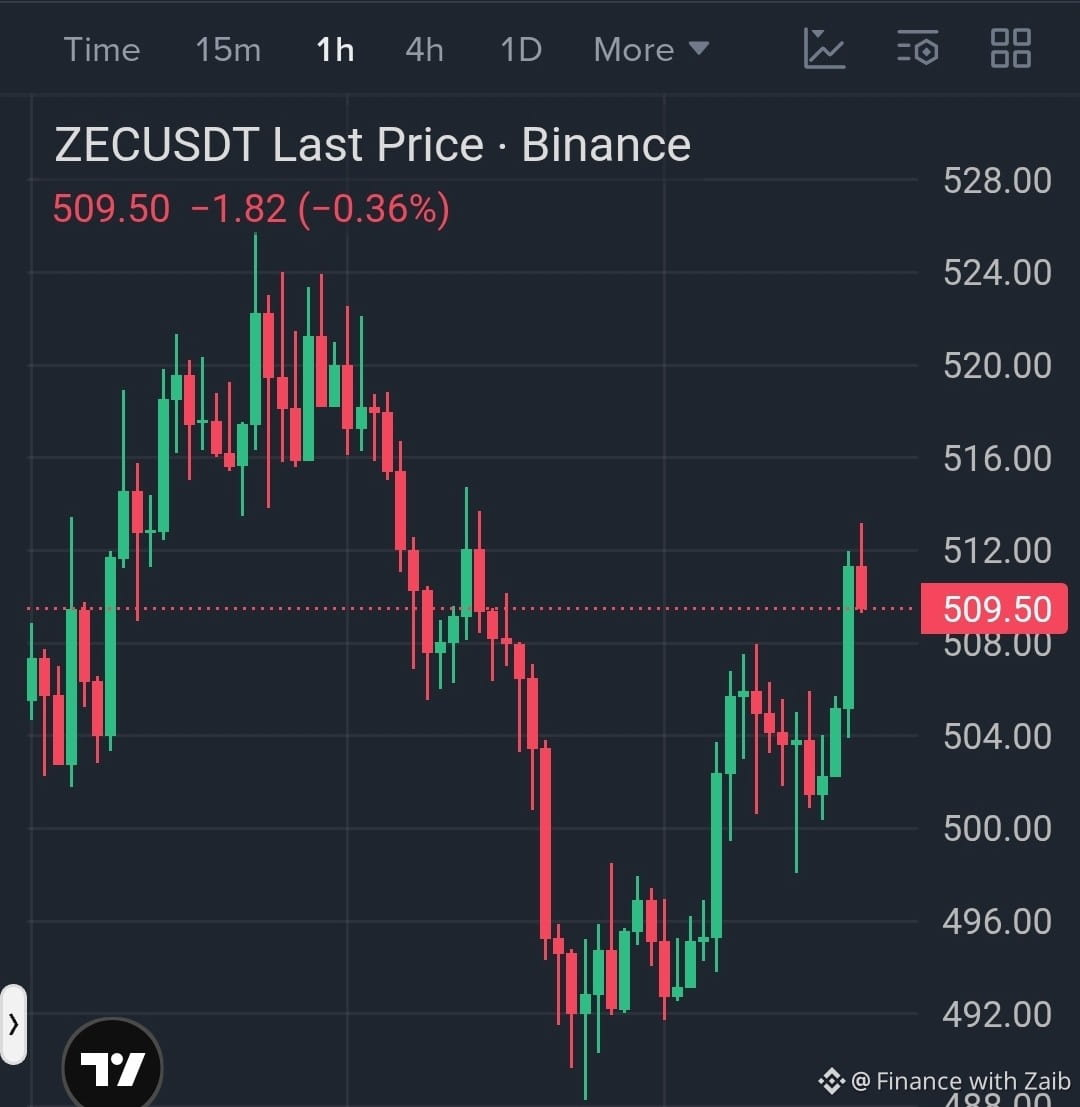
Zcash ( $ZEC ) is attempting a recovery after pulling back from its recent high near $525. Price action rebounded strongly off the $488 support zone and is currently holding ground around $509, showing renewed buyer interest on the 1-hour chart.
Key Support sits in the $488–$490 demand zone, which buyers successfully defended. On the upside, immediate Resistance is located at $513–$515, with major resistance higher up near $525.
A sustained hourly close above $515 could open the door for another push toward $525. However, if rejected, look for potential consolidation or a pullback to test the $500 psychological support. Trade smart with a stop-loss.
{future}(ZECUSDT)
Zcash ( $ZEC ) is attempting a recovery after pulling back from its recent high near $525. Price action rebounded strongly off the $488 support zone and is currently holding ground around $509, showing renewed buyer interest on the 1-hour chart.
Key Support sits in the $488–$490 demand zone, which buyers successfully defended. On the upside, immediate Resistance is located at $513–$515, with major resistance higher up near $525.
A sustained hourly close above $515 could open the door for another push toward $525. However, if rejected, look for potential consolidation or a pullback to test the $500 psychological support. Trade smart with a stop-loss.
Key Support sits in the $488–$490 demand zone, which buyers successfully defended. On the upside, immediate Resistance is located at $513–$515, with major resistance higher up near $525.
A sustained hourly close above $515 could open the door for another push toward $525. However, if rejected, look for potential consolidation or a pullback to test the $500 psychological support. Trade smart with a stop-loss.
1
114
Log in to explore more content
Join global crypto users on Binance Square
⚡️ Get latest and useful information about crypto.
💬 Trusted by the world’s largest crypto exchange.
👍 Discover real insights from verified creators.
Email / Phone number
Trending Topics
WhatWillDriveCryptoandStocks’NextRebound?
73,208 views
1,012 Discussing
Bitcoin Slips Below $70,000 as Dollar Index Hits 19-Month High
Binance News
·19 Likes
·39.2k views
BitcoinBreaksBelow200WeekMovingAverage
1,854 views
84 Discussing
SpaceXTeslaMergerTalksWouldCombine30220BTC
104 views
20 Discussing