

Crypto心诚
1.9k Posts

Crypto心诚
Report
Block User
BTC/ETH行情技术分析与市场趋势研判,主做长期资产管理,点下方聊天框进入聊天室 永久20%返佣邀请码:DFUIJVHH

BTC Holder
Frequent Trader
5.4 Years
32 Following
3.8K+ Followers
3.2K+ Liked
Posts
All
Quotes
Videos
Live
PINNED
·
--

Article
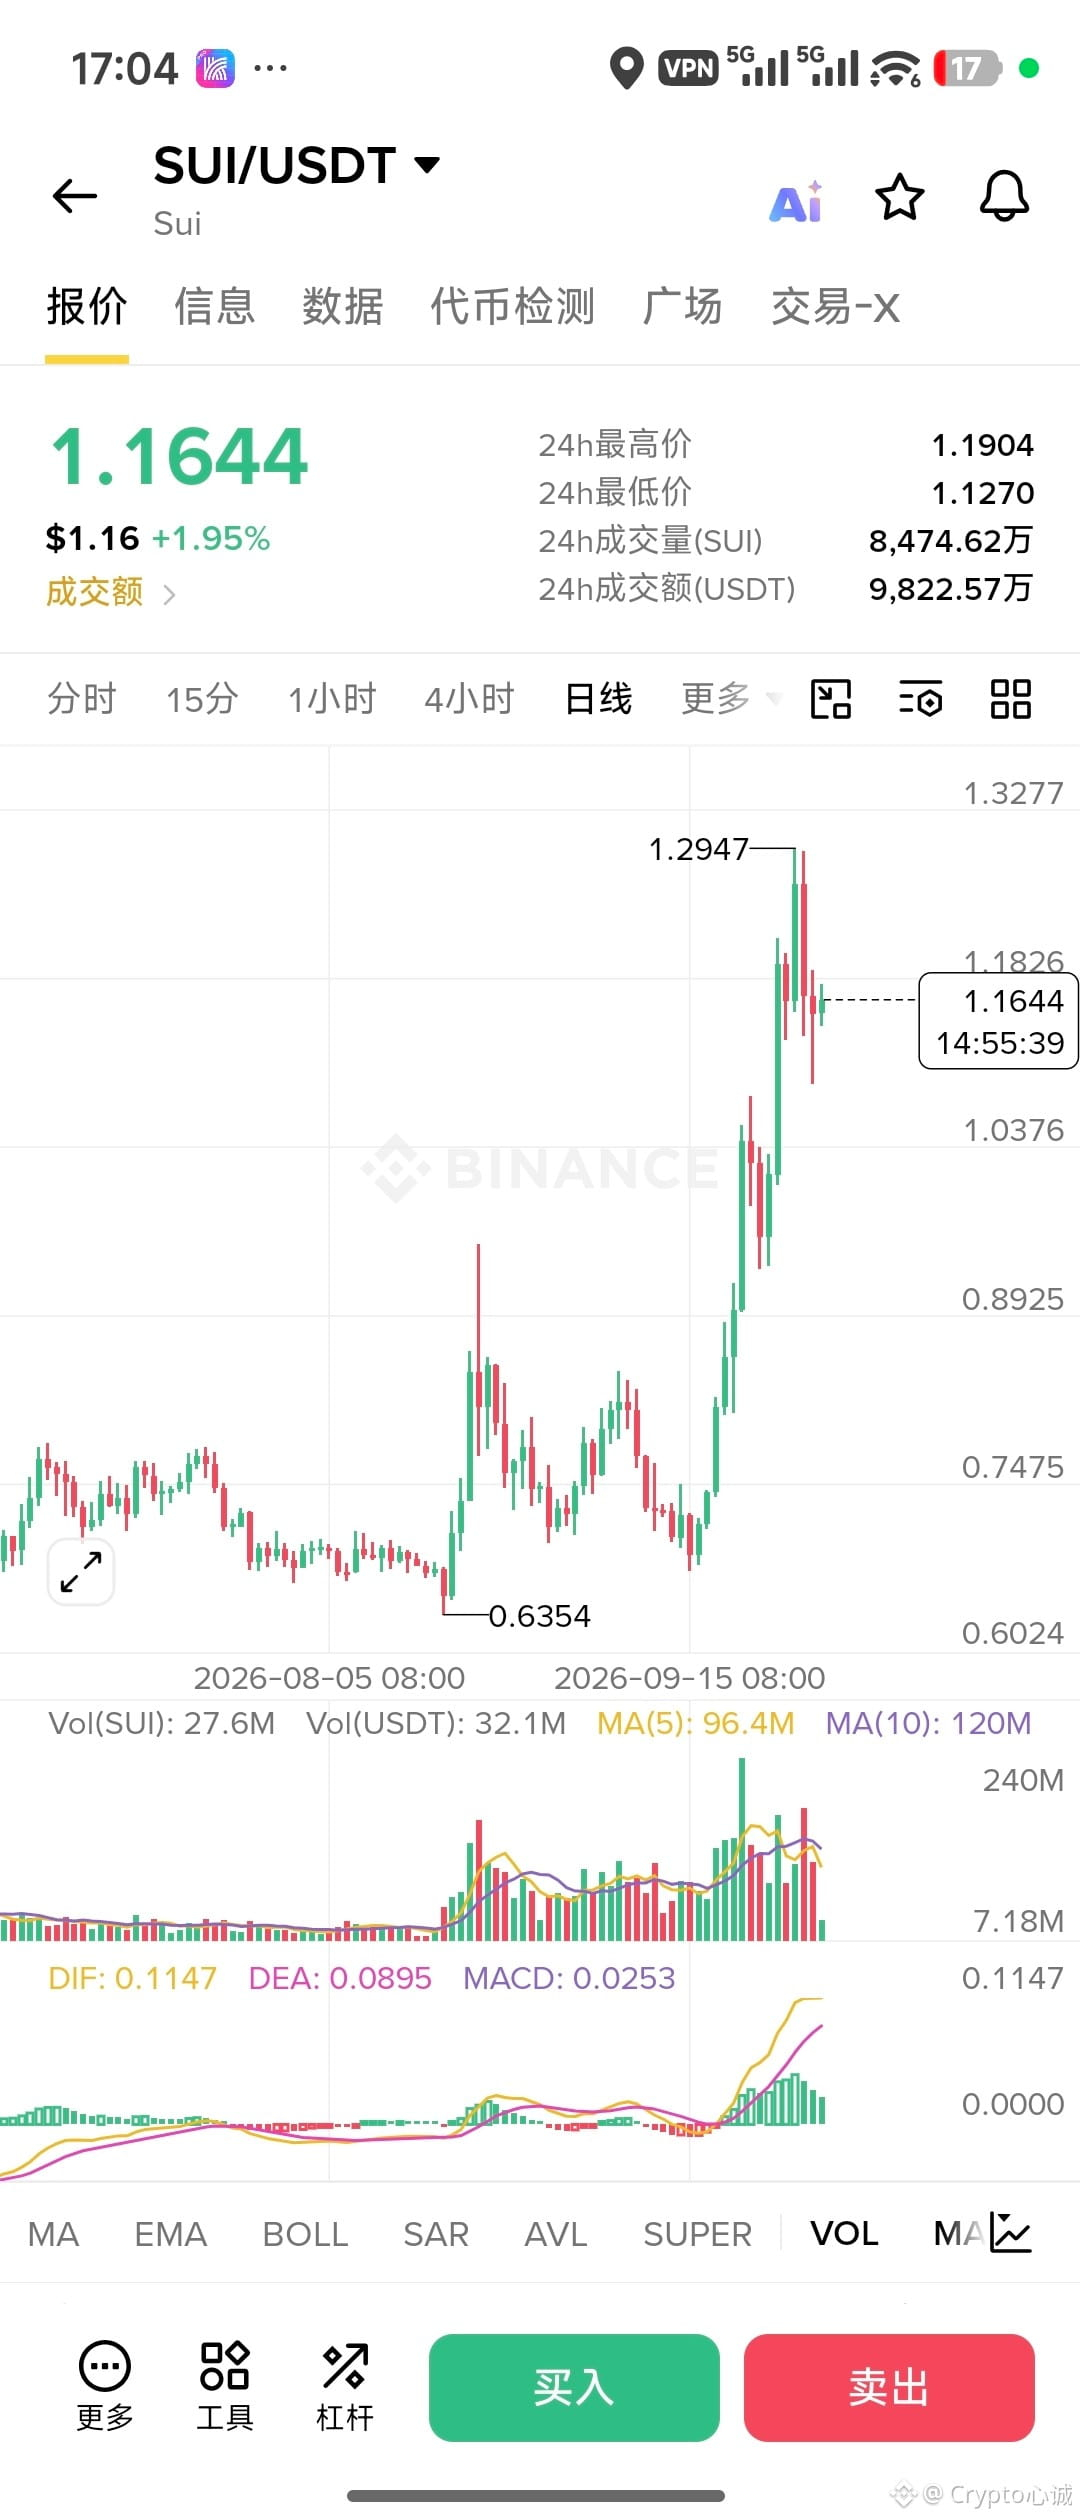
The altcoins and U.S. stocks I like most in this cycleMany people in the livestream asked: In this cycle, which alternative coins do I think will do well? I personally have a group I’m keeping an eye on. I’ll screenshot it for everyone in a moment, and I’ll also explain my reasons!
👉 Here, please note that the content is for reference only and does not constitute investment advice
Crypto altcoins:
① SUI
Target price: $9
Reason: It uses the object model and the Move language to make native capabilities out of parallel execution, asset safety, and sub-second confirmations. Then it layers on stablecoin payments, institutional channels, and gaming/high-frequency application scenarios—making it closer than most other chains to being able to truly run large-scale on-chain applications for the next-gen L1.
The altcoins and U.S. stocks I like most in this cycle
Many people in the livestream asked: In this cycle, which alternative coins do I think will do well? I personally have a group I’m keeping an eye on. I’ll screenshot it for everyone in a moment, and I’ll also explain my reasons!
👉 Here, please note that the content is for reference only and does not constitute investment advice
Crypto altcoins:
① SUI
Target price: $9
Reason: It uses the object model and the Move language to make native capabilities out of parallel execution, asset safety, and sub-second confirmations. Then it layers on stablecoin payments, institutional channels, and gaming/high-frequency application scenarios—making it closer than most other chains to being able to truly run large-scale on-chain applications for the next-gen L1.
👉 Here, please note that the content is for reference only and does not constitute investment advice
Crypto altcoins:
① SUI
Target price: $9
Reason: It uses the object model and the Move language to make native capabilities out of parallel execution, asset safety, and sub-second confirmations. Then it layers on stablecoin payments, institutional channels, and gaming/high-frequency application scenarios—making it closer than most other chains to being able to truly run large-scale on-chain applications for the next-gen L1.
1
1
7
3.9k
PINNED
·
--
🚀 BTC Market Helper Group
Focused on real-time Bitcoin updates, market analysis, and trading ideas sharing!
From time to time, there are technical discussions, opportunity shares, and risk alerts here. Welcome to communicate rationally and learn from each other.
Permanent 20% off trading fees. Invitation code DFUIJVHH—saving enough in a year to cover a car
Wishing everyone smooth trading and continuous wealth ~
$BTC
{future}(BTCUSDT)
🚀 BTC Market Helper Group
Focused on real-time Bitcoin updates, market analysis, and trading ideas sharing!
From time to time, there are technical discussions, opportunity shares, and risk alerts here. Welcome to communicate rationally and learn from each other.
Permanent 20% off trading fees. Invitation code DFUIJVHH—saving enough in a year to cover a car
Wishing everyone smooth trading and continuous wealth ~
$BTC
Focused on real-time Bitcoin updates, market analysis, and trading ideas sharing!
From time to time, there are technical discussions, opportunity shares, and risk alerts here. Welcome to communicate rationally and learn from each other.
Permanent 20% off trading fees. Invitation code DFUIJVHH—saving enough in a year to cover a car
Wishing everyone smooth trading and continuous wealth ~
$BTC


3
106
·
--
On this round of public chains, I’ll concentrate my positions in ETH and SOL, with SUI as a satellite holding. Most of the others are rotation trades, not core positions.
ETH
The settlement layer, stablecoins, DeFi, RWA, and ETF-related capital are the thickest. Its upside may not be the highest elasticity, but it’s the hardest to replace. It’s suitable to serve as a core holding for public-chain exposure.
SOL
Stronger on-chain activity, fees, consumer-grade applications, and DEX volumes—but also more volatility. In bull markets, SOL’s elasticity is usually better than ETH, but drawdowns can be harsher.
SUI
People are still talking about the technical narrative and high performance. Its elasticity could be bigger than the first two, but its market size is smaller, and the risks around token unlocks and ecosystem realization are also higher. Only suitable for a small position.
Not as the main theme for this round: most older public chains (ADA, DOT, ATOM, etc.) don’t have a new-money narrative; AVAX and TON and NEAR can be rotated into, but they’re not worth giving the same weight as ETH/SOL.
In one sentence: core position ETH, offensive stance SOL—only to reach for elasticity with SUI
$SUI
{future}(SUIUSDT)
$ETH
{future}(ETHUSDT)
$SOL
{future}(SOLUSDT)
On this round of public chains, I’ll concentrate my positions in ETH and SOL, with SUI as a satellite holding. Most of the others are rotation trades, not core positions.
ETH
The settlement layer, stablecoins, DeFi, RWA, and ETF-related capital are the thickest. Its upside may not be the highest elasticity, but it’s the hardest to replace. It’s suitable to serve as a core holding for public-chain exposure.
SOL
Stronger on-chain activity, fees, consumer-grade applications, and DEX volumes—but also more volatility. In bull markets, SOL’s elasticity is usually better than ETH, but drawdowns can be harsher.
SUI
People are still talking about the technical narrative and high performance. Its elasticity could be bigger than the first two, but its market size is smaller, and the risks around token unlocks and ecosystem realization are also higher. Only suitable for a small position.
Not as the main theme for this round: most older public chains (ADA, DOT, ATOM, etc.) don’t have a new-money narrative; AVAX and TON and NEAR can be rotated into, but they’re not worth giving the same weight as ETH/SOL.
In one sentence: core position ETH, offensive stance SOL—only to reach for elasticity with SUI
$SUI
$ETH
$SOL
ETH
The settlement layer, stablecoins, DeFi, RWA, and ETF-related capital are the thickest. Its upside may not be the highest elasticity, but it’s the hardest to replace. It’s suitable to serve as a core holding for public-chain exposure.
SOL
Stronger on-chain activity, fees, consumer-grade applications, and DEX volumes—but also more volatility. In bull markets, SOL’s elasticity is usually better than ETH, but drawdowns can be harsher.
SUI
People are still talking about the technical narrative and high performance. Its elasticity could be bigger than the first two, but its market size is smaller, and the risks around token unlocks and ecosystem realization are also higher. Only suitable for a small position.
Not as the main theme for this round: most older public chains (ADA, DOT, ATOM, etc.) don’t have a new-money narrative; AVAX and TON and NEAR can be rotated into, but they’re not worth giving the same weight as ETH/SOL.
In one sentence: core position ETH, offensive stance SOL—only to reach for elasticity with SUI
$SUI
$ETH
$SOL
757
·
--
The market has fallen into an “integration/distribution” phase again—along with a boring range-bound行情. In this phase, the easiest way to lose money isn’t getting the direction wrong; it’s having an urge to trade, using high leverage, and chasing pumps while panic-selling dips.
What you should do most in a consolidation period:
1. Preserve capital first: reduce leverage, control position size
High leverage in a range market is the fastest way to get hit from both sides. Cut your position down to a level where you can withstand a 20%–30% drawdown without panicking. Having no position is far more comfortable than being fully invested and getting swept back and forth.
2. Move less: don’t treat the range as a trend
The most money-losing actions in consolidation are: after a small rebound, you chase longs; after a small pullback, you cut losses or open shorts. Unless you’re clearly doing high-sell/low-buy within a range, the default strategy is to trade less. Until the direction is confirmed, standing by is also a position.
3. If there’s a long-term thesis, use DCA / buy in batches—not all-in at once
If you already believe in core assets like BTC/ETH, consolidation is a better time to buy in batches than to wait for the “absolute bottom.” For altcoins without a long-term thesis, you should prioritize avoiding them during a range—liquidity is thinner, and they tend to fall faster than they rise.
4. Shift your attention from the order book to structure and data
What truly moves the market right now is macro conditions and liquidity, not any single K-line pattern. Today’s focus should be PCE and rate expectations. On the chart, watch key levels (roughly 82,000 as support, and 85,000–87,000 as resistance) to see whether they’re being decisively broken—not every single 15-minute candle.
5. Protect your mindset more than predicting the next K-line
What consolidation drains the most is patience and discipline. If you’re sleeping poorly and constantly checking the screen to the point that your hands shake, it means your position size is already beyond what you can tolerate. Reduce it if you should; close the software if you need to.
In one sentence: In a consolidation period, the most important thing is to reduce risk, trade less, and save your money and energy for the real trend. Once the direction is clearly established, increasing your actions won’t be too late.
$BTC
{future}(BTCUSDT)
The market has fallen into an “integration/distribution” phase again—along with a boring range-bound行情. In this phase, the easiest way to lose money isn’t getting the direction wrong; it’s having an urge to trade, using high leverage, and chasing pumps while panic-selling dips.
What you should do most in a consolidation period:
1. Preserve capital first: reduce leverage, control position size
High leverage in a range market is the fastest way to get hit from both sides. Cut your position down to a level where you can withstand a 20%–30% drawdown without panicking. Having no position is far more comfortable than being fully invested and getting swept back and forth.
2. Move less: don’t treat the range as a trend
The most money-losing actions in consolidation are: after a small rebound, you chase longs; after a small pullback, you cut losses or open shorts. Unless you’re clearly doing high-sell/low-buy within a range, the default strategy is to trade less. Until the direction is confirmed, standing by is also a position.
3. If there’s a long-term thesis, use DCA / buy in batches—not all-in at once
If you already believe in core assets like BTC/ETH, consolidation is a better time to buy in batches than to wait for the “absolute bottom.” For altcoins without a long-term thesis, you should prioritize avoiding them during a range—liquidity is thinner, and they tend to fall faster than they rise.
4. Shift your attention from the order book to structure and data
What truly moves the market right now is macro conditions and liquidity, not any single K-line pattern. Today’s focus should be PCE and rate expectations. On the chart, watch key levels (roughly 82,000 as support, and 85,000–87,000 as resistance) to see whether they’re being decisively broken—not every single 15-minute candle.
5. Protect your mindset more than predicting the next K-line
What consolidation drains the most is patience and discipline. If you’re sleeping poorly and constantly checking the screen to the point that your hands shake, it means your position size is already beyond what you can tolerate. Reduce it if you should; close the software if you need to.
In one sentence: In a consolidation period, the most important thing is to reduce risk, trade less, and save your money and energy for the real trend. Once the direction is clearly established, increasing your actions won’t be too late.
$BTC
What you should do most in a consolidation period:
1. Preserve capital first: reduce leverage, control position size
High leverage in a range market is the fastest way to get hit from both sides. Cut your position down to a level where you can withstand a 20%–30% drawdown without panicking. Having no position is far more comfortable than being fully invested and getting swept back and forth.
2. Move less: don’t treat the range as a trend
The most money-losing actions in consolidation are: after a small rebound, you chase longs; after a small pullback, you cut losses or open shorts. Unless you’re clearly doing high-sell/low-buy within a range, the default strategy is to trade less. Until the direction is confirmed, standing by is also a position.
3. If there’s a long-term thesis, use DCA / buy in batches—not all-in at once
If you already believe in core assets like BTC/ETH, consolidation is a better time to buy in batches than to wait for the “absolute bottom.” For altcoins without a long-term thesis, you should prioritize avoiding them during a range—liquidity is thinner, and they tend to fall faster than they rise.
4. Shift your attention from the order book to structure and data
What truly moves the market right now is macro conditions and liquidity, not any single K-line pattern. Today’s focus should be PCE and rate expectations. On the chart, watch key levels (roughly 82,000 as support, and 85,000–87,000 as resistance) to see whether they’re being decisively broken—not every single 15-minute candle.
5. Protect your mindset more than predicting the next K-line
What consolidation drains the most is patience and discipline. If you’re sleeping poorly and constantly checking the screen to the point that your hands shake, it means your position size is already beyond what you can tolerate. Reduce it if you should; close the software if you need to.
In one sentence: In a consolidation period, the most important thing is to reduce risk, trade less, and save your money and energy for the real trend. Once the direction is clearly established, increasing your actions won’t be too late.
$BTC

267
·
--
September 30, $BTC Comprehensive Market Analysis
✊ News:
Geopolitics and risk appetite: Trump refused to comment on a potential Iran ceasefire, and the market has re-priced “energy re-inflation + Middle East uncertainty.”
A tighter interest-rate path: September already saw a rate hike, and then PMI and oil prices boosted expectations of “another hike / higher for longer.”
Company buying remains: Strategy disclosed that it bought another 1,665 BTC last week at an average price of about $85,681, totaling about $142.7 million. This directly confirms the cost base zone of $84,000–$86,000.
✊ Flows:
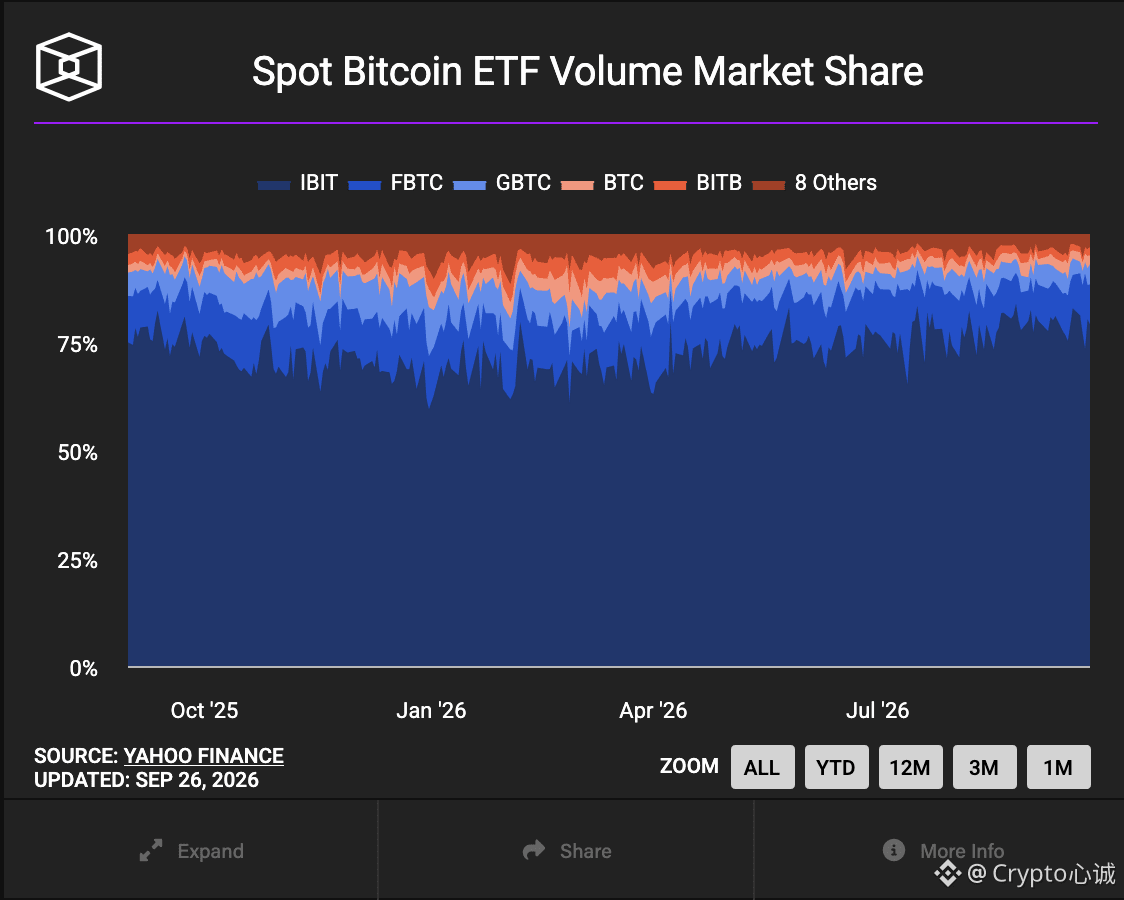
Last week (9/21–25) saw total inflows of about $2.4 billion, the strongest single week since October 2025, and it helped keep cumulative 2026 fund flows positive. The structure yesterday was: BlackRock’s IBIT still net-bought roughly $54.8 million; Grayscale’s GBTC and Fidelity’s FBTC saw redemptions. After netting out, the result was only about $31 million in net inflows.
Derivatives: Across the whole market, total futures open interest is on the order of about $33 billion. Most exchanges’ funding rates are slightly positive, indicating that there is long positioning but it’s not extremely crowded.
✊ Technicals:
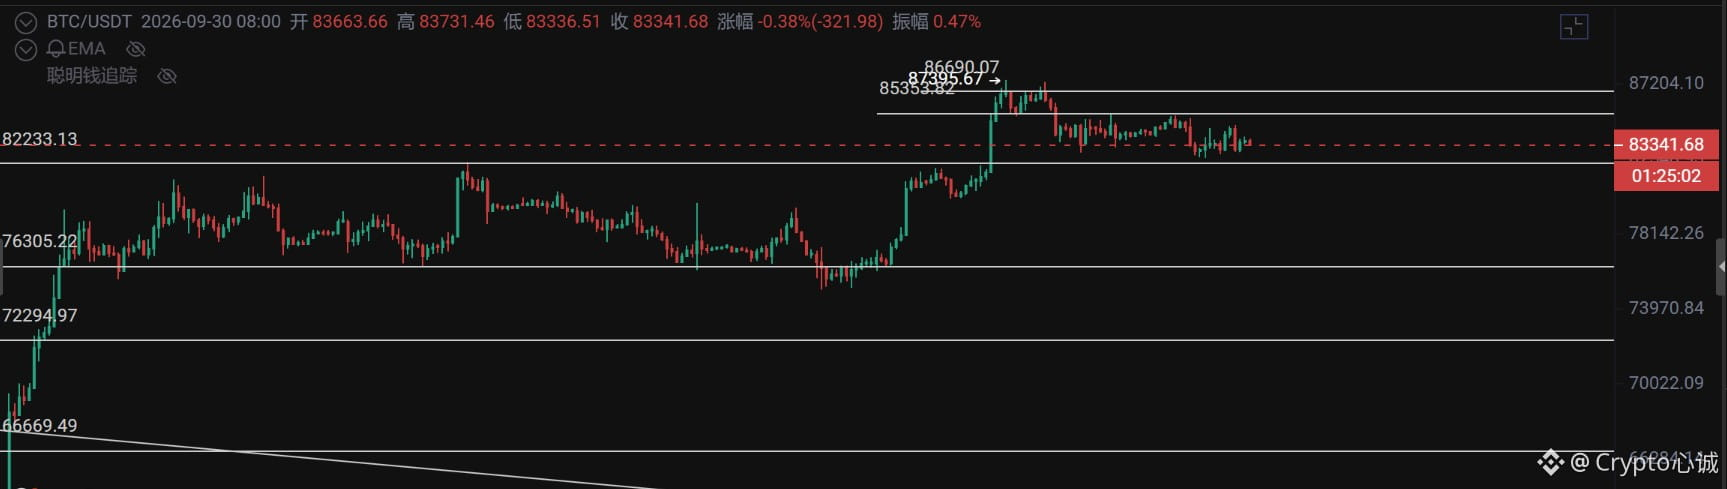
On September 21, I already mentioned this level: even if price moves up, you should pay attention to potential daily bearish divergence. In the past couple of days, this level has also reminded you to watch whether 85,300 can hold. If it cannot hold, you should pay attention to the downside risk. The biggest uncertainty in the market right now is the daily divergence. Therefore, at this level, time is needed for repair—either continue to consolidate sideways toward the right (time-wise), or pull back first for a healthy retracement, and then move up again. So, to summarize: intraday, as long as it does not break above 85,300, we still expect a decline. Support is expected around 82,200–80,500.
$BTC
{future}(BTCUSDT)
September 30, $BTC Comprehensive Market Analysis
✊ News:
Geopolitics and risk appetite: Trump refused to comment on a potential Iran ceasefire, and the market has re-priced “energy re-inflation + Middle East uncertainty.”
A tighter interest-rate path: September already saw a rate hike, and then PMI and oil prices boosted expectations of “another hike / higher for longer.”
Company buying remains: Strategy disclosed that it bought another 1,665 BTC last week at an average price of about $85,681, totaling about $142.7 million. This directly confirms the cost base zone of $84,000–$86,000.
✊ Flows:
Last week (9/21–25) saw total inflows of about $2.4 billion, the strongest single week since October 2025, and it helped keep cumulative 2026 fund flows positive. The structure yesterday was: BlackRock’s IBIT still net-bought roughly $54.8 million; Grayscale’s GBTC and Fidelity’s FBTC saw redemptions. After netting out, the result was only about $31 million in net inflows.
Derivatives: Across the whole market, total futures open interest is on the order of about $33 billion. Most exchanges’ funding rates are slightly positive, indicating that there is long positioning but it’s not extremely crowded.
✊ Technicals:
On September 21, I already mentioned this level: even if price moves up, you should pay attention to potential daily bearish divergence. In the past couple of days, this level has also reminded you to watch whether 85,300 can hold. If it cannot hold, you should pay attention to the downside risk. The biggest uncertainty in the market right now is the daily divergence. Therefore, at this level, time is needed for repair—either continue to consolidate sideways toward the right (time-wise), or pull back first for a healthy retracement, and then move up again. So, to summarize: intraday, as long as it does not break above 85,300, we still expect a decline. Support is expected around 82,200–80,500.
$BTC
✊ News:
Geopolitics and risk appetite: Trump refused to comment on a potential Iran ceasefire, and the market has re-priced “energy re-inflation + Middle East uncertainty.”
A tighter interest-rate path: September already saw a rate hike, and then PMI and oil prices boosted expectations of “another hike / higher for longer.”
Company buying remains: Strategy disclosed that it bought another 1,665 BTC last week at an average price of about $85,681, totaling about $142.7 million. This directly confirms the cost base zone of $84,000–$86,000.
✊ Flows:
Last week (9/21–25) saw total inflows of about $2.4 billion, the strongest single week since October 2025, and it helped keep cumulative 2026 fund flows positive. The structure yesterday was: BlackRock’s IBIT still net-bought roughly $54.8 million; Grayscale’s GBTC and Fidelity’s FBTC saw redemptions. After netting out, the result was only about $31 million in net inflows.
Derivatives: Across the whole market, total futures open interest is on the order of about $33 billion. Most exchanges’ funding rates are slightly positive, indicating that there is long positioning but it’s not extremely crowded.
✊ Technicals:
On September 21, I already mentioned this level: even if price moves up, you should pay attention to potential daily bearish divergence. In the past couple of days, this level has also reminded you to watch whether 85,300 can hold. If it cannot hold, you should pay attention to the downside risk. The biggest uncertainty in the market right now is the daily divergence. Therefore, at this level, time is needed for repair—either continue to consolidate sideways toward the right (time-wise), or pull back first for a healthy retracement, and then move up again. So, to summarize: intraday, as long as it does not break above 85,300, we still expect a decline. Support is expected around 82,200–80,500.
$BTC
283
·
--
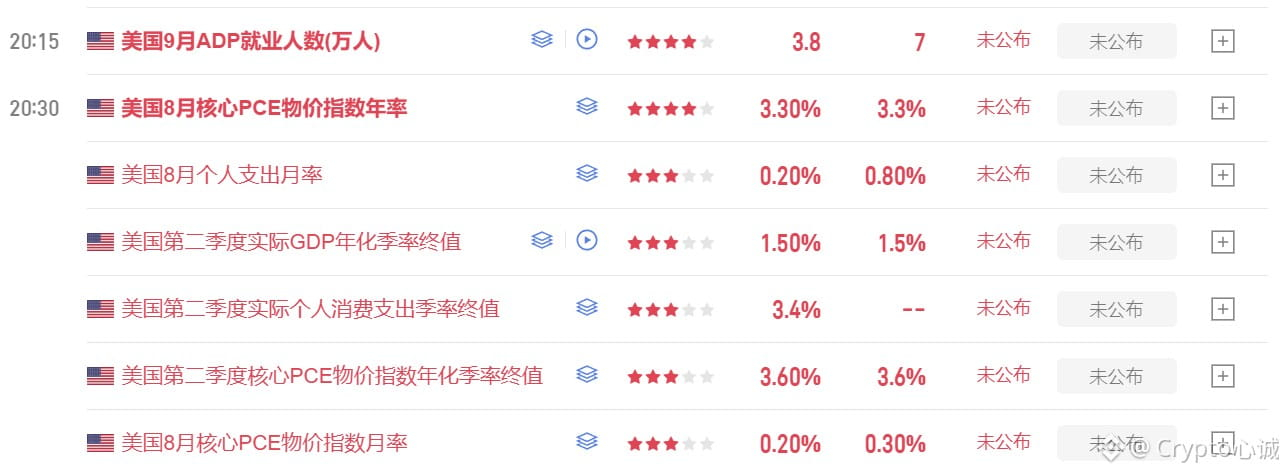
September 30 at 20:30 will be when the August PCE data is released.
This is the first complete inflation reading after the rate hike.
Personal take:
The core month-over-month is very likely to land around 0.2%–0.3%, with the year-over-year at 3.3%–3.4%. It’s closer to “sticky and slightly hot,” not a sudden cooldown.
There are three possible scenarios:
① In line with expectations (core 0.3% / 3.4%)
The market has already priced in some of it. U.S. Treasuries and the dollar may pop first in the short term, but the real direction is still driven by Friday’s Nonfarm Payrolls. For the October FOMC, it’s “stay hawkish, but don’t change the script immediately.”
② Hotter (core ≥0.3% and the services sub-component turns up; YoY tops out at 3.5%)
This is the most uncomfortable combination for risk assets: the first data point after a rate hike is still accelerating. The probability of another hike in October would be pushed higher again. U.S. Treasury yields and the dollar strengthen, while growth stocks and gold get hit first.
③ Looks colder, but it’s really revisions
The YoY is revised down to around 3.2% due to methodology adjustments, but the month-over-month remains 0.3%. The headline will look great. If trading desks buy risk assets first, then dig into the details, the initial optimism will get unwound. This “fake cooldown” is the most dangerous.
One-line takeaway: Tomorrow is likely to be slightly hot—tradable—but it won’t change the bigger picture for October staying relatively tight.
$BTC
{future}(BTCUSDT)
September 30 at 20:30 will be when the August PCE data is released.
This is the first complete inflation reading after the rate hike.
Personal take:
The core month-over-month is very likely to land around 0.2%–0.3%, with the year-over-year at 3.3%–3.4%. It’s closer to “sticky and slightly hot,” not a sudden cooldown.
There are three possible scenarios:
① In line with expectations (core 0.3% / 3.4%)
The market has already priced in some of it. U.S. Treasuries and the dollar may pop first in the short term, but the real direction is still driven by Friday’s Nonfarm Payrolls. For the October FOMC, it’s “stay hawkish, but don’t change the script immediately.”
② Hotter (core ≥0.3% and the services sub-component turns up; YoY tops out at 3.5%)
This is the most uncomfortable combination for risk assets: the first data point after a rate hike is still accelerating. The probability of another hike in October would be pushed higher again. U.S. Treasury yields and the dollar strengthen, while growth stocks and gold get hit first.
③ Looks colder, but it’s really revisions
The YoY is revised down to around 3.2% due to methodology adjustments, but the month-over-month remains 0.3%. The headline will look great. If trading desks buy risk assets first, then dig into the details, the initial optimism will get unwound. This “fake cooldown” is the most dangerous.
One-line takeaway: Tomorrow is likely to be slightly hot—tradable—but it won’t change the bigger picture for October staying relatively tight.
$BTC
This is the first complete inflation reading after the rate hike.
Personal take:
The core month-over-month is very likely to land around 0.2%–0.3%, with the year-over-year at 3.3%–3.4%. It’s closer to “sticky and slightly hot,” not a sudden cooldown.
There are three possible scenarios:
① In line with expectations (core 0.3% / 3.4%)
The market has already priced in some of it. U.S. Treasuries and the dollar may pop first in the short term, but the real direction is still driven by Friday’s Nonfarm Payrolls. For the October FOMC, it’s “stay hawkish, but don’t change the script immediately.”
② Hotter (core ≥0.3% and the services sub-component turns up; YoY tops out at 3.5%)
This is the most uncomfortable combination for risk assets: the first data point after a rate hike is still accelerating. The probability of another hike in October would be pushed higher again. U.S. Treasury yields and the dollar strengthen, while growth stocks and gold get hit first.
③ Looks colder, but it’s really revisions
The YoY is revised down to around 3.2% due to methodology adjustments, but the month-over-month remains 0.3%. The headline will look great. If trading desks buy risk assets first, then dig into the details, the initial optimism will get unwound. This “fake cooldown” is the most dangerous.
One-line takeaway: Tomorrow is likely to be slightly hot—tradable—but it won’t change the bigger picture for October staying relatively tight.
$BTC
2
1.6k
·
--
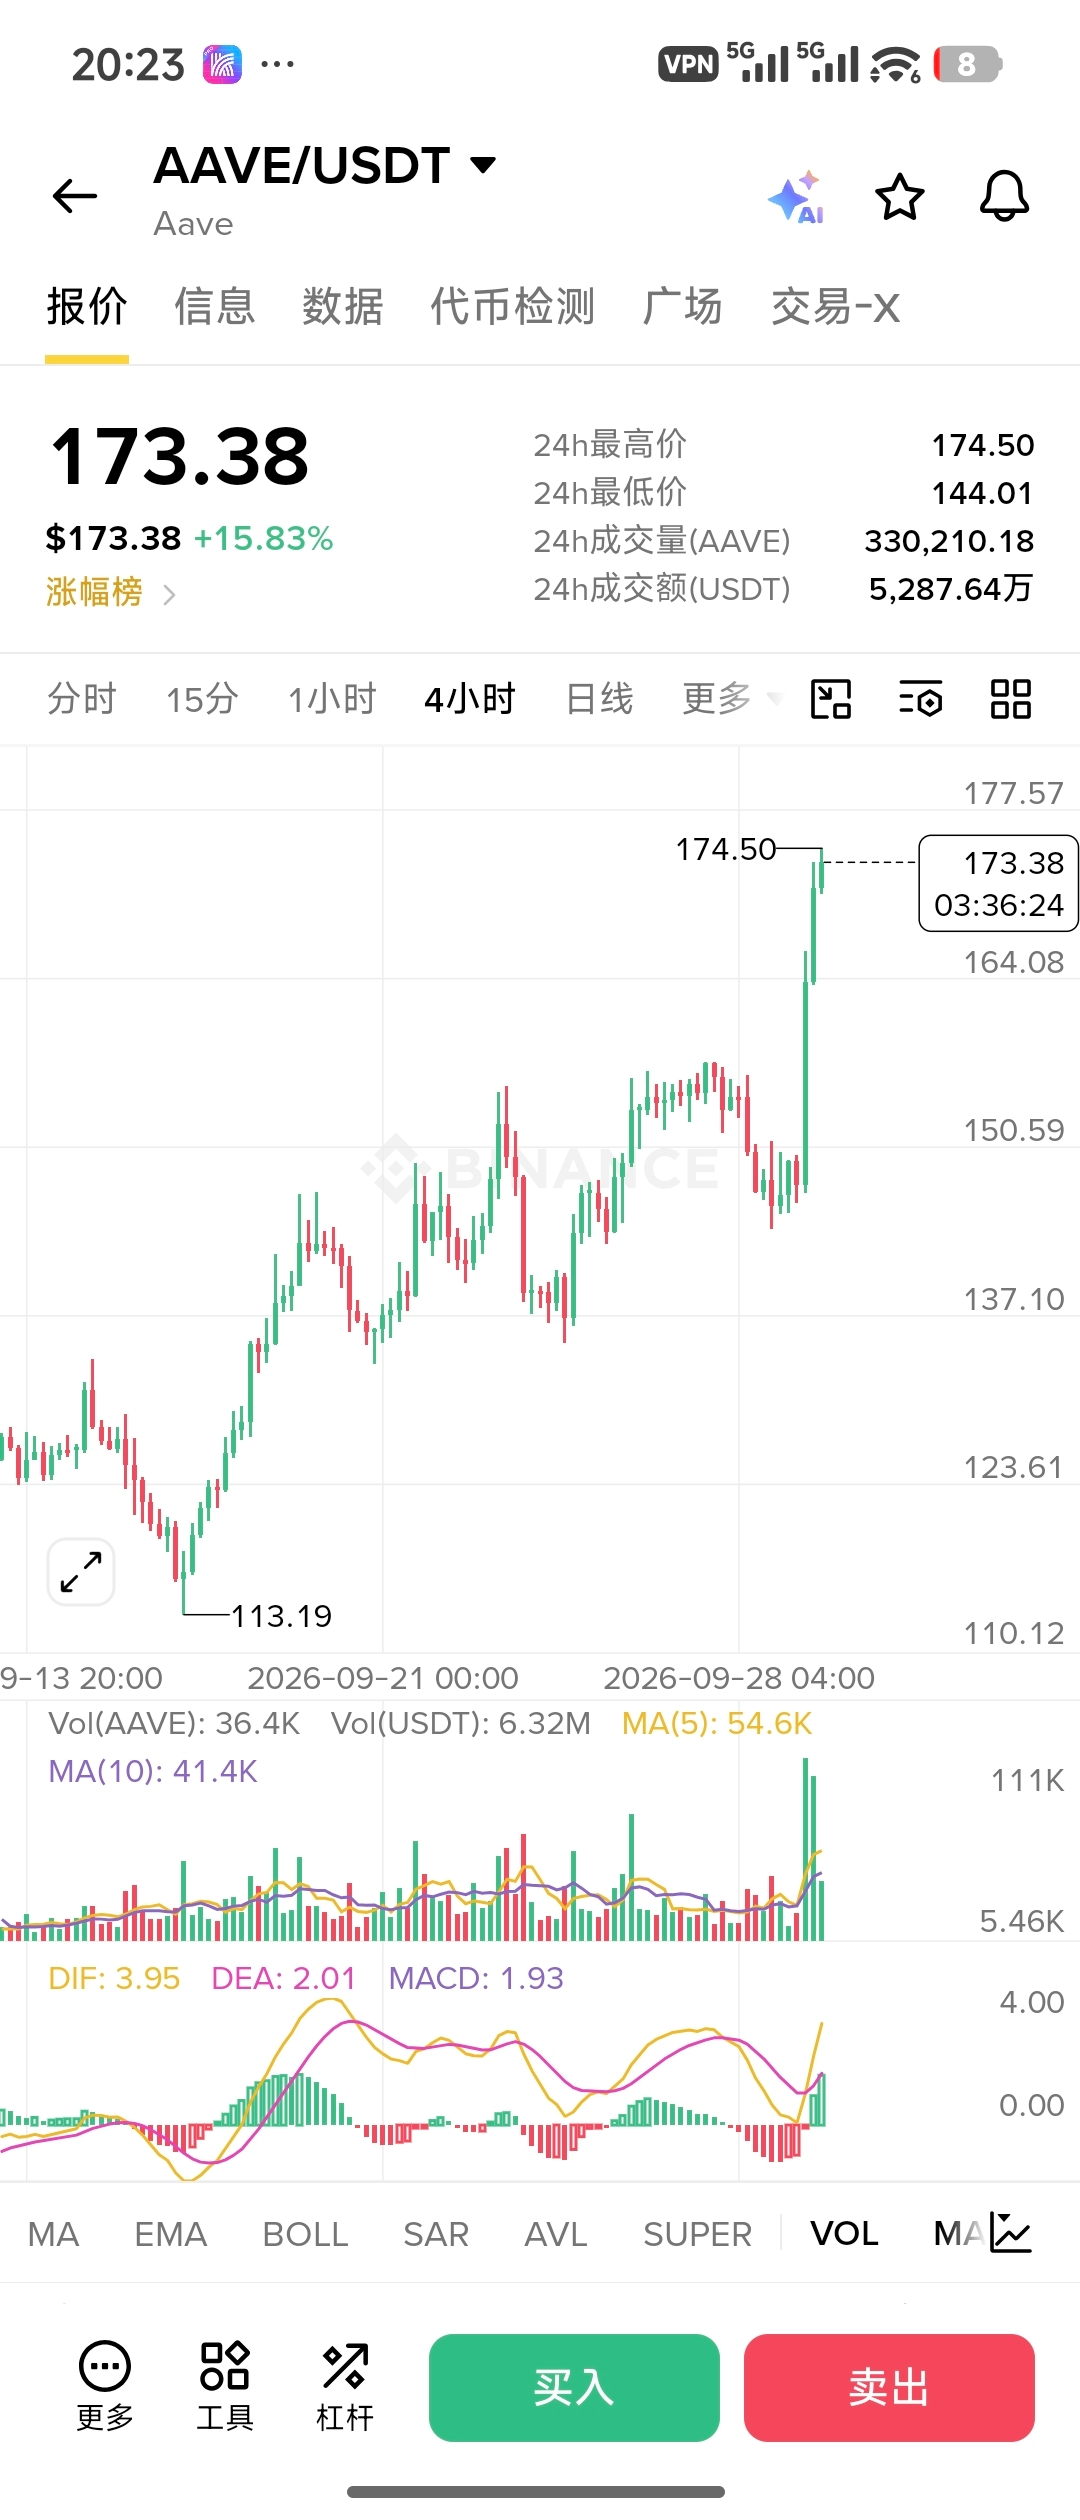
I think this round is basically a “buyback bull” cycle. Said more directly, it’s real-revenue agreements that programmatically route cash flows back to the token. As a result, buybacks become the easiest narrative to price in this cycle.
🧐 For example, a few of the stronger projects that have performed well this year:
UNI: Once protocol fees were opened up, external searchers have to take the fees and can only burn UNI.
AAVE: Revenue-driven buybacks, later upgraded to be more automated.
PUMP: About 50% of net income is used to buy in the open market and then burn. Cumulative amount has already exceeded $460M, roughly 17% of supply burned.
RAY: Since 2022, about 12% of trading fees have been automatically used to buy RAY and then burn it—one of the few that is genuinely net deflationary.
PONS: About 80% of the protocol’s take is used for TWAP buybacks and then burned. Roughly 29% of the supply has been burned.
……
So personally, I believe these buybacks will become the default capital return mechanism for this cycle. But the biggest risk is treating buybacks as a perpetual motion machine.
So for me, I’ll consider these three factors rather than just whether there’s a “buyback” label:
① Whether the buyback amount / circulating market cap is significant;
② Whether burning truly outweighs unlocks;
③ Whether the revenue source is repeatable and reusable—not just a one-off meme wave.
$AAVE
{future}(AAVEUSDT)
$UNI
{future}(UNIUSDT)
$PONS
{future}(PONSUSDT)
I think this round is basically a “buyback bull” cycle. Said more directly, it’s real-revenue agreements that programmatically route cash flows back to the token. As a result, buybacks become the easiest narrative to price in this cycle.
🧐 For example, a few of the stronger projects that have performed well this year:
UNI: Once protocol fees were opened up, external searchers have to take the fees and can only burn UNI.
AAVE: Revenue-driven buybacks, later upgraded to be more automated.
PUMP: About 50% of net income is used to buy in the open market and then burn. Cumulative amount has already exceeded $460M, roughly 17% of supply burned.
RAY: Since 2022, about 12% of trading fees have been automatically used to buy RAY and then burn it—one of the few that is genuinely net deflationary.
PONS: About 80% of the protocol’s take is used for TWAP buybacks and then burned. Roughly 29% of the supply has been burned.
……
So personally, I believe these buybacks will become the default capital return mechanism for this cycle. But the biggest risk is treating buybacks as a perpetual motion machine.
So for me, I’ll consider these three factors rather than just whether there’s a “buyback” label:
① Whether the buyback amount / circulating market cap is significant;
② Whether burning truly outweighs unlocks;
③ Whether the revenue source is repeatable and reusable—not just a one-off meme wave.
$AAVE
$UNI
$PONS
🧐 For example, a few of the stronger projects that have performed well this year:
UNI: Once protocol fees were opened up, external searchers have to take the fees and can only burn UNI.
AAVE: Revenue-driven buybacks, later upgraded to be more automated.
PUMP: About 50% of net income is used to buy in the open market and then burn. Cumulative amount has already exceeded $460M, roughly 17% of supply burned.
RAY: Since 2022, about 12% of trading fees have been automatically used to buy RAY and then burn it—one of the few that is genuinely net deflationary.
PONS: About 80% of the protocol’s take is used for TWAP buybacks and then burned. Roughly 29% of the supply has been burned.
……
So personally, I believe these buybacks will become the default capital return mechanism for this cycle. But the biggest risk is treating buybacks as a perpetual motion machine.
So for me, I’ll consider these three factors rather than just whether there’s a “buyback” label:
① Whether the buyback amount / circulating market cap is significant;
② Whether burning truly outweighs unlocks;
③ Whether the revenue source is repeatable and reusable—not just a one-off meme wave.
$AAVE
$UNI
$PONS
1
4
7.7k
·
--
#SEC称去中心化代币回购通常非投资合约
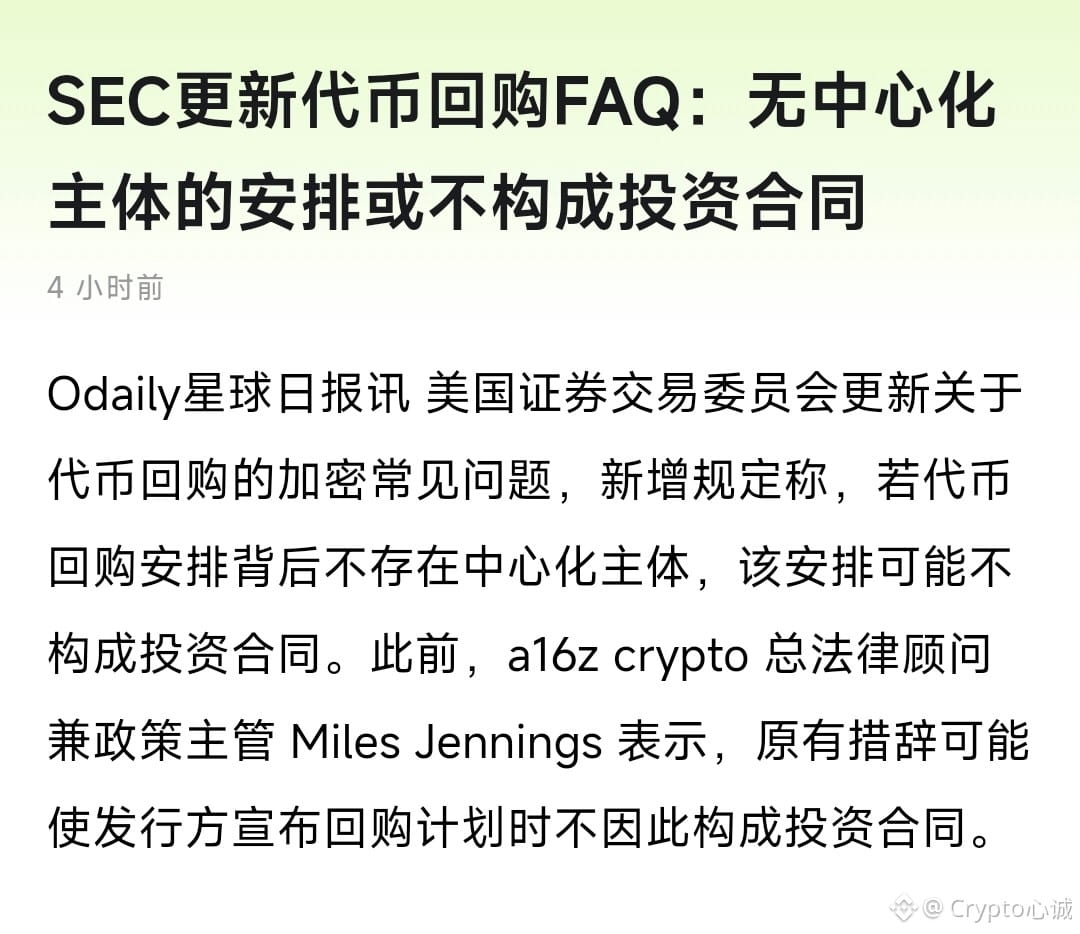
SEC said: when the network is already functional and there is no centralized controlling party behind it, token buybacks usually do not constitute an investment contract. Packaging a buyback as “making money for holders,” even when it hasn’t been launched yet, can still cross the line.
This isn’t a full green light—it shifts the judgment from “is there a buyback” to “can the network route transactions on its own, and who is actually running the show.” Mature protocols breathed easier; projects that relied on teams propping up the market and telling stories didn’t get to benefit.
My view: the direction is right—Howey was already supposed to look at whether you’re essentially betting on someone else’s continued operation. But the FAQ has no legal force. And decentralization can’t stand up to a treasury’s private-key audit. Only buybacks that are coded to execute automatically count as a real loosening; call it a DAO in words, use a multisig in practice—don’t feel too good about yourself.
$BTC
{future}(BTCUSDT)
#SEC称去中心化代币回购通常非投资合约
SEC said: when the network is already functional and there is no centralized controlling party behind it, token buybacks usually do not constitute an investment contract. Packaging a buyback as “making money for holders,” even when it hasn’t been launched yet, can still cross the line.
This isn’t a full green light—it shifts the judgment from “is there a buyback” to “can the network route transactions on its own, and who is actually running the show.” Mature protocols breathed easier; projects that relied on teams propping up the market and telling stories didn’t get to benefit.
My view: the direction is right—Howey was already supposed to look at whether you’re essentially betting on someone else’s continued operation. But the FAQ has no legal force. And decentralization can’t stand up to a treasury’s private-key audit. Only buybacks that are coded to execute automatically count as a real loosening; call it a DAO in words, use a multisig in practice—don’t feel too good about yourself.
$BTC
SEC said: when the network is already functional and there is no centralized controlling party behind it, token buybacks usually do not constitute an investment contract. Packaging a buyback as “making money for holders,” even when it hasn’t been launched yet, can still cross the line.
This isn’t a full green light—it shifts the judgment from “is there a buyback” to “can the network route transactions on its own, and who is actually running the show.” Mature protocols breathed easier; projects that relied on teams propping up the market and telling stories didn’t get to benefit.
My view: the direction is right—Howey was already supposed to look at whether you’re essentially betting on someone else’s continued operation. But the FAQ has no legal force. And decentralization can’t stand up to a treasury’s private-key audit. Only buybacks that are coded to execute automatically count as a real loosening; call it a DAO in words, use a multisig in practice—don’t feel too good about yourself.
$BTC
333
·
--
#英伟达批准1500亿美元回购
NVIDIA approves an additional $150 billion share buyback, with remaining authorization rising to $235 billion. This marks the largest single increase in history; the plan is to spend it all by fiscal year 2028
Jensen Huang’s meaning is very straightforward: this AI platform shift is still in the early stage. The company’s cash flow is sufficient to both invest heavily in technology and return money to shareholders. This isn’t mere verbal confidence—it’s a concrete show of commitment with real funds.
Authorization doesn’t mean the entire amount will be used immediately, but the signal is bullish: the company has moved from a “pure growth” narrative to a “high cash flow + high returns” phase. Ultimately, it will depend on the pace of execution and how long AI demand can keep up
$NVDAB
{spot}(NVDABUSDT)
$NVDA.US
{stock_us}(NVDA.US)
#英伟达批准1500亿美元回购
NVIDIA approves an additional $150 billion share buyback, with remaining authorization rising to $235 billion. This marks the largest single increase in history; the plan is to spend it all by fiscal year 2028
Jensen Huang’s meaning is very straightforward: this AI platform shift is still in the early stage. The company’s cash flow is sufficient to both invest heavily in technology and return money to shareholders. This isn’t mere verbal confidence—it’s a concrete show of commitment with real funds.
Authorization doesn’t mean the entire amount will be used immediately, but the signal is bullish: the company has moved from a “pure growth” narrative to a “high cash flow + high returns” phase. Ultimately, it will depend on the pace of execution and how long AI demand can keep up
$NVDAB
$NVDA.US
NVIDIA approves an additional $150 billion share buyback, with remaining authorization rising to $235 billion. This marks the largest single increase in history; the plan is to spend it all by fiscal year 2028
Jensen Huang’s meaning is very straightforward: this AI platform shift is still in the early stage. The company’s cash flow is sufficient to both invest heavily in technology and return money to shareholders. This isn’t mere verbal confidence—it’s a concrete show of commitment with real funds.
Authorization doesn’t mean the entire amount will be used immediately, but the signal is bullish: the company has moved from a “pure growth” narrative to a “high cash flow + high returns” phase. Ultimately, it will depend on the pace of execution and how long AI demand can keep up
$NVDAB
$NVDA.US
NVDAB+0.91%
NVDAUS+0.18%
236
·
--
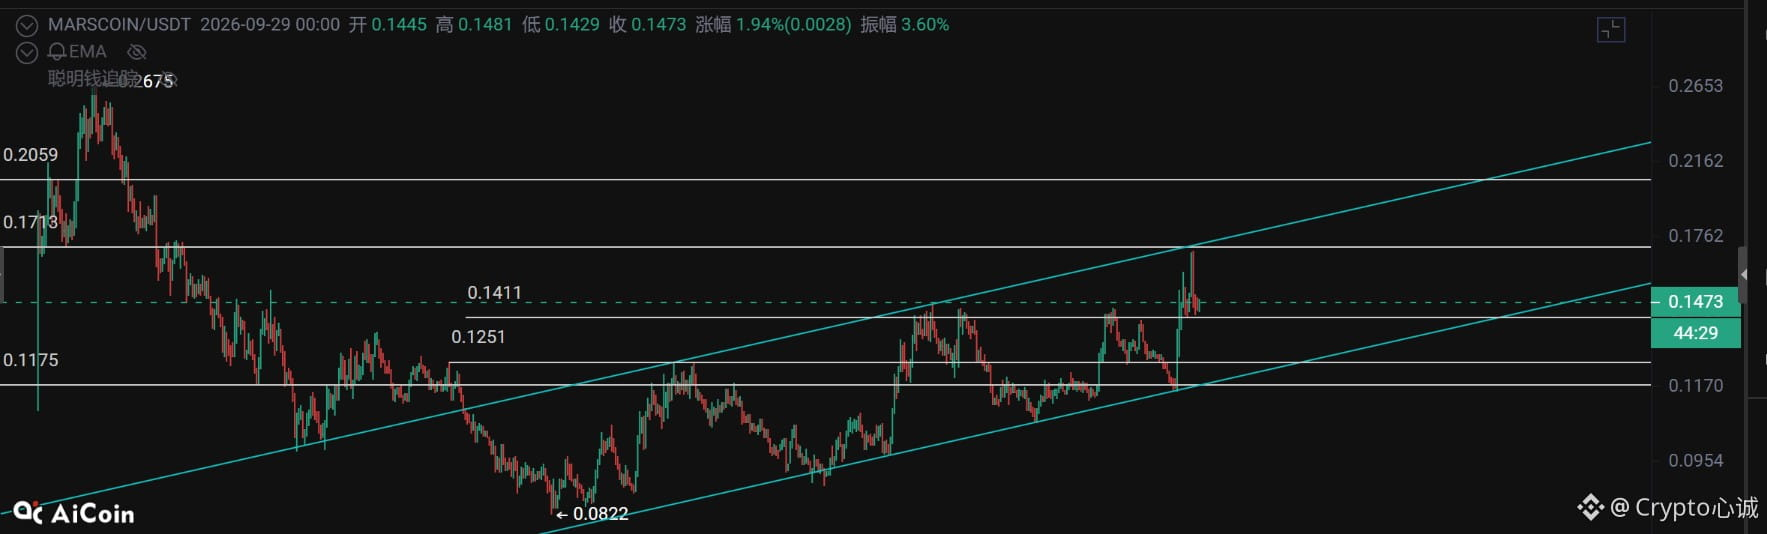
On September 14, I reminded everyone that $MARSCOIN could get on board. At that time, the price was only 0.095—basically at the floor price. Now it’s already 0.15, up 60%.
In fact, I’ve been calling out Mars tokens several times already. Right now, the hourly chart is also moving within an ascending channel. Next, if there’s an opportunity to reach the 0.126–0.14 range, you can still get on board. The resistance above is at 0.17–0.2 (see the chart).
{future}(MARSCOINUSDT)
On September 14, I reminded everyone that $MARSCOIN could get on board. At that time, the price was only 0.095—basically at the floor price. Now it’s already 0.15, up 60%.
In fact, I’ve been calling out Mars tokens several times already. Right now, the hourly chart is also moving within an ascending channel. Next, if there’s an opportunity to reach the 0.126–0.14 range, you can still get on board. The resistance above is at 0.17–0.2 (see the chart).
In fact, I’ve been calling out Mars tokens several times already. Right now, the hourly chart is also moving within an ascending channel. Next, if there’s an opportunity to reach the 0.126–0.14 range, you can still get on board. The resistance above is at 0.17–0.2 (see the chart).
Crypto心诚
·
--
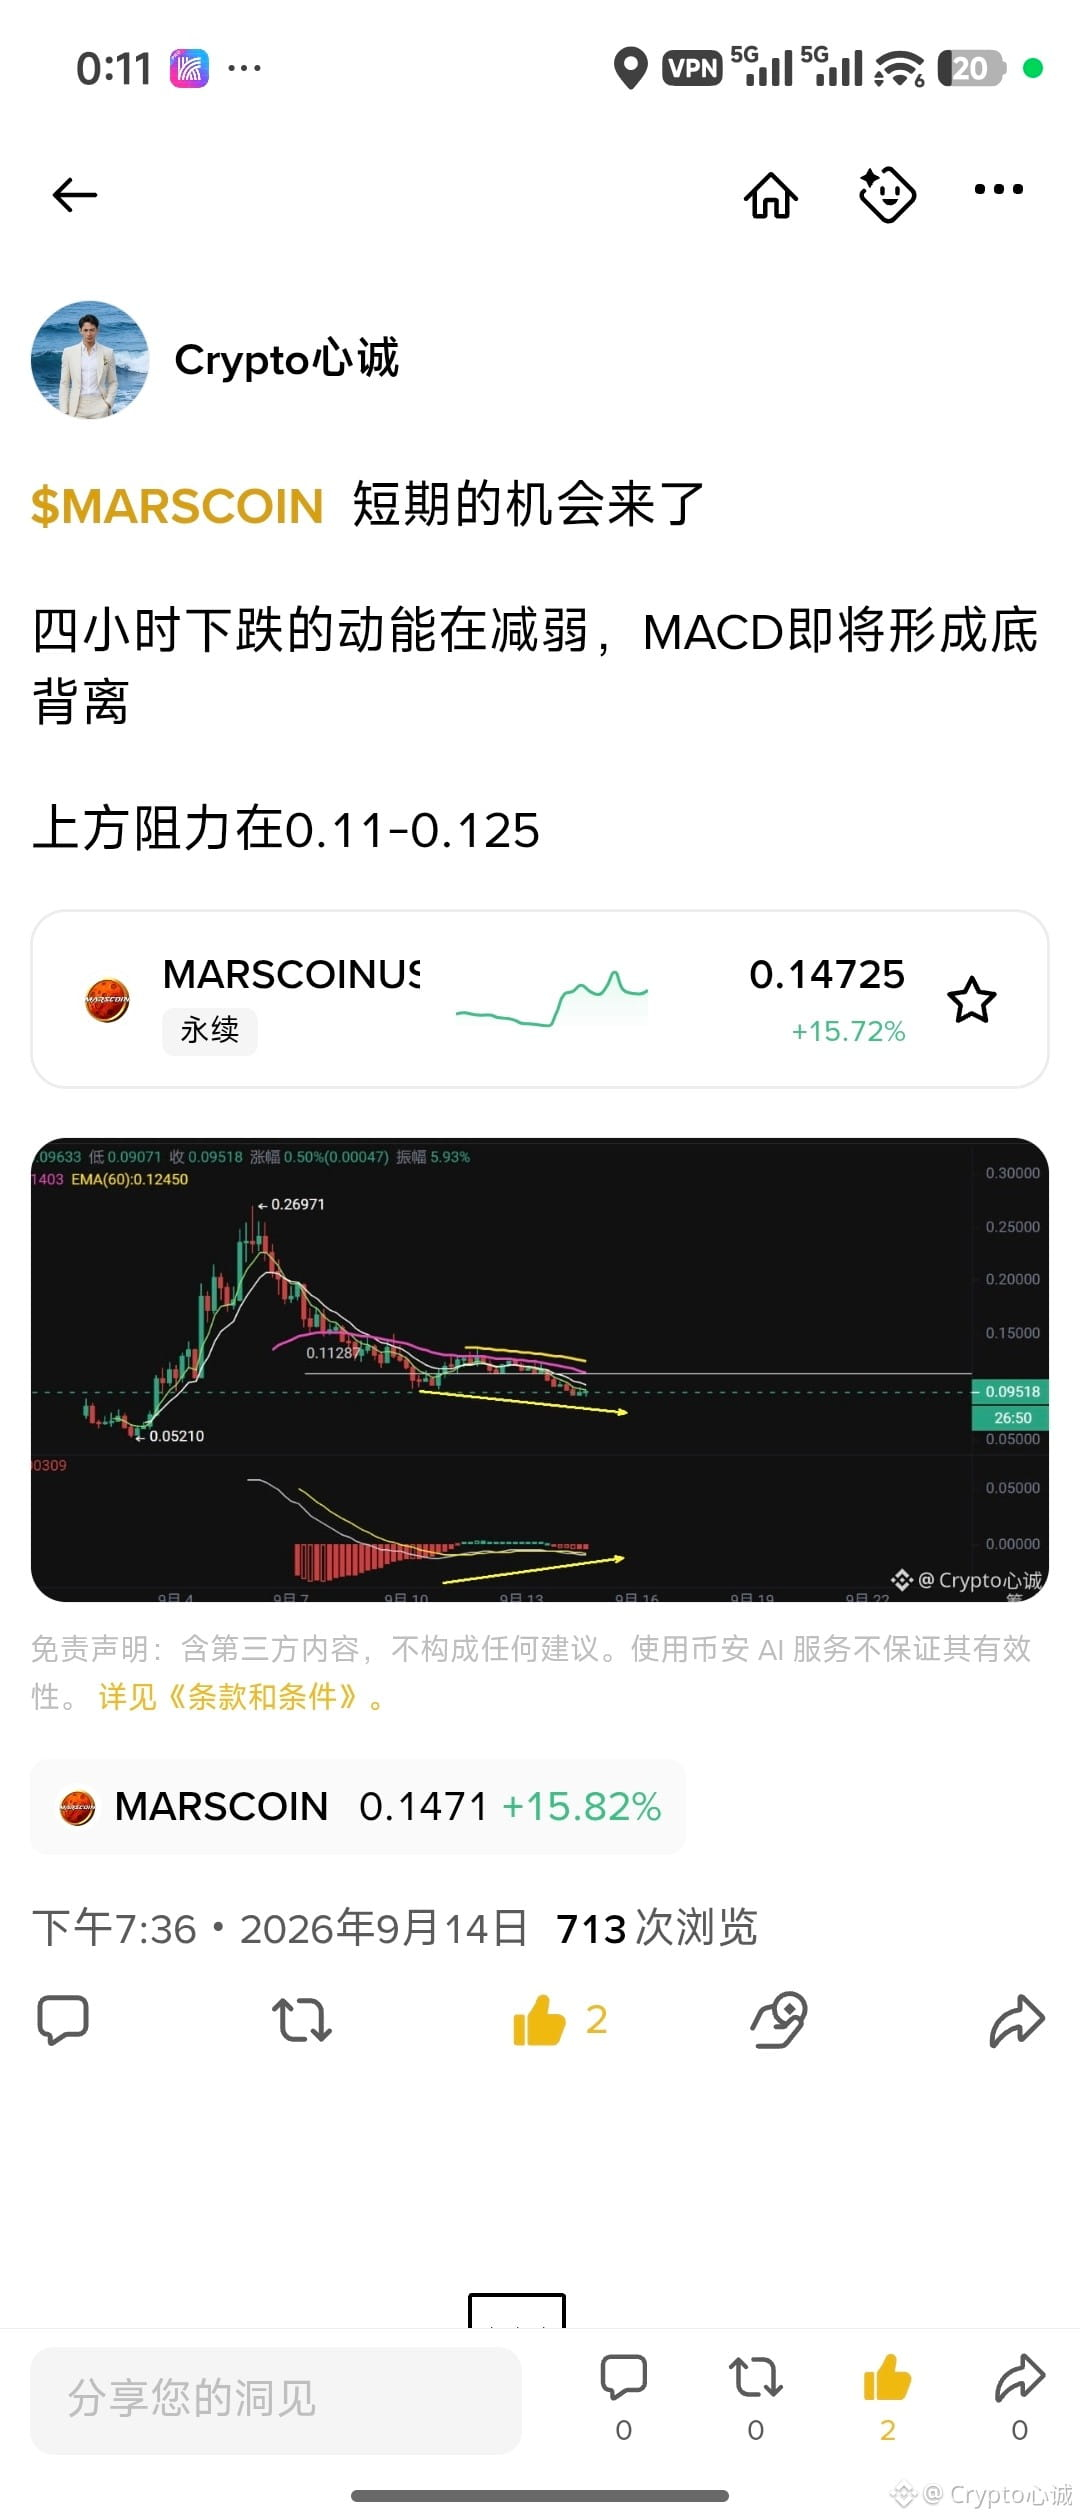
$MARSCOIN A short-term opportunity is here
The downward momentum over the past four hours is weakening, and the MACD is about to form a bottom divergence
Resistance is around 0.11-0.125
The downward momentum over the past four hours is weakening, and the MACD is about to form a bottom divergence
Resistance is around 0.11-0.125
1
322
·
--
Verified
$HBAR
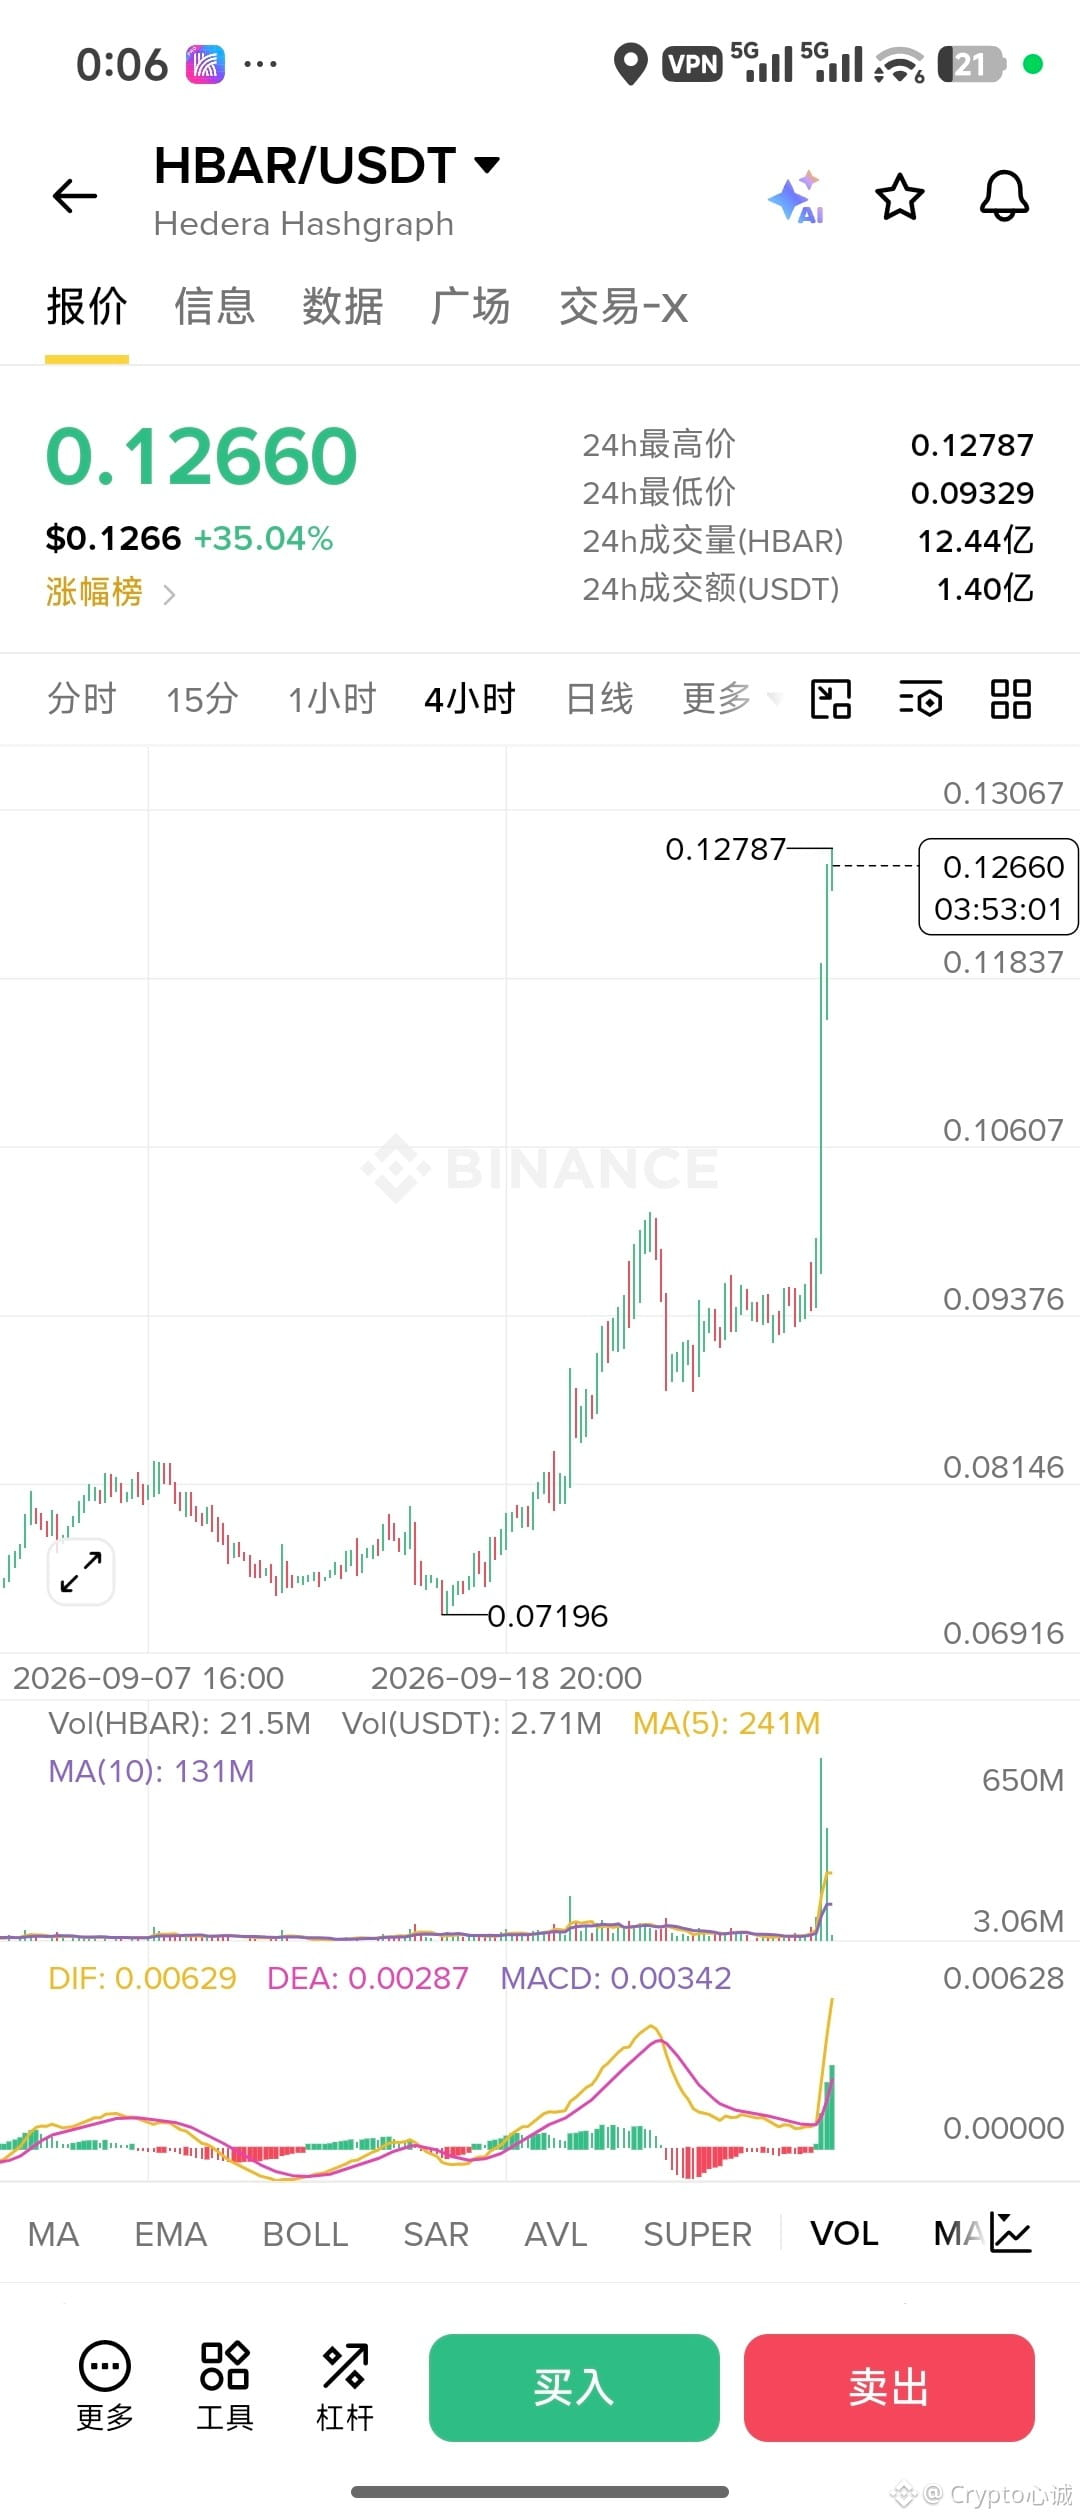
HBAR rally—mainly three things stacked together.
First, Hashgraph’s identity product IDTrust has been added to the IBM Cloud directory, issuing credentials to people, devices, and AI agents. The market is treating it as enterprises being able to click straight into Hedera on IBM.
Second, the spot ETF channel is still there, and it’s been written into the list of fake/“shanzhai” ETF demand.
Third, enterprise-chain tokens like QNT get pulled up first. Then capital follows the narrative to the next one, and trading volume exploded.
My take: what’s rising is the expectation that “big companies are actually using it,” not that on-chain fees suddenly doubled. Listing on IBM lowers the barrier—doesn’t mean there will immediately be a massive wave of transactions to burn coins
$HBAR
HBAR rally—mainly three things stacked together.
First, Hashgraph’s identity product IDTrust has been added to the IBM Cloud directory, issuing credentials to people, devices, and AI agents. The market is treating it as enterprises being able to click straight into Hedera on IBM.
Second, the spot ETF channel is still there, and it’s been written into the list of fake/“shanzhai” ETF demand.
Third, enterprise-chain tokens like QNT get pulled up first. Then capital follows the narrative to the next one, and trading volume exploded.
My take: what’s rising is the expectation that “big companies are actually using it,” not that on-chain fees suddenly doubled. Listing on IBM lowers the barrier—doesn’t mean there will immediately be a massive wave of transactions to burn coins
HBAR rally—mainly three things stacked together.
First, Hashgraph’s identity product IDTrust has been added to the IBM Cloud directory, issuing credentials to people, devices, and AI agents. The market is treating it as enterprises being able to click straight into Hedera on IBM.
Second, the spot ETF channel is still there, and it’s been written into the list of fake/“shanzhai” ETF demand.
Third, enterprise-chain tokens like QNT get pulled up first. Then capital follows the narrative to the next one, and trading volume exploded.
My take: what’s rising is the expectation that “big companies are actually using it,” not that on-chain fees suddenly doubled. Listing on IBM lowers the barrier—doesn’t mean there will immediately be a massive wave of transactions to burn coins
10
7.4k
·
--
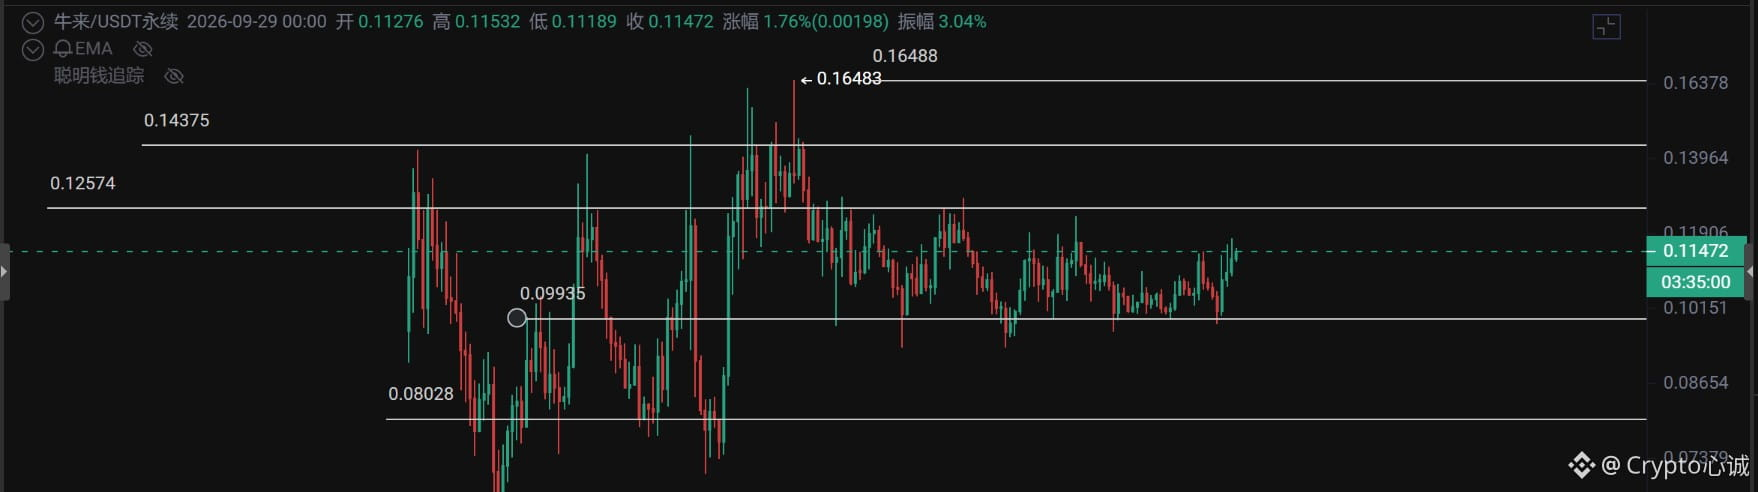
$牛来 is about to take off
The reasons are as follows:
The daily chart is continuously pulling back to the life line
The 4-hour base has been successfully formed; it has started moving upward in the Zhendun direction, and the MACD fast and slow lines have crossed above the zero axis
The 1-hour chart has already been operating in the bullish territory
Resistance above: 0.152–0.143
#牛来
{future}(牛来USDT)
$牛来 is about to take off
The reasons are as follows:
The daily chart is continuously pulling back to the life line
The 4-hour base has been successfully formed; it has started moving upward in the Zhendun direction, and the MACD fast and slow lines have crossed above the zero axis
The 1-hour chart has already been operating in the bullish territory
Resistance above: 0.152–0.143
#牛来
The reasons are as follows:
The daily chart is continuously pulling back to the life line
The 4-hour base has been successfully formed; it has started moving upward in the Zhendun direction, and the MACD fast and slow lines have crossed above the zero axis
The 1-hour chart has already been operating in the bullish territory
Resistance above: 0.152–0.143
#牛来
396
·
--
Verified
#Chainlink上线CCIP2支持企业验证
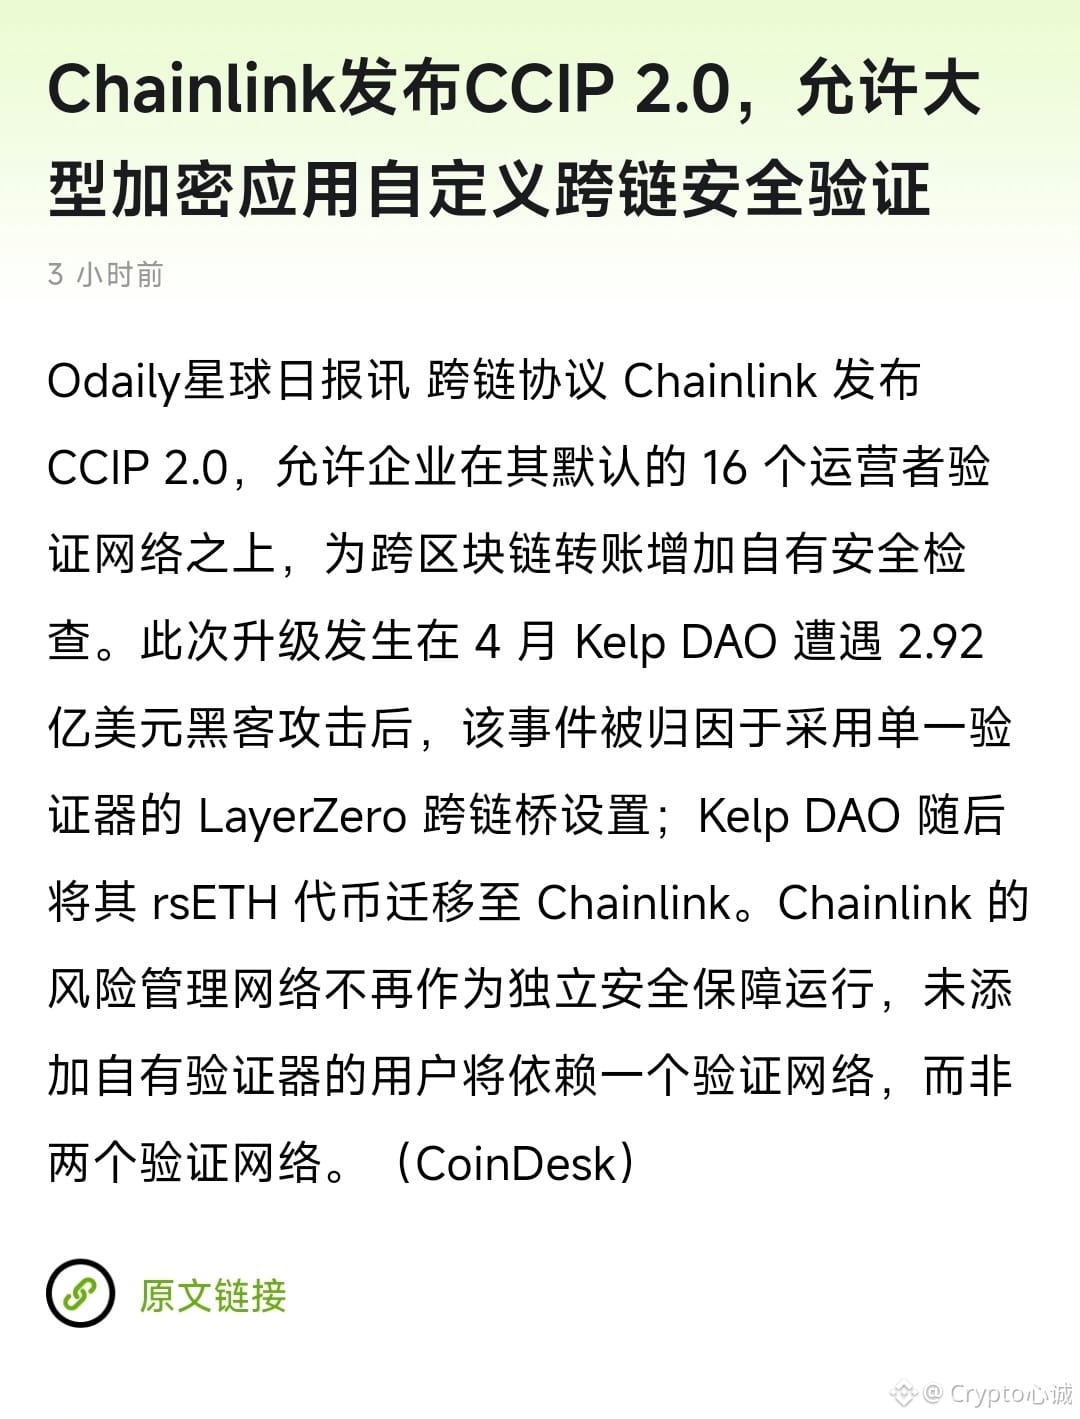
Chainlink has launched CCIP 2.0 today. The core is just one thing: cross-chain transfers. Institutions can add an extra layer of verification if they want—have themselves sign, outsource signing to companies like Infosys, and only after signing can the transfer reach the other chain. By default, the 16 Chainlink nodes still stand as the fallback.
There are also compliance checks, adjustable speed, and fees that can be itemized. AWS, Google Cloud, ANZ, and Fidelity International are all on the approved list.
In my personal view, this is meant to help banks and the parties issuing tokens “check the box” for cross-chain operations—not to do a favor for retail users. When a bridge incident happens, it often comes down to “only one person decides.” Being able to add a gate is a good thing. But adding verification doesn’t necessarily mean it’s safer—who operates the nodes, who manages the keys—those issues still shift some of the blame back onto you
#Chainlink上线CCIP2支持企业验证
Chainlink has launched CCIP 2.0 today. The core is just one thing: cross-chain transfers. Institutions can add an extra layer of verification if they want—have themselves sign, outsource signing to companies like Infosys, and only after signing can the transfer reach the other chain. By default, the 16 Chainlink nodes still stand as the fallback.
There are also compliance checks, adjustable speed, and fees that can be itemized. AWS, Google Cloud, ANZ, and Fidelity International are all on the approved list.
In my personal view, this is meant to help banks and the parties issuing tokens “check the box” for cross-chain operations—not to do a favor for retail users. When a bridge incident happens, it often comes down to “only one person decides.” Being able to add a gate is a good thing. But adding verification doesn’t necessarily mean it’s safer—who operates the nodes, who manages the keys—those issues still shift some of the blame back onto you
Chainlink has launched CCIP 2.0 today. The core is just one thing: cross-chain transfers. Institutions can add an extra layer of verification if they want—have themselves sign, outsource signing to companies like Infosys, and only after signing can the transfer reach the other chain. By default, the 16 Chainlink nodes still stand as the fallback.
There are also compliance checks, adjustable speed, and fees that can be itemized. AWS, Google Cloud, ANZ, and Fidelity International are all on the approved list.
In my personal view, this is meant to help banks and the parties issuing tokens “check the box” for cross-chain operations—not to do a favor for retail users. When a bridge incident happens, it often comes down to “only one person decides.” Being able to add a gate is a good thing. But adding verification doesn’t necessarily mean it’s safer—who operates the nodes, who manages the keys—those issues still shift some of the blame back onto you
607
·
--
Verified
#黄金跌至4144美元
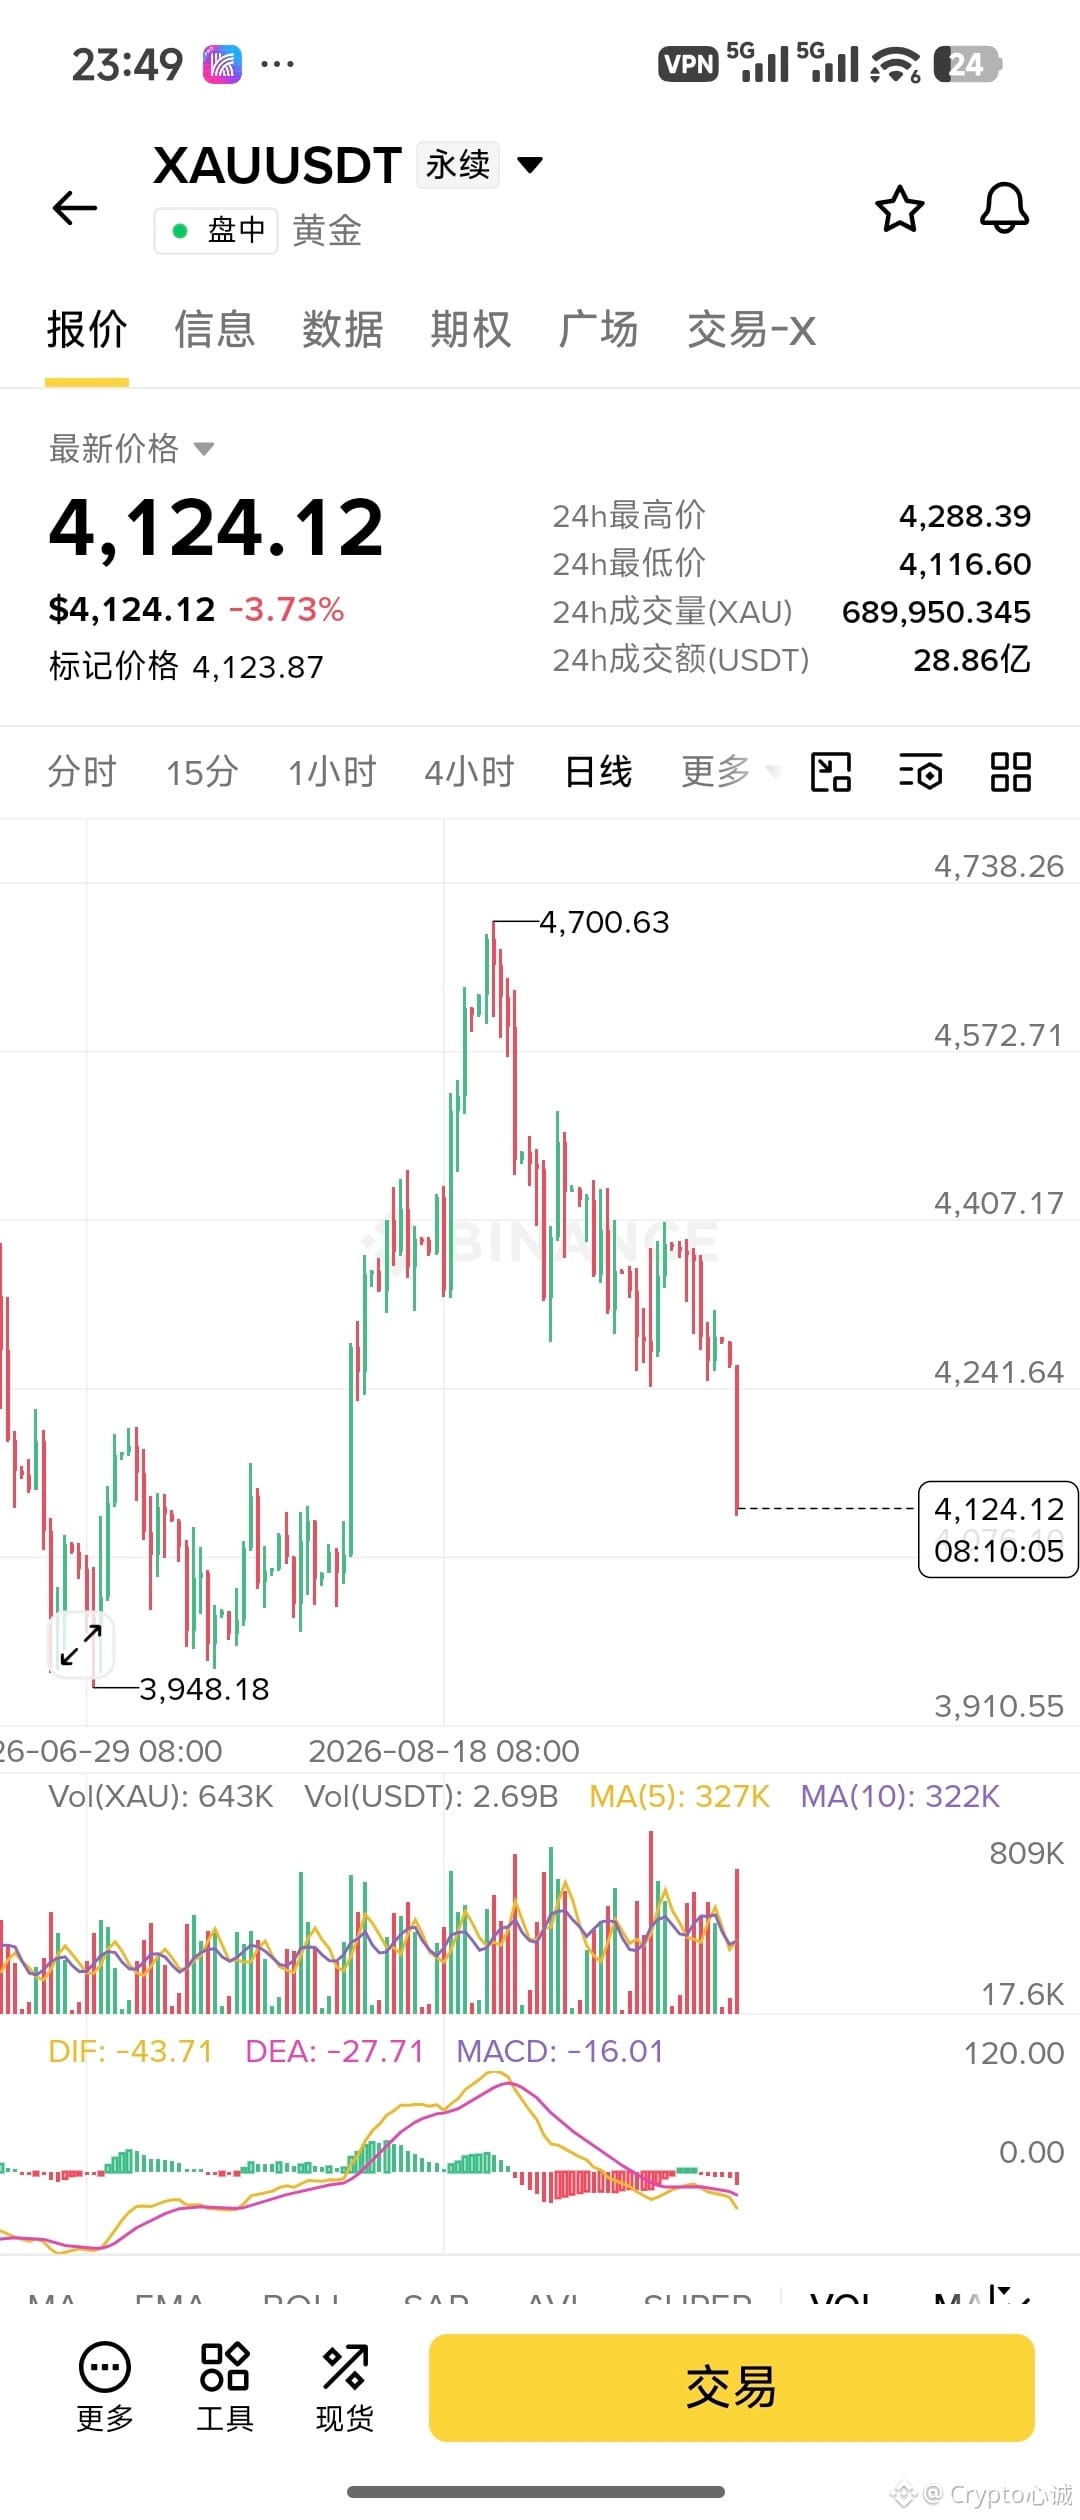
$XAU A while back, not many KOLs were saying this: if gold went from 4500 to 6000, are these people still around?
I think the reason it was hammered down is very simple. Mainly, the US dollar has been stronger, and US Treasury yields have been pushing higher (the 10-year is around 5.2%). The market has priced in about a 70% chance that the Fed will raise rates again in October. Since gold doesn’t yield interest, when interest rates and the dollar turn “hard,” the cost of holding immediately becomes more expensive. Oil prices also strengthened because US-Iran talks stalled and concerns about the Strait of Hormuz resurfaced. Meanwhile, inflation worries made the market more confident that rates would stay high for longer. In the short term, gold was weighed down by the interest-rate logic more than by the safe-haven logic.
Let me share my take. The number 4100 looks scary because everyone is still stuck in the memory of gold only being able to rise “up to the sky.” Put it in this year’s own timeline: it surged above 5000 around mid-year, and now it’s back to 4100—this is a pullback after a big rally, not a breakdown. About a year ago it was roughly 3700–3800, and over the medium to long term it’s still rising.
Don’t go against your emotions in the short term. As long as yields and rate-hike expectations don’t cool off, gold can still swing and test even lower again.
For the medium to long term, if central bank gold-buying, US fiscal debt, and real yields all ease back downward, there will still be buyers for gold.
In one sentence: this is interest-rate “slapping gold in the face,” not that gold is useless. 4100 is a temporary bargain. Size your position according to the volatility you can actually hold through—don’t treat a sharp, short-term drop as the trend having already reversed.
{future}(XAUUSDT)
$XAUT
{future}(XAUTUSDT)
#黄金跌至4144美元
$XAU A while back, not many KOLs were saying this: if gold went from 4500 to 6000, are these people still around?
I think the reason it was hammered down is very simple. Mainly, the US dollar has been stronger, and US Treasury yields have been pushing higher (the 10-year is around 5.2%). The market has priced in about a 70% chance that the Fed will raise rates again in October. Since gold doesn’t yield interest, when interest rates and the dollar turn “hard,” the cost of holding immediately becomes more expensive. Oil prices also strengthened because US-Iran talks stalled and concerns about the Strait of Hormuz resurfaced. Meanwhile, inflation worries made the market more confident that rates would stay high for longer. In the short term, gold was weighed down by the interest-rate logic more than by the safe-haven logic.
Let me share my take. The number 4100 looks scary because everyone is still stuck in the memory of gold only being able to rise “up to the sky.” Put it in this year’s own timeline: it surged above 5000 around mid-year, and now it’s back to 4100—this is a pullback after a big rally, not a breakdown. About a year ago it was roughly 3700–3800, and over the medium to long term it’s still rising.
Don’t go against your emotions in the short term. As long as yields and rate-hike expectations don’t cool off, gold can still swing and test even lower again.
For the medium to long term, if central bank gold-buying, US fiscal debt, and real yields all ease back downward, there will still be buyers for gold.
In one sentence: this is interest-rate “slapping gold in the face,” not that gold is useless. 4100 is a temporary bargain. Size your position according to the volatility you can actually hold through—don’t treat a sharp, short-term drop as the trend having already reversed.
$XAUT
$XAU A while back, not many KOLs were saying this: if gold went from 4500 to 6000, are these people still around?
I think the reason it was hammered down is very simple. Mainly, the US dollar has been stronger, and US Treasury yields have been pushing higher (the 10-year is around 5.2%). The market has priced in about a 70% chance that the Fed will raise rates again in October. Since gold doesn’t yield interest, when interest rates and the dollar turn “hard,” the cost of holding immediately becomes more expensive. Oil prices also strengthened because US-Iran talks stalled and concerns about the Strait of Hormuz resurfaced. Meanwhile, inflation worries made the market more confident that rates would stay high for longer. In the short term, gold was weighed down by the interest-rate logic more than by the safe-haven logic.
Let me share my take. The number 4100 looks scary because everyone is still stuck in the memory of gold only being able to rise “up to the sky.” Put it in this year’s own timeline: it surged above 5000 around mid-year, and now it’s back to 4100—this is a pullback after a big rally, not a breakdown. About a year ago it was roughly 3700–3800, and over the medium to long term it’s still rising.
Don’t go against your emotions in the short term. As long as yields and rate-hike expectations don’t cool off, gold can still swing and test even lower again.
For the medium to long term, if central bank gold-buying, US fiscal debt, and real yields all ease back downward, there will still be buyers for gold.
In one sentence: this is interest-rate “slapping gold in the face,” not that gold is useless. 4100 is a temporary bargain. Size your position according to the volatility you can actually hold through—don’t treat a sharp, short-term drop as the trend having already reversed.
$XAUT
2
1
3.9k
·
--
#英国FCA获法院令追缴85.1万英镑
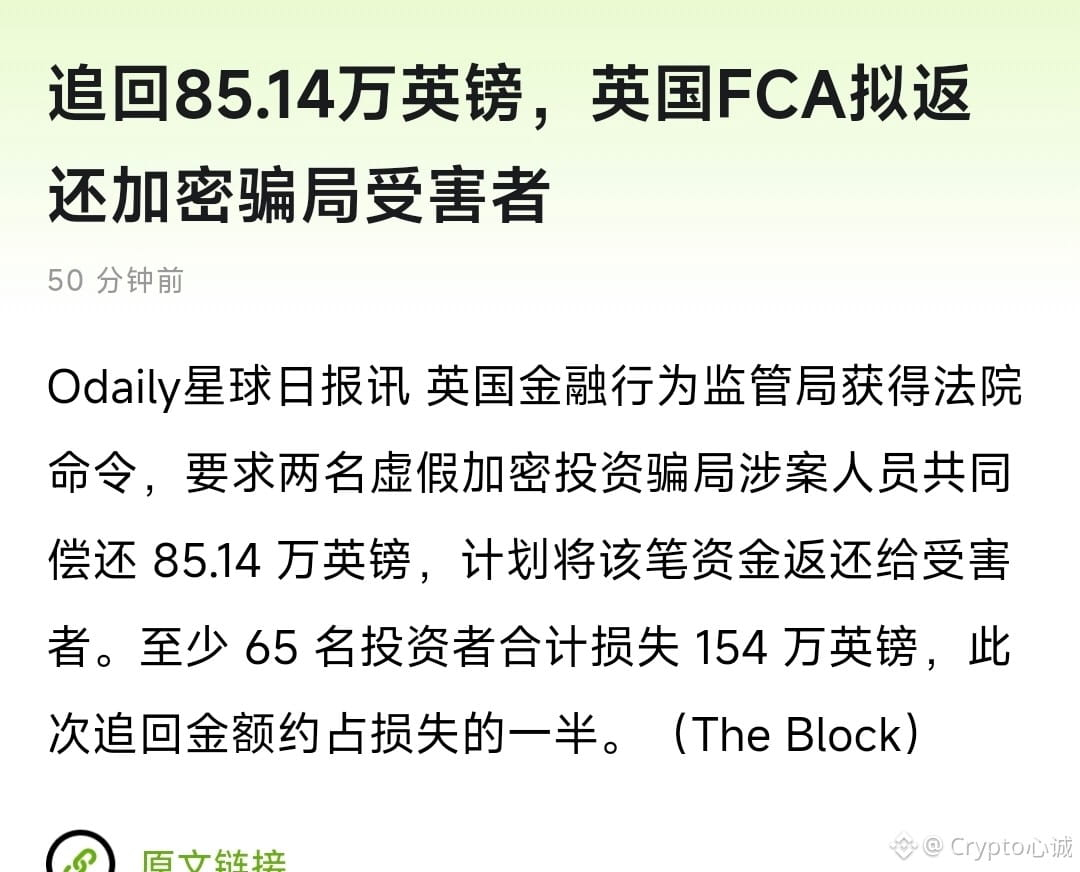
The UK FCA has just received a court order: two people who, back then, sold fake crypto investments via cold-calling must hand over about £851,000 and prepare to repay the victims
65 people were swindled out of £1.54 million, and this time they may be able to recover half. For the old cases from 2017 to 2019, the people involved have already been incarcerated by 2025, and the money is only now being seized.
My view in one sentence: sentencing is step one—only actually clawing back the money that can still be found counts as doing the job. In crypto scams, recovering half is already pretty good; the other half has most likely already been spent. If you see an unsolicited incoming call offering “crypto consultancy” guaranteeing steady profits, hang up
$BTC
{future}(BTCUSDT)
#英国FCA获法院令追缴85.1万英镑
The UK FCA has just received a court order: two people who, back then, sold fake crypto investments via cold-calling must hand over about £851,000 and prepare to repay the victims
65 people were swindled out of £1.54 million, and this time they may be able to recover half. For the old cases from 2017 to 2019, the people involved have already been incarcerated by 2025, and the money is only now being seized.
My view in one sentence: sentencing is step one—only actually clawing back the money that can still be found counts as doing the job. In crypto scams, recovering half is already pretty good; the other half has most likely already been spent. If you see an unsolicited incoming call offering “crypto consultancy” guaranteeing steady profits, hang up
$BTC
The UK FCA has just received a court order: two people who, back then, sold fake crypto investments via cold-calling must hand over about £851,000 and prepare to repay the victims
65 people were swindled out of £1.54 million, and this time they may be able to recover half. For the old cases from 2017 to 2019, the people involved have already been incarcerated by 2025, and the money is only now being seized.
My view in one sentence: sentencing is step one—only actually clawing back the money that can still be found counts as doing the job. In crypto scams, recovering half is already pretty good; the other half has most likely already been spent. If you see an unsolicited incoming call offering “crypto consultancy” guaranteeing steady profits, hang up
$BTC
535
·
--
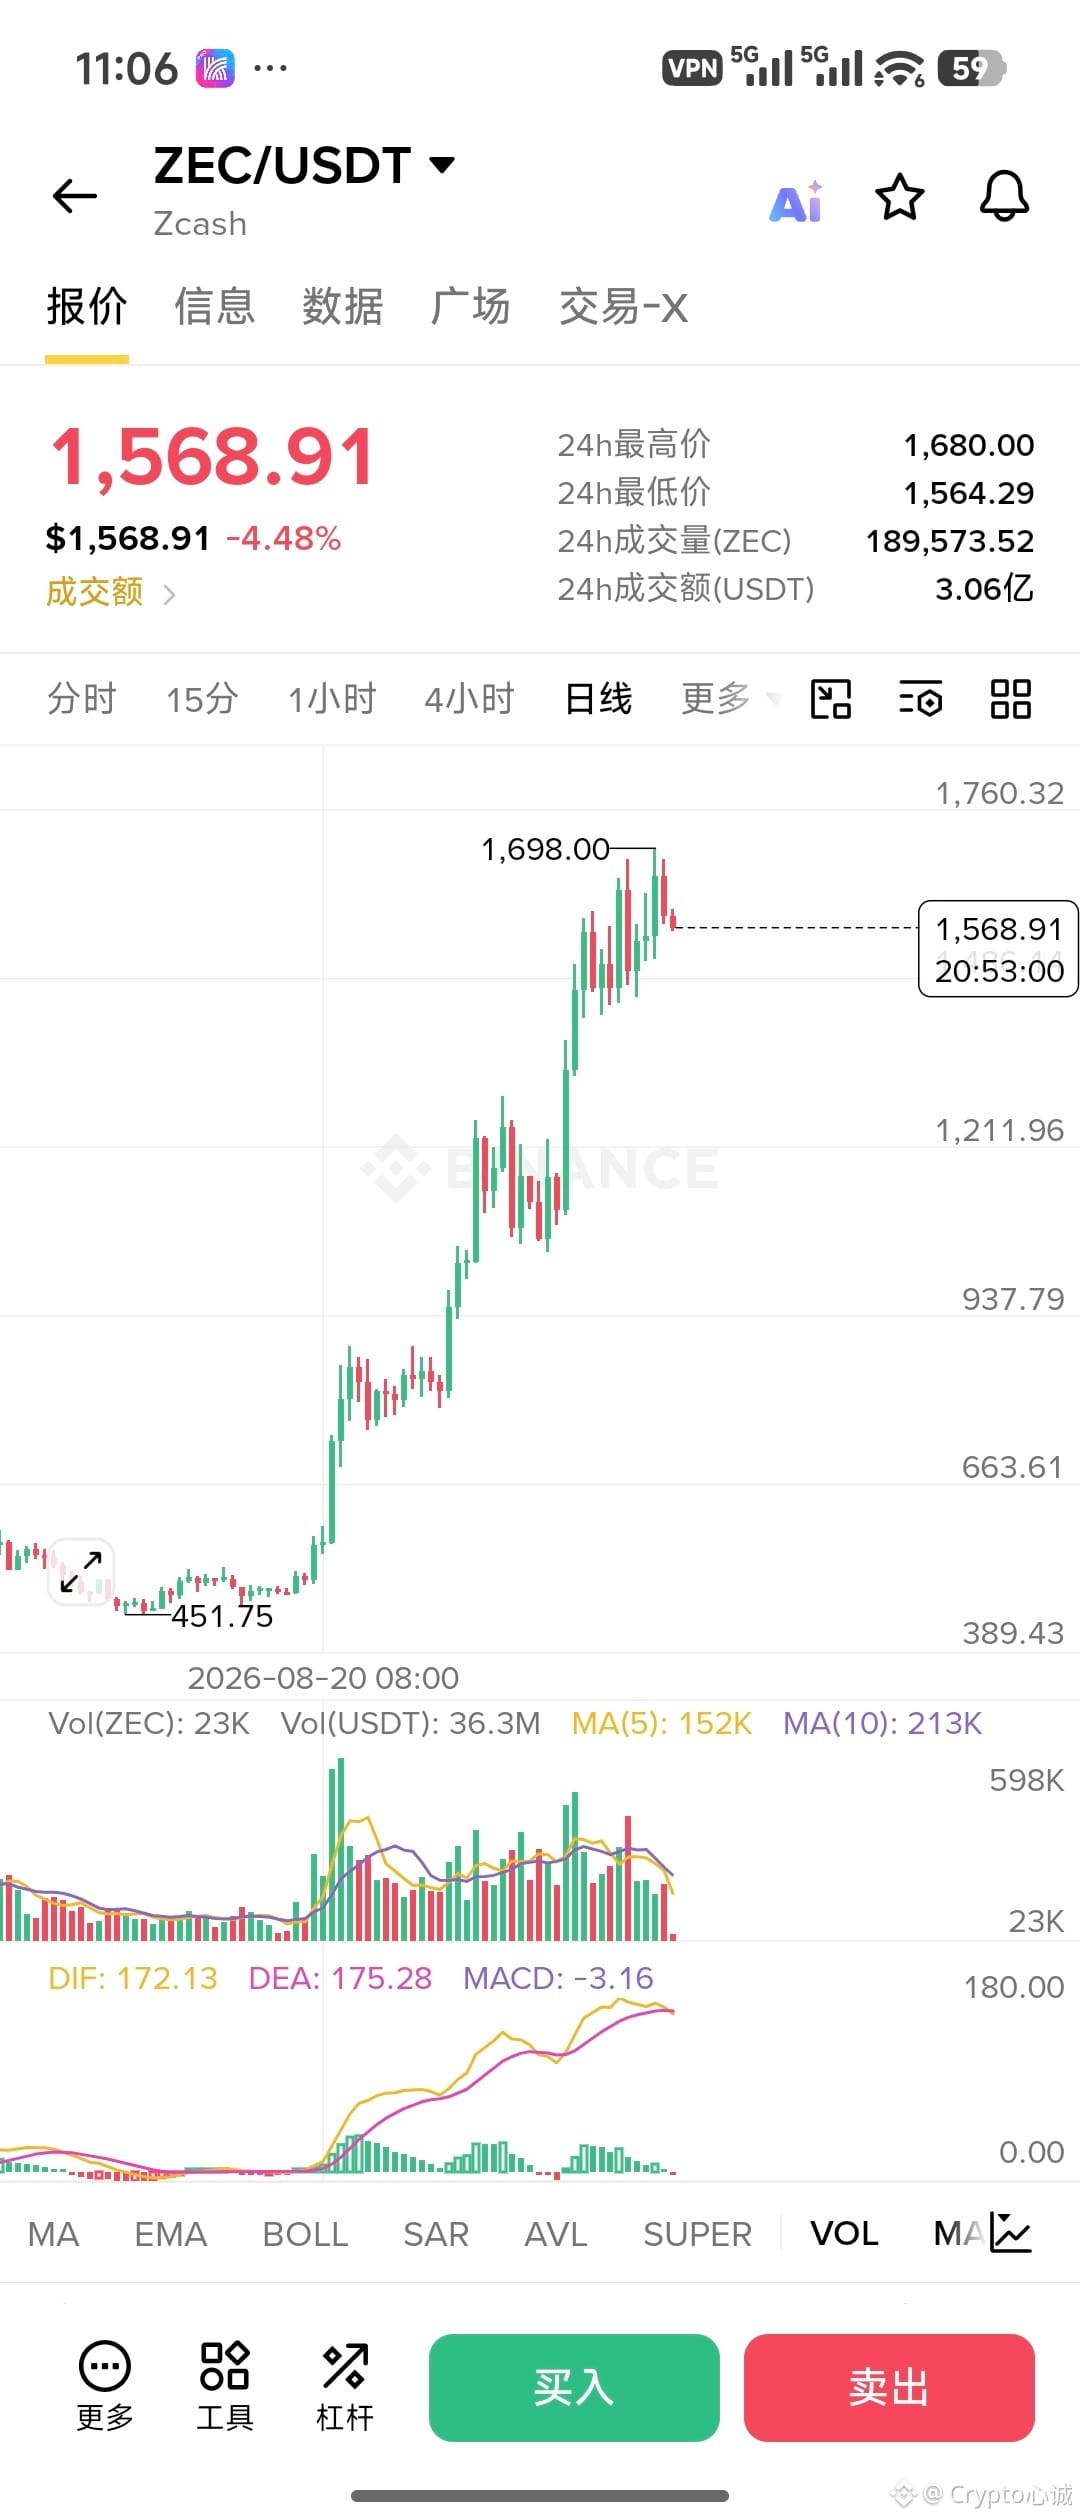
$ZEC I think this round is basically over, because the three waves have already been completed.
Now it's around 1500–1650; I just touched 1670–1700 and it pulled back. In a month it's nearly doubled, and the market cap is back in the top ten, but it's still some distance from the 2016 round's peak around 3200.
This move is mainly driven by a resurgence in the privacy narrative, ETFs opening up an entry point, the filtering pool getting tighter, shorts getting squeezed, and there are still upgrade expectations ahead. The story hasn't finished, but the short-term picture is already fully priced in.
Only if it holds above 1670 should we talk about the next leg; a drop below around 1500 looks more like a rest first. Chasing at this point has worse price-performance—wait for a pullback or a breakout on higher volume to reassess.
{future}(ZECUSDT)
$ZEC I think this round is basically over, because the three waves have already been completed.
Now it's around 1500–1650; I just touched 1670–1700 and it pulled back. In a month it's nearly doubled, and the market cap is back in the top ten, but it's still some distance from the 2016 round's peak around 3200.
This move is mainly driven by a resurgence in the privacy narrative, ETFs opening up an entry point, the filtering pool getting tighter, shorts getting squeezed, and there are still upgrade expectations ahead. The story hasn't finished, but the short-term picture is already fully priced in.
Only if it holds above 1670 should we talk about the next leg; a drop below around 1500 looks more like a rest first. Chasing at this point has worse price-performance—wait for a pullback or a breakout on higher volume to reassess.
Now it's around 1500–1650; I just touched 1670–1700 and it pulled back. In a month it's nearly doubled, and the market cap is back in the top ten, but it's still some distance from the 2016 round's peak around 3200.
This move is mainly driven by a resurgence in the privacy narrative, ETFs opening up an entry point, the filtering pool getting tighter, shorts getting squeezed, and there are still upgrade expectations ahead. The story hasn't finished, but the short-term picture is already fully priced in.
Only if it holds above 1670 should we talk about the next leg; a drop below around 1500 looks more like a rest first. Chasing at this point has worse price-performance—wait for a pullback or a breakout on higher volume to reassess.
1
1.3k
·
--
$BTC
{future}(BTCUSDT)
💰 Say goodbye to the era of broad-based rallies! 5 golden crypto main themes—choose the right track to make money
The market has moved on from an all-out surge. Capital and sectors continue to diverge. At the moment, only 5 major routes are workable, and their logic differs:
1. Fiat currency depreciation hedge | BTC
Supply is fixed. As a base asset to hedge against fiat overprinting, it’s suitable for long-term allocation. Don’t expect a tenfold fortune.
2. Privacy track | ZEC
Meets on-chain transaction privacy needs and is subject to periodic speculation. However, regulatory risks are high and liquidity is unstable—only suitable for small-position trading.
3. RWA asset tokenization | ETH, SOL, LINK, etc.
A direction strongly promoted by Wall Street: real-world assets are brought on-chain. ETH/SOL serve as underlying base chains, with high long-term ceilings and relatively longer cycles.
4. Cash-flow buyback & burn | HYPE, UNI, PUMP
Earnings come from protocols generating real returns. Buybacks and burns reduce circulating supply. The key validation points are verified income and the authenticity of the burn—if there’s manipulation or fraud, the risk is enormous.
5. Meme attention economy | PONS, PUMP, etc.
Not based on fundamentals, but on community buzz and capital sentiment. The upside can be explosive, but when sentiment fades, drawdowns can be severe—making it the highest risk.
✅ Allocation idea: Diversify across sectors, and prioritize sector leaders. Don’t mix different valuation logics across tracks, and above all, avoid going all-in on a single mainline
$PONS
{future}(PONSUSDT)
$ZEC
{future}(ZECUSDT)
$BTC
💰 Say goodbye to the era of broad-based rallies! 5 golden crypto main themes—choose the right track to make money
The market has moved on from an all-out surge. Capital and sectors continue to diverge. At the moment, only 5 major routes are workable, and their logic differs:
1. Fiat currency depreciation hedge | BTC
Supply is fixed. As a base asset to hedge against fiat overprinting, it’s suitable for long-term allocation. Don’t expect a tenfold fortune.
2. Privacy track | ZEC
Meets on-chain transaction privacy needs and is subject to periodic speculation. However, regulatory risks are high and liquidity is unstable—only suitable for small-position trading.
3. RWA asset tokenization | ETH, SOL, LINK, etc.
A direction strongly promoted by Wall Street: real-world assets are brought on-chain. ETH/SOL serve as underlying base chains, with high long-term ceilings and relatively longer cycles.
4. Cash-flow buyback & burn | HYPE, UNI, PUMP
Earnings come from protocols generating real returns. Buybacks and burns reduce circulating supply. The key validation points are verified income and the authenticity of the burn—if there’s manipulation or fraud, the risk is enormous.
5. Meme attention economy | PONS, PUMP, etc.
Not based on fundamentals, but on community buzz and capital sentiment. The upside can be explosive, but when sentiment fades, drawdowns can be severe—making it the highest risk.
✅ Allocation idea: Diversify across sectors, and prioritize sector leaders. Don’t mix different valuation logics across tracks, and above all, avoid going all-in on a single mainline
$PONS
$ZEC
💰 Say goodbye to the era of broad-based rallies! 5 golden crypto main themes—choose the right track to make money
The market has moved on from an all-out surge. Capital and sectors continue to diverge. At the moment, only 5 major routes are workable, and their logic differs:
1. Fiat currency depreciation hedge | BTC
Supply is fixed. As a base asset to hedge against fiat overprinting, it’s suitable for long-term allocation. Don’t expect a tenfold fortune.
2. Privacy track | ZEC
Meets on-chain transaction privacy needs and is subject to periodic speculation. However, regulatory risks are high and liquidity is unstable—only suitable for small-position trading.
3. RWA asset tokenization | ETH, SOL, LINK, etc.
A direction strongly promoted by Wall Street: real-world assets are brought on-chain. ETH/SOL serve as underlying base chains, with high long-term ceilings and relatively longer cycles.
4. Cash-flow buyback & burn | HYPE, UNI, PUMP
Earnings come from protocols generating real returns. Buybacks and burns reduce circulating supply. The key validation points are verified income and the authenticity of the burn—if there’s manipulation or fraud, the risk is enormous.
5. Meme attention economy | PONS, PUMP, etc.
Not based on fundamentals, but on community buzz and capital sentiment. The upside can be explosive, but when sentiment fades, drawdowns can be severe—making it the highest risk.
✅ Allocation idea: Diversify across sectors, and prioritize sector leaders. Don’t mix different valuation logics across tracks, and above all, avoid going all-in on a single mainline
$PONS
$ZEC
1
492
·
--
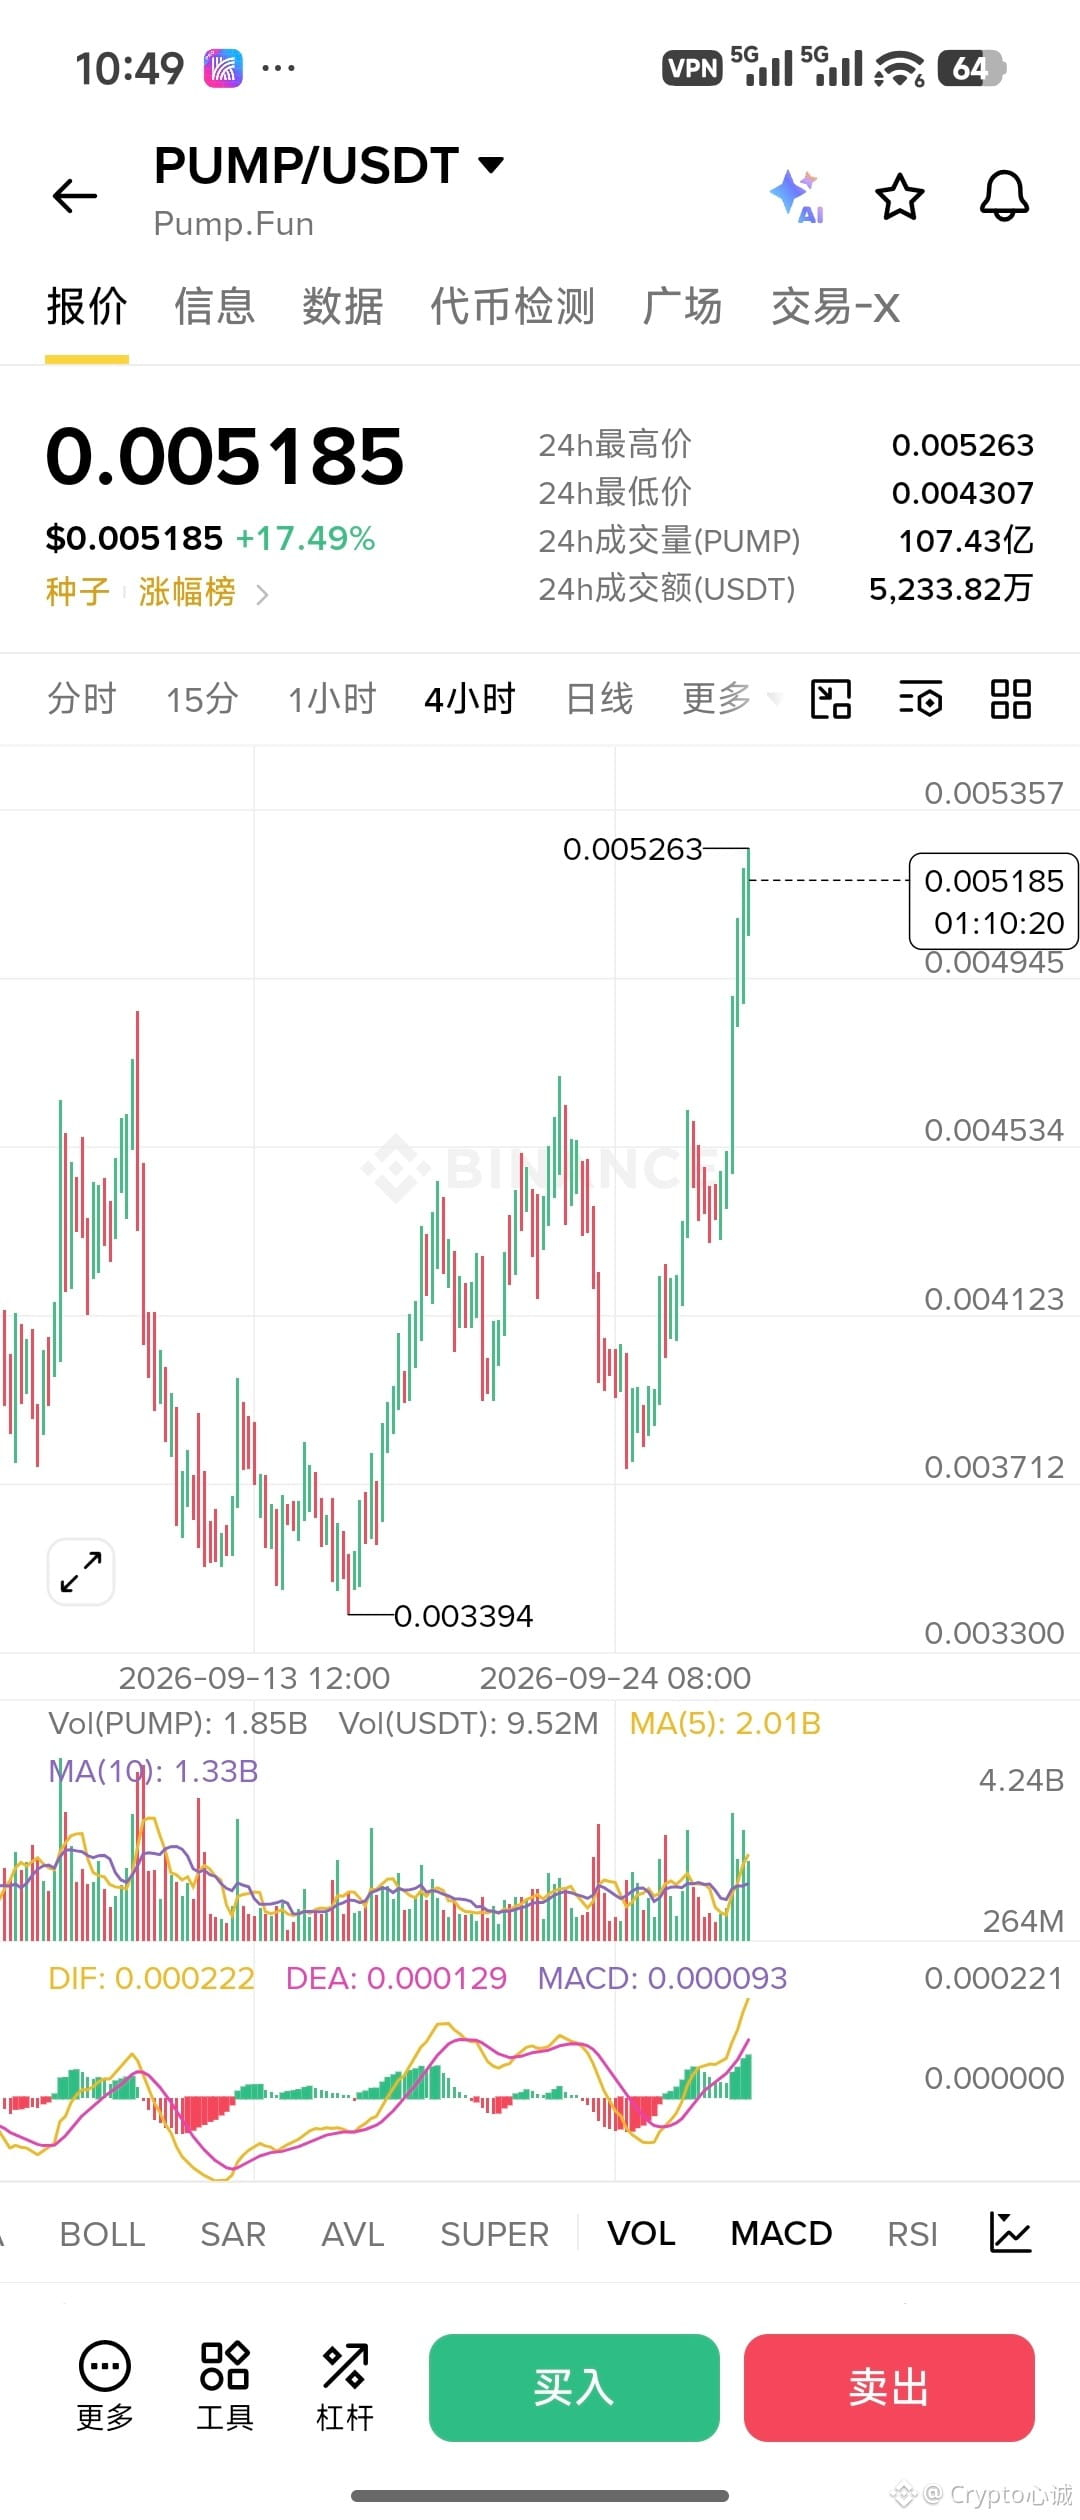
$BTC big bro is all dipping, $PUMP is still charging
Is this the power of buybacks?
In this round, the tokens from the buyback are all doing pretty well.
I think it’s mainly because Pump has been made into a rare kind of “pickaxe” machine in crypto.
It can launch tokens in a few minutes—once the bonding curve is set, people can immediately gamble. The entry barrier has been cut to almost zero. The fee take doesn’t care who wins; it only cares whether people are trading.
Understand the first generation of PVP: you need instant feedback, less preaching. Even rugs can be turned into a meme—news coins and political coins alike still get issued. If you win, then you’re awesome.
With fees in the hundred-million level, a significant portion of the buyback is used for PUMP burn. The better the business, the stronger the buy pressure—and this also suggests that Solana MEMEs are going to come roaring back.
Solana is fast and cheap—issuing tokens, trading, and attention rolling into a flywheel. Then stack live streams and creator revenue sharing to fight for traffic.
The platform is a pump-and-draw machine, and most coins on-chain are just chips. Separate these two things, and only then can you understand why it’s still so strong.
{future}(PUMPUSDT)
{future}(BTCUSDT)
$BTC big bro is all dipping, $PUMP is still charging
Is this the power of buybacks?
In this round, the tokens from the buyback are all doing pretty well.
I think it’s mainly because Pump has been made into a rare kind of “pickaxe” machine in crypto.
It can launch tokens in a few minutes—once the bonding curve is set, people can immediately gamble. The entry barrier has been cut to almost zero. The fee take doesn’t care who wins; it only cares whether people are trading.
Understand the first generation of PVP: you need instant feedback, less preaching. Even rugs can be turned into a meme—news coins and political coins alike still get issued. If you win, then you’re awesome.
With fees in the hundred-million level, a significant portion of the buyback is used for PUMP burn. The better the business, the stronger the buy pressure—and this also suggests that Solana MEMEs are going to come roaring back.
Solana is fast and cheap—issuing tokens, trading, and attention rolling into a flywheel. Then stack live streams and creator revenue sharing to fight for traffic.
The platform is a pump-and-draw machine, and most coins on-chain are just chips. Separate these two things, and only then can you understand why it’s still so strong.
Is this the power of buybacks?
In this round, the tokens from the buyback are all doing pretty well.
I think it’s mainly because Pump has been made into a rare kind of “pickaxe” machine in crypto.
It can launch tokens in a few minutes—once the bonding curve is set, people can immediately gamble. The entry barrier has been cut to almost zero. The fee take doesn’t care who wins; it only cares whether people are trading.
Understand the first generation of PVP: you need instant feedback, less preaching. Even rugs can be turned into a meme—news coins and political coins alike still get issued. If you win, then you’re awesome.
With fees in the hundred-million level, a significant portion of the buyback is used for PUMP burn. The better the business, the stronger the buy pressure—and this also suggests that Solana MEMEs are going to come roaring back.
Solana is fast and cheap—issuing tokens, trading, and attention rolling into a flywheel. Then stack live streams and creator revenue sharing to fight for traffic.
The platform is a pump-and-draw machine, and most coins on-chain are just chips. Separate these two things, and only then can you understand why it’s still so strong.
1
1k
·
--
September 28, 9🈷️28 $BTC Market Analysis
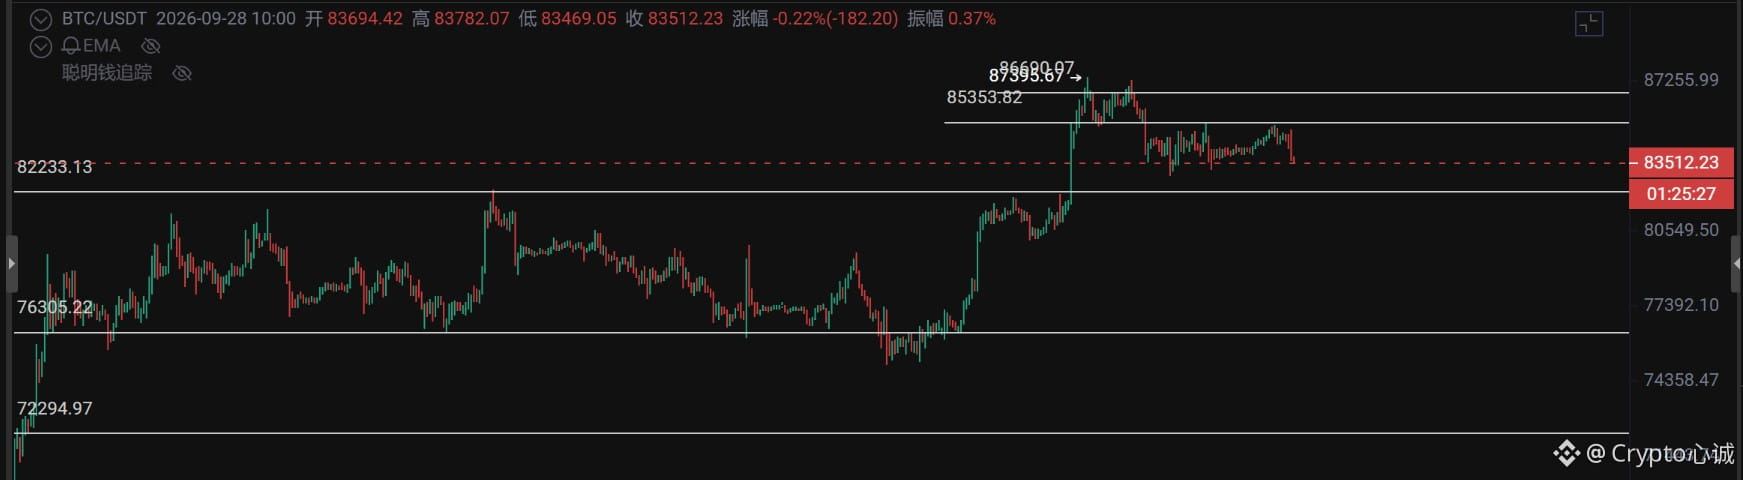
As for the direction of the big coin (BTC), it is still upward. However, over the past two days I’ve been repeatedly mentioning that you should watch for the risk of bearish divergence at high levels on the daily timeframe. At this spot, the upward momentum is gradually weakening. As long as it fails to hold above the 86,700 level, you need to pay attention to the risk of daily-timeframe bearish divergence.
Based on the current changes in the market and its momentum, in my personal view, the short-term risk is greater than the opportunity. Next, focus on whether the 82,300 level can hold. If it can’t, the lower support will likely shift toward 76,500.
So to summarize: for now, this area will mainly see pullbacks—pull back to Wednesday, and then follow up with a small round of rebound.
Support: 82,300–80,000
Resistance: 84,900–85,500
{future}(BTCUSDT)
September 28, 9🈷️28 $BTC Market Analysis
As for the direction of the big coin (BTC), it is still upward. However, over the past two days I’ve been repeatedly mentioning that you should watch for the risk of bearish divergence at high levels on the daily timeframe. At this spot, the upward momentum is gradually weakening. As long as it fails to hold above the 86,700 level, you need to pay attention to the risk of daily-timeframe bearish divergence.
Based on the current changes in the market and its momentum, in my personal view, the short-term risk is greater than the opportunity. Next, focus on whether the 82,300 level can hold. If it can’t, the lower support will likely shift toward 76,500.
So to summarize: for now, this area will mainly see pullbacks—pull back to Wednesday, and then follow up with a small round of rebound.
Support: 82,300–80,000
Resistance: 84,900–85,500
As for the direction of the big coin (BTC), it is still upward. However, over the past two days I’ve been repeatedly mentioning that you should watch for the risk of bearish divergence at high levels on the daily timeframe. At this spot, the upward momentum is gradually weakening. As long as it fails to hold above the 86,700 level, you need to pay attention to the risk of daily-timeframe bearish divergence.
Based on the current changes in the market and its momentum, in my personal view, the short-term risk is greater than the opportunity. Next, focus on whether the 82,300 level can hold. If it can’t, the lower support will likely shift toward 76,500.
So to summarize: for now, this area will mainly see pullbacks—pull back to Wednesday, and then follow up with a small round of rebound.
Support: 82,300–80,000
Resistance: 84,900–85,500
2
433
·
--
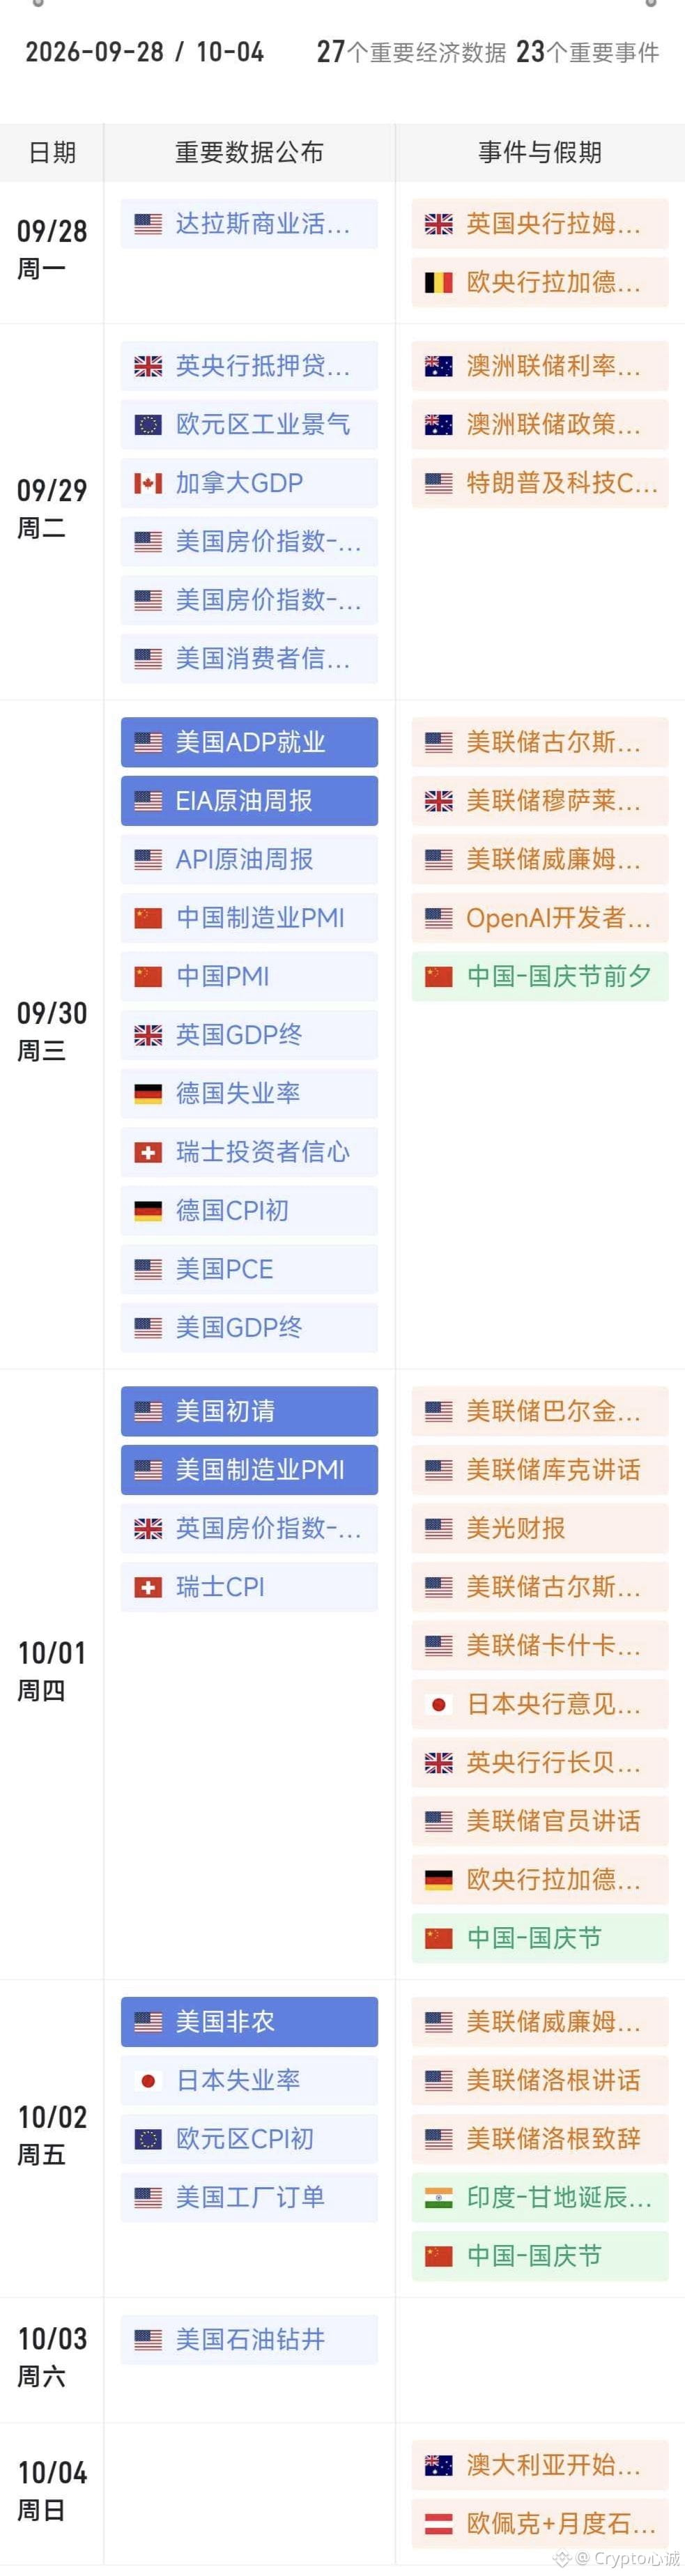
This week (9.28-10.4) Web3 major events
September 28
Bitget will resume withdrawals in phases starting September 28; relevant security vulnerabilities have been fully fixed;
Grayscale’s Zcash ETF will implement a 1-for-3 share split after market close on September 28
Doppler Finance token XDP will be listed on September 28
Agora announced that it will stop issuing the Injective stablecoin AUSD starting April 3; the redemption window will last until September 28
September 29
Robinhood has previewed a new product launch event from September 29 to 30; the CEO said “not to be missed”;
CoinEx announced it will cease operations and withdraw in an orderly manner, stopping all spot trading on September 29;
KBW2026 will open in Seoul on September 29;
The proposal vote on the orderly cessation of operations for Balancer will close on September 29
Entering the activation countdown, the XRP Ledger Batch V1.1 upgrade is expected to take effect after September 29
September 30
The UK’s crypto regulation moves into the implementation stage; the FCA will open applications for crypto asset authorization on September 30
Starting September 30, Shipyard will stop IPFS-related engineering, maintenance, and infrastructure operations
Router Protocol will stop operations and burn 303 million ROUTE tokens by September 30, 2026
Prediction markets and trading terminals will be shut down; the Fireplace website will operate until September 30
Fully shut down: Trepa will stop operations on September 30; the final round of games will be on August 12
October 1
South Korea will introduce civil asset seizure rules for crypto assets starting October 1
A complete ban on crypto ATMs takes effect on October 1, under a bill in Hawaii
A new bill in Alabama will take effect on October 1, creating a legal framework for nonprofit entities similar to DAOs
October 2
The U.S. Department of Labor will release the September nonfarm payroll report on October 2;
October 3
The first proceeds from Hyperliquid AQAv2 are expected to be recorded on October 3
Other (specific times TBD)
The OpenSea Foundation plans to release detailed TGE information in early October;
11 Democratic senators urge the Senate Banking Committee to hold a hearing on prediction markets
$BTC
{future}(BTCUSDT)
This week (9.28-10.4) Web3 major events
September 28
Bitget will resume withdrawals in phases starting September 28; relevant security vulnerabilities have been fully fixed;
Grayscale’s Zcash ETF will implement a 1-for-3 share split after market close on September 28
Doppler Finance token XDP will be listed on September 28
Agora announced that it will stop issuing the Injective stablecoin AUSD starting April 3; the redemption window will last until September 28
September 29
Robinhood has previewed a new product launch event from September 29 to 30; the CEO said “not to be missed”;
CoinEx announced it will cease operations and withdraw in an orderly manner, stopping all spot trading on September 29;
KBW2026 will open in Seoul on September 29;
The proposal vote on the orderly cessation of operations for Balancer will close on September 29
Entering the activation countdown, the XRP Ledger Batch V1.1 upgrade is expected to take effect after September 29
September 30
The UK’s crypto regulation moves into the implementation stage; the FCA will open applications for crypto asset authorization on September 30
Starting September 30, Shipyard will stop IPFS-related engineering, maintenance, and infrastructure operations
Router Protocol will stop operations and burn 303 million ROUTE tokens by September 30, 2026
Prediction markets and trading terminals will be shut down; the Fireplace website will operate until September 30
Fully shut down: Trepa will stop operations on September 30; the final round of games will be on August 12
October 1
South Korea will introduce civil asset seizure rules for crypto assets starting October 1
A complete ban on crypto ATMs takes effect on October 1, under a bill in Hawaii
A new bill in Alabama will take effect on October 1, creating a legal framework for nonprofit entities similar to DAOs
October 2
The U.S. Department of Labor will release the September nonfarm payroll report on October 2;
October 3
The first proceeds from Hyperliquid AQAv2 are expected to be recorded on October 3
Other (specific times TBD)
The OpenSea Foundation plans to release detailed TGE information in early October;
11 Democratic senators urge the Senate Banking Committee to hold a hearing on prediction markets
$BTC
September 28
Bitget will resume withdrawals in phases starting September 28; relevant security vulnerabilities have been fully fixed;
Grayscale’s Zcash ETF will implement a 1-for-3 share split after market close on September 28
Doppler Finance token XDP will be listed on September 28
Agora announced that it will stop issuing the Injective stablecoin AUSD starting April 3; the redemption window will last until September 28
September 29
Robinhood has previewed a new product launch event from September 29 to 30; the CEO said “not to be missed”;
CoinEx announced it will cease operations and withdraw in an orderly manner, stopping all spot trading on September 29;
KBW2026 will open in Seoul on September 29;
The proposal vote on the orderly cessation of operations for Balancer will close on September 29
Entering the activation countdown, the XRP Ledger Batch V1.1 upgrade is expected to take effect after September 29
September 30
The UK’s crypto regulation moves into the implementation stage; the FCA will open applications for crypto asset authorization on September 30
Starting September 30, Shipyard will stop IPFS-related engineering, maintenance, and infrastructure operations
Router Protocol will stop operations and burn 303 million ROUTE tokens by September 30, 2026
Prediction markets and trading terminals will be shut down; the Fireplace website will operate until September 30
Fully shut down: Trepa will stop operations on September 30; the final round of games will be on August 12
October 1
South Korea will introduce civil asset seizure rules for crypto assets starting October 1
A complete ban on crypto ATMs takes effect on October 1, under a bill in Hawaii
A new bill in Alabama will take effect on October 1, creating a legal framework for nonprofit entities similar to DAOs
October 2
The U.S. Department of Labor will release the September nonfarm payroll report on October 2;
October 3
The first proceeds from Hyperliquid AQAv2 are expected to be recorded on October 3
Other (specific times TBD)
The OpenSea Foundation plans to release detailed TGE information in early October;
11 Democratic senators urge the Senate Banking Committee to hold a hearing on prediction markets
$BTC
1
447
Log in to explore more content
Join global crypto users on Binance Square
⚡️ Get latest and useful information about crypto.
💬 Trusted by the world’s largest crypto exchange.
👍 Discover real insights from verified creators.
Email / Phone number
Trending Topics
EtherGains70.9%InQ3
140,658 views
1,107 Discussing
One of the best third quarters in history 💰
September closed out last night, and with it, the quarter. For the quarter, BTC is up 42%—the second-best Q3 on record. ETH had a record-breaking Q3 overall, up 70%.
Looking at the chart, things are still looking good: we’re holding support, but we’re testing it more and more often. Plus, ETF momentum is weakening — inflows are gradually declining, and yesterday saw outflows for the first time in a long while.
Yes, historically, October has been a good month for crypto — it’s not called “Uptober” for nothing. But it’s also one of the most volatile months. Last year, for example, we managed to hit a new all-time high (ATH) and experience a flash crash.
🚀 High Accuracy Trades.
$BTC
$ETH
$SOL
#EtherGains70.9%InQ3 #DollarIndexHitsHighestSinceMay2025 #CFTCSubmitsTwoEventContractRulesToWhiteHouse #MicronBeatsEarningsLiftsGuidance
Knowledge is Power
·0 Likes
·226 views
TreasuryLetsStatesFileStablecoinCertificationsEarly
7,357 views
78 Discussing
US10YearYieldNears5.3%
144,891 views
1,109 Discussing