
Unknownbwlochh
51 Posts

Unknownbwlochh
Report
Block User
living a good life. Alhamdulillah 🤲🏻
2.9 Years
32 Following
7 Followers
16 Liked
Posts
·
--
Bullish
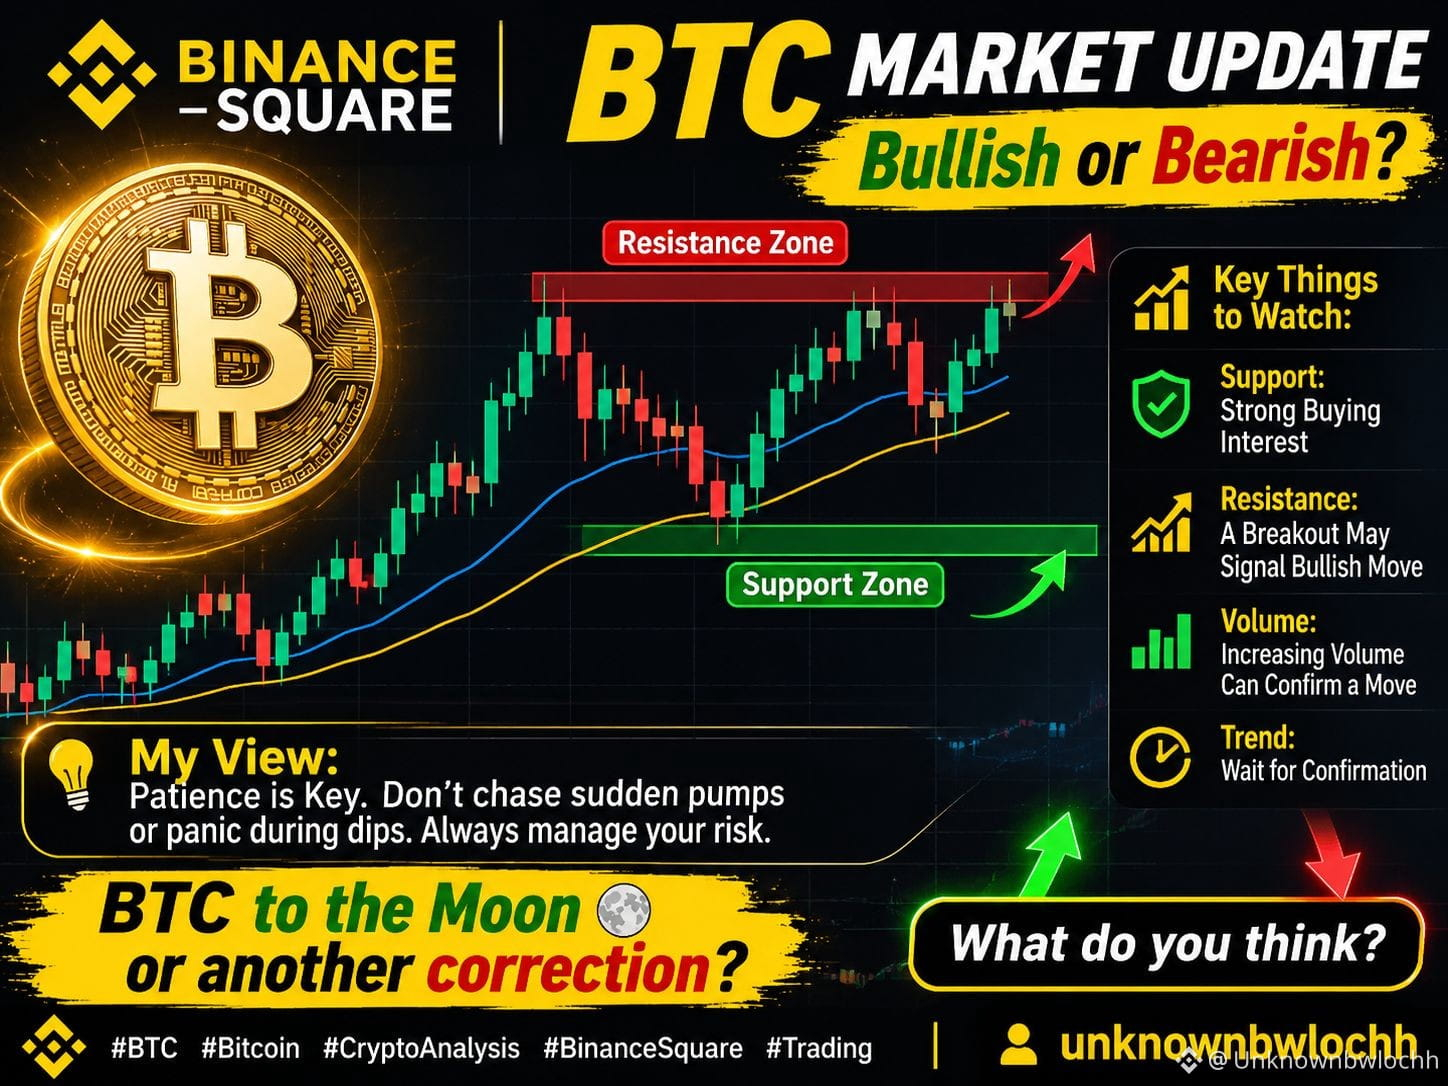
🚀 $BTC MARKET WATCH | BULLISH OR BEARISH?
#Bitcoin remains one of the most important coins to watch in the crypto market.
📊 Key Things to Watch:
Support: Watch for strong buying interest.
Resistance: A breakout may signal bullish momentum.
Volume: Increasing volume can help confirm a move.
Trend: Wait for confirmation before making a decision.
⚡ My View: Patience is key. Don't chase sudden pumps or panic during dips. Always manage your risk.
What do you think? BTC to the Moon 🌕 or another correction?
#BTC #Bitcoin #CryptoAnalysis #Trading
unknownbwlochh
{future}(BTCUSDT)
🚀 $BTC MARKET WATCH | BULLISH OR BEARISH?
#Bitcoin remains one of the most important coins to watch in the crypto market.
📊 Key Things to Watch:
Support: Watch for strong buying interest.
Resistance: A breakout may signal bullish momentum.
Volume: Increasing volume can help confirm a move.
Trend: Wait for confirmation before making a decision.
⚡ My View: Patience is key. Don't chase sudden pumps or panic during dips. Always manage your risk.
What do you think? BTC to the Moon 🌕 or another correction?
#BTC #Bitcoin #CryptoAnalysis #Trading
unknownbwlochh
#Bitcoin remains one of the most important coins to watch in the crypto market.
📊 Key Things to Watch:
Support: Watch for strong buying interest.
Resistance: A breakout may signal bullish momentum.
Volume: Increasing volume can help confirm a move.
Trend: Wait for confirmation before making a decision.
⚡ My View: Patience is key. Don't chase sudden pumps or panic during dips. Always manage your risk.
What do you think? BTC to the Moon 🌕 or another correction?
#BTC #Bitcoin #CryptoAnalysis #Trading
unknownbwlochh
86
·
--
Bullish
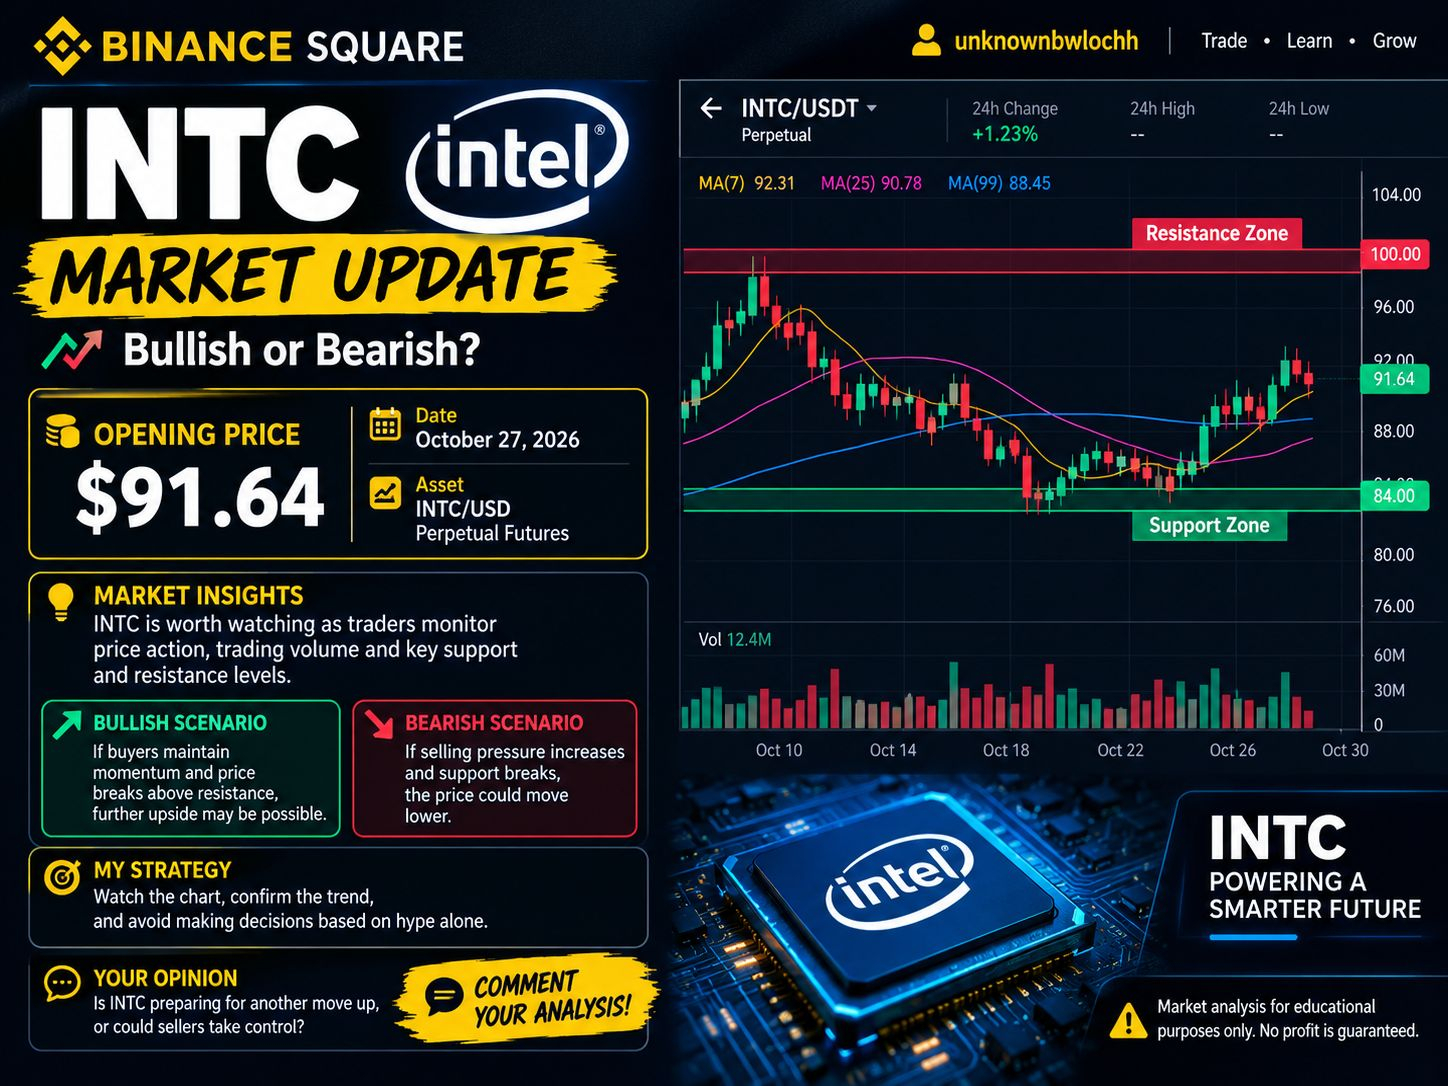
📊 $INTC MARKET UPDATE | Bullish or Bearish?
🚀 Opening Price: $91.64
📅 Date: October 27, 2026
🏷️ Asset: INTC/USD Perpetual Futures
🔍 Market Insights
#INTC is worth watching as traders monitor price action, trading volume, and key support and resistance levels.
📈 Bullish Scenario: If buyers maintain momentum and price breaks above resistance, further upside may be possible.
📉 Bearish Scenario: If selling pressure increases and support breaks, the price could move lower.
🎯 My Strategy: Watch the chart, confirm the trend, and avoid making decisions based on hype alone.
💬 Your Opinion: Is INTC preparing for another move up, or could sellers take control?
👇 Comment your analysis!
⚠️ Market analysis for educational purposes only. No profit is guaranteed.
#INTC #CryptoAnalysis #BinanceSquare #Trading
{future}(INTCUSDT)
📊 $INTC MARKET UPDATE | Bullish or Bearish?
🚀 Opening Price: $91.64
📅 Date: October 27, 2026
🏷️ Asset: INTC/USD Perpetual Futures
🔍 Market Insights
#INTC is worth watching as traders monitor price action, trading volume, and key support and resistance levels.
📈 Bullish Scenario: If buyers maintain momentum and price breaks above resistance, further upside may be possible.
📉 Bearish Scenario: If selling pressure increases and support breaks, the price could move lower.
🎯 My Strategy: Watch the chart, confirm the trend, and avoid making decisions based on hype alone.
💬 Your Opinion: Is INTC preparing for another move up, or could sellers take control?
👇 Comment your analysis!
⚠️ Market analysis for educational purposes only. No profit is guaranteed.
#INTC #CryptoAnalysis #BinanceSquare #Trading
🚀 Opening Price: $91.64
📅 Date: October 27, 2026
🏷️ Asset: INTC/USD Perpetual Futures
🔍 Market Insights
#INTC is worth watching as traders monitor price action, trading volume, and key support and resistance levels.
📈 Bullish Scenario: If buyers maintain momentum and price breaks above resistance, further upside may be possible.
📉 Bearish Scenario: If selling pressure increases and support breaks, the price could move lower.
🎯 My Strategy: Watch the chart, confirm the trend, and avoid making decisions based on hype alone.
💬 Your Opinion: Is INTC preparing for another move up, or could sellers take control?
👇 Comment your analysis!
⚠️ Market analysis for educational purposes only. No profit is guaranteed.
#INTC #CryptoAnalysis #BinanceSquare #Trading
374
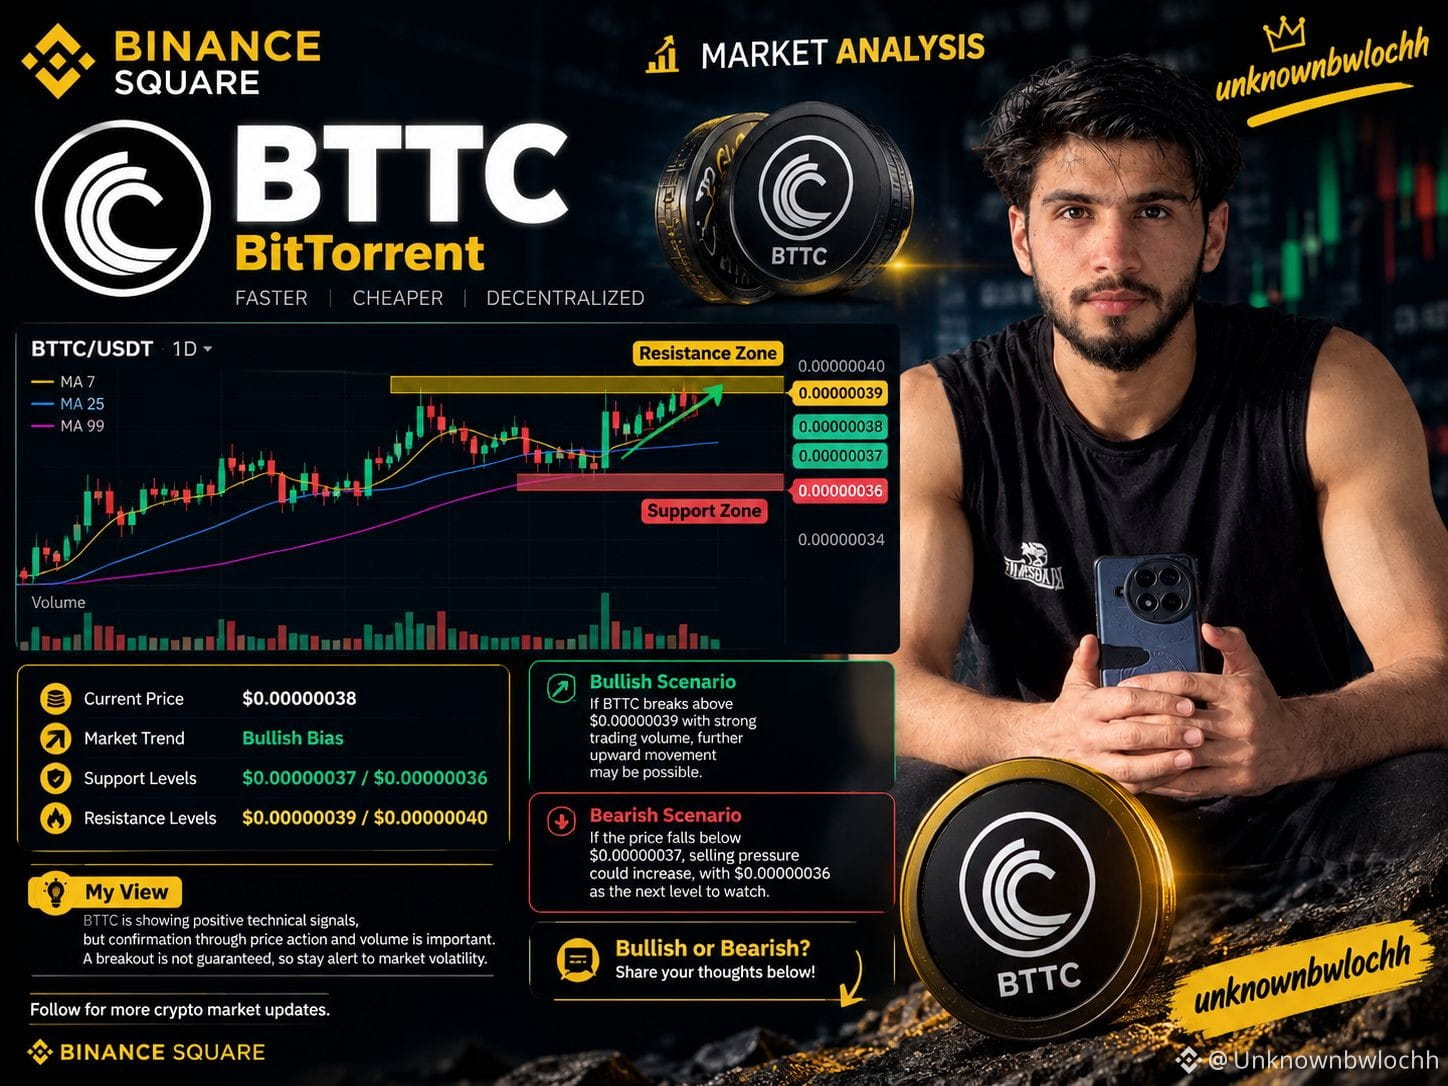
🚀 $BTTC (BitTorrent) — Market Analysis 📊
🔹 Current Price: ~$0.00000038
🔹 Market Trend: Bullish bias
🔹 Support Levels: $0.00000037 / $0.00000036
🔹 Resistance Levels: $0.00000039 / $0.00000040
📈 Bullish Scenario: If BTTC breaks above $0.00000039 with strong trading volume, further upward movement may be possible.
📉 Bearish Scenario: If the price falls below $0.00000037, selling pressure could increase, with $0.00000036 as the next level to watch.
🔍 My View: BTTC is showing positive technical signals, but confirmation through price action and volume is important. A breakout is not guaranteed, so stay alert to market volatility.
💬 Question: Are you bullish or bearish on BTTC? Share your thoughts below! 👇
Follow for more crypto market updates.
Creator: unknownbwlochh
#BTTC #BitTorrent #CryptoAnalysis #BinanceSquare #Write2Earn
{spot}(BTTCUSDT)
🚀 $BTTC (BitTorrent) — Market Analysis 📊
🔹 Current Price: ~$0.00000038
🔹 Market Trend: Bullish bias
🔹 Support Levels: $0.00000037 / $0.00000036
🔹 Resistance Levels: $0.00000039 / $0.00000040
📈 Bullish Scenario: If BTTC breaks above $0.00000039 with strong trading volume, further upward movement may be possible.
📉 Bearish Scenario: If the price falls below $0.00000037, selling pressure could increase, with $0.00000036 as the next level to watch.
🔍 My View: BTTC is showing positive technical signals, but confirmation through price action and volume is important. A breakout is not guaranteed, so stay alert to market volatility.
💬 Question: Are you bullish or bearish on BTTC? Share your thoughts below! 👇
Follow for more crypto market updates.
Creator: unknownbwlochh
#BTTC #BitTorrent #CryptoAnalysis #BinanceSquare #Write2Earn
🔹 Current Price: ~$0.00000038
🔹 Market Trend: Bullish bias
🔹 Support Levels: $0.00000037 / $0.00000036
🔹 Resistance Levels: $0.00000039 / $0.00000040
📈 Bullish Scenario: If BTTC breaks above $0.00000039 with strong trading volume, further upward movement may be possible.
📉 Bearish Scenario: If the price falls below $0.00000037, selling pressure could increase, with $0.00000036 as the next level to watch.
🔍 My View: BTTC is showing positive technical signals, but confirmation through price action and volume is important. A breakout is not guaranteed, so stay alert to market volatility.
💬 Question: Are you bullish or bearish on BTTC? Share your thoughts below! 👇
Follow for more crypto market updates.
Creator: unknownbwlochh
#BTTC #BitTorrent #CryptoAnalysis #BinanceSquare #Write2Earn
4
833
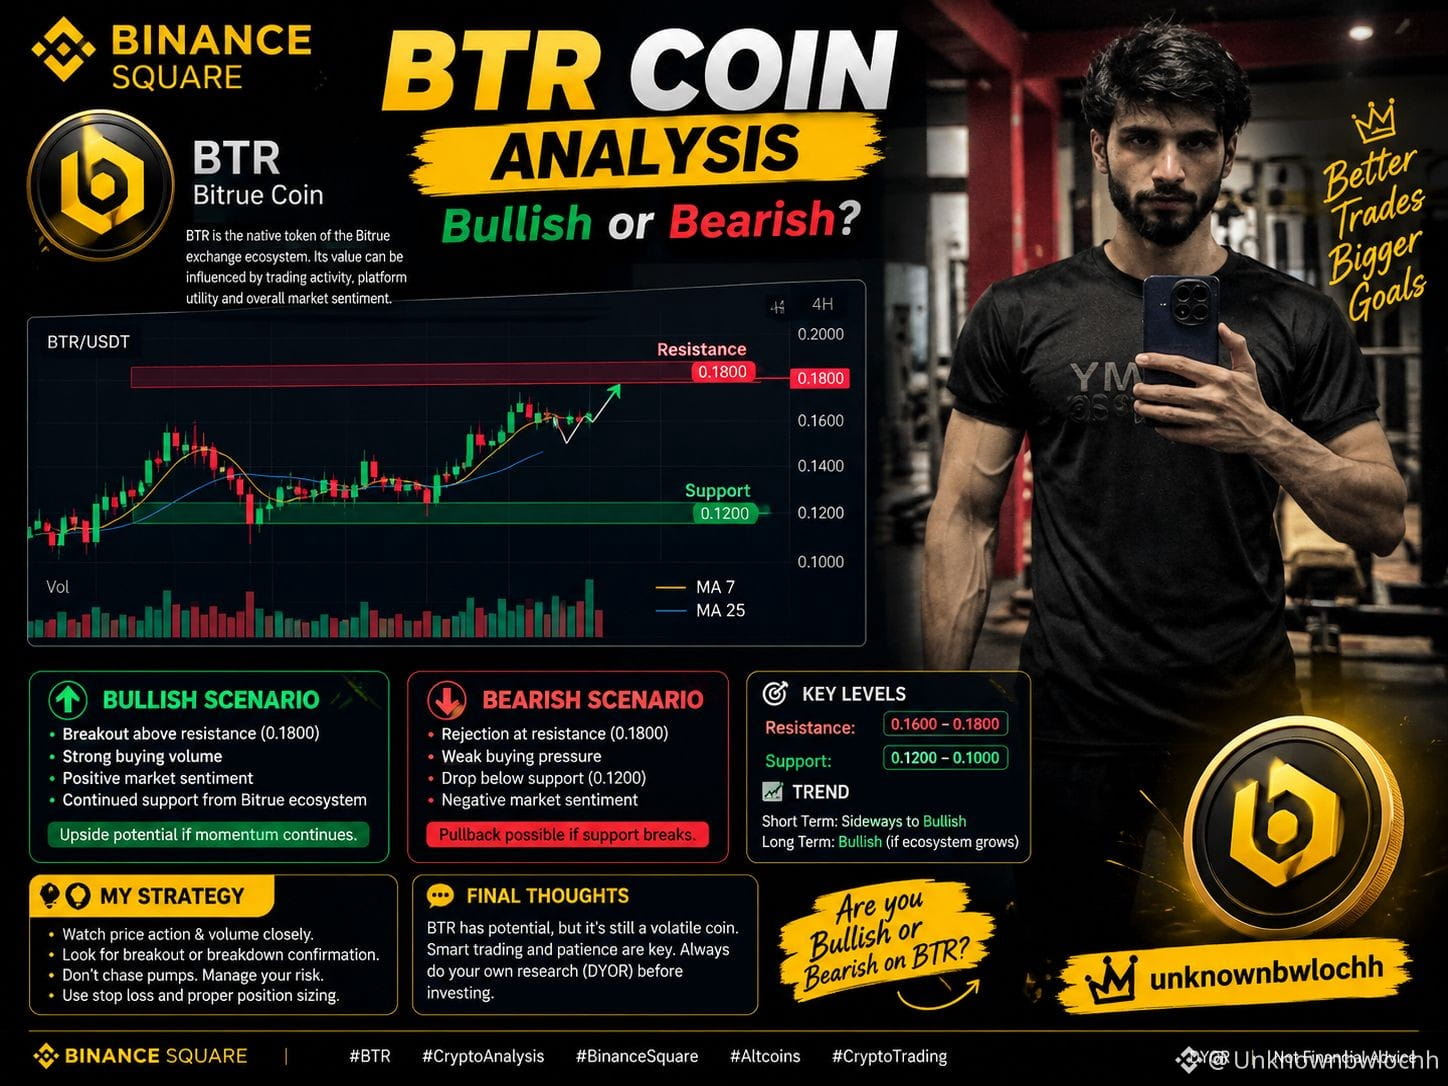
🚀 $BTR COIN ANALYSIS | Bullish or Bearish?
🔍 Coin: #BTR (Bitrue Coin)
📊 Market Overview:
#BTR is an exchange utility token connected to the Bitrue ecosystem. Its price can be influenced by trading activity, market sentiment, and demand for platform utilities.
🟢 Bullish Scenario:
If buying volume increases and BTR breaks above resistance with strong momentum, further upside may be possible.
🔴 Bearish Scenario:
If buying pressure weakens or price falls below support, a pullback could follow.
🎯 My Strategy:
Watch the latest chart, trading volume, and support/resistance levels before making any decision. Avoid chasing sudden price pumps.
💬 Discussion: Are you bullish or bearish on BTR?
⚠️ Crypto is highly volatile. This is market commentary, not a guarantee of profit. Always do your own research.
#BTR #CryptoAnalysis #BinanceSquare
🚀 $BTR COIN ANALYSIS | Bullish or Bearish?
🔍 Coin: #BTR (Bitrue Coin)
📊 Market Overview:
#BTR is an exchange utility token connected to the Bitrue ecosystem. Its price can be influenced by trading activity, market sentiment, and demand for platform utilities.
🟢 Bullish Scenario:
If buying volume increases and BTR breaks above resistance with strong momentum, further upside may be possible.
🔴 Bearish Scenario:
If buying pressure weakens or price falls below support, a pullback could follow.
🎯 My Strategy:
Watch the latest chart, trading volume, and support/resistance levels before making any decision. Avoid chasing sudden price pumps.
💬 Discussion: Are you bullish or bearish on BTR?
⚠️ Crypto is highly volatile. This is market commentary, not a guarantee of profit. Always do your own research.
#BTR #CryptoAnalysis #BinanceSquare
🔍 Coin: #BTR (Bitrue Coin)
📊 Market Overview:
#BTR is an exchange utility token connected to the Bitrue ecosystem. Its price can be influenced by trading activity, market sentiment, and demand for platform utilities.
🟢 Bullish Scenario:
If buying volume increases and BTR breaks above resistance with strong momentum, further upside may be possible.
🔴 Bearish Scenario:
If buying pressure weakens or price falls below support, a pullback could follow.
🎯 My Strategy:
Watch the latest chart, trading volume, and support/resistance levels before making any decision. Avoid chasing sudden price pumps.
💬 Discussion: Are you bullish or bearish on BTR?
⚠️ Crypto is highly volatile. This is market commentary, not a guarantee of profit. Always do your own research.
#BTR #CryptoAnalysis #BinanceSquare
6

25
·
--
Bullish
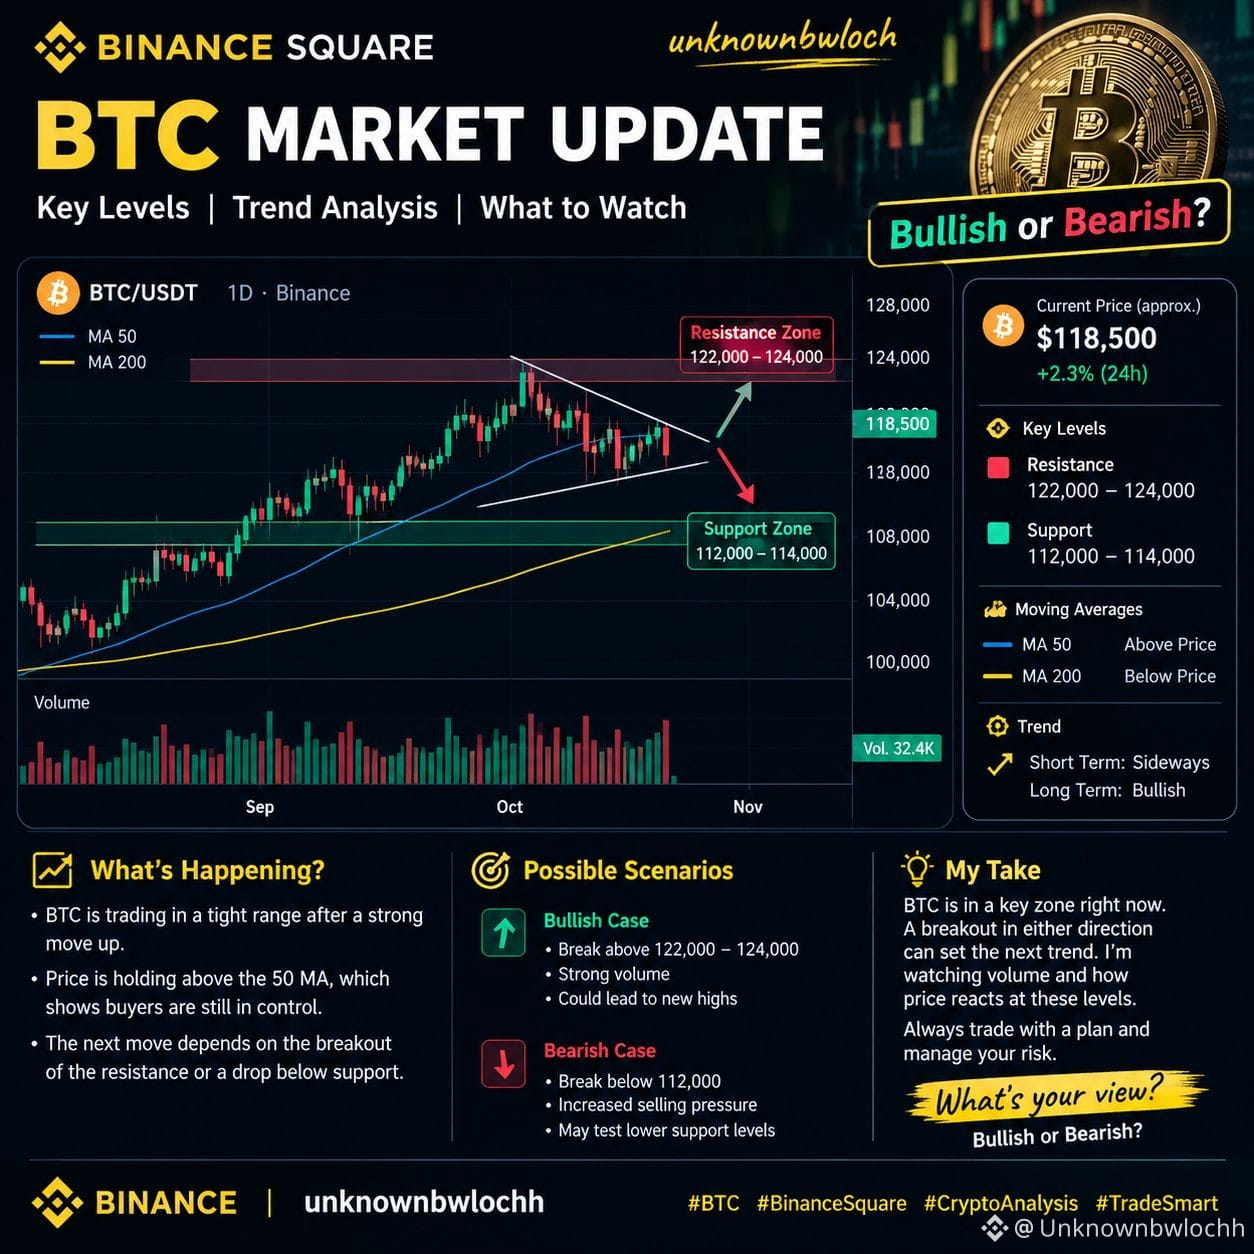
🚨 #BITCOIN AT A CRITICAL ZONE — BREAKOUT OR BREAKDOWN? 👀
Bitcoin traders, this is the moment to watch! 📊
Instead of blindly predicting the next move, I’m watching three important signals:
🔹 1. Price Action: Will $BTC break above resistance with a strong daily candle?
🔹 2. Trading Volume: A breakout with increasing volume may provide stronger confirmation.
🔹 3. Market Sentiment: If buyers lose momentum, $BTC could revisit lower support levels.
🐂 BULLISH SCENARIO: A confirmed breakout with strong volume could support further upside.
🐻 BEARISH SCENARIO: A rejection at resistance or a breakdown below support could bring more selling pressure.
⚠️ These are possible scenarios, not guaranteed predictions. Always verify live chart levels before making a decision.
💬 LET'S DISCUSS!
If you had to choose based on the current chart, would you expect a BREAKOUT 📈 or a PULLBACK 📉?
Tell me WHY in the comments — let's learn from each other's analysis! 👇
Follow @unknownbwlochh for more original crypto market updates.
$BTC #Bitcoin #BinanceSquare #CryptoAnalysis
{future}(BTCUSDT)
🚨 #BITCOIN AT A CRITICAL ZONE — BREAKOUT OR BREAKDOWN? 👀
Bitcoin traders, this is the moment to watch! 📊
Instead of blindly predicting the next move, I’m watching three important signals:
🔹 1. Price Action: Will $BTC break above resistance with a strong daily candle?
🔹 2. Trading Volume: A breakout with increasing volume may provide stronger confirmation.
🔹 3. Market Sentiment: If buyers lose momentum, $BTC could revisit lower support levels.
🐂 BULLISH SCENARIO: A confirmed breakout with strong volume could support further upside.
🐻 BEARISH SCENARIO: A rejection at resistance or a breakdown below support could bring more selling pressure.
⚠️ These are possible scenarios, not guaranteed predictions. Always verify live chart levels before making a decision.
💬 LET'S DISCUSS!
If you had to choose based on the current chart, would you expect a BREAKOUT 📈 or a PULLBACK 📉?
Tell me WHY in the comments — let's learn from each other's analysis! 👇
Follow @unknownbwlochh for more original crypto market updates.
$BTC #Bitcoin #BinanceSquare #CryptoAnalysis
Bitcoin traders, this is the moment to watch! 📊
Instead of blindly predicting the next move, I’m watching three important signals:
🔹 1. Price Action: Will $BTC break above resistance with a strong daily candle?
🔹 2. Trading Volume: A breakout with increasing volume may provide stronger confirmation.
🔹 3. Market Sentiment: If buyers lose momentum, $BTC could revisit lower support levels.
🐂 BULLISH SCENARIO: A confirmed breakout with strong volume could support further upside.
🐻 BEARISH SCENARIO: A rejection at resistance or a breakdown below support could bring more selling pressure.
⚠️ These are possible scenarios, not guaranteed predictions. Always verify live chart levels before making a decision.
💬 LET'S DISCUSS!
If you had to choose based on the current chart, would you expect a BREAKOUT 📈 or a PULLBACK 📉?
Tell me WHY in the comments — let's learn from each other's analysis! 👇
Follow @unknownbwlochh for more original crypto market updates.
$BTC #Bitcoin #BinanceSquare #CryptoAnalysis
95
·
--
Bullish
📊 $BNB (Binance Coin) Market Analysis 🚀
🔥 $BNB is showing positive momentum!
BNB is trading around $746, up approximately 2.8% over the last 24 hours. Buyers are attempting to push the price higher, but resistance remains an important level to watch. citeturn369741search0
📈 Technical Analysis
🟢 Resistance: $750–$757
🟢 Support: $727–$732
🚀 Bullish Scenario: A strong breakout above $757 with increased volume could support further upside.
⚠️ Bearish Scenario: A drop below $727 could bring additional selling pressure.
🎯 Market Outlook: Short-term momentum looks positive, but confirmation above resistance is important.
💡 Trading Insight: Watch price action and volume before making any decision. Avoid chasing sudden pumps.
What do you think? BNB to $780 next, or a pullback first? 👇
#BNB #Binance #CryptoAnalysis #BNBUSDT #CryptoMarket
{future}(BNBUSDT)
📊 $BNB (Binance Coin) Market Analysis 🚀
🔥 $BNB is showing positive momentum!
BNB is trading around $746, up approximately 2.8% over the last 24 hours. Buyers are attempting to push the price higher, but resistance remains an important level to watch. citeturn369741search0
📈 Technical Analysis
🟢 Resistance: $750–$757
🟢 Support: $727–$732
🚀 Bullish Scenario: A strong breakout above $757 with increased volume could support further upside.
⚠️ Bearish Scenario: A drop below $727 could bring additional selling pressure.
🎯 Market Outlook: Short-term momentum looks positive, but confirmation above resistance is important.
💡 Trading Insight: Watch price action and volume before making any decision. Avoid chasing sudden pumps.
What do you think? BNB to $780 next, or a pullback first? 👇
#BNB #Binance #CryptoAnalysis #BNBUSDT #CryptoMarket
🔥 $BNB is showing positive momentum!
BNB is trading around $746, up approximately 2.8% over the last 24 hours. Buyers are attempting to push the price higher, but resistance remains an important level to watch. citeturn369741search0
📈 Technical Analysis
🟢 Resistance: $750–$757
🟢 Support: $727–$732
🚀 Bullish Scenario: A strong breakout above $757 with increased volume could support further upside.
⚠️ Bearish Scenario: A drop below $727 could bring additional selling pressure.
🎯 Market Outlook: Short-term momentum looks positive, but confirmation above resistance is important.
💡 Trading Insight: Watch price action and volume before making any decision. Avoid chasing sudden pumps.
What do you think? BNB to $780 next, or a pullback first? 👇
#BNB #Binance #CryptoAnalysis #BNBUSDT #CryptoMarket

68
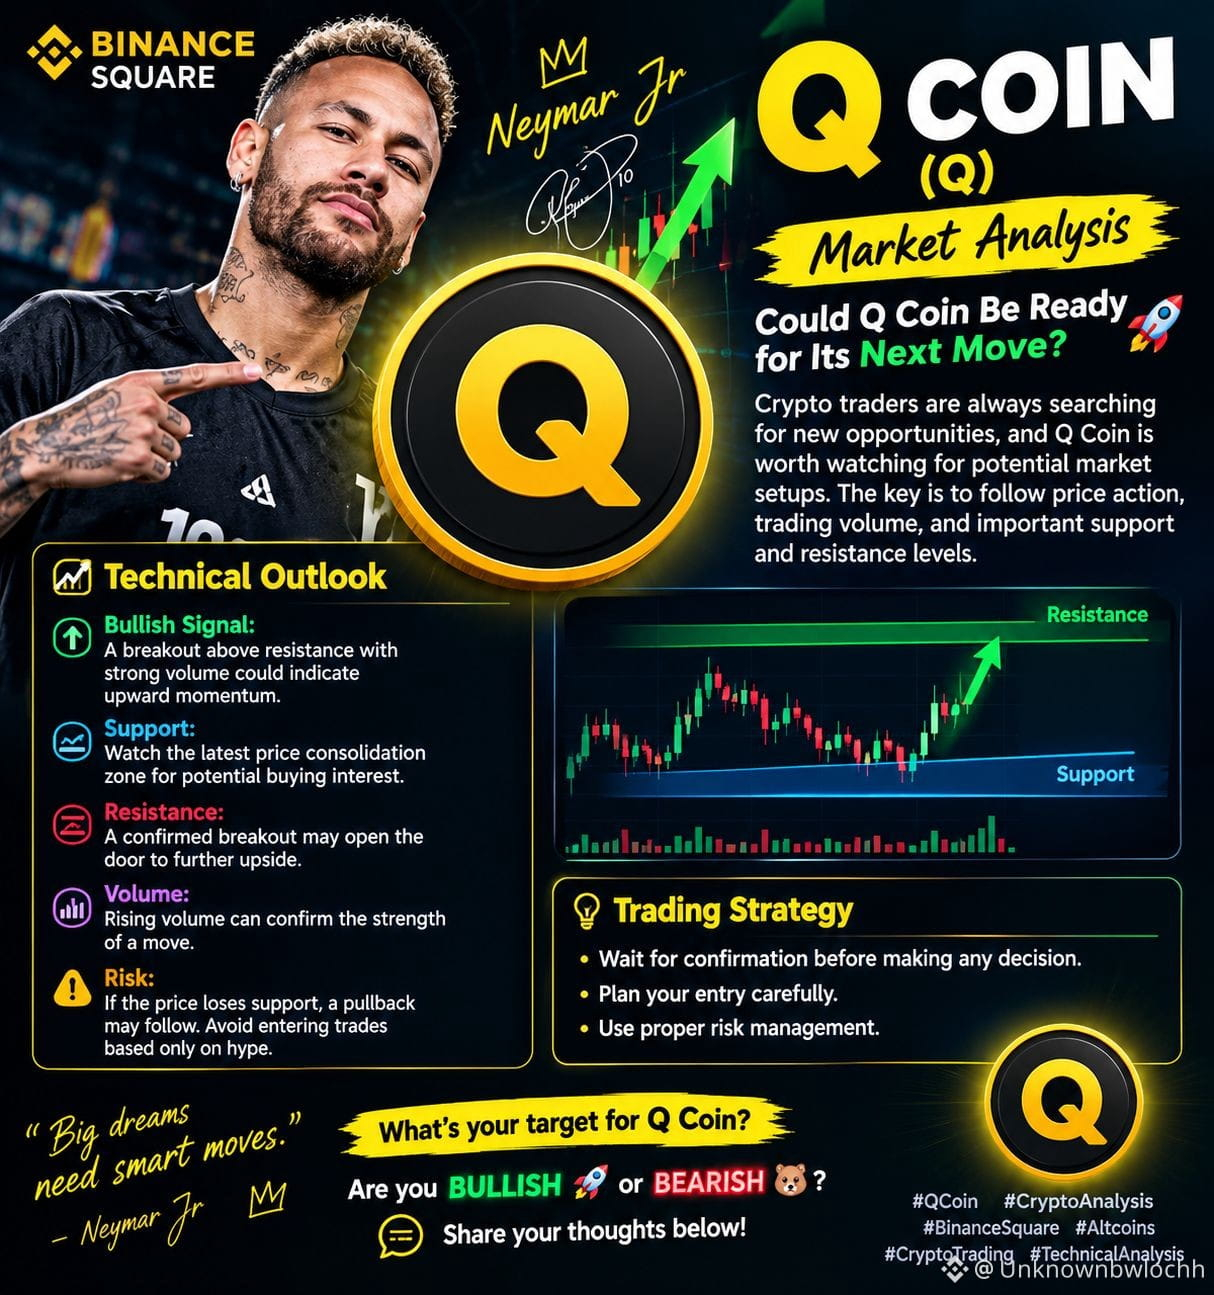
🚀 $QQQB Coin (Q) — Crypto Market Analysis 📊
🔥 Could Q Coin Be Ready for Its Next Move?
Crypto traders are always searching for new opportunities, and Q Coin is worth watching for potential market setups. The key is to follow price action, trading volume, and important support and resistance levels.
📈 Technical Outlook
🟢 Bullish Signal: A breakout above resistance with strong volume could indicate upward momentum.
🎯 Support: Watch the latest price consolidation zone for potential buying interest.
🚀 Resistance: A confirmed breakout may open the door to further upside.
⚠️ Risk Management: If the price loses support, a pullback may follow. Avoid entering trades based only on hype.
💡 Trading Strategy: Wait for confirmation, plan your entry carefully, and always use proper risk management.
💬 What's your target for $Q Coin?
Are you BULLISH 🚀 or BEARISH 🐻? Share your thoughts below!
#QCoin #CryptoAnalysis #BinanceSquare #Altcoins #CryptoTrading
{spot}(QQQBUSDT)
🚀 $QQQB Coin (Q) — Crypto Market Analysis 📊
🔥 Could Q Coin Be Ready for Its Next Move?
Crypto traders are always searching for new opportunities, and Q Coin is worth watching for potential market setups. The key is to follow price action, trading volume, and important support and resistance levels.
📈 Technical Outlook
🟢 Bullish Signal: A breakout above resistance with strong volume could indicate upward momentum.
🎯 Support: Watch the latest price consolidation zone for potential buying interest.
🚀 Resistance: A confirmed breakout may open the door to further upside.
⚠️ Risk Management: If the price loses support, a pullback may follow. Avoid entering trades based only on hype.
💡 Trading Strategy: Wait for confirmation, plan your entry carefully, and always use proper risk management.
💬 What's your target for $Q Coin?
Are you BULLISH 🚀 or BEARISH 🐻? Share your thoughts below!
#QCoin #CryptoAnalysis #BinanceSquare #Altcoins #CryptoTrading
🔥 Could Q Coin Be Ready for Its Next Move?
Crypto traders are always searching for new opportunities, and Q Coin is worth watching for potential market setups. The key is to follow price action, trading volume, and important support and resistance levels.
📈 Technical Outlook
🟢 Bullish Signal: A breakout above resistance with strong volume could indicate upward momentum.
🎯 Support: Watch the latest price consolidation zone for potential buying interest.
🚀 Resistance: A confirmed breakout may open the door to further upside.
⚠️ Risk Management: If the price loses support, a pullback may follow. Avoid entering trades based only on hype.
💡 Trading Strategy: Wait for confirmation, plan your entry carefully, and always use proper risk management.
💬 What's your target for $Q Coin?
Are you BULLISH 🚀 or BEARISH 🐻? Share your thoughts below!
#QCoin #CryptoAnalysis #BinanceSquare #Altcoins #CryptoTrading
64
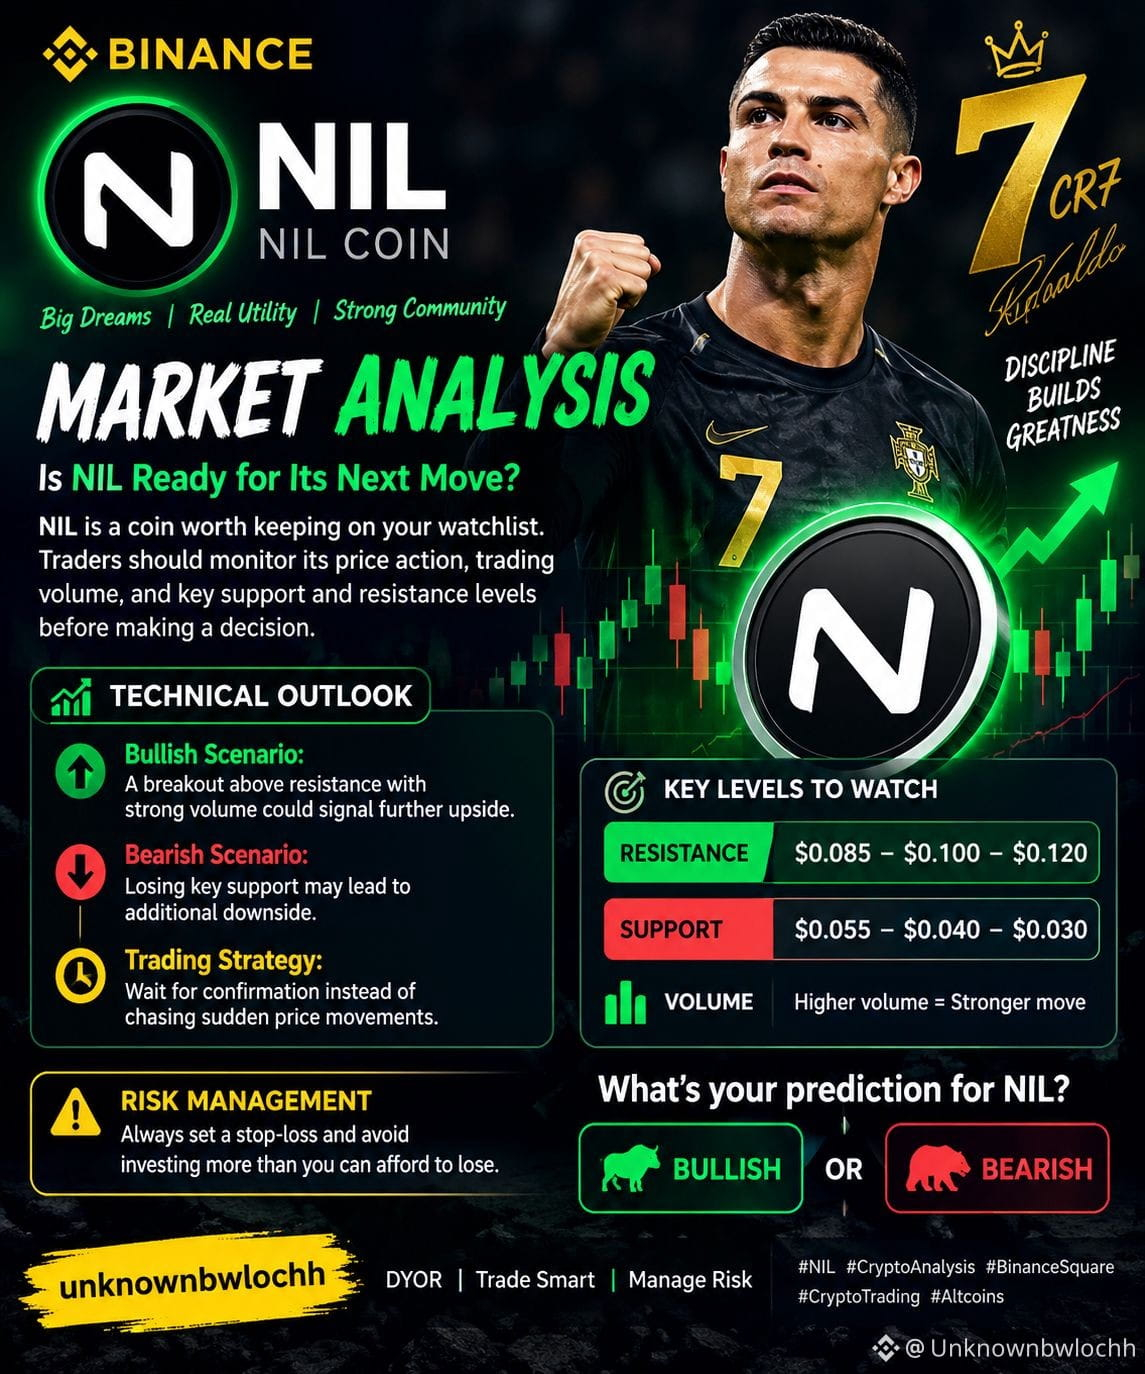
🚀 $NIL COIN (#NIL ) — MARKET ANALYSIS 📊
🔥 Is #NIL Ready for Its Next Move?
NIL is a coin worth keeping on your watchlist. Traders should monitor its price action, trading volume, and key support and resistance levels before making a decision.
📈 Technical Outlook
🔹 Bullish Scenario: A breakout above resistance with strong volume could signal further upside.
🔹 Bearish Scenario: Losing key support may lead to additional downside.
🔹 Trading Strategy: Wait for confirmation instead of chasing sudden price movements.
⚠️ Risk Management: Always set a stop-loss and avoid investing more than you can afford to lose.
💬 What's your prediction for NIL?
🐂 BULLISH or 🐻 BEARISH?
DYOR | Trade Smart | Manage Risk
#NIL #CryptoAnalysis #Altcoins
unknownbwlochh
{future}(NILUSDT)
🚀 $NIL COIN (#NIL ) — MARKET ANALYSIS 📊
🔥 Is #NIL Ready for Its Next Move?
NIL is a coin worth keeping on your watchlist. Traders should monitor its price action, trading volume, and key support and resistance levels before making a decision.
📈 Technical Outlook
🔹 Bullish Scenario: A breakout above resistance with strong volume could signal further upside.
🔹 Bearish Scenario: Losing key support may lead to additional downside.
🔹 Trading Strategy: Wait for confirmation instead of chasing sudden price movements.
⚠️ Risk Management: Always set a stop-loss and avoid investing more than you can afford to lose.
💬 What's your prediction for NIL?
🐂 BULLISH or 🐻 BEARISH?
DYOR | Trade Smart | Manage Risk
#NIL #CryptoAnalysis #Altcoins
unknownbwlochh
🔥 Is #NIL Ready for Its Next Move?
NIL is a coin worth keeping on your watchlist. Traders should monitor its price action, trading volume, and key support and resistance levels before making a decision.
📈 Technical Outlook
🔹 Bullish Scenario: A breakout above resistance with strong volume could signal further upside.
🔹 Bearish Scenario: Losing key support may lead to additional downside.
🔹 Trading Strategy: Wait for confirmation instead of chasing sudden price movements.
⚠️ Risk Management: Always set a stop-loss and avoid investing more than you can afford to lose.
💬 What's your prediction for NIL?
🐂 BULLISH or 🐻 BEARISH?
DYOR | Trade Smart | Manage Risk
#NIL #CryptoAnalysis #Altcoins
unknownbwlochh
99
·
--
Bullish
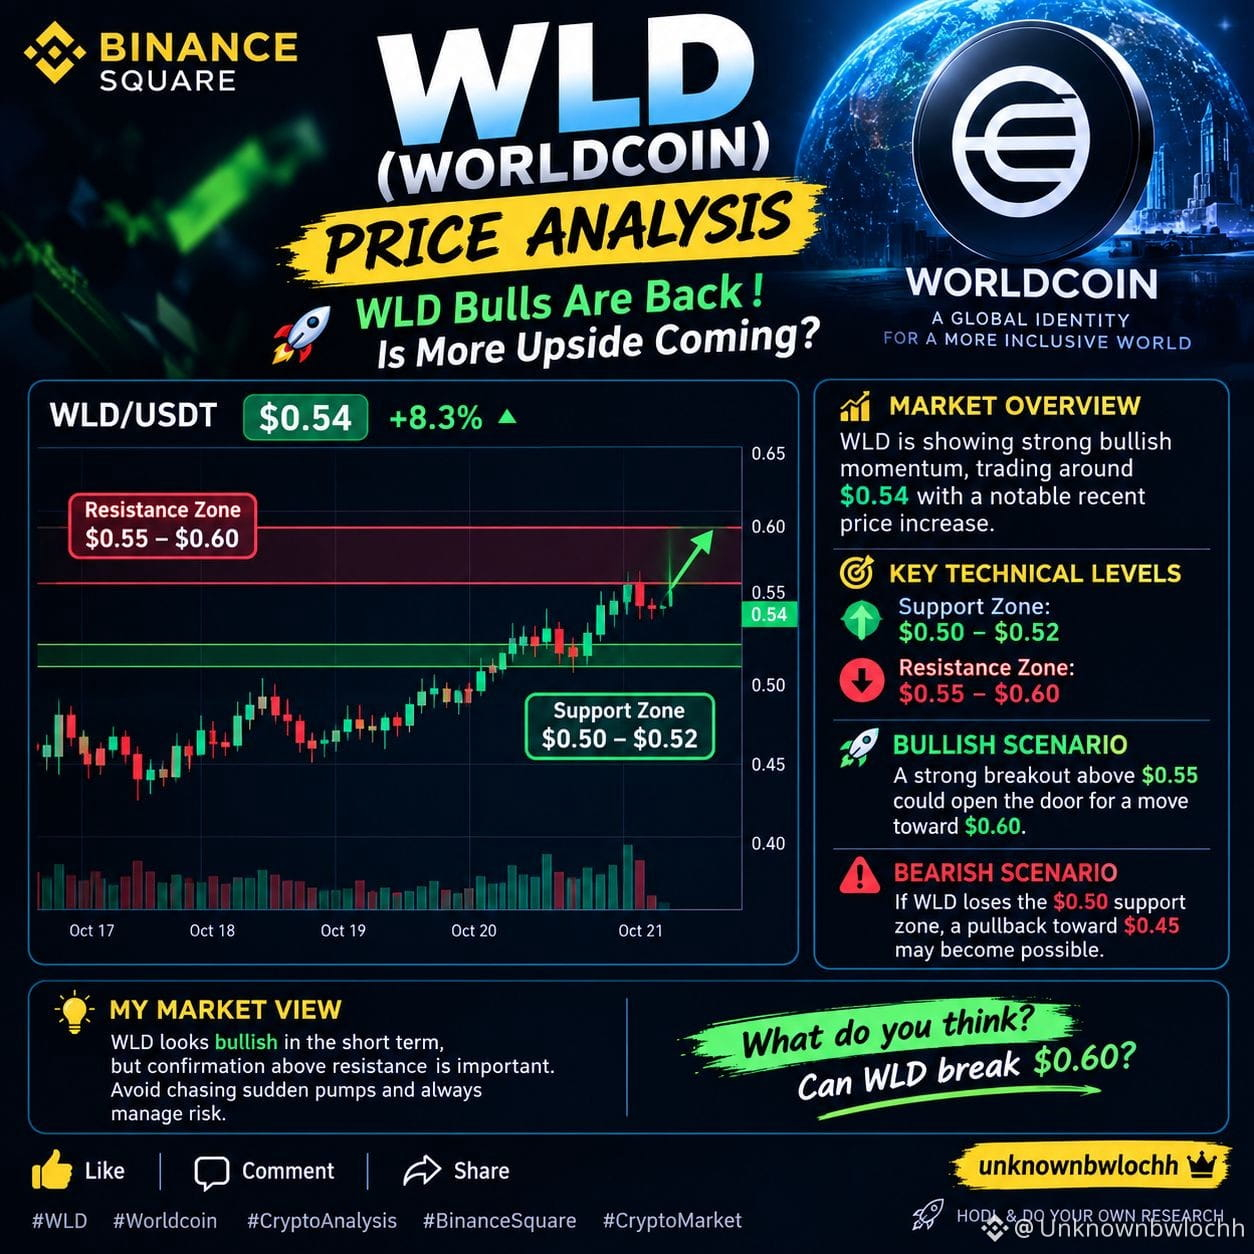
🚀 $WLD (#WORLDCOIN ) PRICE ANALYSIS 📊
🔥 $WLD Bulls Are Back! Is More Upside Coming?
📈 Market Overview: #WLD is showing strong bullish momentum, trading around $0.54 with a notable recent price increase.
🔍 Key Technical Levels: 🟢 Support Zone: $0.50 – $0.52
🔴 Resistance Zone: $0.55 – $0.60
📊 Bullish Scenario:
A strong breakout above $0.55 could open the door for a move toward $0.60.
⚠️ Bearish Scenario:
If WLD loses the $0.50 support zone, a pullback toward $0.45 may become possible.
💡 My Market View:
WLD looks bullish in the short term, but confirmation above resistance is important. Avoid chasing sudden pumps and always manage risk.
🔥 What do you think? Can WLD break $0.60?
👍 Like | 💬 Comment | 🔁 Share
#WLD #Worldcoin #CryptoAnalysis
— unknownbwlochh
{future}(WLDUSDT)
🚀 $WLD (#WORLDCOIN ) PRICE ANALYSIS 📊
🔥 $WLD Bulls Are Back! Is More Upside Coming?
📈 Market Overview: #WLD is showing strong bullish momentum, trading around $0.54 with a notable recent price increase.
🔍 Key Technical Levels: 🟢 Support Zone: $0.50 – $0.52
🔴 Resistance Zone: $0.55 – $0.60
📊 Bullish Scenario:
A strong breakout above $0.55 could open the door for a move toward $0.60.
⚠️ Bearish Scenario:
If WLD loses the $0.50 support zone, a pullback toward $0.45 may become possible.
💡 My Market View:
WLD looks bullish in the short term, but confirmation above resistance is important. Avoid chasing sudden pumps and always manage risk.
🔥 What do you think? Can WLD break $0.60?
👍 Like | 💬 Comment | 🔁 Share
#WLD #Worldcoin #CryptoAnalysis
— unknownbwlochh
🔥 $WLD Bulls Are Back! Is More Upside Coming?
📈 Market Overview: #WLD is showing strong bullish momentum, trading around $0.54 with a notable recent price increase.
🔍 Key Technical Levels: 🟢 Support Zone: $0.50 – $0.52
🔴 Resistance Zone: $0.55 – $0.60
📊 Bullish Scenario:
A strong breakout above $0.55 could open the door for a move toward $0.60.
⚠️ Bearish Scenario:
If WLD loses the $0.50 support zone, a pullback toward $0.45 may become possible.
💡 My Market View:
WLD looks bullish in the short term, but confirmation above resistance is important. Avoid chasing sudden pumps and always manage risk.
🔥 What do you think? Can WLD break $0.60?
👍 Like | 💬 Comment | 🔁 Share
#WLD #Worldcoin #CryptoAnalysis
— unknownbwlochh
187
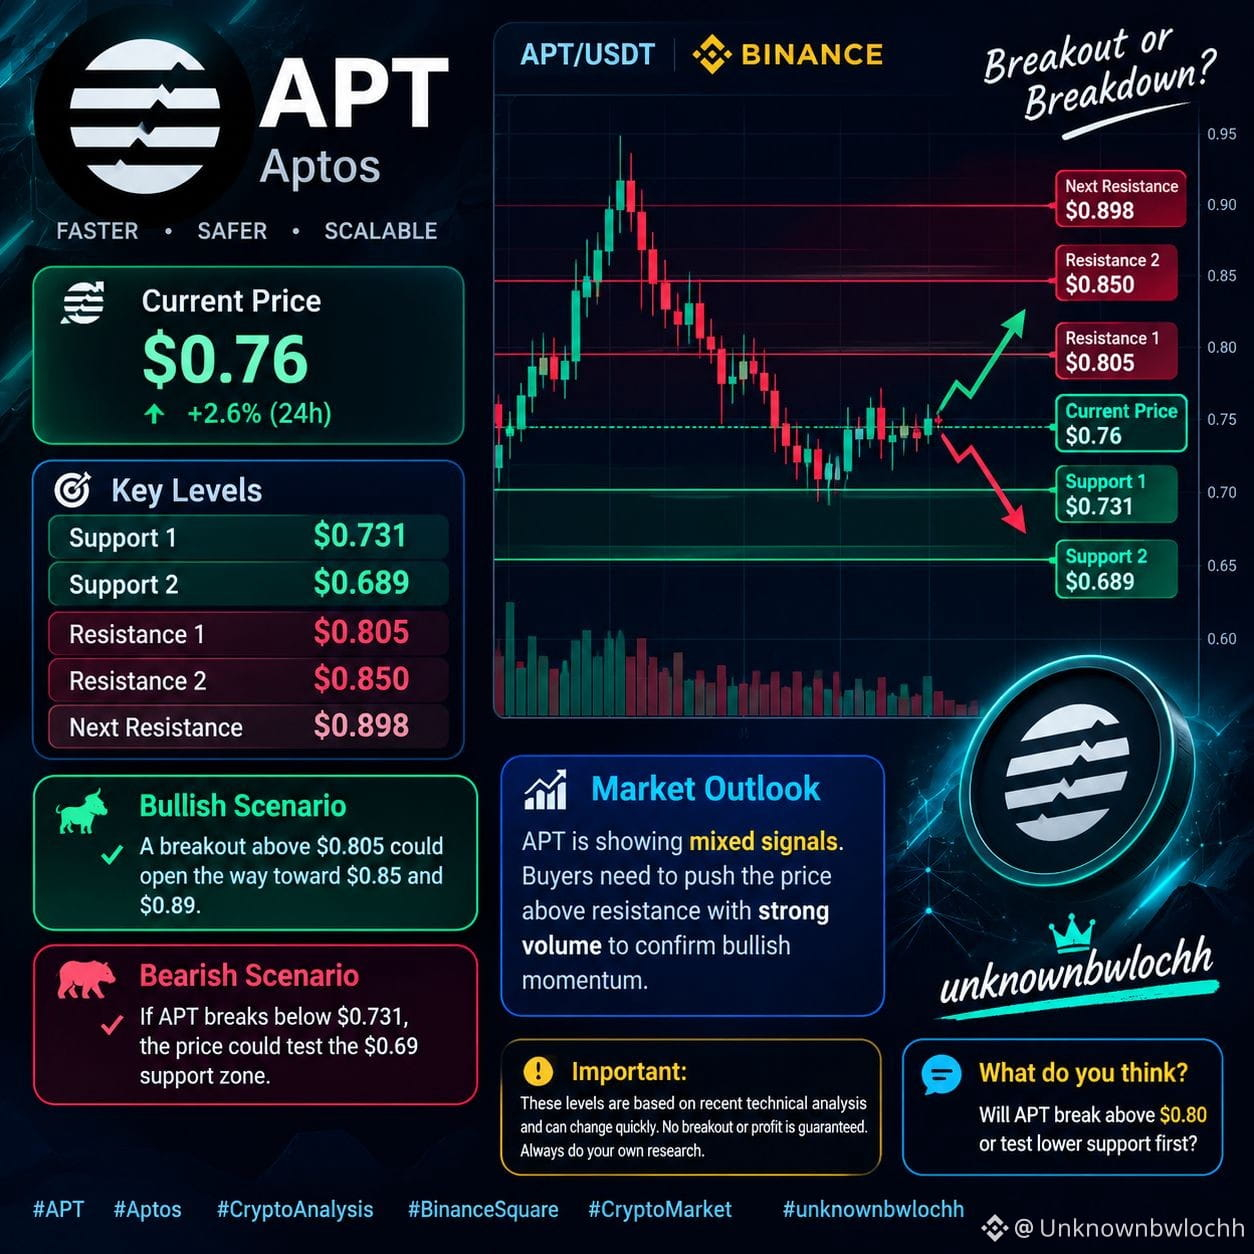
🚀 #APTOS ($APT ) COIN ANALYSIS | MARKET OUTLOOK
📊 Current Price: Around $0.76
🟢 Bullish Scenario: A breakout above $0.805 could open the way toward $0.85 and $0.89.
🔴 Bearish Scenario: If APT breaks below $0.731, the price could test the $0.69 support zone.
🎯 Key Levels
- Support: $0.731 – $0.689
- Resistance: $0.805 – $0.850
- Next Resistance: $0.898
📈 Market Outlook: APT is showing mixed signals. Buyers need to push the price above resistance with strong volume to confirm bullish momentum.
⚠️ Important: These levels are based on recent technical analysis and can change quickly. No breakout or profit is guaranteed. Always do your own research.
💬 **What do you think? Will $APT break above $0.80 or test lower support first?
#APT #Aptos #CryptoAnalysis #BinanceSquare
{future}(APTUSDT)
🚀 #APTOS ($APT ) COIN ANALYSIS | MARKET OUTLOOK
📊 Current Price: Around $0.76
🟢 Bullish Scenario: A breakout above $0.805 could open the way toward $0.85 and $0.89.
🔴 Bearish Scenario: If APT breaks below $0.731, the price could test the $0.69 support zone.
🎯 Key Levels
- Support: $0.731 – $0.689
- Resistance: $0.805 – $0.850
- Next Resistance: $0.898
📈 Market Outlook: APT is showing mixed signals. Buyers need to push the price above resistance with strong volume to confirm bullish momentum.
⚠️ Important: These levels are based on recent technical analysis and can change quickly. No breakout or profit is guaranteed. Always do your own research.
💬 **What do you think? Will $APT break above $0.80 or test lower support first?
#APT #Aptos #CryptoAnalysis #BinanceSquare
📊 Current Price: Around $0.76
🟢 Bullish Scenario: A breakout above $0.805 could open the way toward $0.85 and $0.89.
🔴 Bearish Scenario: If APT breaks below $0.731, the price could test the $0.69 support zone.
🎯 Key Levels
- Support: $0.731 – $0.689
- Resistance: $0.805 – $0.850
- Next Resistance: $0.898
📈 Market Outlook: APT is showing mixed signals. Buyers need to push the price above resistance with strong volume to confirm bullish momentum.
⚠️ Important: These levels are based on recent technical analysis and can change quickly. No breakout or profit is guaranteed. Always do your own research.
💬 **What do you think? Will $APT break above $0.80 or test lower support first?
#APT #Aptos #CryptoAnalysis #BinanceSquare
384
·
--
Bullish
🚀🔥 $SOXL — PRICE IS GOING HIGH! 📈
📊 #SOXL Market Analysis
🔥 #SOXL is catching attention with its strong upward movement! Bulls are showing strength, and traders are watching closely for the next move.
🟢 Trend: Strong bullish momentum if the uptrend continues
📈 Outlook: Potential for further upside
🎯 Strategy: Watch for a confirmed breakout or a pullback before considering an entry.
🚀 BUY OPPORTUNITY? SOXL could offer an opportunity if bullish momentum continues, but always confirm the trend before buying.
⚠️ Avoid FOMO buying. SOXL is a leveraged ETF, not a regular cryptocurrency, and can carry significant risk. Use proper risk management.
🔥 Keep $SOXL on your Watchlist!
#SOXL #Trading #BullishMomentum
{future}(SOXLUSDT)
🚀🔥 $SOXL — PRICE IS GOING HIGH! 📈
📊 #SOXL Market Analysis
🔥 #SOXL is catching attention with its strong upward movement! Bulls are showing strength, and traders are watching closely for the next move.
🟢 Trend: Strong bullish momentum if the uptrend continues
📈 Outlook: Potential for further upside
🎯 Strategy: Watch for a confirmed breakout or a pullback before considering an entry.
🚀 BUY OPPORTUNITY? SOXL could offer an opportunity if bullish momentum continues, but always confirm the trend before buying.
⚠️ Avoid FOMO buying. SOXL is a leveraged ETF, not a regular cryptocurrency, and can carry significant risk. Use proper risk management.
🔥 Keep $SOXL on your Watchlist!
#SOXL #Trading #BullishMomentum
📊 #SOXL Market Analysis
🔥 #SOXL is catching attention with its strong upward movement! Bulls are showing strength, and traders are watching closely for the next move.
🟢 Trend: Strong bullish momentum if the uptrend continues
📈 Outlook: Potential for further upside
🎯 Strategy: Watch for a confirmed breakout or a pullback before considering an entry.
🚀 BUY OPPORTUNITY? SOXL could offer an opportunity if bullish momentum continues, but always confirm the trend before buying.
⚠️ Avoid FOMO buying. SOXL is a leveraged ETF, not a regular cryptocurrency, and can carry significant risk. Use proper risk management.
🔥 Keep $SOXL on your Watchlist!
#SOXL #Trading #BullishMomentum

850
🚀 #SOLANA ($SOL ) – Market Analysis 📊
Solana remains one of the most popular blockchain projects thanks to its high speed, low transaction fees, and growing ecosystem. 🔥
📈 Bullish Scenario: If SOL breaks above resistance with strong volume, further upside could follow.
📉 Bearish Scenario: If buying pressure weakens, $SOL may retest support levels.
👀 What to Watch: • #SOL/USDT trading volume
• BTC market direction
• Key support and resistance levels
💡 My View: SOL is worth watching, but confirmation is important before entering a trade.
⚠️ Always DYOR and manage your risk. No guaranteed profits.
#Solana #SOL #CryptoAnalysis
{future}(SOLUSDT)
🚀 #SOLANA ($SOL ) – Market Analysis 📊
Solana remains one of the most popular blockchain projects thanks to its high speed, low transaction fees, and growing ecosystem. 🔥
📈 Bullish Scenario: If SOL breaks above resistance with strong volume, further upside could follow.
📉 Bearish Scenario: If buying pressure weakens, $SOL may retest support levels.
👀 What to Watch: • #SOL/USDT trading volume
• BTC market direction
• Key support and resistance levels
💡 My View: SOL is worth watching, but confirmation is important before entering a trade.
⚠️ Always DYOR and manage your risk. No guaranteed profits.
#Solana #SOL #CryptoAnalysis
Solana remains one of the most popular blockchain projects thanks to its high speed, low transaction fees, and growing ecosystem. 🔥
📈 Bullish Scenario: If SOL breaks above resistance with strong volume, further upside could follow.
📉 Bearish Scenario: If buying pressure weakens, $SOL may retest support levels.
👀 What to Watch: • #SOL/USDT trading volume
• BTC market direction
• Key support and resistance levels
💡 My View: SOL is worth watching, but confirmation is important before entering a trade.
⚠️ Always DYOR and manage your risk. No guaranteed profits.
#Solana #SOL #CryptoAnalysis

89
·
--
Bullish
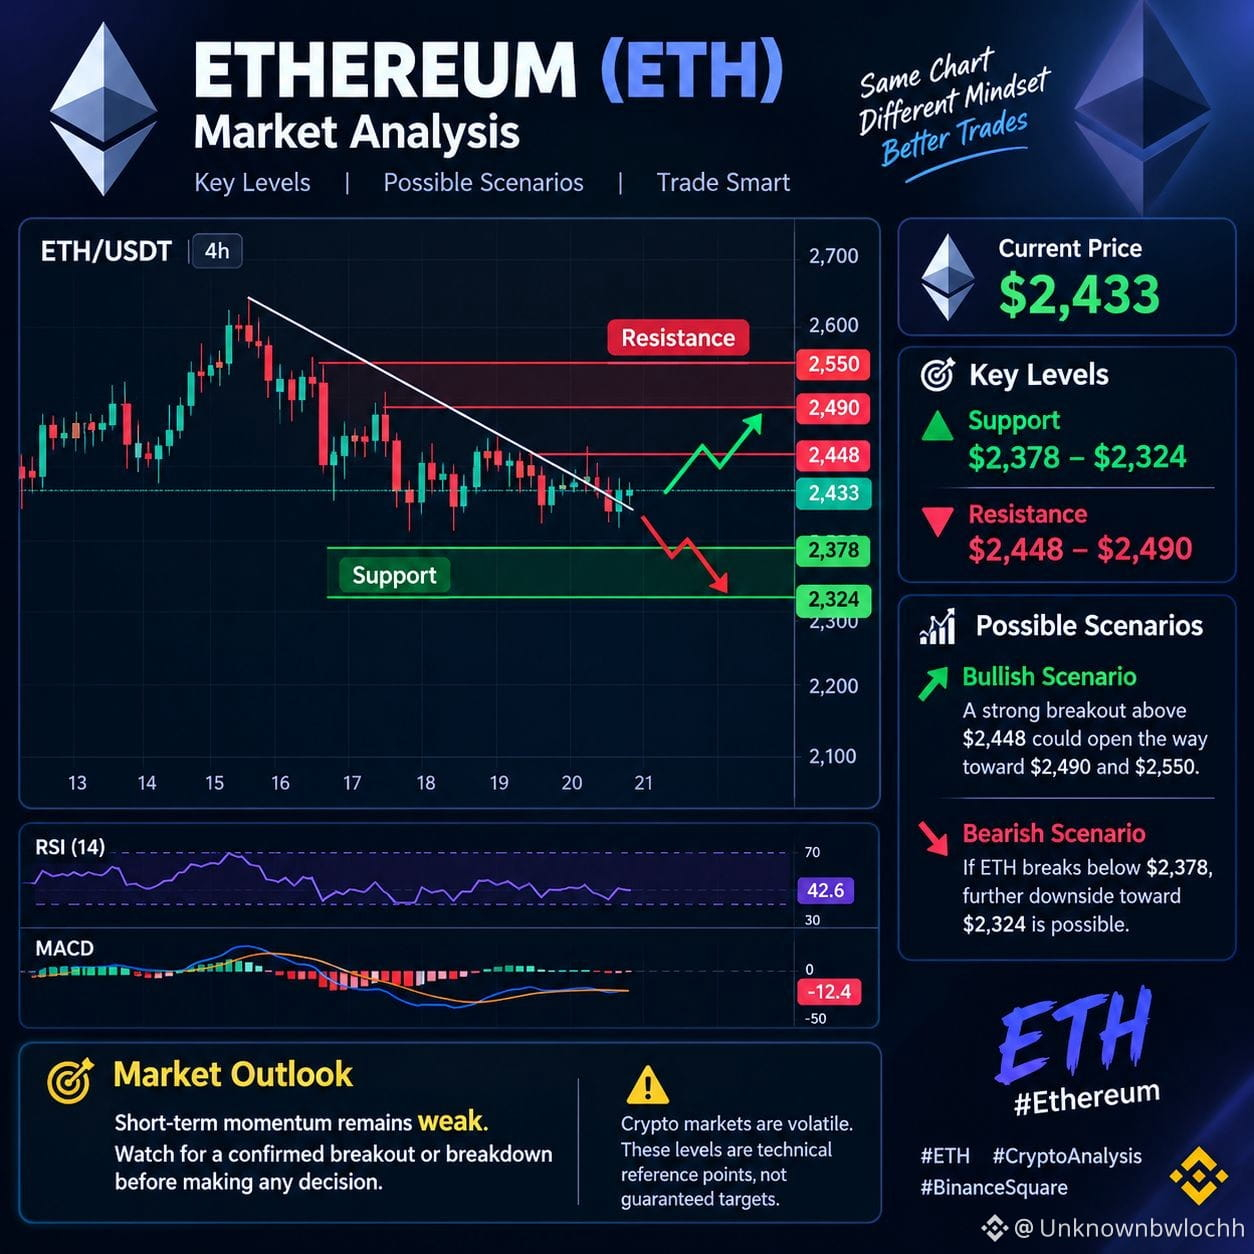
📊 #ETHEREUM ($ETH ) MARKET ANALYSIS
🔹 Current Price: Around $2,433
🟢 Support: $2,378 – $2,324
🔴 Resistance: $2,448 – $2,490
📈 Bullish Scenario: A strong breakout above $2,448 could open the way toward $2,490 and $2,550.
📉 Bearish Scenario: If ETH breaks below $2,378, further downside toward $2,324 is possible.
🎯 Market Outlook: Short-term momentum remains weak. Watch for a confirmed breakout or breakdown before making any decision.
⚠️ Crypto markets are volatile. These levels are technical reference points, not guaranteed targets.
#ETH #Ethereum #CryptoAnalysis #BinanceSquare
{future}(ETHUSDT)
📊 #ETHEREUM ($ETH ) MARKET ANALYSIS
🔹 Current Price: Around $2,433
🟢 Support: $2,378 – $2,324
🔴 Resistance: $2,448 – $2,490
📈 Bullish Scenario: A strong breakout above $2,448 could open the way toward $2,490 and $2,550.
📉 Bearish Scenario: If ETH breaks below $2,378, further downside toward $2,324 is possible.
🎯 Market Outlook: Short-term momentum remains weak. Watch for a confirmed breakout or breakdown before making any decision.
⚠️ Crypto markets are volatile. These levels are technical reference points, not guaranteed targets.
#ETH #Ethereum #CryptoAnalysis #BinanceSquare
🔹 Current Price: Around $2,433
🟢 Support: $2,378 – $2,324
🔴 Resistance: $2,448 – $2,490
📈 Bullish Scenario: A strong breakout above $2,448 could open the way toward $2,490 and $2,550.
📉 Bearish Scenario: If ETH breaks below $2,378, further downside toward $2,324 is possible.
🎯 Market Outlook: Short-term momentum remains weak. Watch for a confirmed breakout or breakdown before making any decision.
⚠️ Crypto markets are volatile. These levels are technical reference points, not guaranteed targets.
#ETH #Ethereum #CryptoAnalysis #BinanceSquare
73
$ZEC (Zcash) - Market Analysis & Quick Update 🚀
Zcash ($ZEC ) works with privacy-focused technology (Zero-Knowledge Proofs), making it a unique privacy asset in the Web3 ecosystem.
Let's take a look at the key market levels and overall structure:
Current Trend: Amid market volatility, ZEC is holding its baseline at key support levels. Buyers appear active, entering on dips.
Key Support Zone: The price is testing the $1,000–$1,145 support region. If this zone holds, a strong bounce-back is expected.
Resistance & Targets: During a recovery, immediate resistance may be seen in the $1,288–$1,400 range. A break above this level would confirm bullish momentum.
💡 Trading Guidelines:
Due to high volatility, always use a tight Stop-Loss.
Rather than entering directly out of FOMO, wait for volume confirmation at key levels.
Disclaimer: Not financial advice. Always do your own research (DYOR).
#ZEC #CelestiaRises16%To2026High #BinanceSquareTalks
{future}(ZECUSDT)
$ZEC (Zcash) - Market Analysis & Quick Update 🚀
Zcash ($ZEC ) works with privacy-focused technology (Zero-Knowledge Proofs), making it a unique privacy asset in the Web3 ecosystem.
Let's take a look at the key market levels and overall structure:
Current Trend: Amid market volatility, ZEC is holding its baseline at key support levels. Buyers appear active, entering on dips.
Key Support Zone: The price is testing the $1,000–$1,145 support region. If this zone holds, a strong bounce-back is expected.
Resistance & Targets: During a recovery, immediate resistance may be seen in the $1,288–$1,400 range. A break above this level would confirm bullish momentum.
💡 Trading Guidelines:
Due to high volatility, always use a tight Stop-Loss.
Rather than entering directly out of FOMO, wait for volume confirmation at key levels.
Disclaimer: Not financial advice. Always do your own research (DYOR).
#ZEC #CelestiaRises16%To2026High #BinanceSquareTalks
Zcash ($ZEC ) works with privacy-focused technology (Zero-Knowledge Proofs), making it a unique privacy asset in the Web3 ecosystem.
Let's take a look at the key market levels and overall structure:
Current Trend: Amid market volatility, ZEC is holding its baseline at key support levels. Buyers appear active, entering on dips.
Key Support Zone: The price is testing the $1,000–$1,145 support region. If this zone holds, a strong bounce-back is expected.
Resistance & Targets: During a recovery, immediate resistance may be seen in the $1,288–$1,400 range. A break above this level would confirm bullish momentum.
💡 Trading Guidelines:
Due to high volatility, always use a tight Stop-Loss.
Rather than entering directly out of FOMO, wait for volume confirmation at key levels.
Disclaimer: Not financial advice. Always do your own research (DYOR).
#ZEC #CelestiaRises16%To2026High #BinanceSquareTalks

80
·
--
Bullish
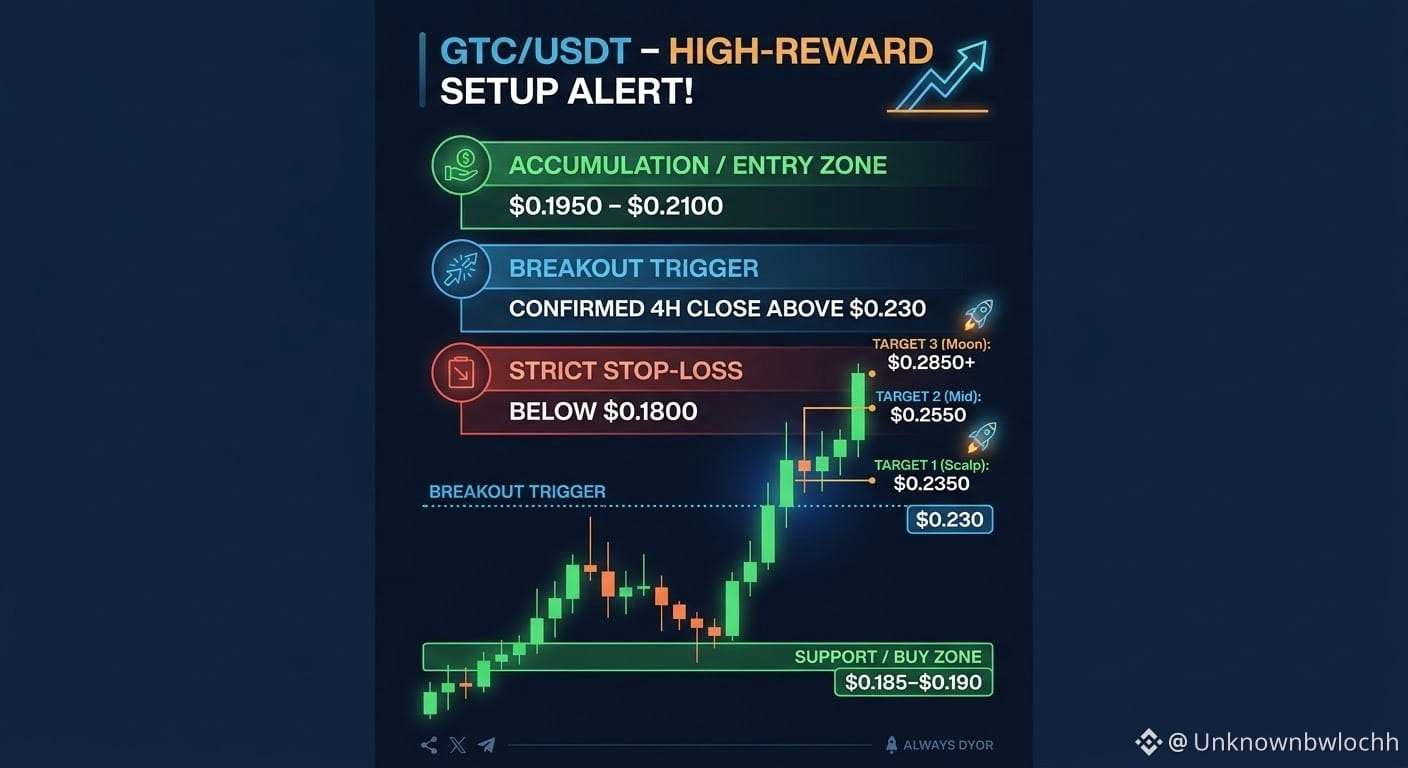
🔥 $GTC / USDT — High-Reward Setup Alert! 🚀
$GTC is coiling up for a explosive breakout after testing key support! Volume is shifting fast.
📊 Key Trade Setup
Accumulation / Entry Zone: $0.1950 – $0.2100 (Best Buy Area)
Target 1 (Quick Scalp): $0.2350
Target 2 (Mid Target): $0.2550
Target 3 (Moon Target): $0.2850+
Stop Loss (Strict): Below $0.1800 (Protect Capital)
💡 Why Trade $GTC Right Now?
Strong Floor: $0.185–$0.190 has proven to be heavy demand support.
Breakout Trigger: A clean 4H candle close above $0.230 will invite heavy momentum volume.
High Volatility Engine: Lower market-cap tokens offer sharp, quick 20%-40% upside moves on volume spikes!
🎯 Trade Plan: Scale in around support. Take partial profits at Target 1 and let the rest run with trailing SL.
⚠️ Risk Management: Always use proper position sizing and stick to your Stop-Loss! DYOR.
#GTC #NasdaqDowWeeklyGapWidestSinceJuly2002
{future}(GTCUSDT)
🔥 $GTC / USDT — High-Reward Setup Alert! 🚀
$GTC is coiling up for a explosive breakout after testing key support! Volume is shifting fast.
📊 Key Trade Setup
Accumulation / Entry Zone: $0.1950 – $0.2100 (Best Buy Area)
Target 1 (Quick Scalp): $0.2350
Target 2 (Mid Target): $0.2550
Target 3 (Moon Target): $0.2850+
Stop Loss (Strict): Below $0.1800 (Protect Capital)
💡 Why Trade $GTC Right Now?
Strong Floor: $0.185–$0.190 has proven to be heavy demand support.
Breakout Trigger: A clean 4H candle close above $0.230 will invite heavy momentum volume.
High Volatility Engine: Lower market-cap tokens offer sharp, quick 20%-40% upside moves on volume spikes!
🎯 Trade Plan: Scale in around support. Take partial profits at Target 1 and let the rest run with trailing SL.
⚠️ Risk Management: Always use proper position sizing and stick to your Stop-Loss! DYOR.
#GTC #NasdaqDowWeeklyGapWidestSinceJuly2002
$GTC is coiling up for a explosive breakout after testing key support! Volume is shifting fast.
📊 Key Trade Setup
Accumulation / Entry Zone: $0.1950 – $0.2100 (Best Buy Area)
Target 1 (Quick Scalp): $0.2350
Target 2 (Mid Target): $0.2550
Target 3 (Moon Target): $0.2850+
Stop Loss (Strict): Below $0.1800 (Protect Capital)
💡 Why Trade $GTC Right Now?
Strong Floor: $0.185–$0.190 has proven to be heavy demand support.
Breakout Trigger: A clean 4H candle close above $0.230 will invite heavy momentum volume.
High Volatility Engine: Lower market-cap tokens offer sharp, quick 20%-40% upside moves on volume spikes!
🎯 Trade Plan: Scale in around support. Take partial profits at Target 1 and let the rest run with trailing SL.
⚠️ Risk Management: Always use proper position sizing and stick to your Stop-Loss! DYOR.
#GTC #NasdaqDowWeeklyGapWidestSinceJuly2002
167
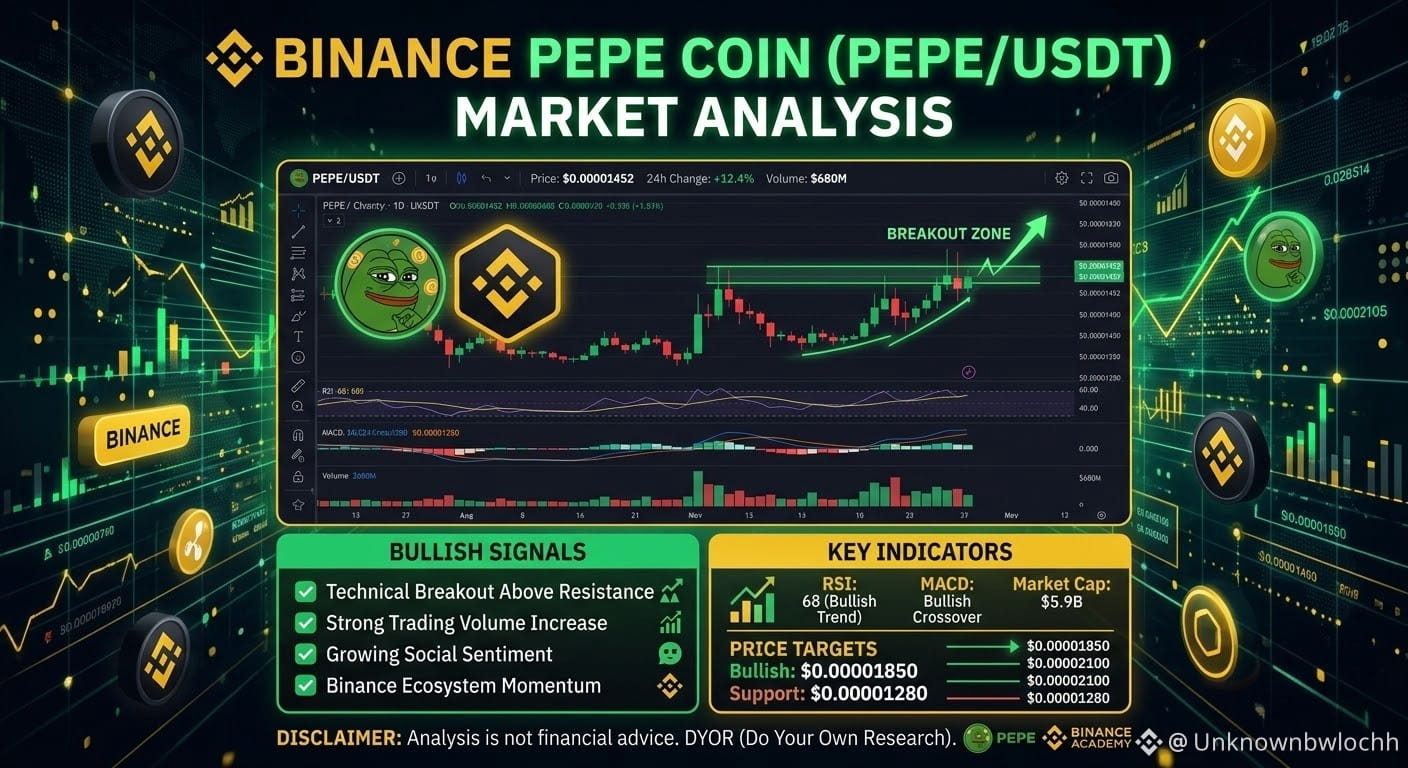
🐸 $PEPE Coin (#PEPE ) — Market Analysis
$PEPE remains a high-risk meme coin that can attract strong market attention during bullish sentiment. 🚀
📊 Technical Outlook
- 🟢 Bullish Signal: A breakout above resistance with strong volume could support further upside.
- 🔴 Bearish Signal: Losing key support may trigger more selling pressure.
- 📈 Trading Strategy: Watch support, resistance, and volume before entering a trade.
⚠️ Risk Management: Avoid FOMO and always use a stop-loss. Meme coins are highly volatile.
🔥 Will #PEPE pump or dump next?
#PEPE #CryptoAnalysis #Memecoin
{spot}(PEPEUSDT)
🐸 $PEPE Coin (#PEPE ) — Market Analysis
$PEPE remains a high-risk meme coin that can attract strong market attention during bullish sentiment. 🚀
📊 Technical Outlook
- 🟢 Bullish Signal: A breakout above resistance with strong volume could support further upside.
- 🔴 Bearish Signal: Losing key support may trigger more selling pressure.
- 📈 Trading Strategy: Watch support, resistance, and volume before entering a trade.
⚠️ Risk Management: Avoid FOMO and always use a stop-loss. Meme coins are highly volatile.
🔥 Will #PEPE pump or dump next?
#PEPE #CryptoAnalysis #Memecoin
$PEPE remains a high-risk meme coin that can attract strong market attention during bullish sentiment. 🚀
📊 Technical Outlook
- 🟢 Bullish Signal: A breakout above resistance with strong volume could support further upside.
- 🔴 Bearish Signal: Losing key support may trigger more selling pressure.
- 📈 Trading Strategy: Watch support, resistance, and volume before entering a trade.
⚠️ Risk Management: Avoid FOMO and always use a stop-loss. Meme coins are highly volatile.
🔥 Will #PEPE pump or dump next?
#PEPE #CryptoAnalysis #Memecoin
112
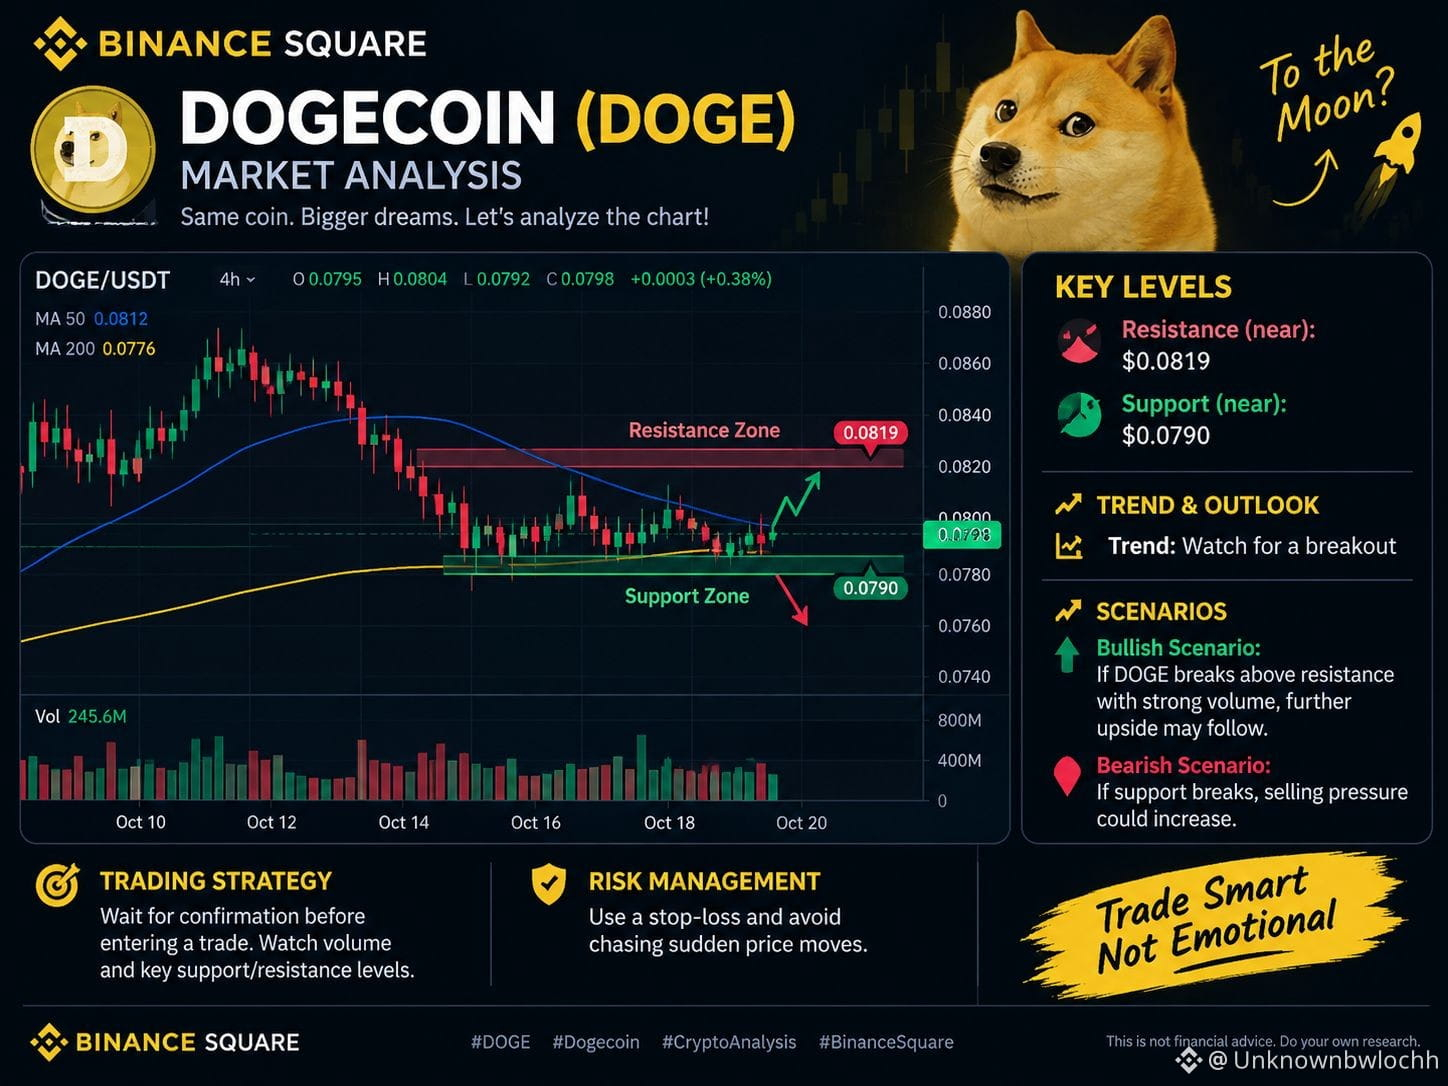
🐶 #DOGECOIN ($DOGE ) MARKET ANALYSIS
📊 Trend: Watch for a breakout
🟢 Bullish Scenario: If DOGE breaks above resistance with strong volume, further upside may follow.
🔴 Bearish Scenario: If support breaks, selling pressure could increase.
🎯 Trading Strategy: Wait for confirmation before entering a trade. Watch volume and key support/resistance levels.
$DOGE
#Dogecoin #CryptoAnalysis #BinanceSquare
{future}(DOGEUSDT)
🐶 #DOGECOIN ($DOGE ) MARKET ANALYSIS
📊 Trend: Watch for a breakout
🟢 Bullish Scenario: If DOGE breaks above resistance with strong volume, further upside may follow.
🔴 Bearish Scenario: If support breaks, selling pressure could increase.
🎯 Trading Strategy: Wait for confirmation before entering a trade. Watch volume and key support/resistance levels.
$DOGE
#Dogecoin #CryptoAnalysis #BinanceSquare
📊 Trend: Watch for a breakout
🟢 Bullish Scenario: If DOGE breaks above resistance with strong volume, further upside may follow.
🔴 Bearish Scenario: If support breaks, selling pressure could increase.
🎯 Trading Strategy: Wait for confirmation before entering a trade. Watch volume and key support/resistance levels.
$DOGE
#Dogecoin #CryptoAnalysis #BinanceSquare
2
446
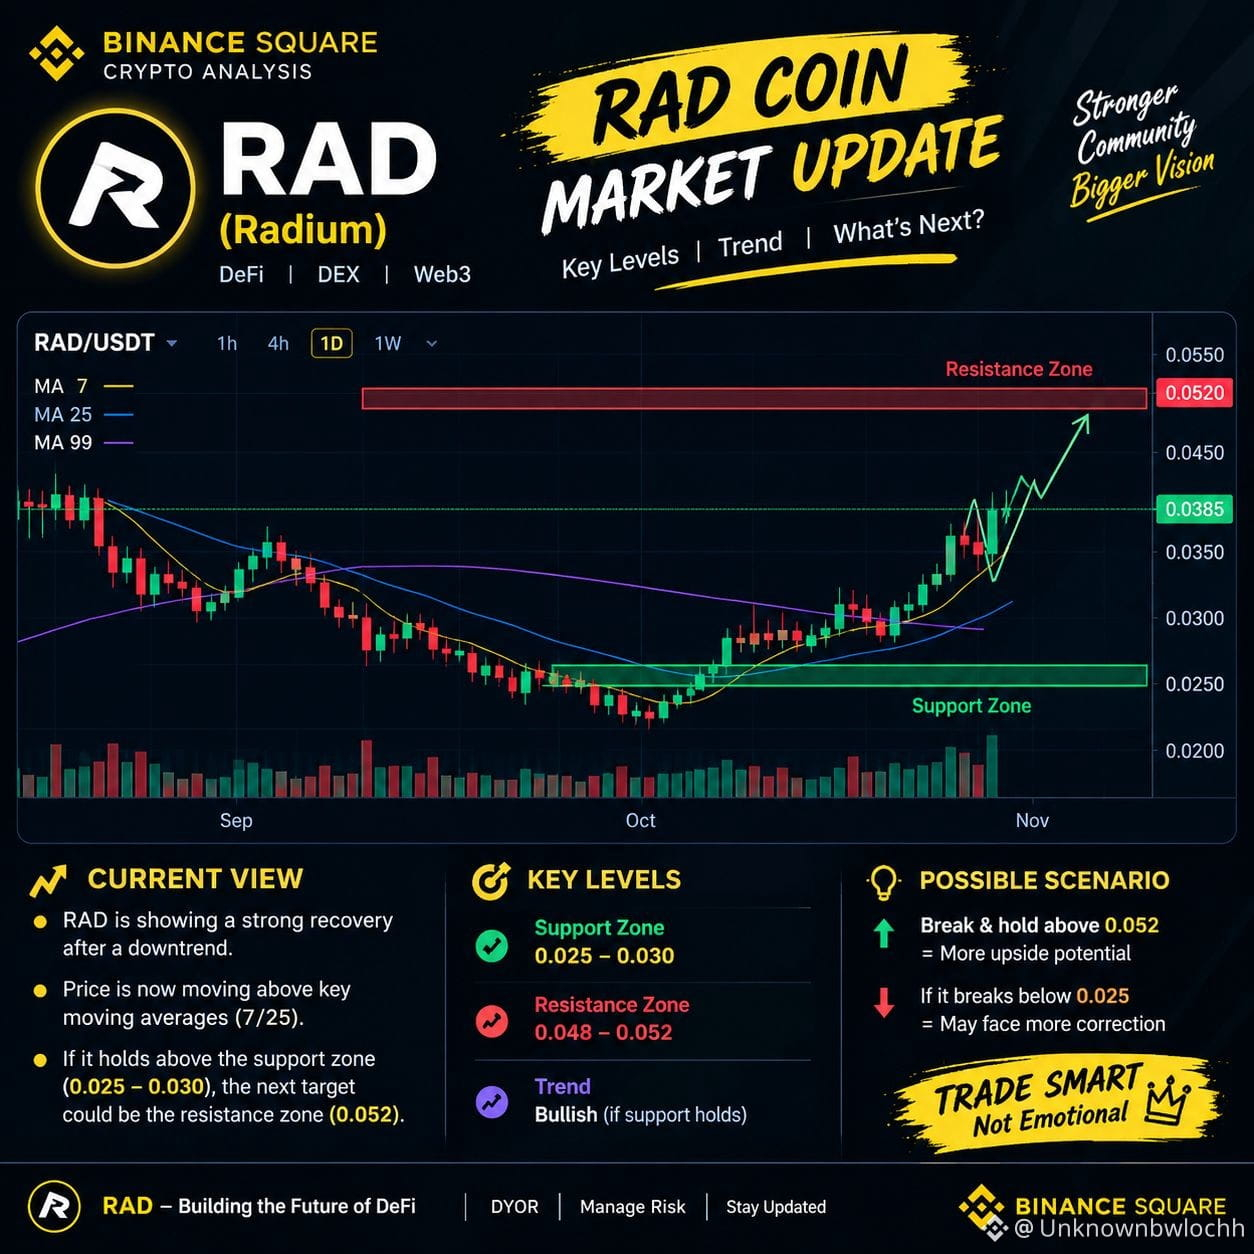
📊 $RAD Coin (#Radworks ) — Market Analysis
#RAD is worth watching for a potential breakout. 📈
🔹 Bullish Signal: A breakout above resistance with strong volume could indicate upward momentum.
🔹 Bearish Signal: A break below support may lead to further downside.
🔹 Strategy: Wait for confirmation before entering a trade. Watch volume and key support/resistance levels.
#RAD #CryptoAnalysis #BinanceSquare
{spot}(RADUSDT)
📊 $RAD Coin (#Radworks ) — Market Analysis
#RAD is worth watching for a potential breakout. 📈
🔹 Bullish Signal: A breakout above resistance with strong volume could indicate upward momentum.
🔹 Bearish Signal: A break below support may lead to further downside.
🔹 Strategy: Wait for confirmation before entering a trade. Watch volume and key support/resistance levels.
#RAD #CryptoAnalysis #BinanceSquare
#RAD is worth watching for a potential breakout. 📈
🔹 Bullish Signal: A breakout above resistance with strong volume could indicate upward momentum.
🔹 Bearish Signal: A break below support may lead to further downside.
🔹 Strategy: Wait for confirmation before entering a trade. Watch volume and key support/resistance levels.
#RAD #CryptoAnalysis #BinanceSquare
1
286
Log in to explore more content
Join global crypto users on Binance Square
⚡️ Get latest and useful information about crypto.
💬 Trusted by the world’s largest crypto exchange.
👍 Discover real insights from verified creators.
Email / Phone number
Trending Topics
USPPIMissMayEaseBTCPressure
51,007 views
806 Discussing
US PPI Rises 6.5% a Year in October, Slightly Below 6.6% Forecast
Binance News
·17 Likes
·18.4k views
BitcoinCoreDisclosesTorTrafficVulnerability
21,172 views
434 Discussing
WhatWillDriveCryptoandStocks’NextRebound?
165,299 views
1,644 Discussing