

刻舟求剑-永恒牛市BNB
8k Posts

刻舟求剑-永恒牛市BNB
Report
Block User
加油吧少年。欢迎互动

AIXBT Holder
High-Frequency Trader
5.3 Years
43.7K+ Following
10.2K+ Followers
14.2K+ Liked
Posts
All
Quotes
Videos
·
--
Bullish
In the $4.4 billion, 60% goes to that segment directly opposite the underlying—kept behind the door.
In September, tokenized stocks on this chain recorded monthly turnover of $4.4 billion, setting a new record. The largest venue saw about $2.8 billion that month, while in August this figure was only around $0.5 billion. The outstanding amount of tokenized stocks across the entire chain is about $684 million. Dividing $4.4 billion by that gives a turnover ratio of 6.4:1. This ratio reflects the same batch of certificates being traded back and forth repeatedly, not fresh capital flowing in again.
The certificates issued come in two types. One is tracking certificates: held by the custodian in a 1:1 mapping of underlying securities, and holders receive economic exposure. The other routes issuance and redemption through traditional financial intermediaries that actually hold the securities—this has expanded to hundreds of individual stocks and funds. Both types can be traded all day on-chain.
I checked the 60% landing point. As of August, in this batch of assets, about 63% of cumulative turnover occurred outside the regular U.S. stock trading hours. A single certificate can be traded all day, while the underlying cash stock’s continuous pricing only exists during those few hours when the market is open—there is no authoritative price for transactions in that window.
On Binance spot, there are a few such names: Ondo—up 1.6% over 24 hours and down 2.6% over seven days; platform-side locked funds of about $1.26 billion and over 450 tokens; subscriptions/redemptions only open from 9:30 a.m. to 3:45 p.m. Eastern time. Centrifiuge—up 2.8% and down 0.9% over seven days; issued three tokenized funds that month, with the collateral sitting in U.S. Treasuries and credit. Plume—up 1.7% over 24 hours and up 4.8% over seven days; vault size about $219 million, lifted within one month to nearly twice. The platform token BNB—up 0.9% and 5.1%, in the trillion-dollar market-cap tier. All four can be traded all day, but the “redemption door” opens on different schedules.
Turnover and redemption-in-kind don’t fall into the same bucket—the $4.4 billion lands in the former. Going forward, I examine two other buckets: in October, if the price spread in the hour before the underlying reopens narrows and the share of trades during market-closed periods drops from 63% to below 50%, it would mean the pricing bucket truly gets connected and this reading would have to be overturned. If the share keeps rising and the spread doesn’t tighten, it stays the same. The 60% spread during closed hours is trapped between two timestamps; Binance’s investing side records closed-market and open-market readings separately, and the difference shows up on its own. This article is a record of viewpoints and does not constitute investment advice.$GTC
{future}(GTCUSDT)
$NIL
{future}(NILUSDT)
$AIXBT
{future}(AIXBTUSDT)
#solana代币化股票9月交易量破44亿美元
In the $4.4 billion, 60% goes to that segment directly opposite the underlying—kept behind the door.
In September, tokenized stocks on this chain recorded monthly turnover of $4.4 billion, setting a new record. The largest venue saw about $2.8 billion that month, while in August this figure was only around $0.5 billion. The outstanding amount of tokenized stocks across the entire chain is about $684 million. Dividing $4.4 billion by that gives a turnover ratio of 6.4:1. This ratio reflects the same batch of certificates being traded back and forth repeatedly, not fresh capital flowing in again.
The certificates issued come in two types. One is tracking certificates: held by the custodian in a 1:1 mapping of underlying securities, and holders receive economic exposure. The other routes issuance and redemption through traditional financial intermediaries that actually hold the securities—this has expanded to hundreds of individual stocks and funds. Both types can be traded all day on-chain.
I checked the 60% landing point. As of August, in this batch of assets, about 63% of cumulative turnover occurred outside the regular U.S. stock trading hours. A single certificate can be traded all day, while the underlying cash stock’s continuous pricing only exists during those few hours when the market is open—there is no authoritative price for transactions in that window.
On Binance spot, there are a few such names: Ondo—up 1.6% over 24 hours and down 2.6% over seven days; platform-side locked funds of about $1.26 billion and over 450 tokens; subscriptions/redemptions only open from 9:30 a.m. to 3:45 p.m. Eastern time. Centrifiuge—up 2.8% and down 0.9% over seven days; issued three tokenized funds that month, with the collateral sitting in U.S. Treasuries and credit. Plume—up 1.7% over 24 hours and up 4.8% over seven days; vault size about $219 million, lifted within one month to nearly twice. The platform token BNB—up 0.9% and 5.1%, in the trillion-dollar market-cap tier. All four can be traded all day, but the “redemption door” opens on different schedules.
Turnover and redemption-in-kind don’t fall into the same bucket—the $4.4 billion lands in the former. Going forward, I examine two other buckets: in October, if the price spread in the hour before the underlying reopens narrows and the share of trades during market-closed periods drops from 63% to below 50%, it would mean the pricing bucket truly gets connected and this reading would have to be overturned. If the share keeps rising and the spread doesn’t tighten, it stays the same. The 60% spread during closed hours is trapped between two timestamps; Binance’s investing side records closed-market and open-market readings separately, and the difference shows up on its own. This article is a record of viewpoints and does not constitute investment advice.$GTC
$NIL
$AIXBT
#solana代币化股票9月交易量破44亿美元
In September, tokenized stocks on this chain recorded monthly turnover of $4.4 billion, setting a new record. The largest venue saw about $2.8 billion that month, while in August this figure was only around $0.5 billion. The outstanding amount of tokenized stocks across the entire chain is about $684 million. Dividing $4.4 billion by that gives a turnover ratio of 6.4:1. This ratio reflects the same batch of certificates being traded back and forth repeatedly, not fresh capital flowing in again.
The certificates issued come in two types. One is tracking certificates: held by the custodian in a 1:1 mapping of underlying securities, and holders receive economic exposure. The other routes issuance and redemption through traditional financial intermediaries that actually hold the securities—this has expanded to hundreds of individual stocks and funds. Both types can be traded all day on-chain.
I checked the 60% landing point. As of August, in this batch of assets, about 63% of cumulative turnover occurred outside the regular U.S. stock trading hours. A single certificate can be traded all day, while the underlying cash stock’s continuous pricing only exists during those few hours when the market is open—there is no authoritative price for transactions in that window.
On Binance spot, there are a few such names: Ondo—up 1.6% over 24 hours and down 2.6% over seven days; platform-side locked funds of about $1.26 billion and over 450 tokens; subscriptions/redemptions only open from 9:30 a.m. to 3:45 p.m. Eastern time. Centrifiuge—up 2.8% and down 0.9% over seven days; issued three tokenized funds that month, with the collateral sitting in U.S. Treasuries and credit. Plume—up 1.7% over 24 hours and up 4.8% over seven days; vault size about $219 million, lifted within one month to nearly twice. The platform token BNB—up 0.9% and 5.1%, in the trillion-dollar market-cap tier. All four can be traded all day, but the “redemption door” opens on different schedules.
Turnover and redemption-in-kind don’t fall into the same bucket—the $4.4 billion lands in the former. Going forward, I examine two other buckets: in October, if the price spread in the hour before the underlying reopens narrows and the share of trades during market-closed periods drops from 63% to below 50%, it would mean the pricing bucket truly gets connected and this reading would have to be overturned. If the share keeps rising and the spread doesn’t tighten, it stays the same. The 60% spread during closed hours is trapped between two timestamps; Binance’s investing side records closed-market and open-market readings separately, and the difference shows up on its own. This article is a record of viewpoints and does not constitute investment advice.$GTC
$NIL
$AIXBT
#solana代币化股票9月交易量破44亿美元

2
976
·
--
Bullish
790 went up; the interval and the two places for the redemption amount didn’t move
Since September 19, the daily closing has been oscillating between 758.7 and 799.5. The candle on October 4 closed at 795.5, so 790 was passed through; the upper boundary still sits at the 799.5 level from September 21. The loudest point is that specific level: neither end of the interval moved.
In this round, what did the four names report: BNB up 1.09% (7D 2.12%), with its size in the hundreds of billions USD tier; Ethereum up 1.53% (7D 1.48%), about $31.45 billion; Bitcoin up 1.89% (7D 2.23%), about $164 billion; Solana up 1.93% (7D down 0.07%), about $6.76 billion. On the supply-side definition, they differ by an order of magnitude: BNB has two redemption channels; Ethereum burns all the base fee and the net issuance is still positive; Bitcoin doesn’t have the redemption line; Solana’s vote in late August passed the halving of issuance, while the same batch’s per-transaction burn did not pass. The same phrase about “redemption” refers to different entries for each of the four names.
The order of magnitude also differs greatly between the two channels. For the quarterly cycle, how much it collects is calculated from price and the number of blocks this quarter. The last one landed on July 15: it collected 1.616 million coins, about $932 million; after redemption, the total amount became 133 million coins, with a target of 100 million. The other channel is a fixed proportion of fees burned per block; the ratio is set by validator voting. By July it was only 290,000 coins. Following a 90-day cadence, this round’s dates and amount haven’t been published.
I’m counting the parts that are actually being used, not what’s shown in quotes. The total market cap of on-chain tokenized stocks and related trading products has crossed $1 billion; an October tokenized-stock hackathon is underway; on October 1, an asset management firm wrote the staking yield of these tokens into its product documentation; on October 3, a wallet added native support. When the price moved at point 790, the readings of these places each shifted forward.
What moved at 790 is the quote; the upper end of the interval and the redemption volume for this round stayed in place. Going forward, I’ll only check two things: if the date and the amount for this round’s redemption are both finalized and published, and the daily closes keep standing above 799.5 afterward, then it means they changed the interval and the supply-side, and my view here would need to be overturned. For now, both places are unchanged, so I’ll leave this one. To check those two places, we have to wait for them to settle in the public records. For these four names, if you search by name on Binance, you can find each one’s spot holdings and wealth-management products and place orders to buy yourself. This article is a record of viewpoints.$BNB
{future}(BNBUSDT)
$GTC
{future}(GTCUSDT)
$BEAMX
{future}(BEAMXUSDT)
#bnb突破790美元
790 went up; the interval and the two places for the redemption amount didn’t move
Since September 19, the daily closing has been oscillating between 758.7 and 799.5. The candle on October 4 closed at 795.5, so 790 was passed through; the upper boundary still sits at the 799.5 level from September 21. The loudest point is that specific level: neither end of the interval moved.
In this round, what did the four names report: BNB up 1.09% (7D 2.12%), with its size in the hundreds of billions USD tier; Ethereum up 1.53% (7D 1.48%), about $31.45 billion; Bitcoin up 1.89% (7D 2.23%), about $164 billion; Solana up 1.93% (7D down 0.07%), about $6.76 billion. On the supply-side definition, they differ by an order of magnitude: BNB has two redemption channels; Ethereum burns all the base fee and the net issuance is still positive; Bitcoin doesn’t have the redemption line; Solana’s vote in late August passed the halving of issuance, while the same batch’s per-transaction burn did not pass. The same phrase about “redemption” refers to different entries for each of the four names.
The order of magnitude also differs greatly between the two channels. For the quarterly cycle, how much it collects is calculated from price and the number of blocks this quarter. The last one landed on July 15: it collected 1.616 million coins, about $932 million; after redemption, the total amount became 133 million coins, with a target of 100 million. The other channel is a fixed proportion of fees burned per block; the ratio is set by validator voting. By July it was only 290,000 coins. Following a 90-day cadence, this round’s dates and amount haven’t been published.
I’m counting the parts that are actually being used, not what’s shown in quotes. The total market cap of on-chain tokenized stocks and related trading products has crossed $1 billion; an October tokenized-stock hackathon is underway; on October 1, an asset management firm wrote the staking yield of these tokens into its product documentation; on October 3, a wallet added native support. When the price moved at point 790, the readings of these places each shifted forward.
What moved at 790 is the quote; the upper end of the interval and the redemption volume for this round stayed in place. Going forward, I’ll only check two things: if the date and the amount for this round’s redemption are both finalized and published, and the daily closes keep standing above 799.5 afterward, then it means they changed the interval and the supply-side, and my view here would need to be overturned. For now, both places are unchanged, so I’ll leave this one. To check those two places, we have to wait for them to settle in the public records. For these four names, if you search by name on Binance, you can find each one’s spot holdings and wealth-management products and place orders to buy yourself. This article is a record of viewpoints.$BNB
$GTC
$BEAMX
#bnb突破790美元
Since September 19, the daily closing has been oscillating between 758.7 and 799.5. The candle on October 4 closed at 795.5, so 790 was passed through; the upper boundary still sits at the 799.5 level from September 21. The loudest point is that specific level: neither end of the interval moved.
In this round, what did the four names report: BNB up 1.09% (7D 2.12%), with its size in the hundreds of billions USD tier; Ethereum up 1.53% (7D 1.48%), about $31.45 billion; Bitcoin up 1.89% (7D 2.23%), about $164 billion; Solana up 1.93% (7D down 0.07%), about $6.76 billion. On the supply-side definition, they differ by an order of magnitude: BNB has two redemption channels; Ethereum burns all the base fee and the net issuance is still positive; Bitcoin doesn’t have the redemption line; Solana’s vote in late August passed the halving of issuance, while the same batch’s per-transaction burn did not pass. The same phrase about “redemption” refers to different entries for each of the four names.
The order of magnitude also differs greatly between the two channels. For the quarterly cycle, how much it collects is calculated from price and the number of blocks this quarter. The last one landed on July 15: it collected 1.616 million coins, about $932 million; after redemption, the total amount became 133 million coins, with a target of 100 million. The other channel is a fixed proportion of fees burned per block; the ratio is set by validator voting. By July it was only 290,000 coins. Following a 90-day cadence, this round’s dates and amount haven’t been published.
I’m counting the parts that are actually being used, not what’s shown in quotes. The total market cap of on-chain tokenized stocks and related trading products has crossed $1 billion; an October tokenized-stock hackathon is underway; on October 1, an asset management firm wrote the staking yield of these tokens into its product documentation; on October 3, a wallet added native support. When the price moved at point 790, the readings of these places each shifted forward.
What moved at 790 is the quote; the upper end of the interval and the redemption volume for this round stayed in place. Going forward, I’ll only check two things: if the date and the amount for this round’s redemption are both finalized and published, and the daily closes keep standing above 799.5 afterward, then it means they changed the interval and the supply-side, and my view here would need to be overturned. For now, both places are unchanged, so I’ll leave this one. To check those two places, we have to wait for them to settle in the public records. For these four names, if you search by name on Binance, you can find each one’s spot holdings and wealth-management products and place orders to buy yourself. This article is a record of viewpoints.$BNB
$GTC
$BEAMX
#bnb突破790美元

2
26
22.3k
·
--
Bullish
October 1st, the new fiscal year had no budget in place. This securities-regulatory authority thus entered a funding interruption, leaving only essential functions such as market supervision and investor protection. Starting October 3rd, reviews of crypto spot products were put on hold: registration statements would not become effective, no further opinion letters would be issued, and among the more than 90 pending applications accumulated since September 1st, some deadlines fell in early October.
There are two gates for review. The first is the generic listing standards that took effect on September 17, 2025—a wide gate. For commodity trust units that meet the criteria, there is no need to file each item separately; the timeline can be compressed from up to about 240 days down to about 75 days. The other gate is the item-by-item review, where the initial 45-day review can be extended up to 240 days. What was being stopped was the latter. In the same fiscal year, right after this authority cleared its first batch of products with three tiers added—Bitcoin and Ether—it followed the item-by-item route. During the suspension, announcements only move under an emergency interpretation: documents in the filing repository neither proceed nor are rejected. What gets extended is only the clock on that stage.
I’m watching the order of clearing the backlog after the restart. First, clear the generic-standards lane, to show that the suspension only paused the timing. Then, clear the lanes that require item-by-item judgment—such as the newly added three-tier products and staking—showing that during the gap period, the right to make those determinations was preserved. The two meanings are very far apart, and the only resolvable readout is this one.
On-exchange readouts did not stop along with the review. Bitcoin’s seven-day change is about -0.95%, and over 24 hours about -$61.65 million; Ethereum is -0.58%, about -$63.48 million; Dogecoin fell about -3.6%, about -$5.87 million; BNB (the platform token) is about -1.8%, about -$3.11 million. The reason these four tokens differ is whether the application cell was occupied: Bitcoin and Ethereum already have compliant products in place, and subscriptions and redemptions continue as usual; Dogecoin hadn’t even entered that queue; and BNB isn’t on that line. The seven-day gap remains the result of each token’s normal baseline.
The readout that this judgment would overturn is also very specific: after the restart announcement came out, the first batch to be cleared was the generic-standards lane. If they had moved the item-by-item lane first, then my whole reading would have been invalid on the spot. To see how the queue for similar cases lands on the numbers that can be verified, the daily-updated figures in Binance’s wealth-management interface display the same interpretation and are arranged accordingly. This article is a record of opinions and does not constitute investment advice. $BEAMX
{future}(BEAMXUSDT)
$STRK
{future}(STRKUSDT)
$GLMR
{spot}(GLMRUSDT)
#sec因拨款中断暂停加密etf审查
October 1st, the new fiscal year had no budget in place. This securities-regulatory authority thus entered a funding interruption, leaving only essential functions such as market supervision and investor protection. Starting October 3rd, reviews of crypto spot products were put on hold: registration statements would not become effective, no further opinion letters would be issued, and among the more than 90 pending applications accumulated since September 1st, some deadlines fell in early October.
There are two gates for review. The first is the generic listing standards that took effect on September 17, 2025—a wide gate. For commodity trust units that meet the criteria, there is no need to file each item separately; the timeline can be compressed from up to about 240 days down to about 75 days. The other gate is the item-by-item review, where the initial 45-day review can be extended up to 240 days. What was being stopped was the latter. In the same fiscal year, right after this authority cleared its first batch of products with three tiers added—Bitcoin and Ether—it followed the item-by-item route. During the suspension, announcements only move under an emergency interpretation: documents in the filing repository neither proceed nor are rejected. What gets extended is only the clock on that stage.
I’m watching the order of clearing the backlog after the restart. First, clear the generic-standards lane, to show that the suspension only paused the timing. Then, clear the lanes that require item-by-item judgment—such as the newly added three-tier products and staking—showing that during the gap period, the right to make those determinations was preserved. The two meanings are very far apart, and the only resolvable readout is this one.
On-exchange readouts did not stop along with the review. Bitcoin’s seven-day change is about -0.95%, and over 24 hours about -$61.65 million; Ethereum is -0.58%, about -$63.48 million; Dogecoin fell about -3.6%, about -$5.87 million; BNB (the platform token) is about -1.8%, about -$3.11 million. The reason these four tokens differ is whether the application cell was occupied: Bitcoin and Ethereum already have compliant products in place, and subscriptions and redemptions continue as usual; Dogecoin hadn’t even entered that queue; and BNB isn’t on that line. The seven-day gap remains the result of each token’s normal baseline.
The readout that this judgment would overturn is also very specific: after the restart announcement came out, the first batch to be cleared was the generic-standards lane. If they had moved the item-by-item lane first, then my whole reading would have been invalid on the spot. To see how the queue for similar cases lands on the numbers that can be verified, the daily-updated figures in Binance’s wealth-management interface display the same interpretation and are arranged accordingly. This article is a record of opinions and does not constitute investment advice. $BEAMX
$STRK
$GLMR
#sec因拨款中断暂停加密etf审查
There are two gates for review. The first is the generic listing standards that took effect on September 17, 2025—a wide gate. For commodity trust units that meet the criteria, there is no need to file each item separately; the timeline can be compressed from up to about 240 days down to about 75 days. The other gate is the item-by-item review, where the initial 45-day review can be extended up to 240 days. What was being stopped was the latter. In the same fiscal year, right after this authority cleared its first batch of products with three tiers added—Bitcoin and Ether—it followed the item-by-item route. During the suspension, announcements only move under an emergency interpretation: documents in the filing repository neither proceed nor are rejected. What gets extended is only the clock on that stage.
I’m watching the order of clearing the backlog after the restart. First, clear the generic-standards lane, to show that the suspension only paused the timing. Then, clear the lanes that require item-by-item judgment—such as the newly added three-tier products and staking—showing that during the gap period, the right to make those determinations was preserved. The two meanings are very far apart, and the only resolvable readout is this one.
On-exchange readouts did not stop along with the review. Bitcoin’s seven-day change is about -0.95%, and over 24 hours about -$61.65 million; Ethereum is -0.58%, about -$63.48 million; Dogecoin fell about -3.6%, about -$5.87 million; BNB (the platform token) is about -1.8%, about -$3.11 million. The reason these four tokens differ is whether the application cell was occupied: Bitcoin and Ethereum already have compliant products in place, and subscriptions and redemptions continue as usual; Dogecoin hadn’t even entered that queue; and BNB isn’t on that line. The seven-day gap remains the result of each token’s normal baseline.
The readout that this judgment would overturn is also very specific: after the restart announcement came out, the first batch to be cleared was the generic-standards lane. If they had moved the item-by-item lane first, then my whole reading would have been invalid on the spot. To see how the queue for similar cases lands on the numbers that can be verified, the daily-updated figures in Binance’s wealth-management interface display the same interpretation and are arranged accordingly. This article is a record of opinions and does not constitute investment advice. $BEAMX
$STRK
$GLMR
#sec因拨款中断暂停加密etf审查

7
9
8.8k
·
--
Bullish
Verified
This on-the-spot product has an unusual setup: on September 18, it announced a 1-for-3 stock split; it was registered on September 28; it began trading under the new shares on September 30. And September 30 happened to be the heaviest outflow day, with a net daily redemption of $30.25 million. This week it recorded its first weekly net outflow of $93.6 million. Just two weeks ago it had entered with $98.2 million—those two moves nearly went back along the same path.
First, let the numbers line up. The “flow” figure for this week is the net amount of inflow and outflow: $93.6 million. The “stock” figure is the total amount the product holds, about $750 million. The media is focused on the first item; the second item only fell from a peak of about $915 million—it didn’t disappear. The 2.5% management fee isn’t either flow or stock; it’s the annual payment that holders pay.
I’m checking cumulative net inflows. It started from zero on the day it listed on August 25, surged to about $271 million over two months, and has since retreated to around $213 million. The money that went in didn’t just sit in place; the accounting moved the gap between the two figures.
Look at the four names laid out. For this week, how much did the in-and-out move relative to its own stock? Zcash had a net outflow of $93.6 million and stock of about $750 million—flow accounted for about one-eighth. Bitcoin had a net inflow of $82.9 million and stock of about $107.9 billion—about eight-tenths of one percent (one-thousandth). Ethereum saw net outflows for four straight trading days, totaling about $118 million, with stock of about $17.8 billion—roughly one-sixteenth. Ripple had a net inflow of $3.1 million and stock of about $1.4 billion—about one-fortieth.
Within the same week, Zcash’s in-and-out was heavy relative to its own stock at one-eighth; the other three were still below one-sixteenth. The $98.2 million that entered two weeks ago has almost been given back this week.
$93.6 million is the flow number; the stock still remembers about $750 million. Flow reversal only shows that holders swapped hands; the supply amount didn’t change at all. Next week, if daily net redemptions shrink back to below $10 million and the cumulative net inflow stops going downward, then that kind of reading—treating timing as causality—has to be revised. With both places the numbers stayed as they were; I’ll keep this way of reading for now.
Divide this week’s in-and-out by each one’s respective stock. Only Zcash reaches one-eighth. For the platform token BNB, those figures can be checked day by day on Binance—the books match themselves. $ZEC
{future}(ZECUSDT)
$ZAMA
{future}(ZAMAUSDT)
$ZK
{future}(ZKUSDT)
#zcash现货etf首现周度净流出9360万美元
This on-the-spot product has an unusual setup: on September 18, it announced a 1-for-3 stock split; it was registered on September 28; it began trading under the new shares on September 30. And September 30 happened to be the heaviest outflow day, with a net daily redemption of $30.25 million. This week it recorded its first weekly net outflow of $93.6 million. Just two weeks ago it had entered with $98.2 million—those two moves nearly went back along the same path.
First, let the numbers line up. The “flow” figure for this week is the net amount of inflow and outflow: $93.6 million. The “stock” figure is the total amount the product holds, about $750 million. The media is focused on the first item; the second item only fell from a peak of about $915 million—it didn’t disappear. The 2.5% management fee isn’t either flow or stock; it’s the annual payment that holders pay.
I’m checking cumulative net inflows. It started from zero on the day it listed on August 25, surged to about $271 million over two months, and has since retreated to around $213 million. The money that went in didn’t just sit in place; the accounting moved the gap between the two figures.
Look at the four names laid out. For this week, how much did the in-and-out move relative to its own stock? Zcash had a net outflow of $93.6 million and stock of about $750 million—flow accounted for about one-eighth. Bitcoin had a net inflow of $82.9 million and stock of about $107.9 billion—about eight-tenths of one percent (one-thousandth). Ethereum saw net outflows for four straight trading days, totaling about $118 million, with stock of about $17.8 billion—roughly one-sixteenth. Ripple had a net inflow of $3.1 million and stock of about $1.4 billion—about one-fortieth.
Within the same week, Zcash’s in-and-out was heavy relative to its own stock at one-eighth; the other three were still below one-sixteenth. The $98.2 million that entered two weeks ago has almost been given back this week.
$93.6 million is the flow number; the stock still remembers about $750 million. Flow reversal only shows that holders swapped hands; the supply amount didn’t change at all. Next week, if daily net redemptions shrink back to below $10 million and the cumulative net inflow stops going downward, then that kind of reading—treating timing as causality—has to be revised. With both places the numbers stayed as they were; I’ll keep this way of reading for now.
Divide this week’s in-and-out by each one’s respective stock. Only Zcash reaches one-eighth. For the platform token BNB, those figures can be checked day by day on Binance—the books match themselves. $ZEC
$ZAMA
$ZK
#zcash现货etf首现周度净流出9360万美元
First, let the numbers line up. The “flow” figure for this week is the net amount of inflow and outflow: $93.6 million. The “stock” figure is the total amount the product holds, about $750 million. The media is focused on the first item; the second item only fell from a peak of about $915 million—it didn’t disappear. The 2.5% management fee isn’t either flow or stock; it’s the annual payment that holders pay.
I’m checking cumulative net inflows. It started from zero on the day it listed on August 25, surged to about $271 million over two months, and has since retreated to around $213 million. The money that went in didn’t just sit in place; the accounting moved the gap between the two figures.
Look at the four names laid out. For this week, how much did the in-and-out move relative to its own stock? Zcash had a net outflow of $93.6 million and stock of about $750 million—flow accounted for about one-eighth. Bitcoin had a net inflow of $82.9 million and stock of about $107.9 billion—about eight-tenths of one percent (one-thousandth). Ethereum saw net outflows for four straight trading days, totaling about $118 million, with stock of about $17.8 billion—roughly one-sixteenth. Ripple had a net inflow of $3.1 million and stock of about $1.4 billion—about one-fortieth.
Within the same week, Zcash’s in-and-out was heavy relative to its own stock at one-eighth; the other three were still below one-sixteenth. The $98.2 million that entered two weeks ago has almost been given back this week.
$93.6 million is the flow number; the stock still remembers about $750 million. Flow reversal only shows that holders swapped hands; the supply amount didn’t change at all. Next week, if daily net redemptions shrink back to below $10 million and the cumulative net inflow stops going downward, then that kind of reading—treating timing as causality—has to be revised. With both places the numbers stayed as they were; I’ll keep this way of reading for now.
Divide this week’s in-and-out by each one’s respective stock. Only Zcash reaches one-eighth. For the platform token BNB, those figures can be checked day by day on Binance—the books match themselves. $ZEC
$ZAMA
$ZK
#zcash现货etf首现周度净流出9360万美元

4
88
78.8k
·
--
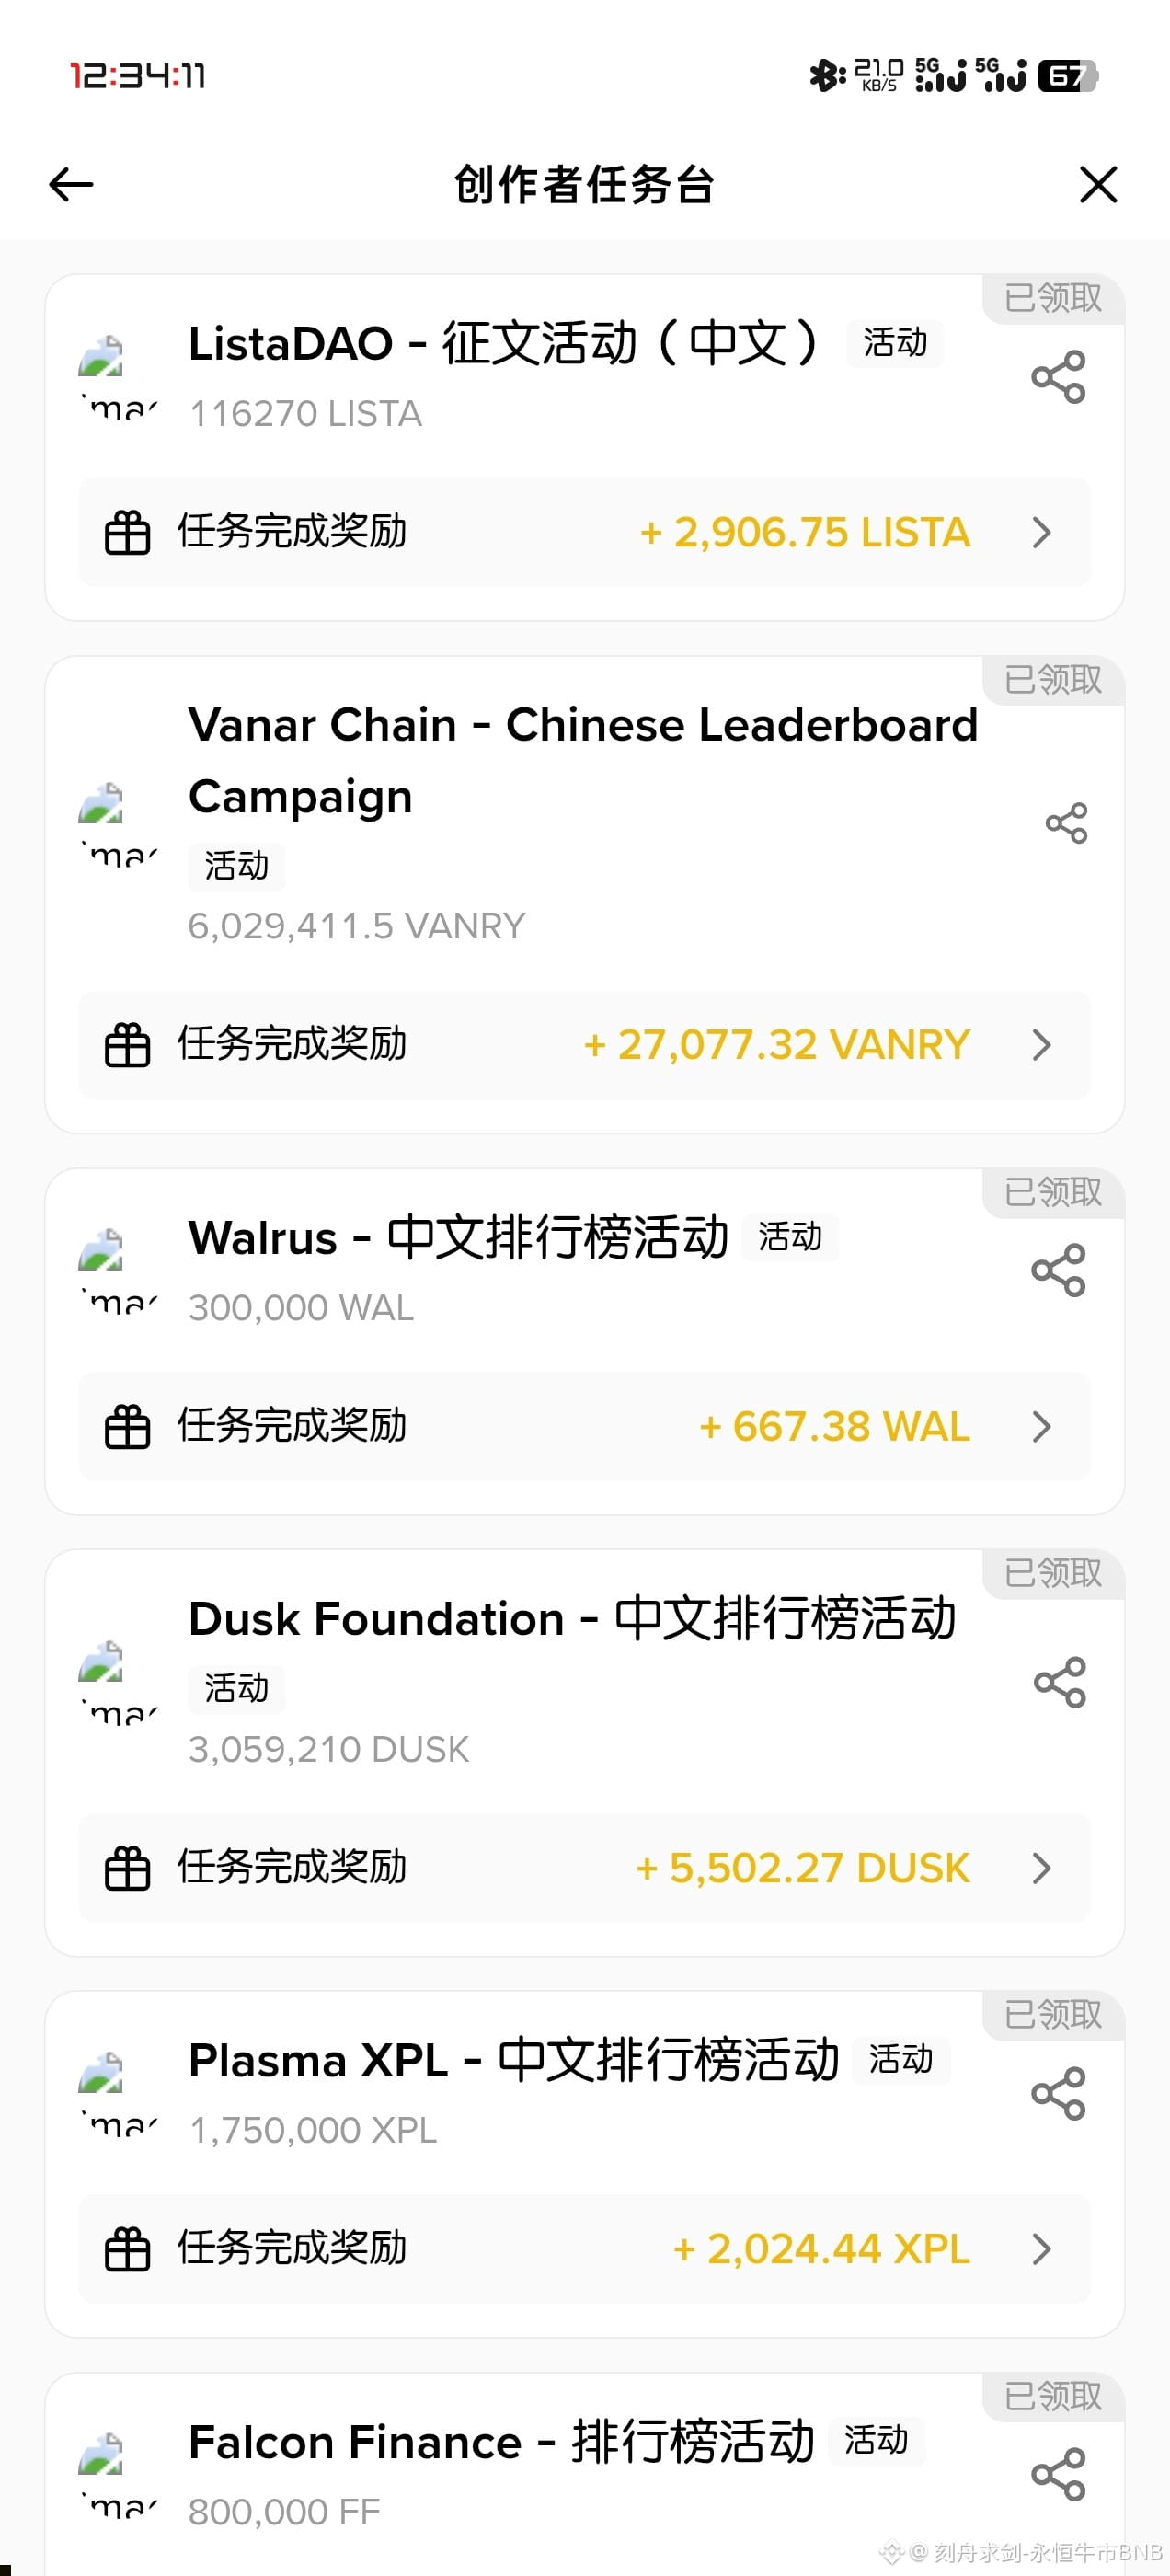
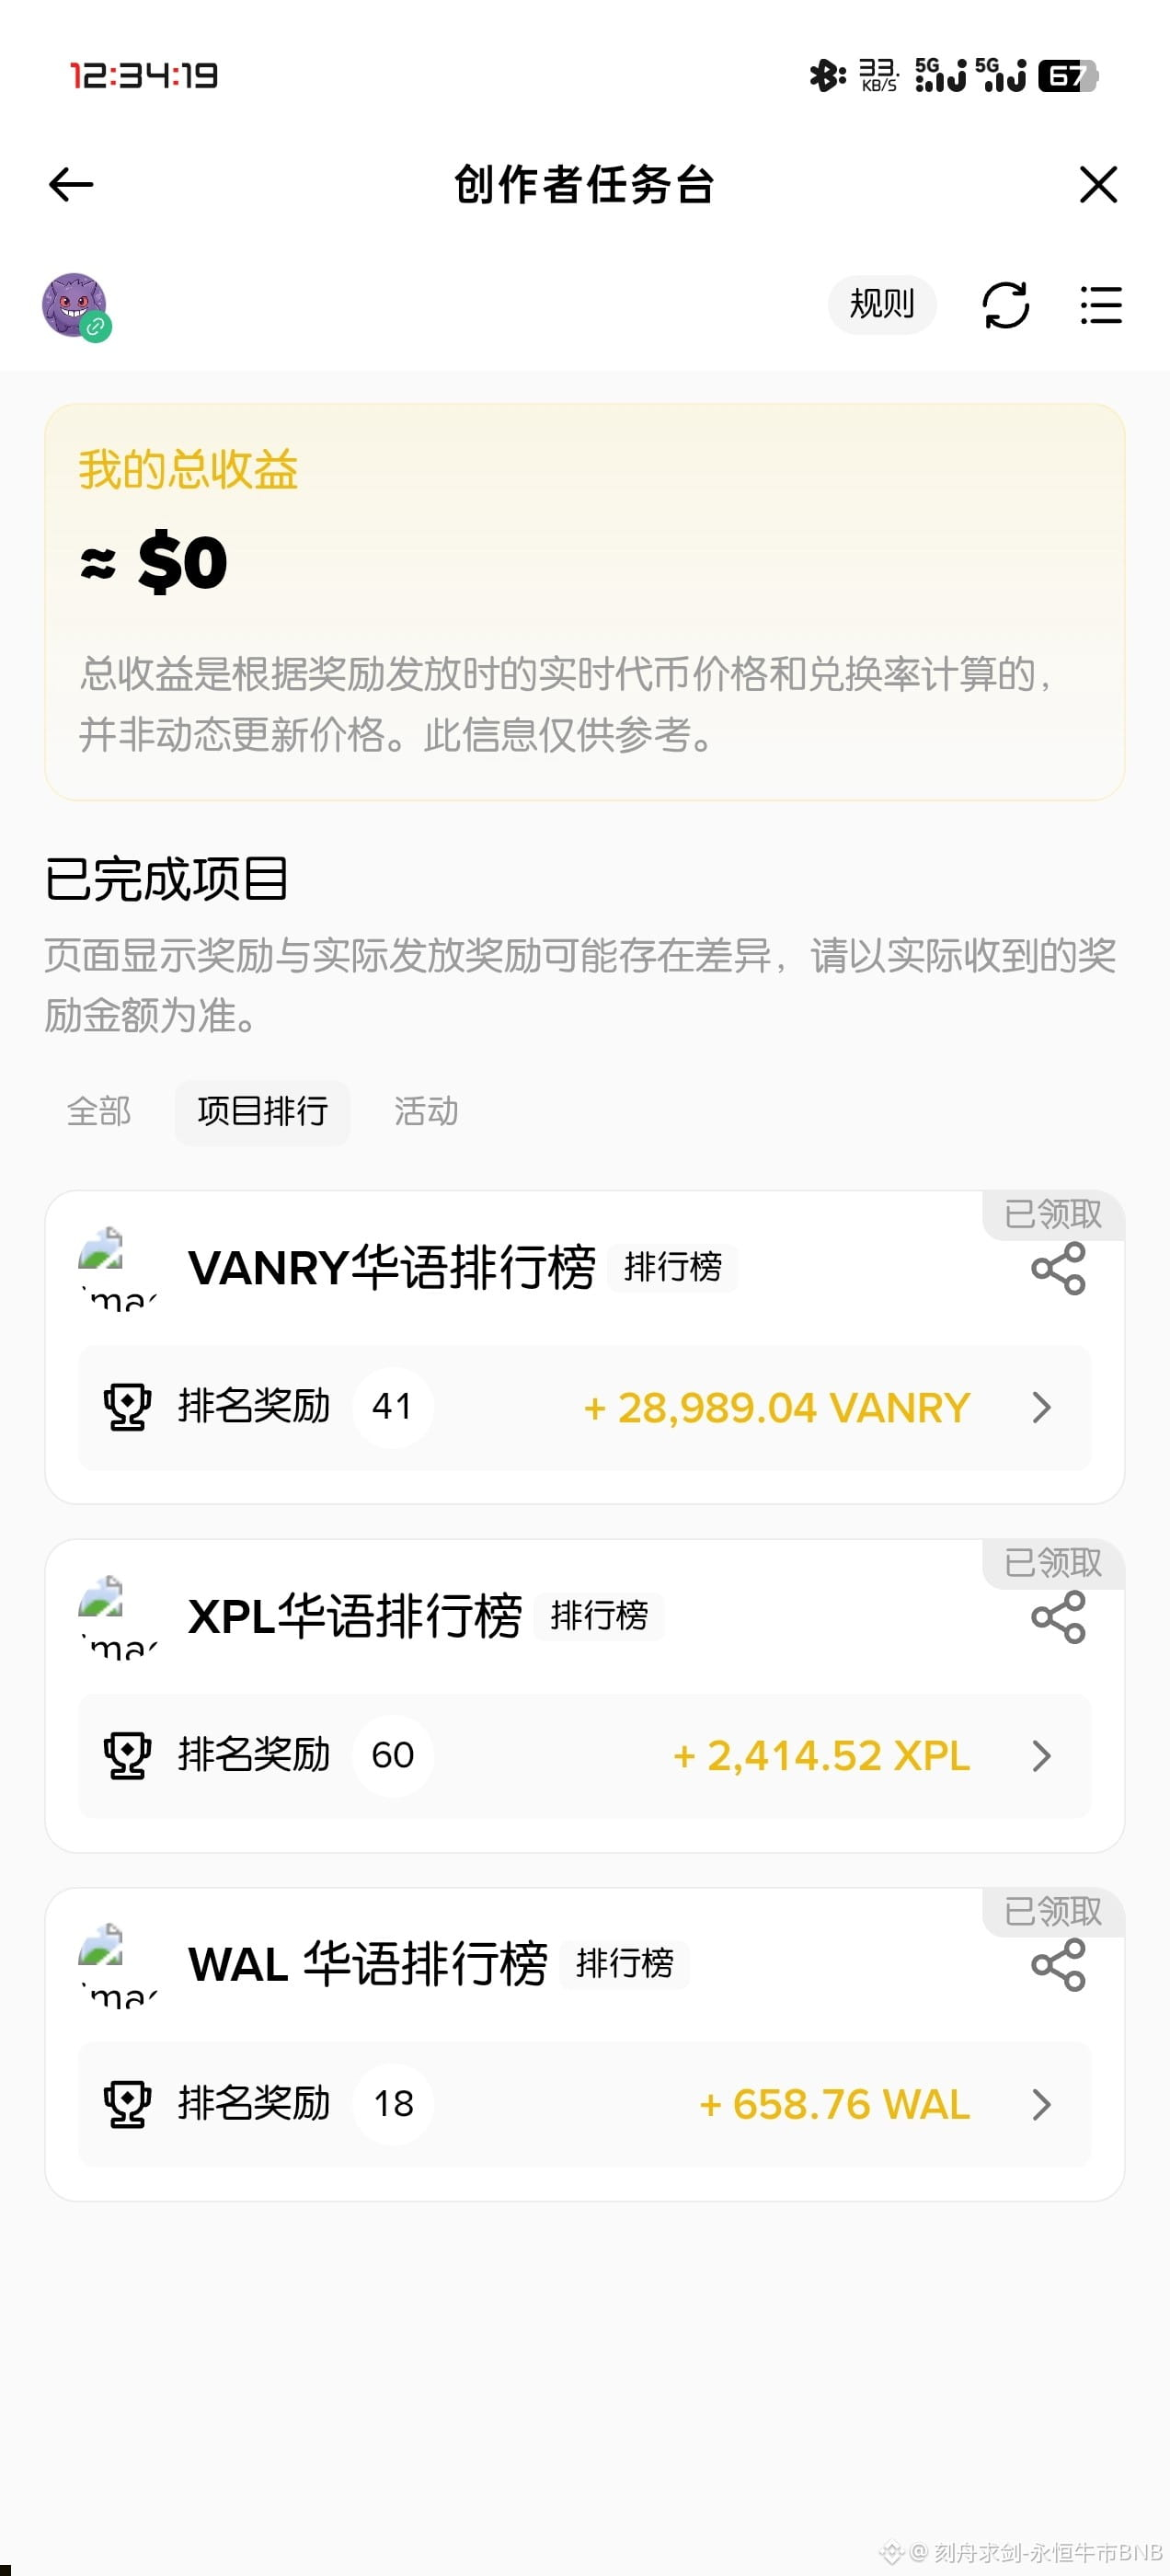
It’s been a long time since a new event came out—I’m really upset about it #创作者任务台
It’s been a long time since a new event came out—I’m really upset about it #创作者任务台

1
835
·
--
Bullish
On August 10, the rule changes were submitted; the seal was applied on October 2, with a gap of 53 days in between. After the seal was applied, they were still holding back another filing; the registration statement took effect, but the dates were left blank. What was relayed was that those two characters—“approved”—were granted, but to this day none of the six products has reported any trades.
The deal was bundled for six products at once: two were listed on Bitcoin and Ethereum, and the other four on gold, silver, crude oil, and natural gas. The same document places two categories of things in one line—essentially, both categories are filed into the same drawer.
Each product targets a 3-to-1 ratio based on that day’s performance. The exposure is built through futures contracts; no physical delivery is involved. It only covers one day: positions are zeroed out at the close, then recalculated from scratch the next day. Futures have expiration dates, so you have to roll them down one by one. The bid-ask spread (the roll cost) is borne by the holder—the underlying stays in place, but the net value is eroded back and forth.
To lay out how they moved on that day: Bitcoin spot was $84,640, down 0.43% over the past 24 hours, with an average daily high-low range of 2.4% over the next nine days; the platform coin BNB was $768, down 0.45% over the past 24 hours, with an average of 2.44%; Ethereum was $2,679, down 1.39% over the past 24 hours, with an average of 2.79%; Solana was $119, up slightly 0.16% over the past 24 hours, with an average of 4.3%. One Bitcoin corresponds to 31.6 units of Ethereum, 110 units of the BNB platform coin, and 710 units of Solana. The same 3-to-1 ratio is applied, but once it resets to zero, the numbers left behind are not the same: how much remains depends on how straight that day’s move was—not on the distance between the first and last points.
I was looking at the column that falls on the rolling cost. The names of all six products are already on the list, but the date of the first trade is still blank—the erosion starts from day one.
The six rows of names have been entered, yet the accounts must be recalculated every single day. On the day the registration statement took effect, if the first-day scale of those two crypto names was below that of the four commodity contracts, and if the rolling spread was also higher than the peer group, then it shows that the addition was only the length of the roster—and I would need to shift the column I’m tracking. If the first-day scale goes the other way, overtaking that batch and causing the spread to narrow, then this judgment stays. In this document, you can’t find the day the gates opened. The only side you can check yourself is the price: the current prices of BNB and these names are refreshed point by point on Binance; meanwhile, the trade they say was posted “a few days later” accrues interest day by day in the wealth-management section.
This article is a record of viewpoints and does not constitute investment advice.
$GTC
{future}(GTCUSDT)
$NIGHT
{future}(NIGHTUSDT)
$MINA
{future}(MINAUSDT)
#sec批准3倍杠杆比特币以太坊etp
On August 10, the rule changes were submitted; the seal was applied on October 2, with a gap of 53 days in between. After the seal was applied, they were still holding back another filing; the registration statement took effect, but the dates were left blank. What was relayed was that those two characters—“approved”—were granted, but to this day none of the six products has reported any trades.
The deal was bundled for six products at once: two were listed on Bitcoin and Ethereum, and the other four on gold, silver, crude oil, and natural gas. The same document places two categories of things in one line—essentially, both categories are filed into the same drawer.
Each product targets a 3-to-1 ratio based on that day’s performance. The exposure is built through futures contracts; no physical delivery is involved. It only covers one day: positions are zeroed out at the close, then recalculated from scratch the next day. Futures have expiration dates, so you have to roll them down one by one. The bid-ask spread (the roll cost) is borne by the holder—the underlying stays in place, but the net value is eroded back and forth.
To lay out how they moved on that day: Bitcoin spot was $84,640, down 0.43% over the past 24 hours, with an average daily high-low range of 2.4% over the next nine days; the platform coin BNB was $768, down 0.45% over the past 24 hours, with an average of 2.44%; Ethereum was $2,679, down 1.39% over the past 24 hours, with an average of 2.79%; Solana was $119, up slightly 0.16% over the past 24 hours, with an average of 4.3%. One Bitcoin corresponds to 31.6 units of Ethereum, 110 units of the BNB platform coin, and 710 units of Solana. The same 3-to-1 ratio is applied, but once it resets to zero, the numbers left behind are not the same: how much remains depends on how straight that day’s move was—not on the distance between the first and last points.
I was looking at the column that falls on the rolling cost. The names of all six products are already on the list, but the date of the first trade is still blank—the erosion starts from day one.
The six rows of names have been entered, yet the accounts must be recalculated every single day. On the day the registration statement took effect, if the first-day scale of those two crypto names was below that of the four commodity contracts, and if the rolling spread was also higher than the peer group, then it shows that the addition was only the length of the roster—and I would need to shift the column I’m tracking. If the first-day scale goes the other way, overtaking that batch and causing the spread to narrow, then this judgment stays. In this document, you can’t find the day the gates opened. The only side you can check yourself is the price: the current prices of BNB and these names are refreshed point by point on Binance; meanwhile, the trade they say was posted “a few days later” accrues interest day by day in the wealth-management section.
This article is a record of viewpoints and does not constitute investment advice.
$GTC
$NIGHT
$MINA
#sec批准3倍杠杆比特币以太坊etp
The deal was bundled for six products at once: two were listed on Bitcoin and Ethereum, and the other four on gold, silver, crude oil, and natural gas. The same document places two categories of things in one line—essentially, both categories are filed into the same drawer.
Each product targets a 3-to-1 ratio based on that day’s performance. The exposure is built through futures contracts; no physical delivery is involved. It only covers one day: positions are zeroed out at the close, then recalculated from scratch the next day. Futures have expiration dates, so you have to roll them down one by one. The bid-ask spread (the roll cost) is borne by the holder—the underlying stays in place, but the net value is eroded back and forth.
To lay out how they moved on that day: Bitcoin spot was $84,640, down 0.43% over the past 24 hours, with an average daily high-low range of 2.4% over the next nine days; the platform coin BNB was $768, down 0.45% over the past 24 hours, with an average of 2.44%; Ethereum was $2,679, down 1.39% over the past 24 hours, with an average of 2.79%; Solana was $119, up slightly 0.16% over the past 24 hours, with an average of 4.3%. One Bitcoin corresponds to 31.6 units of Ethereum, 110 units of the BNB platform coin, and 710 units of Solana. The same 3-to-1 ratio is applied, but once it resets to zero, the numbers left behind are not the same: how much remains depends on how straight that day’s move was—not on the distance between the first and last points.
I was looking at the column that falls on the rolling cost. The names of all six products are already on the list, but the date of the first trade is still blank—the erosion starts from day one.
The six rows of names have been entered, yet the accounts must be recalculated every single day. On the day the registration statement took effect, if the first-day scale of those two crypto names was below that of the four commodity contracts, and if the rolling spread was also higher than the peer group, then it shows that the addition was only the length of the roster—and I would need to shift the column I’m tracking. If the first-day scale goes the other way, overtaking that batch and causing the spread to narrow, then this judgment stays. In this document, you can’t find the day the gates opened. The only side you can check yourself is the price: the current prices of BNB and these names are refreshed point by point on Binance; meanwhile, the trade they say was posted “a few days later” accrues interest day by day in the wealth-management section.
This article is a record of viewpoints and does not constitute investment advice.
$GTC
$NIGHT
$MINA
#sec批准3倍杠杆比特币以太坊etp

2
4
11.1k
·
--
Bullish
In the settlements for that same day’s period, the percentages given by the four names are not all in the same bracket: Dogecoin’s notional is about $220 million, with the fee capped at one per thousand; Solana’s is about $840 million, at four per million; Ethereum’s is about $2.0 billion, at six per million; and Bitcoin’s is about $4.4 billion, falling to negative five per million. Looking at the percentages alone can’t tell the weight or severity. The “multiplier” column—where it’s applied to move from $200 million to $4.4 billion—means that even the same decimal ends up as money on a completely different scale.
This money is settled every eight hours: it’s calculated by multiplying the fee rate for the period by the notional amount below, with the side that has more participants paying the side that has fewer. What it records is the price of the position, not the quantity.
Convert the period’s percentage into an annualized figure to read it correctly and carefully. For the period ending September 30, it reported 0.000089. With three periods per day, annualized, that’s about nine and a half points. Within the same dataset, the notional amount rises from roughly $4.27 billion on September 28 to about $4.42 billion on October 2; on September 21 it was still around $5.23 billion. Using this reading, the BTC spot price is $84,493, and at one point during the day it reached $86,913.
I checked the other column—the number of people on each side. On the day with the highest fee rate on September 30, the two sides (long vs. short) are 18,199 people versus 14,528 people. By October 2 it moves to 16,690 people versus 16,114 people. When the percentage on one end is pushed up, the headcount on the other end has already moved to somewhere there.
The reporting standards don’t match either: one daily report uses the entire market’s numbers. Since September 30, the positions increased by about 27,000 coins, to roughly 653,000 coins, with notional around $56.2 billion; but in my case it’s only about $4.4 billion. Annualized fee rates vary by source: an institutional-facing report gives around the mid-single digits, while other large-market feeds show around nine to ten.
Those nine-something percentage points were raised for three days, yet the notional underneath only moved from about $4.27 billion back to about $4.42 billion. In the subsequent settled periods, if the notional returns above $4.7 billion while the fee is still below zero—then it indicates that the quantity being supported is from two sides with equal-sized participation. My version would have to change. If the notional stays in the $4.4 billion range and the fee keeps falling near zero, then it stays as it is. The two columns I need to verify—what I can touch with my hands—are: Bitcoin’s spot quotes for buy/sell, and what’s fixed on another arrangement where interest is calculated by day. This article is a record of views and does not constitute investment advice.$SAND
{future}(SANDUSDT)
$NIGHT
{future}(NIGHTUSDT)
$GALA
{future}(GALAUSDT)
#比特币资金费率升至10%未平仓合约回升
In the settlements for that same day’s period, the percentages given by the four names are not all in the same bracket: Dogecoin’s notional is about $220 million, with the fee capped at one per thousand; Solana’s is about $840 million, at four per million; Ethereum’s is about $2.0 billion, at six per million; and Bitcoin’s is about $4.4 billion, falling to negative five per million. Looking at the percentages alone can’t tell the weight or severity. The “multiplier” column—where it’s applied to move from $200 million to $4.4 billion—means that even the same decimal ends up as money on a completely different scale.
This money is settled every eight hours: it’s calculated by multiplying the fee rate for the period by the notional amount below, with the side that has more participants paying the side that has fewer. What it records is the price of the position, not the quantity.
Convert the period’s percentage into an annualized figure to read it correctly and carefully. For the period ending September 30, it reported 0.000089. With three periods per day, annualized, that’s about nine and a half points. Within the same dataset, the notional amount rises from roughly $4.27 billion on September 28 to about $4.42 billion on October 2; on September 21 it was still around $5.23 billion. Using this reading, the BTC spot price is $84,493, and at one point during the day it reached $86,913.
I checked the other column—the number of people on each side. On the day with the highest fee rate on September 30, the two sides (long vs. short) are 18,199 people versus 14,528 people. By October 2 it moves to 16,690 people versus 16,114 people. When the percentage on one end is pushed up, the headcount on the other end has already moved to somewhere there.
The reporting standards don’t match either: one daily report uses the entire market’s numbers. Since September 30, the positions increased by about 27,000 coins, to roughly 653,000 coins, with notional around $56.2 billion; but in my case it’s only about $4.4 billion. Annualized fee rates vary by source: an institutional-facing report gives around the mid-single digits, while other large-market feeds show around nine to ten.
Those nine-something percentage points were raised for three days, yet the notional underneath only moved from about $4.27 billion back to about $4.42 billion. In the subsequent settled periods, if the notional returns above $4.7 billion while the fee is still below zero—then it indicates that the quantity being supported is from two sides with equal-sized participation. My version would have to change. If the notional stays in the $4.4 billion range and the fee keeps falling near zero, then it stays as it is. The two columns I need to verify—what I can touch with my hands—are: Bitcoin’s spot quotes for buy/sell, and what’s fixed on another arrangement where interest is calculated by day. This article is a record of views and does not constitute investment advice.$SAND
$NIGHT
$GALA
#比特币资金费率升至10%未平仓合约回升
This money is settled every eight hours: it’s calculated by multiplying the fee rate for the period by the notional amount below, with the side that has more participants paying the side that has fewer. What it records is the price of the position, not the quantity.
Convert the period’s percentage into an annualized figure to read it correctly and carefully. For the period ending September 30, it reported 0.000089. With three periods per day, annualized, that’s about nine and a half points. Within the same dataset, the notional amount rises from roughly $4.27 billion on September 28 to about $4.42 billion on October 2; on September 21 it was still around $5.23 billion. Using this reading, the BTC spot price is $84,493, and at one point during the day it reached $86,913.
I checked the other column—the number of people on each side. On the day with the highest fee rate on September 30, the two sides (long vs. short) are 18,199 people versus 14,528 people. By October 2 it moves to 16,690 people versus 16,114 people. When the percentage on one end is pushed up, the headcount on the other end has already moved to somewhere there.
The reporting standards don’t match either: one daily report uses the entire market’s numbers. Since September 30, the positions increased by about 27,000 coins, to roughly 653,000 coins, with notional around $56.2 billion; but in my case it’s only about $4.4 billion. Annualized fee rates vary by source: an institutional-facing report gives around the mid-single digits, while other large-market feeds show around nine to ten.
Those nine-something percentage points were raised for three days, yet the notional underneath only moved from about $4.27 billion back to about $4.42 billion. In the subsequent settled periods, if the notional returns above $4.7 billion while the fee is still below zero—then it indicates that the quantity being supported is from two sides with equal-sized participation. My version would have to change. If the notional stays in the $4.4 billion range and the fee keeps falling near zero, then it stays as it is. The two columns I need to verify—what I can touch with my hands—are: Bitcoin’s spot quotes for buy/sell, and what’s fixed on another arrangement where interest is calculated by day. This article is a record of views and does not constitute investment advice.$SAND
$NIGHT
$GALA
#比特币资金费率升至10%未平仓合约回升

768
·
--
Bullish
The scheme disclosed on October 1 states that after these chips are sold, they will be leased back in exactly the same form: about US$8 billion, thousands of units of the latest-generation chips, installed in more than a dozen data centers across five U.S. states. It is carried out through a newly set up special-purpose entity (carrier): it raises debt financing to external investors, with a maximum equity stake of 10%. The depreciation rules are written into the regulatory documents: each generation of semiconductor products is at least expected to be usable for five years, yet this generation is quickly displaced by the next one.
On Binance’s spot market, the three comparable computing power names show their readings side by side: io.net down about 5.5% over seven days, with a size of about US$60 million; the equipment remains in the hands of the provider. Internet Computer up about 2.7% over seven days, size about US$1.8 billion. Render up about 0.8% over seven days, size about US$990 million. The platform token BNB is almost unmoved in two places, with a market cap in the “hundreds of billions” range; what the rules specify are the transaction fees and quarterly burn. All three computing-power accounts ultimately end up off-chain: whoever holds the equipment also holds the residual value; the tokens only specify settlement and destruction. In this round, this deal is the only one where holding and guarantee are separated.
What is moved out is the holding; what is left behind is the guarantee. A common approach is for a company to commit to its lenders regarding the disposal value of chips or data centers. This time, the assets are transferred into the carrier and the debt is issued to investors, but the residual value line is still signed off by the original company entry by entry. The problem is that the five-year depreciation period coincides precisely with the incoming generation that is about to take over.
I looked at the guarantee line: US$800 million, thousands of units, even the lease-back use are written clearly; the middle section has no sign-off. This year, the capital expenditure is expected to be US$220 billion; the bond plan of about US$50 billion in March was increased from US$37 billion. When a US$25 billion long-tenor bond is issued in July, demand weakens.
What is moved away is the holding; what remains in place is the guarantee: depreciation is based on five years, and replacement units are already on the way. These two lines are pressed into the same table. In the first disclosure after the carrier is listed, if the residual value guarantee were changed to tiered settlement based on disposal price, and no longer signed off uniformly by the original company, it would indicate that the risk has truly been transferred—so this would need to be overturned. But the guarantee is still signed entry by entry under the original company’s name; it still stands. Which disclosure is the guarantee signed in? On Binance, can the buying/selling and depth for those three names be flipped at any time?
This article records an opinion and does not constitute investment advice.$GTC
{future}(GTCUSDT)
$SAND
{future}(SANDUSDT)
$MINA
{future}(MINAUSDT)
#亚马逊拟售80亿美元英伟达芯片
The scheme disclosed on October 1 states that after these chips are sold, they will be leased back in exactly the same form: about US$8 billion, thousands of units of the latest-generation chips, installed in more than a dozen data centers across five U.S. states. It is carried out through a newly set up special-purpose entity (carrier): it raises debt financing to external investors, with a maximum equity stake of 10%. The depreciation rules are written into the regulatory documents: each generation of semiconductor products is at least expected to be usable for five years, yet this generation is quickly displaced by the next one.
On Binance’s spot market, the three comparable computing power names show their readings side by side: io.net down about 5.5% over seven days, with a size of about US$60 million; the equipment remains in the hands of the provider. Internet Computer up about 2.7% over seven days, size about US$1.8 billion. Render up about 0.8% over seven days, size about US$990 million. The platform token BNB is almost unmoved in two places, with a market cap in the “hundreds of billions” range; what the rules specify are the transaction fees and quarterly burn. All three computing-power accounts ultimately end up off-chain: whoever holds the equipment also holds the residual value; the tokens only specify settlement and destruction. In this round, this deal is the only one where holding and guarantee are separated.
What is moved out is the holding; what is left behind is the guarantee. A common approach is for a company to commit to its lenders regarding the disposal value of chips or data centers. This time, the assets are transferred into the carrier and the debt is issued to investors, but the residual value line is still signed off by the original company entry by entry. The problem is that the five-year depreciation period coincides precisely with the incoming generation that is about to take over.
I looked at the guarantee line: US$800 million, thousands of units, even the lease-back use are written clearly; the middle section has no sign-off. This year, the capital expenditure is expected to be US$220 billion; the bond plan of about US$50 billion in March was increased from US$37 billion. When a US$25 billion long-tenor bond is issued in July, demand weakens.
What is moved away is the holding; what remains in place is the guarantee: depreciation is based on five years, and replacement units are already on the way. These two lines are pressed into the same table. In the first disclosure after the carrier is listed, if the residual value guarantee were changed to tiered settlement based on disposal price, and no longer signed off uniformly by the original company, it would indicate that the risk has truly been transferred—so this would need to be overturned. But the guarantee is still signed entry by entry under the original company’s name; it still stands. Which disclosure is the guarantee signed in? On Binance, can the buying/selling and depth for those three names be flipped at any time?
This article records an opinion and does not constitute investment advice.$GTC
$SAND
$MINA
#亚马逊拟售80亿美元英伟达芯片
On Binance’s spot market, the three comparable computing power names show their readings side by side: io.net down about 5.5% over seven days, with a size of about US$60 million; the equipment remains in the hands of the provider. Internet Computer up about 2.7% over seven days, size about US$1.8 billion. Render up about 0.8% over seven days, size about US$990 million. The platform token BNB is almost unmoved in two places, with a market cap in the “hundreds of billions” range; what the rules specify are the transaction fees and quarterly burn. All three computing-power accounts ultimately end up off-chain: whoever holds the equipment also holds the residual value; the tokens only specify settlement and destruction. In this round, this deal is the only one where holding and guarantee are separated.
What is moved out is the holding; what is left behind is the guarantee. A common approach is for a company to commit to its lenders regarding the disposal value of chips or data centers. This time, the assets are transferred into the carrier and the debt is issued to investors, but the residual value line is still signed off by the original company entry by entry. The problem is that the five-year depreciation period coincides precisely with the incoming generation that is about to take over.
I looked at the guarantee line: US$800 million, thousands of units, even the lease-back use are written clearly; the middle section has no sign-off. This year, the capital expenditure is expected to be US$220 billion; the bond plan of about US$50 billion in March was increased from US$37 billion. When a US$25 billion long-tenor bond is issued in July, demand weakens.
What is moved away is the holding; what remains in place is the guarantee: depreciation is based on five years, and replacement units are already on the way. These two lines are pressed into the same table. In the first disclosure after the carrier is listed, if the residual value guarantee were changed to tiered settlement based on disposal price, and no longer signed off uniformly by the original company, it would indicate that the risk has truly been transferred—so this would need to be overturned. But the guarantee is still signed entry by entry under the original company’s name; it still stands. Which disclosure is the guarantee signed in? On Binance, can the buying/selling and depth for those three names be flipped at any time?
This article records an opinion and does not constitute investment advice.$GTC
$SAND
$MINA
#亚马逊拟售80亿美元英伟达芯片

1
4
10.1k
·
--
Bullish
Best-ever third quarter—and still negative for this year in this column: Ethereum (ETH) went from $1,569.91 on July 1 to $2,687 on September 30, up about 70.9% for the quarter. The total for the first three quarters is still down about 9.47%, still about 45.75% short of the peak in August 2025. The starting point wasn’t made out of thin air either: the first two quarters fell by 29.26% and 25.28%, respectively.
Four public-chain names all moved upward this quarter, and their figures are squeezed closely together: Ethereum (ETH) up about 70.9%, with a market cap of roughly $310 billion; Solana up about 60.4%, about $65.6 billion; Avalanche up about 67.3%, about $4.5 billion; Cardano up about 70.9%, about $8.5 billion. Switching to this year’s first three quarters, the four immediately split apart: Ethereum (ETH) down about 9.6%, Avalanche down about 11.2%, Solana down about 5.2%, and Cardano down about 26.1%. What separates this group is how deep the dip is: the rebound heights are squeezed within ten percentage points, but the positions differ by more than twenty percentage points.
What was truly changed this quarter isn’t that part of the quote. In the quarterly staking report, note the 40.20 million tokens locked in, about 33% of supply—an all-time high tier. Most of the increase comes from institutions. In the same report, throughput is up year over year by about 73%, and—by design—block space has become cheaper. Cheaper per transaction means the share you receive gets thinner; higher usage doesn’t necessarily mean higher earnings.
I checked the heaviest buyer and the same day at quarter-end: one warehouse holds 6,001,302 tokens, about 4.9% of supply, at an average price of $3,337. By the end of the quarter, it’s still down by about $3.925 billion. In September, spot funds only added $892 million, while August was $1.85 billion. On the very last day of the quarter, spot funds had a total net outflow of about $233 million on the Ethereum side, corresponding to 22,290 ETH.
This quarter filled the hole dug in the first half: the changes show up in the locked-in portion and the per-transaction fee. By the end of the fourth quarter, if the locked-in share keeps rising and the per-transaction fee keeps falling, it would indicate that this time the change was in usage—I would have overestimated the pricing, so the assessment would stand. If the share falls back and the hole isn’t filled, then that judgment would need to be overturned. To verify this point, type the name into the Binance search box—both the quarter and the first three quarters are listed there. For entries and for financial products, both are shown in plain view. This article is a record of viewpoints and does not constitute investment advice.$GTC
{future}(GTCUSDT)
$MOVR
{future}(MOVRUSDT)
$ALICE
{future}(ALICEUSDT)
#以太坊三季度涨70.9%
Best-ever third quarter—and still negative for this year in this column: Ethereum (ETH) went from $1,569.91 on July 1 to $2,687 on September 30, up about 70.9% for the quarter. The total for the first three quarters is still down about 9.47%, still about 45.75% short of the peak in August 2025. The starting point wasn’t made out of thin air either: the first two quarters fell by 29.26% and 25.28%, respectively.
Four public-chain names all moved upward this quarter, and their figures are squeezed closely together: Ethereum (ETH) up about 70.9%, with a market cap of roughly $310 billion; Solana up about 60.4%, about $65.6 billion; Avalanche up about 67.3%, about $4.5 billion; Cardano up about 70.9%, about $8.5 billion. Switching to this year’s first three quarters, the four immediately split apart: Ethereum (ETH) down about 9.6%, Avalanche down about 11.2%, Solana down about 5.2%, and Cardano down about 26.1%. What separates this group is how deep the dip is: the rebound heights are squeezed within ten percentage points, but the positions differ by more than twenty percentage points.
What was truly changed this quarter isn’t that part of the quote. In the quarterly staking report, note the 40.20 million tokens locked in, about 33% of supply—an all-time high tier. Most of the increase comes from institutions. In the same report, throughput is up year over year by about 73%, and—by design—block space has become cheaper. Cheaper per transaction means the share you receive gets thinner; higher usage doesn’t necessarily mean higher earnings.
I checked the heaviest buyer and the same day at quarter-end: one warehouse holds 6,001,302 tokens, about 4.9% of supply, at an average price of $3,337. By the end of the quarter, it’s still down by about $3.925 billion. In September, spot funds only added $892 million, while August was $1.85 billion. On the very last day of the quarter, spot funds had a total net outflow of about $233 million on the Ethereum side, corresponding to 22,290 ETH.
This quarter filled the hole dug in the first half: the changes show up in the locked-in portion and the per-transaction fee. By the end of the fourth quarter, if the locked-in share keeps rising and the per-transaction fee keeps falling, it would indicate that this time the change was in usage—I would have overestimated the pricing, so the assessment would stand. If the share falls back and the hole isn’t filled, then that judgment would need to be overturned. To verify this point, type the name into the Binance search box—both the quarter and the first three quarters are listed there. For entries and for financial products, both are shown in plain view. This article is a record of viewpoints and does not constitute investment advice.$GTC
$MOVR
$ALICE
#以太坊三季度涨70.9%
Four public-chain names all moved upward this quarter, and their figures are squeezed closely together: Ethereum (ETH) up about 70.9%, with a market cap of roughly $310 billion; Solana up about 60.4%, about $65.6 billion; Avalanche up about 67.3%, about $4.5 billion; Cardano up about 70.9%, about $8.5 billion. Switching to this year’s first three quarters, the four immediately split apart: Ethereum (ETH) down about 9.6%, Avalanche down about 11.2%, Solana down about 5.2%, and Cardano down about 26.1%. What separates this group is how deep the dip is: the rebound heights are squeezed within ten percentage points, but the positions differ by more than twenty percentage points.
What was truly changed this quarter isn’t that part of the quote. In the quarterly staking report, note the 40.20 million tokens locked in, about 33% of supply—an all-time high tier. Most of the increase comes from institutions. In the same report, throughput is up year over year by about 73%, and—by design—block space has become cheaper. Cheaper per transaction means the share you receive gets thinner; higher usage doesn’t necessarily mean higher earnings.
I checked the heaviest buyer and the same day at quarter-end: one warehouse holds 6,001,302 tokens, about 4.9% of supply, at an average price of $3,337. By the end of the quarter, it’s still down by about $3.925 billion. In September, spot funds only added $892 million, while August was $1.85 billion. On the very last day of the quarter, spot funds had a total net outflow of about $233 million on the Ethereum side, corresponding to 22,290 ETH.
This quarter filled the hole dug in the first half: the changes show up in the locked-in portion and the per-transaction fee. By the end of the fourth quarter, if the locked-in share keeps rising and the per-transaction fee keeps falling, it would indicate that this time the change was in usage—I would have overestimated the pricing, so the assessment would stand. If the share falls back and the hole isn’t filled, then that judgment would need to be overturned. To verify this point, type the name into the Binance search box—both the quarter and the first three quarters are listed there. For entries and for financial products, both are shown in plain view. This article is a record of viewpoints and does not constitute investment advice.$GTC
$MOVR
$ALICE
#以太坊三季度涨70.9%
1
27
24.2k
·
--
Bullish
On October 1, readings across three tenors were grouped into three buckets: the 10-year yield rose by 4 basis points to 5.33%, the highest since April 2002; the 30-year yield rose by 3 basis points to 5.677%, rising for eight straight days; and the 2-year yield rose by only 2 basis points to 4.91%. The long end was raised the longest, while the short end was raised the least.
There’s more than one route here: oil prices are still high, and the inflation indicator compiled monthly for August came in at 3.4% year over year; market bets for the rate hike at the October meeting are hovering around seven-tenths.
I’m figuring why the three buckets aren’t symmetrical. The bet priced at roughly seventy percent should have landed on the short end—yet the 2-year tenor moved by just 2 basis points. The longest-tenor bucket is the 30-year, which has been climbing for eight days. The part being priced looks more like the tenor matched with fiscal supply.
The fiscal numbers are concrete: the size of federal debt has passed $40.1 trillion, and the fiscal year 2026 deficit is expected to be $1.9 trillion; the effect of the prior round of long-bond buybacks fell short of expectations. The long-end term premium has continued to widen, and Europe’s long-end yields are also at multi-year highs.
On Binance spot there are four names arranged by tenor: Pendle is up about 1.0% over 24 hours and down about 8.3% over seven days, with a size of about $540 million; the yield certificate specifies an expiration date. Ondo is down about 0.6% over 24 hours and down about 3.7% over seven days; one Bitcoin is roughly equivalent to 167,000 ONDO, and it’s tied to short-term bond coupon income, with the tenor tracking that batch of bonds. Aave is up about 2.4% over 24 hours and up about 13.0% over seven days, with a size of about $2.4 billion; it’s earn-and-withdraw on demand, and the interest rate floats with utilization. The platform token BNB is up about 0.1% over 24 hours and down about 0.7% over seven days, with a size in the “hundreds of billions” tier—no deposit layer. The magnitude and the scale don’t fall on the same line; what separates them is the tenor field: in two places it states dates, in one case it’s earn-and-withdraw on demand, and in one case there is no such layer.
This round lifts the long end, and the policy path only accounts for 2 basis points. By the time the October 2 meeting takes effect, if the 2-year rate is also lifted above 5% and the long-end move is matched, that would mean this round’s pricing was of the policy path—and that conclusion would be invalidated on the spot. But the short end stays in the 4.9% bucket, and the long end continues up; that’s what keeps the claim standing. The short-end line updates itself daily, while the unchanged figure remains fixed; Binance wealth-management accrues interest over each cycle. This article is a record of views and does not constitute investment advice.$NIGHT
{future}(NIGHTUSDT)
$FIL
{future}(FILUSDT)
$XLM
{future}(XLMUSDT)
#美国10年期美债收益率逼近5.3%
On October 1, readings across three tenors were grouped into three buckets: the 10-year yield rose by 4 basis points to 5.33%, the highest since April 2002; the 30-year yield rose by 3 basis points to 5.677%, rising for eight straight days; and the 2-year yield rose by only 2 basis points to 4.91%. The long end was raised the longest, while the short end was raised the least.
There’s more than one route here: oil prices are still high, and the inflation indicator compiled monthly for August came in at 3.4% year over year; market bets for the rate hike at the October meeting are hovering around seven-tenths.
I’m figuring why the three buckets aren’t symmetrical. The bet priced at roughly seventy percent should have landed on the short end—yet the 2-year tenor moved by just 2 basis points. The longest-tenor bucket is the 30-year, which has been climbing for eight days. The part being priced looks more like the tenor matched with fiscal supply.
The fiscal numbers are concrete: the size of federal debt has passed $40.1 trillion, and the fiscal year 2026 deficit is expected to be $1.9 trillion; the effect of the prior round of long-bond buybacks fell short of expectations. The long-end term premium has continued to widen, and Europe’s long-end yields are also at multi-year highs.
On Binance spot there are four names arranged by tenor: Pendle is up about 1.0% over 24 hours and down about 8.3% over seven days, with a size of about $540 million; the yield certificate specifies an expiration date. Ondo is down about 0.6% over 24 hours and down about 3.7% over seven days; one Bitcoin is roughly equivalent to 167,000 ONDO, and it’s tied to short-term bond coupon income, with the tenor tracking that batch of bonds. Aave is up about 2.4% over 24 hours and up about 13.0% over seven days, with a size of about $2.4 billion; it’s earn-and-withdraw on demand, and the interest rate floats with utilization. The platform token BNB is up about 0.1% over 24 hours and down about 0.7% over seven days, with a size in the “hundreds of billions” tier—no deposit layer. The magnitude and the scale don’t fall on the same line; what separates them is the tenor field: in two places it states dates, in one case it’s earn-and-withdraw on demand, and in one case there is no such layer.
This round lifts the long end, and the policy path only accounts for 2 basis points. By the time the October 2 meeting takes effect, if the 2-year rate is also lifted above 5% and the long-end move is matched, that would mean this round’s pricing was of the policy path—and that conclusion would be invalidated on the spot. But the short end stays in the 4.9% bucket, and the long end continues up; that’s what keeps the claim standing. The short-end line updates itself daily, while the unchanged figure remains fixed; Binance wealth-management accrues interest over each cycle. This article is a record of views and does not constitute investment advice.$NIGHT
$FIL
$XLM
#美国10年期美债收益率逼近5.3%
There’s more than one route here: oil prices are still high, and the inflation indicator compiled monthly for August came in at 3.4% year over year; market bets for the rate hike at the October meeting are hovering around seven-tenths.
I’m figuring why the three buckets aren’t symmetrical. The bet priced at roughly seventy percent should have landed on the short end—yet the 2-year tenor moved by just 2 basis points. The longest-tenor bucket is the 30-year, which has been climbing for eight days. The part being priced looks more like the tenor matched with fiscal supply.
The fiscal numbers are concrete: the size of federal debt has passed $40.1 trillion, and the fiscal year 2026 deficit is expected to be $1.9 trillion; the effect of the prior round of long-bond buybacks fell short of expectations. The long-end term premium has continued to widen, and Europe’s long-end yields are also at multi-year highs.
On Binance spot there are four names arranged by tenor: Pendle is up about 1.0% over 24 hours and down about 8.3% over seven days, with a size of about $540 million; the yield certificate specifies an expiration date. Ondo is down about 0.6% over 24 hours and down about 3.7% over seven days; one Bitcoin is roughly equivalent to 167,000 ONDO, and it’s tied to short-term bond coupon income, with the tenor tracking that batch of bonds. Aave is up about 2.4% over 24 hours and up about 13.0% over seven days, with a size of about $2.4 billion; it’s earn-and-withdraw on demand, and the interest rate floats with utilization. The platform token BNB is up about 0.1% over 24 hours and down about 0.7% over seven days, with a size in the “hundreds of billions” tier—no deposit layer. The magnitude and the scale don’t fall on the same line; what separates them is the tenor field: in two places it states dates, in one case it’s earn-and-withdraw on demand, and in one case there is no such layer.
This round lifts the long end, and the policy path only accounts for 2 basis points. By the time the October 2 meeting takes effect, if the 2-year rate is also lifted above 5% and the long-end move is matched, that would mean this round’s pricing was of the policy path—and that conclusion would be invalidated on the spot. But the short end stays in the 4.9% bucket, and the long end continues up; that’s what keeps the claim standing. The short-end line updates itself daily, while the unchanged figure remains fixed; Binance wealth-management accrues interest over each cycle. This article is a record of views and does not constitute investment advice.$NIGHT
$FIL
$XLM
#美国10年期美债收益率逼近5.3%

921
·
--
Bullish
Withdrawing a batch of verified nodes costs two payments: the revenue that is no longer earned during the downtime period, and the penalties incurred for taking the nodes offline early. On September 30, a self-custody wallet settled the bill—when troubleshooting infrastructure issues, it proactively withdrew the nodes it was running in this liquid staking protocol. The exits were scheduled to be completed by October 7, then the funds returned to a queue with a maximum wait time of 45 days.
The division of labor for the two keys is central: Ethereum splits the signing key used to produce blocks and the withdrawal credentials that indicate where the principal goes. This wallet holds only the former; the latter is not in its possession. What was altered is the former’s associated item—namely, the collection address for block rewards.
I checked the “quality” of that numeric string. A security researcher found that among the 19 nodes that received block rewards, 18 sent the money elsewhere, totaling about 0.36 ETH. He estimated that this round of exits involved about 17,000 nodes, 523,000 ETH; the two sets of numbers were not confirmed.
There’s another layer to the cost beyond the outgoing funds: within a few hours after the announcement, two vaults were drained from a lending market—about $76.0 million and $59.6 million—without any confirmed link to the nodes involved.
Binance spot readings for four names: Lido’s seven-day increase was 2.3%, about 187,000 BNB; Rocket Pool’s seven-day increase was 0.3%, about 43,000; Lista’s seven-day increase was 8.8%, about 930,000; platform token BNB’s seven-day decline was 1.1%, about 109. Separating this group is which bucket of funds is tapped first when the nodes stop—Lido first moves the rewards bucket, with the principal placed in the queue; Rocket Pool first moves the security deposit staked by the node itself; Lista pauses the share-increase bucket; BNB has no such layer.
This withdrawal swaps certain downtime for uncertain risk. If they dare to make this swap, it relies on the two keys being split between two places. After October 7, if the technical statement shows any forfeiture records, or if the withdrawal credentials are also modified, that would indicate the matter is not confined to the signing side; this version would not hold. The downtime applies only to the rewards bucket, and returns to the queue within 45 days—it stands. How long will these batches be queued? The on-chain group of numbers can report its own figures; BNB reduces supply quarterly, and the quoted price on Binance is updated daily. This article is for recording viewpoints and does not constitute investment advice.$MOVR
{future}(MOVRUSDT)
$MOB $MON
{future}(MONUSDT)
#metamask安全事件后撤出lido验证节点
Withdrawing a batch of verified nodes costs two payments: the revenue that is no longer earned during the downtime period, and the penalties incurred for taking the nodes offline early. On September 30, a self-custody wallet settled the bill—when troubleshooting infrastructure issues, it proactively withdrew the nodes it was running in this liquid staking protocol. The exits were scheduled to be completed by October 7, then the funds returned to a queue with a maximum wait time of 45 days.
The division of labor for the two keys is central: Ethereum splits the signing key used to produce blocks and the withdrawal credentials that indicate where the principal goes. This wallet holds only the former; the latter is not in its possession. What was altered is the former’s associated item—namely, the collection address for block rewards.
I checked the “quality” of that numeric string. A security researcher found that among the 19 nodes that received block rewards, 18 sent the money elsewhere, totaling about 0.36 ETH. He estimated that this round of exits involved about 17,000 nodes, 523,000 ETH; the two sets of numbers were not confirmed.
There’s another layer to the cost beyond the outgoing funds: within a few hours after the announcement, two vaults were drained from a lending market—about $76.0 million and $59.6 million—without any confirmed link to the nodes involved.
Binance spot readings for four names: Lido’s seven-day increase was 2.3%, about 187,000 BNB; Rocket Pool’s seven-day increase was 0.3%, about 43,000; Lista’s seven-day increase was 8.8%, about 930,000; platform token BNB’s seven-day decline was 1.1%, about 109. Separating this group is which bucket of funds is tapped first when the nodes stop—Lido first moves the rewards bucket, with the principal placed in the queue; Rocket Pool first moves the security deposit staked by the node itself; Lista pauses the share-increase bucket; BNB has no such layer.
This withdrawal swaps certain downtime for uncertain risk. If they dare to make this swap, it relies on the two keys being split between two places. After October 7, if the technical statement shows any forfeiture records, or if the withdrawal credentials are also modified, that would indicate the matter is not confined to the signing side; this version would not hold. The downtime applies only to the rewards bucket, and returns to the queue within 45 days—it stands. How long will these batches be queued? The on-chain group of numbers can report its own figures; BNB reduces supply quarterly, and the quoted price on Binance is updated daily. This article is for recording viewpoints and does not constitute investment advice.$MOVR
$MOB $MON
#metamask安全事件后撤出lido验证节点
The division of labor for the two keys is central: Ethereum splits the signing key used to produce blocks and the withdrawal credentials that indicate where the principal goes. This wallet holds only the former; the latter is not in its possession. What was altered is the former’s associated item—namely, the collection address for block rewards.
I checked the “quality” of that numeric string. A security researcher found that among the 19 nodes that received block rewards, 18 sent the money elsewhere, totaling about 0.36 ETH. He estimated that this round of exits involved about 17,000 nodes, 523,000 ETH; the two sets of numbers were not confirmed.
There’s another layer to the cost beyond the outgoing funds: within a few hours after the announcement, two vaults were drained from a lending market—about $76.0 million and $59.6 million—without any confirmed link to the nodes involved.
Binance spot readings for four names: Lido’s seven-day increase was 2.3%, about 187,000 BNB; Rocket Pool’s seven-day increase was 0.3%, about 43,000; Lista’s seven-day increase was 8.8%, about 930,000; platform token BNB’s seven-day decline was 1.1%, about 109. Separating this group is which bucket of funds is tapped first when the nodes stop—Lido first moves the rewards bucket, with the principal placed in the queue; Rocket Pool first moves the security deposit staked by the node itself; Lista pauses the share-increase bucket; BNB has no such layer.
This withdrawal swaps certain downtime for uncertain risk. If they dare to make this swap, it relies on the two keys being split between two places. After October 7, if the technical statement shows any forfeiture records, or if the withdrawal credentials are also modified, that would indicate the matter is not confined to the signing side; this version would not hold. The downtime applies only to the rewards bucket, and returns to the queue within 45 days—it stands. How long will these batches be queued? The on-chain group of numbers can report its own figures; BNB reduces supply quarterly, and the quoted price on Binance is updated daily. This article is for recording viewpoints and does not constitute investment advice.$MOVR
$MOB $MON
#metamask安全事件后撤出lido验证节点

1
20
22.9k
·
--
On September 28, the review across the pond at the White House concerned two documents: one incorporates the event contract into the definition of a swap, proceeding via public comment; the other removes casino-style products from that same definition, taking effect immediately upon approval. Both were marked as having no material economic impact, and the text was not disclosed.
The court’s conclusion runs the other way. On September 25, a federal appellate court ruled that sports-related contracts are not swaps, so the two states may regulate them under their own gambling laws; a month earlier another appellate court sided with the opposite state, and six months ago yet another took the contrary view. The Supreme Court has three petitions before it, with response deadlines falling on October 14 and 15 and on November 9. This regulator has at least sued nine states in court.
I’m checking which one carries more weight. The sentence put in is an announcement—it had already lost in court previously; the sentence taken out is the measuring stick—it determines which things stay outside the line, but since the text was not disclosed, nobody knows what is on the list.
Readouts of four names on Binance spot: Gnosis at $120.23, 7-day change 5.00%, market size about $308 million; Uma at $0.4124, 7-day 0.83%, about $35 million; Tellor at $20.62, 7-day 1.43%, about $55 million; the platform token BNB at $768.4, 7-day -1.07%, about $102.2 billion. All three names are placed on the result side, with their positions split into two routes: one determines how the revenue is divided after the outcome, while the other two determine who has control over the outcome. The one with the clearest lift over seven days is the largest by volume; the other two together are less than one-third of it—and the line to be drawn is precisely for these latter two.
The two documents carry different weight in different places: the sentence put in is an announcement, and the sentence removed is the measuring stick. Once the text is released, if you exclude the list that explicitly names sports, the appellate court’s interpretation is not supported by this version—the list only makes abstract statements without pointing to any category; it stands on its own. To watch this line, it’s enough to wait for the day that list is made public. Those three names can all be traded on Binance, and on the order book you can see the prices and depth. This article is for record of viewpoints and does not constitute investment advice.$MOVR
{future}(MOVRUSDT)
$MOVE
{future}(MOVEUSDT)
$MOB #cftc向白宫提交两项事件合约规则提案
On September 28, the review across the pond at the White House concerned two documents: one incorporates the event contract into the definition of a swap, proceeding via public comment; the other removes casino-style products from that same definition, taking effect immediately upon approval. Both were marked as having no material economic impact, and the text was not disclosed.
The court’s conclusion runs the other way. On September 25, a federal appellate court ruled that sports-related contracts are not swaps, so the two states may regulate them under their own gambling laws; a month earlier another appellate court sided with the opposite state, and six months ago yet another took the contrary view. The Supreme Court has three petitions before it, with response deadlines falling on October 14 and 15 and on November 9. This regulator has at least sued nine states in court.
I’m checking which one carries more weight. The sentence put in is an announcement—it had already lost in court previously; the sentence taken out is the measuring stick—it determines which things stay outside the line, but since the text was not disclosed, nobody knows what is on the list.
Readouts of four names on Binance spot: Gnosis at $120.23, 7-day change 5.00%, market size about $308 million; Uma at $0.4124, 7-day 0.83%, about $35 million; Tellor at $20.62, 7-day 1.43%, about $55 million; the platform token BNB at $768.4, 7-day -1.07%, about $102.2 billion. All three names are placed on the result side, with their positions split into two routes: one determines how the revenue is divided after the outcome, while the other two determine who has control over the outcome. The one with the clearest lift over seven days is the largest by volume; the other two together are less than one-third of it—and the line to be drawn is precisely for these latter two.
The two documents carry different weight in different places: the sentence put in is an announcement, and the sentence removed is the measuring stick. Once the text is released, if you exclude the list that explicitly names sports, the appellate court’s interpretation is not supported by this version—the list only makes abstract statements without pointing to any category; it stands on its own. To watch this line, it’s enough to wait for the day that list is made public. Those three names can all be traded on Binance, and on the order book you can see the prices and depth. This article is for record of viewpoints and does not constitute investment advice.$MOVR
$MOVE
$MOB #cftc向白宫提交两项事件合约规则提案
The court’s conclusion runs the other way. On September 25, a federal appellate court ruled that sports-related contracts are not swaps, so the two states may regulate them under their own gambling laws; a month earlier another appellate court sided with the opposite state, and six months ago yet another took the contrary view. The Supreme Court has three petitions before it, with response deadlines falling on October 14 and 15 and on November 9. This regulator has at least sued nine states in court.
I’m checking which one carries more weight. The sentence put in is an announcement—it had already lost in court previously; the sentence taken out is the measuring stick—it determines which things stay outside the line, but since the text was not disclosed, nobody knows what is on the list.
Readouts of four names on Binance spot: Gnosis at $120.23, 7-day change 5.00%, market size about $308 million; Uma at $0.4124, 7-day 0.83%, about $35 million; Tellor at $20.62, 7-day 1.43%, about $55 million; the platform token BNB at $768.4, 7-day -1.07%, about $102.2 billion. All three names are placed on the result side, with their positions split into two routes: one determines how the revenue is divided after the outcome, while the other two determine who has control over the outcome. The one with the clearest lift over seven days is the largest by volume; the other two together are less than one-third of it—and the line to be drawn is precisely for these latter two.
The two documents carry different weight in different places: the sentence put in is an announcement, and the sentence removed is the measuring stick. Once the text is released, if you exclude the list that explicitly names sports, the appellate court’s interpretation is not supported by this version—the list only makes abstract statements without pointing to any category; it stands on its own. To watch this line, it’s enough to wait for the day that list is made public. Those three names can all be traded on Binance, and on the order book you can see the prices and depth. This article is for record of viewpoints and does not constitute investment advice.$MOVR
$MOVE
$MOB #cftc向白宫提交两项事件合约规则提案
3
3.7k
·
--
Bullish
This index counts a number of things. It takes the top 50 by market cap names, removes stablecoins, and counts how many of them beat Bitcoin within a 90-day window. Beating by half a point or beating by forty points both count as one vote. Below 25 is considered the Bitcoin season; above 75 is considered the altcoin season. In the middle is a long stretch of “gray.”
On September 25 it rose to 60, and then stayed above 60 for five consecutive days without falling back below 60. On September 29 the reading was 61; a week earlier it was only 50. Over the same period, Bitcoin’s share in the “basket” fell from 59.7% at the start of the month to 58.6%, with the seven-day reading on the -0.7% side. The on-chain definition is broader: as of September 22, among the tracked altcoins, 72.5% beat Bitcoin over the past seven days.
The four names’ readings on Binance spot: Chainlink reported $14.37, up 16.35% over seven days, with market cap of about $10.7 billion; Solana reported $118.26, up 2.83% over seven days, with about $69.4 billion; Cardano reported $0.2464, up 3.33% over seven days; and BNB (platform token) reported $767.8, roughly flat over seven days, with about $102.2 billion. The one that surged the most over seven days had a market cap only one-tenth that of BNB. Each of these four names gets one vote in this index; the ballots carry no weight.
I’m checking what this vote is counting. The scoring method only asks whether it beat Bitcoin during the 90-day period, not by how much, and it doesn’t apply market-cap weighting. Under an institutional-facing definition, the top ten altcoins by market cap account for nearly 80% of this category’s market value, and at the end of 2024 it was around 70%. The derivatives side hasn’t caught up: the total open interest in altcoin perpetual contracts has barely grown over the past month, and it’s not the same as what happened before the two sharp rallies.
The number 61 is repeatedly cited; what it carries is how breadth is scored—it doesn’t read magnitude, and it doesn’t weight by market cap. By the end of October, if Bitcoin’s share returns to 59% or above and this number falls back to the 50 range, it would indicate that those five days were only a one-off replenishment purchase, and this way of reading wouldn’t hold. If the share continues to slip down and the number of names that beat Bitcoin stays at 30 or more, then it stands.
To replace “breadth” with something that can be cross-checked, first look up these names’ quoted prices. The component that wants it to rest for a while is listed on Binance’s wealth-management page, showing the interest-bearing methods and terms. This article is for recording viewpoints and does not constitute investment advice.#山寨季指数连续五日守稳60上方
This index counts a number of things. It takes the top 50 by market cap names, removes stablecoins, and counts how many of them beat Bitcoin within a 90-day window. Beating by half a point or beating by forty points both count as one vote. Below 25 is considered the Bitcoin season; above 75 is considered the altcoin season. In the middle is a long stretch of “gray.”
On September 25 it rose to 60, and then stayed above 60 for five consecutive days without falling back below 60. On September 29 the reading was 61; a week earlier it was only 50. Over the same period, Bitcoin’s share in the “basket” fell from 59.7% at the start of the month to 58.6%, with the seven-day reading on the -0.7% side. The on-chain definition is broader: as of September 22, among the tracked altcoins, 72.5% beat Bitcoin over the past seven days.
The four names’ readings on Binance spot: Chainlink reported $14.37, up 16.35% over seven days, with market cap of about $10.7 billion; Solana reported $118.26, up 2.83% over seven days, with about $69.4 billion; Cardano reported $0.2464, up 3.33% over seven days; and BNB (platform token) reported $767.8, roughly flat over seven days, with about $102.2 billion. The one that surged the most over seven days had a market cap only one-tenth that of BNB. Each of these four names gets one vote in this index; the ballots carry no weight.
I’m checking what this vote is counting. The scoring method only asks whether it beat Bitcoin during the 90-day period, not by how much, and it doesn’t apply market-cap weighting. Under an institutional-facing definition, the top ten altcoins by market cap account for nearly 80% of this category’s market value, and at the end of 2024 it was around 70%. The derivatives side hasn’t caught up: the total open interest in altcoin perpetual contracts has barely grown over the past month, and it’s not the same as what happened before the two sharp rallies.
The number 61 is repeatedly cited; what it carries is how breadth is scored—it doesn’t read magnitude, and it doesn’t weight by market cap. By the end of October, if Bitcoin’s share returns to 59% or above and this number falls back to the 50 range, it would indicate that those five days were only a one-off replenishment purchase, and this way of reading wouldn’t hold. If the share continues to slip down and the number of names that beat Bitcoin stays at 30 or more, then it stands.
To replace “breadth” with something that can be cross-checked, first look up these names’ quoted prices. The component that wants it to rest for a while is listed on Binance’s wealth-management page, showing the interest-bearing methods and terms. This article is for recording viewpoints and does not constitute investment advice.#山寨季指数连续五日守稳60上方
On September 25 it rose to 60, and then stayed above 60 for five consecutive days without falling back below 60. On September 29 the reading was 61; a week earlier it was only 50. Over the same period, Bitcoin’s share in the “basket” fell from 59.7% at the start of the month to 58.6%, with the seven-day reading on the -0.7% side. The on-chain definition is broader: as of September 22, among the tracked altcoins, 72.5% beat Bitcoin over the past seven days.
The four names’ readings on Binance spot: Chainlink reported $14.37, up 16.35% over seven days, with market cap of about $10.7 billion; Solana reported $118.26, up 2.83% over seven days, with about $69.4 billion; Cardano reported $0.2464, up 3.33% over seven days; and BNB (platform token) reported $767.8, roughly flat over seven days, with about $102.2 billion. The one that surged the most over seven days had a market cap only one-tenth that of BNB. Each of these four names gets one vote in this index; the ballots carry no weight.
I’m checking what this vote is counting. The scoring method only asks whether it beat Bitcoin during the 90-day period, not by how much, and it doesn’t apply market-cap weighting. Under an institutional-facing definition, the top ten altcoins by market cap account for nearly 80% of this category’s market value, and at the end of 2024 it was around 70%. The derivatives side hasn’t caught up: the total open interest in altcoin perpetual contracts has barely grown over the past month, and it’s not the same as what happened before the two sharp rallies.
The number 61 is repeatedly cited; what it carries is how breadth is scored—it doesn’t read magnitude, and it doesn’t weight by market cap. By the end of October, if Bitcoin’s share returns to 59% or above and this number falls back to the 50 range, it would indicate that those five days were only a one-off replenishment purchase, and this way of reading wouldn’t hold. If the share continues to slip down and the number of names that beat Bitcoin stays at 30 or more, then it stands.
To replace “breadth” with something that can be cross-checked, first look up these names’ quoted prices. The component that wants it to rest for a while is listed on Binance’s wealth-management page, showing the interest-bearing methods and terms. This article is for recording viewpoints and does not constitute investment advice.#山寨季指数连续五日守稳60上方
1
699
·
--
On September 24, seven UK banks completed three real customer transactions, and on the same day the U.S. clearinghouse jointly owned by 25 banks also added it to its network; the on-chain numbers only caught up two days later: new addresses rose from 351 to 7,516, and active addresses rose to 14,458. The quoted price went even further: after jumping to $373 on September 28, it fell back to $281—about 287% over seven days.
Four names’ quotes on Binance spot: Quant was up 23.8% in the last 24 hours and 287.3% over seven days, with a volume of about $3.4 billion; Chainlink was down 7.1% and up 10.0% (about $10.1 billion); Hedera was down 13.1% and up 7.0% (about $4.4 billion); the platform token BNB was down 0.2% and up 3.3% (about $95.5 billion). The volume and the magnitude don’t line up on the same line—what separates this group is what that institutional section says: only Quant has one item marked with an already-completed real transaction and an “open day” scheduled for the first half of 2027; the other three items are, respectively, two different days, a protocol handed over, and a quarterly recovery.
The “old address” section is moving too: two addresses that had been dormant for more than three years have come back to life—one sent 8,250 coins (about $1.88 million) into Binance, and the other transferred out 34,200 coins (about $8.05 million). Another section makes the point even clearer: within the same four days, contract size in USD rose by nearly 800%, but in token units it rose only by about 120%.
I’m checking why these two sections are out of sync: the USD section tracks the quoted price, while the token section is the amount being committed. Three days after the announcement, the new address appeared; and the party reporting the readings said there was no new information over those two days. Neither of the two lines for the banks mentions token usage.
The two bank lines state what was entered in the announcement; what landed on-chain is how much the old addresses actually sent out—and the difference from those two sections. If later the two sections converge, then in token terms the token section would catch up to the USD section, and old addresses would stop sending out—showing that this time the action was about the amount that was committed, rendering this way of reading invalid. If the two sections continue to stay apart, it means it’s still standing. To see who’s moving, first look up those two transactions from the old addresses. The balances for those who don’t need them right away can be held according to the cycle; for those who want to act, Quant’s buys and sells on Binance can be checked. This article is a record of viewpoints and does not constitute investment advice. $#qnt一周涨287%
On September 24, seven UK banks completed three real customer transactions, and on the same day the U.S. clearinghouse jointly owned by 25 banks also added it to its network; the on-chain numbers only caught up two days later: new addresses rose from 351 to 7,516, and active addresses rose to 14,458. The quoted price went even further: after jumping to $373 on September 28, it fell back to $281—about 287% over seven days.
Four names’ quotes on Binance spot: Quant was up 23.8% in the last 24 hours and 287.3% over seven days, with a volume of about $3.4 billion; Chainlink was down 7.1% and up 10.0% (about $10.1 billion); Hedera was down 13.1% and up 7.0% (about $4.4 billion); the platform token BNB was down 0.2% and up 3.3% (about $95.5 billion). The volume and the magnitude don’t line up on the same line—what separates this group is what that institutional section says: only Quant has one item marked with an already-completed real transaction and an “open day” scheduled for the first half of 2027; the other three items are, respectively, two different days, a protocol handed over, and a quarterly recovery.
The “old address” section is moving too: two addresses that had been dormant for more than three years have come back to life—one sent 8,250 coins (about $1.88 million) into Binance, and the other transferred out 34,200 coins (about $8.05 million). Another section makes the point even clearer: within the same four days, contract size in USD rose by nearly 800%, but in token units it rose only by about 120%.
I’m checking why these two sections are out of sync: the USD section tracks the quoted price, while the token section is the amount being committed. Three days after the announcement, the new address appeared; and the party reporting the readings said there was no new information over those two days. Neither of the two lines for the banks mentions token usage.
The two bank lines state what was entered in the announcement; what landed on-chain is how much the old addresses actually sent out—and the difference from those two sections. If later the two sections converge, then in token terms the token section would catch up to the USD section, and old addresses would stop sending out—showing that this time the action was about the amount that was committed, rendering this way of reading invalid. If the two sections continue to stay apart, it means it’s still standing. To see who’s moving, first look up those two transactions from the old addresses. The balances for those who don’t need them right away can be held according to the cycle; for those who want to act, Quant’s buys and sells on Binance can be checked. This article is a record of viewpoints and does not constitute investment advice. $#qnt一周涨287%
Four names’ quotes on Binance spot: Quant was up 23.8% in the last 24 hours and 287.3% over seven days, with a volume of about $3.4 billion; Chainlink was down 7.1% and up 10.0% (about $10.1 billion); Hedera was down 13.1% and up 7.0% (about $4.4 billion); the platform token BNB was down 0.2% and up 3.3% (about $95.5 billion). The volume and the magnitude don’t line up on the same line—what separates this group is what that institutional section says: only Quant has one item marked with an already-completed real transaction and an “open day” scheduled for the first half of 2027; the other three items are, respectively, two different days, a protocol handed over, and a quarterly recovery.
The “old address” section is moving too: two addresses that had been dormant for more than three years have come back to life—one sent 8,250 coins (about $1.88 million) into Binance, and the other transferred out 34,200 coins (about $8.05 million). Another section makes the point even clearer: within the same four days, contract size in USD rose by nearly 800%, but in token units it rose only by about 120%.
I’m checking why these two sections are out of sync: the USD section tracks the quoted price, while the token section is the amount being committed. Three days after the announcement, the new address appeared; and the party reporting the readings said there was no new information over those two days. Neither of the two lines for the banks mentions token usage.
The two bank lines state what was entered in the announcement; what landed on-chain is how much the old addresses actually sent out—and the difference from those two sections. If later the two sections converge, then in token terms the token section would catch up to the USD section, and old addresses would stop sending out—showing that this time the action was about the amount that was committed, rendering this way of reading invalid. If the two sections continue to stay apart, it means it’s still standing. To see who’s moving, first look up those two transactions from the old addresses. The balances for those who don’t need them right away can be held according to the cycle; for those who want to act, Quant’s buys and sells on Binance can be checked. This article is a record of viewpoints and does not constitute investment advice. $#qnt一周涨287%
3
9.2k
·
--
🚨 🚨 🚨 🚨 🚨 492,721 $QNT(139,624,813 USD)transferred from an unknown wallet to an unknown wallet
#qnt一周涨287%
🚨 🚨 🚨 🚨 🚨 492,721 $QNT(139,624,813 USD)transferred from an unknown wallet to an unknown wallet
#qnt一周涨287%
#qnt一周涨287%
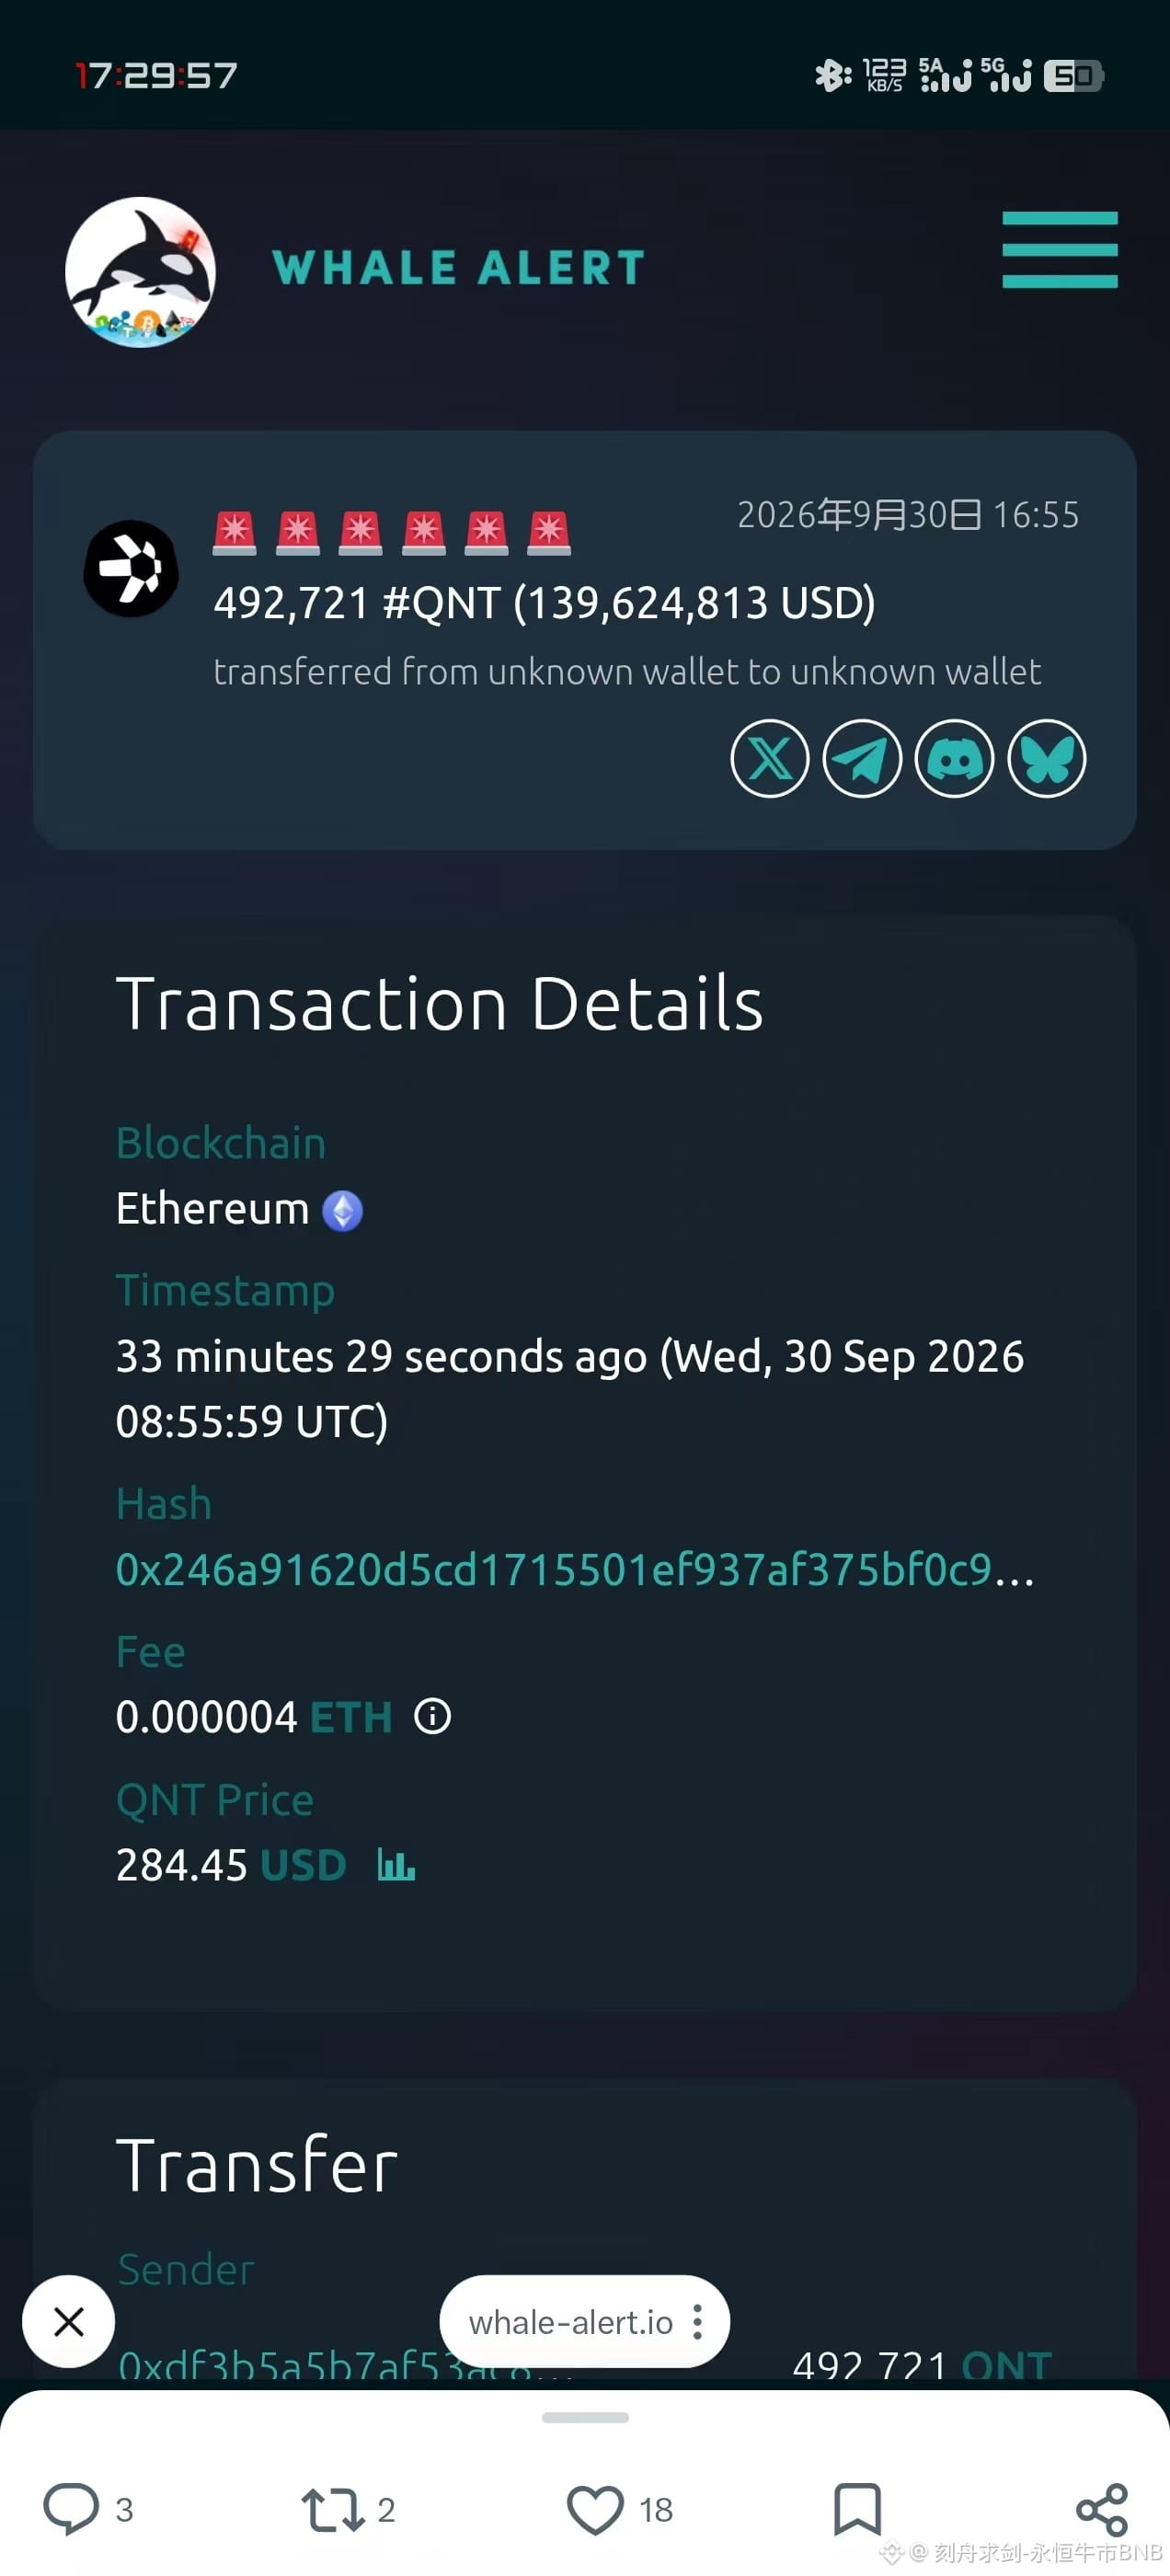
1
366
·
--
Verified
In this monthly survey tracking job vacancies, August vacancies fell by 2.56 million to 7.079 million; even more pronounced was the group with 1 to 9 employees, down by 3.35 million. The amount by which the total fell is even smaller than the amount that fell in this group; the rest combined are net higher. Expected: 7.228 million.
On the interest-rate side, Binance spot shows several yield-chasing names reading differently: Aave was up 11.46% today and 12.55% over seven days, with a size of about $2.4 billion. Lido had moves of 6.24% and 8.25% in two places, with about $370 million. Ethena was down 2.14% today and up 15.95% over seven days, with about $2.27 billion. Platform token BNB saw declines of 0.60% and 3.70% in two places, with a size of $95.5 billion. What separates them is where the revenue is attached along the yield spectrum: one earns from borrowing interest, one takes a cut of staking rewards, one relies on reserves generating yield and funding fees—only BNB places its economics on both its size and quarterly buybacks.
On the hiring side, things are split differently. Total hiring rose by 46,000 to 5.192 million, and almost all the increase came from the government sector: there it was up by 47,000, while the private side was down by 1,000. In the same period, layoffs fell to 1.641 million, the lowest since March 2025, with a layoff rate of 1.0%; the quit rate of 1.9% was unchanged.
I measured with two more rulers. The ratio of vacancies to unemployment landed at 1.00; the 2022 peak was 2.04. The other measure is the vacancy production rate: in August about 0.71, which in 2022 had dipped as low as 0.5.
The steps on the policy-maker side aren’t moving to the same beat. Earlier this month, interest rates were raised once, and one reason was a hoped-for improvement in hiring intentions; this survey is about the distance between intention and action. The next employment report is scheduled for October 2, with expectations of 95,000 additional jobs.
The line of 7.079 million is set in the headline. In future reports, the pattern will be written by two things: vacancies shrinking in small businesses and the increase in hiring showing up on the government side. In the October 2 report, if small-business vacancies rebound and private hiring rises along with them, it would mean this group only put on a month-long show, and the conclusion wouldn’t hold. The job market still stands, propped up by government and healthcare.
To verify whether small businesses in that group are turning around, it’s enough to flip through this survey. On Binance’s market screen, BNB’s supply and quotes update every day. This article records views and does not constitute investment advice. $HARD $NMR $XLM #美国8月职位空缺降至五个月低点
In this monthly survey tracking job vacancies, August vacancies fell by 2.56 million to 7.079 million; even more pronounced was the group with 1 to 9 employees, down by 3.35 million. The amount by which the total fell is even smaller than the amount that fell in this group; the rest combined are net higher. Expected: 7.228 million.
On the interest-rate side, Binance spot shows several yield-chasing names reading differently: Aave was up 11.46% today and 12.55% over seven days, with a size of about $2.4 billion. Lido had moves of 6.24% and 8.25% in two places, with about $370 million. Ethena was down 2.14% today and up 15.95% over seven days, with about $2.27 billion. Platform token BNB saw declines of 0.60% and 3.70% in two places, with a size of $95.5 billion. What separates them is where the revenue is attached along the yield spectrum: one earns from borrowing interest, one takes a cut of staking rewards, one relies on reserves generating yield and funding fees—only BNB places its economics on both its size and quarterly buybacks.
On the hiring side, things are split differently. Total hiring rose by 46,000 to 5.192 million, and almost all the increase came from the government sector: there it was up by 47,000, while the private side was down by 1,000. In the same period, layoffs fell to 1.641 million, the lowest since March 2025, with a layoff rate of 1.0%; the quit rate of 1.9% was unchanged.
I measured with two more rulers. The ratio of vacancies to unemployment landed at 1.00; the 2022 peak was 2.04. The other measure is the vacancy production rate: in August about 0.71, which in 2022 had dipped as low as 0.5.
The steps on the policy-maker side aren’t moving to the same beat. Earlier this month, interest rates were raised once, and one reason was a hoped-for improvement in hiring intentions; this survey is about the distance between intention and action. The next employment report is scheduled for October 2, with expectations of 95,000 additional jobs.
The line of 7.079 million is set in the headline. In future reports, the pattern will be written by two things: vacancies shrinking in small businesses and the increase in hiring showing up on the government side. In the October 2 report, if small-business vacancies rebound and private hiring rises along with them, it would mean this group only put on a month-long show, and the conclusion wouldn’t hold. The job market still stands, propped up by government and healthcare.
To verify whether small businesses in that group are turning around, it’s enough to flip through this survey. On Binance’s market screen, BNB’s supply and quotes update every day. This article records views and does not constitute investment advice. $HARD $NMR $XLM #美国8月职位空缺降至五个月低点
On the interest-rate side, Binance spot shows several yield-chasing names reading differently: Aave was up 11.46% today and 12.55% over seven days, with a size of about $2.4 billion. Lido had moves of 6.24% and 8.25% in two places, with about $370 million. Ethena was down 2.14% today and up 15.95% over seven days, with about $2.27 billion. Platform token BNB saw declines of 0.60% and 3.70% in two places, with a size of $95.5 billion. What separates them is where the revenue is attached along the yield spectrum: one earns from borrowing interest, one takes a cut of staking rewards, one relies on reserves generating yield and funding fees—only BNB places its economics on both its size and quarterly buybacks.
On the hiring side, things are split differently. Total hiring rose by 46,000 to 5.192 million, and almost all the increase came from the government sector: there it was up by 47,000, while the private side was down by 1,000. In the same period, layoffs fell to 1.641 million, the lowest since March 2025, with a layoff rate of 1.0%; the quit rate of 1.9% was unchanged.
I measured with two more rulers. The ratio of vacancies to unemployment landed at 1.00; the 2022 peak was 2.04. The other measure is the vacancy production rate: in August about 0.71, which in 2022 had dipped as low as 0.5.
The steps on the policy-maker side aren’t moving to the same beat. Earlier this month, interest rates were raised once, and one reason was a hoped-for improvement in hiring intentions; this survey is about the distance between intention and action. The next employment report is scheduled for October 2, with expectations of 95,000 additional jobs.
The line of 7.079 million is set in the headline. In future reports, the pattern will be written by two things: vacancies shrinking in small businesses and the increase in hiring showing up on the government side. In the October 2 report, if small-business vacancies rebound and private hiring rises along with them, it would mean this group only put on a month-long show, and the conclusion wouldn’t hold. The job market still stands, propped up by government and healthcare.
To verify whether small businesses in that group are turning around, it’s enough to flip through this survey. On Binance’s market screen, BNB’s supply and quotes update every day. This article records views and does not constitute investment advice. $HARD $NMR $XLM #美国8月职位空缺降至五个月低点

25
8.4k
·
--
Bullish
Verified
In the document submitted on September 28, one listed company that treats Bitcoin as treasury assets recorded its next week’s moves: from September 21 to 27, it received 1,665 BTC, spending $142.7 million, at an average price of $85,681. Its total treasury holdings were raised to 847,666 BTC, crossing the 21 million cap by 4%. This is the second consecutive week it sold; at the end of August into early September, it paused for two or three weeks.
This money has another source—it came from the stock market’s freshly issued funds. In the same week, it issued 1,469,165 shares of common stock, netting $246.2 million: $142.7 million went into the treasury, while $103.5 million was used to buy back its own preferred shares. The “treasury” line is long. That “water pipe” feeding it isn’t only for that company—the account also still holds $5.02 billion in dollar reserves, used to pay preferred-share dividends and interest on debt.
I tried to see which measuring stick this fits. Based on the current per-block reward, the whole network creates roughly 450 new BTC per day; 1,665 BTC is a little over three days’ worth. The prior week it bought 950 BTC at an average of $79,670, meaning that between weeks it paid about $6,000 more per coin.
On Binance spot, four token names show different readings: Bitcoin (BTC) is up about 0.7% today and down about 2.5% over seven days, with a market value around $1.69 trillion. Filecoin is about up 0.5% and down 2.4%, around $890 million; one BTC is roughly equivalent to 7.87 million FIL. Bittensor is about up 1.5% and down 0.7%, around $2.99 billion, or roughly 269 BTC. Near is down 1.4% today and down 7.4% over seven days, around $6.21 billion. Market size grows from $890 million to $1.69 trillion; this lets you place the “how many are minted per day” measuring stick. Only in Bitcoin’s column is there a treasury that is buying week by week; next to the other three columns stand their respective token issuance schedules.
Put more plainly: what’s being repeatedly checked is the series of the treasury total—what’s bearing the load is the very water pipe feeding it. Of the $246.2 million net proceeds, only $142.7 million went into the treasury. In the next document, if the proportion of net proceeds going into the treasury continues to rise and the buyback line shrinks back, it would mean the allocation responsibilities of that pipe have changed—I’d be underestimating the “fuel” line. If the buyback line keeps swallowing most of the net proceeds, then this reading stands. Both the amount going into the treasury and the money used to buy it leave their sources on both sides. For Bitcoin’s buying and selling, Binance’s spot order book has been open all day. This article is a record of viewpoints and does not constitute investment advice. $$NMR $XLM $NVDAB #strategy增持1666枚btc持仓达847666枚
In the document submitted on September 28, one listed company that treats Bitcoin as treasury assets recorded its next week’s moves: from September 21 to 27, it received 1,665 BTC, spending $142.7 million, at an average price of $85,681. Its total treasury holdings were raised to 847,666 BTC, crossing the 21 million cap by 4%. This is the second consecutive week it sold; at the end of August into early September, it paused for two or three weeks.
This money has another source—it came from the stock market’s freshly issued funds. In the same week, it issued 1,469,165 shares of common stock, netting $246.2 million: $142.7 million went into the treasury, while $103.5 million was used to buy back its own preferred shares. The “treasury” line is long. That “water pipe” feeding it isn’t only for that company—the account also still holds $5.02 billion in dollar reserves, used to pay preferred-share dividends and interest on debt.
I tried to see which measuring stick this fits. Based on the current per-block reward, the whole network creates roughly 450 new BTC per day; 1,665 BTC is a little over three days’ worth. The prior week it bought 950 BTC at an average of $79,670, meaning that between weeks it paid about $6,000 more per coin.
On Binance spot, four token names show different readings: Bitcoin (BTC) is up about 0.7% today and down about 2.5% over seven days, with a market value around $1.69 trillion. Filecoin is about up 0.5% and down 2.4%, around $890 million; one BTC is roughly equivalent to 7.87 million FIL. Bittensor is about up 1.5% and down 0.7%, around $2.99 billion, or roughly 269 BTC. Near is down 1.4% today and down 7.4% over seven days, around $6.21 billion. Market size grows from $890 million to $1.69 trillion; this lets you place the “how many are minted per day” measuring stick. Only in Bitcoin’s column is there a treasury that is buying week by week; next to the other three columns stand their respective token issuance schedules.
Put more plainly: what’s being repeatedly checked is the series of the treasury total—what’s bearing the load is the very water pipe feeding it. Of the $246.2 million net proceeds, only $142.7 million went into the treasury. In the next document, if the proportion of net proceeds going into the treasury continues to rise and the buyback line shrinks back, it would mean the allocation responsibilities of that pipe have changed—I’d be underestimating the “fuel” line. If the buyback line keeps swallowing most of the net proceeds, then this reading stands. Both the amount going into the treasury and the money used to buy it leave their sources on both sides. For Bitcoin’s buying and selling, Binance’s spot order book has been open all day. This article is a record of viewpoints and does not constitute investment advice. $$NMR $XLM $NVDAB #strategy增持1666枚btc持仓达847666枚
This money has another source—it came from the stock market’s freshly issued funds. In the same week, it issued 1,469,165 shares of common stock, netting $246.2 million: $142.7 million went into the treasury, while $103.5 million was used to buy back its own preferred shares. The “treasury” line is long. That “water pipe” feeding it isn’t only for that company—the account also still holds $5.02 billion in dollar reserves, used to pay preferred-share dividends and interest on debt.
I tried to see which measuring stick this fits. Based on the current per-block reward, the whole network creates roughly 450 new BTC per day; 1,665 BTC is a little over three days’ worth. The prior week it bought 950 BTC at an average of $79,670, meaning that between weeks it paid about $6,000 more per coin.
On Binance spot, four token names show different readings: Bitcoin (BTC) is up about 0.7% today and down about 2.5% over seven days, with a market value around $1.69 trillion. Filecoin is about up 0.5% and down 2.4%, around $890 million; one BTC is roughly equivalent to 7.87 million FIL. Bittensor is about up 1.5% and down 0.7%, around $2.99 billion, or roughly 269 BTC. Near is down 1.4% today and down 7.4% over seven days, around $6.21 billion. Market size grows from $890 million to $1.69 trillion; this lets you place the “how many are minted per day” measuring stick. Only in Bitcoin’s column is there a treasury that is buying week by week; next to the other three columns stand their respective token issuance schedules.
Put more plainly: what’s being repeatedly checked is the series of the treasury total—what’s bearing the load is the very water pipe feeding it. Of the $246.2 million net proceeds, only $142.7 million went into the treasury. In the next document, if the proportion of net proceeds going into the treasury continues to rise and the buyback line shrinks back, it would mean the allocation responsibilities of that pipe have changed—I’d be underestimating the “fuel” line. If the buyback line keeps swallowing most of the net proceeds, then this reading stands. Both the amount going into the treasury and the money used to buy it leave their sources on both sides. For Bitcoin’s buying and selling, Binance’s spot order book has been open all day. This article is a record of viewpoints and does not constitute investment advice. $$NMR $XLM $NVDAB #strategy增持1666枚btc持仓达847666枚
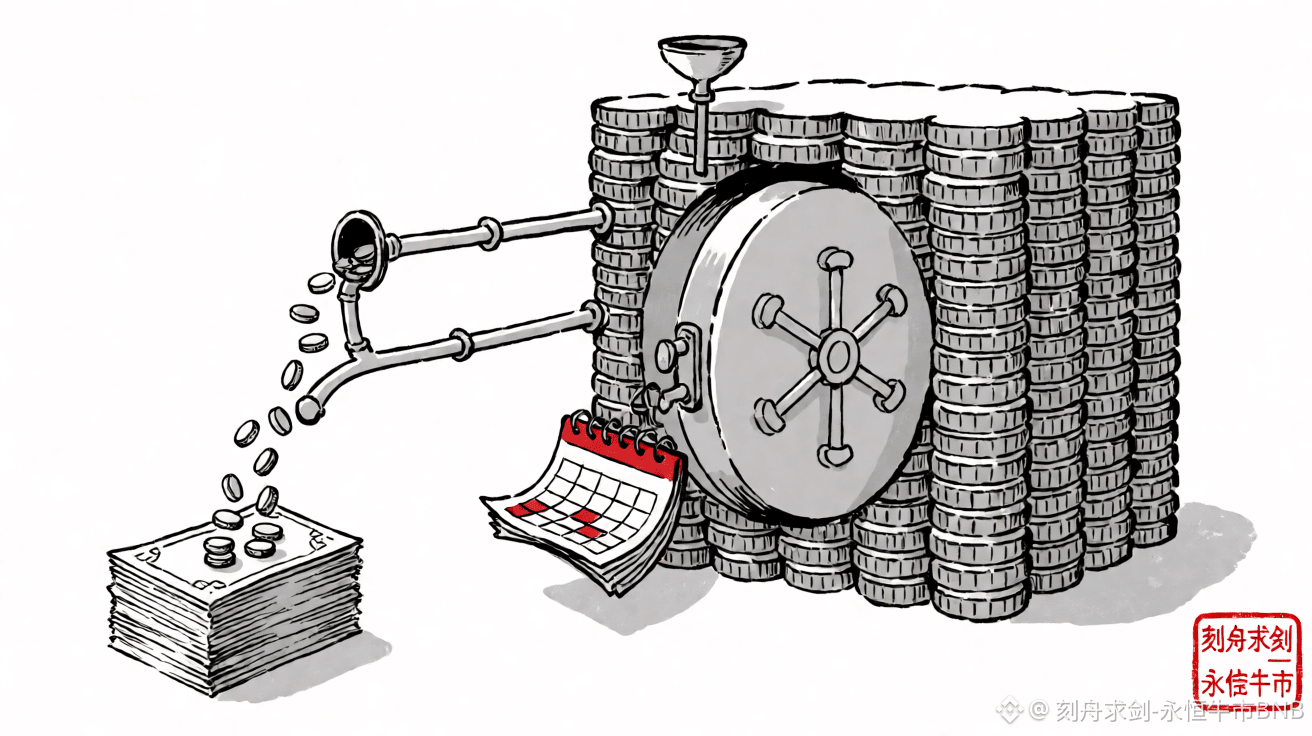
1
3
17.6k
·
--
Verified
The line on the offering memorandum’s cover states the valuation—sitting in the US$2 trillion bracket. The line under “backing/guarantees,” in the risk section, reads a cloud computing and infrastructure commitment of US$51.8 billion, minus cash on hand of US$20.28 billion; the resulting gap far exceeds the publicly raised amount (US$6–10 billion). The cover page talks about ranking, while the risk section talks about capacity. The two columns come from different sources: rankings are counted by rank, while capacity is calculated on an annualized basis.
That line falls more plainly on the order book of Binance spot—Bittensor’s 7-day drop of 5.4%, US$332 million; Filecoin’s 7-day drop of 1.6%, US$82 million; Render’s 7-day rise of 1.2%, US$97 million; and the platform token BNB’s 7-day drop of 4.2%, US$100.7 billion. In the cover page, the first line is about scale and volume; the offering memorandum’s cover line is about valuation; the “backing/guarantees” column behind it has everything pushed down.
Flip the prospectus to the second line: 2025 revenue is about US$4.6 billion, compared with less than US$400 million the prior year—a huge gap. Operating loss is US$8.06 billion, compared with US$2.98 billion the year before. The two lines appear in the same table, but they each go their own way.
I checked the difference between two amounts: in 2025, compute power and infrastructure spending is US$7.33 billion, versus about US$2.4 billion the prior year—more than half of operating expenses of US$12.65 billion. Cash and short-term investments are US$2.028 billion; at this pace, it could cover nearly three years. Nearly one quarter of revenue comes from two customers, and most major customers have not signed long-term contracts.
There’s also an ordering layer: seven co-founders preserve voting control of 50.1% via a newly established entity, while the “public” column is pushed very low. The funds raised on the listing side are pinned by multiple media reports to the US$6–10 billion bracket, which, when compared with the US$518 billion commitment, leaves only a fraction.
To make the stance clear: the line that is repeatedly cited is the cover page line—valuation and scale/volume. The “backing/guarantees” line is the risk section and the second line’s factual column—the capacity gap and the loss gap. In the upcoming annual reports: if the commitment is neither delayed nor restructured, the gap will be annualized and amortized monthly in the annual report only. If the commitment is delayed, split up, or handed off, then the cover page line will have to be recalculated. How much capacity is ultimately amortized in that line. The portion kept in current accounts also has a bracket of arrangements that can be withdrawn at any time; the quotes in this bracket on Binance are updated daily. $ALLO
{future}(ALLOUSDT)
$NIL
{future}(NILUSDT)
$KITE
{future}(KITEUSDT)
#anthropic招股书或估值超2万亿美元
The line on the offering memorandum’s cover states the valuation—sitting in the US$2 trillion bracket. The line under “backing/guarantees,” in the risk section, reads a cloud computing and infrastructure commitment of US$51.8 billion, minus cash on hand of US$20.28 billion; the resulting gap far exceeds the publicly raised amount (US$6–10 billion). The cover page talks about ranking, while the risk section talks about capacity. The two columns come from different sources: rankings are counted by rank, while capacity is calculated on an annualized basis.
That line falls more plainly on the order book of Binance spot—Bittensor’s 7-day drop of 5.4%, US$332 million; Filecoin’s 7-day drop of 1.6%, US$82 million; Render’s 7-day rise of 1.2%, US$97 million; and the platform token BNB’s 7-day drop of 4.2%, US$100.7 billion. In the cover page, the first line is about scale and volume; the offering memorandum’s cover line is about valuation; the “backing/guarantees” column behind it has everything pushed down.
Flip the prospectus to the second line: 2025 revenue is about US$4.6 billion, compared with less than US$400 million the prior year—a huge gap. Operating loss is US$8.06 billion, compared with US$2.98 billion the year before. The two lines appear in the same table, but they each go their own way.
I checked the difference between two amounts: in 2025, compute power and infrastructure spending is US$7.33 billion, versus about US$2.4 billion the prior year—more than half of operating expenses of US$12.65 billion. Cash and short-term investments are US$2.028 billion; at this pace, it could cover nearly three years. Nearly one quarter of revenue comes from two customers, and most major customers have not signed long-term contracts.
There’s also an ordering layer: seven co-founders preserve voting control of 50.1% via a newly established entity, while the “public” column is pushed very low. The funds raised on the listing side are pinned by multiple media reports to the US$6–10 billion bracket, which, when compared with the US$518 billion commitment, leaves only a fraction.
To make the stance clear: the line that is repeatedly cited is the cover page line—valuation and scale/volume. The “backing/guarantees” line is the risk section and the second line’s factual column—the capacity gap and the loss gap. In the upcoming annual reports: if the commitment is neither delayed nor restructured, the gap will be annualized and amortized monthly in the annual report only. If the commitment is delayed, split up, or handed off, then the cover page line will have to be recalculated. How much capacity is ultimately amortized in that line. The portion kept in current accounts also has a bracket of arrangements that can be withdrawn at any time; the quotes in this bracket on Binance are updated daily. $ALLO
$NIL
$KITE
#anthropic招股书或估值超2万亿美元
That line falls more plainly on the order book of Binance spot—Bittensor’s 7-day drop of 5.4%, US$332 million; Filecoin’s 7-day drop of 1.6%, US$82 million; Render’s 7-day rise of 1.2%, US$97 million; and the platform token BNB’s 7-day drop of 4.2%, US$100.7 billion. In the cover page, the first line is about scale and volume; the offering memorandum’s cover line is about valuation; the “backing/guarantees” column behind it has everything pushed down.
Flip the prospectus to the second line: 2025 revenue is about US$4.6 billion, compared with less than US$400 million the prior year—a huge gap. Operating loss is US$8.06 billion, compared with US$2.98 billion the year before. The two lines appear in the same table, but they each go their own way.
I checked the difference between two amounts: in 2025, compute power and infrastructure spending is US$7.33 billion, versus about US$2.4 billion the prior year—more than half of operating expenses of US$12.65 billion. Cash and short-term investments are US$2.028 billion; at this pace, it could cover nearly three years. Nearly one quarter of revenue comes from two customers, and most major customers have not signed long-term contracts.
There’s also an ordering layer: seven co-founders preserve voting control of 50.1% via a newly established entity, while the “public” column is pushed very low. The funds raised on the listing side are pinned by multiple media reports to the US$6–10 billion bracket, which, when compared with the US$518 billion commitment, leaves only a fraction.
To make the stance clear: the line that is repeatedly cited is the cover page line—valuation and scale/volume. The “backing/guarantees” line is the risk section and the second line’s factual column—the capacity gap and the loss gap. In the upcoming annual reports: if the commitment is neither delayed nor restructured, the gap will be annualized and amortized monthly in the annual report only. If the commitment is delayed, split up, or handed off, then the cover page line will have to be recalculated. How much capacity is ultimately amortized in that line. The portion kept in current accounts also has a bracket of arrangements that can be withdrawn at any time; the quotes in this bracket on Binance are updated daily. $ALLO
$NIL
$KITE
#anthropic招股书或估值超2万亿美元

826
·
--
Bullish
Verified
This cross-chain protocol’s 2.0 version has two start dates: on August 31, an independent tracking party recorded that the first Ethereum routes were migrated over; on September 28, the project team issued a press release—almost a month later. In the same batch of materials, cross-chain assets were written as more than $84 billion, with $15 billion moved in over the most recent four months.
The new layer is to have institutions run a validator themselves, making that signature a necessary step before a transfer; identity verification and sanctions screening can be embedded directly into the transfer, and confirmation depth has been changed to optional. Eighteen institutions are listed on the release roster; among them, two firms’ statements only go as far as “there is potential” and “intend to cooperate.”
On the day, Chainlink was up about 7.1% and up about 13.9% over seven days; Wormhole fell about 14.0% on the day and about 13.5% over seven days; LayerZero fell about 7.4% on the day and about 29.0% over seven days, with daily trading volumes of about $13.8 million, $1.1 million, and $2.76 million, respectively. What separates them is the question of “who signs for you when nothing is added”: two have fixed signers; one hands the choice to the application side, and for this round the default set is still the same, while the added signature is made an option. Even summed together, the three are still far below the platform token BNB.
The truly changed part is in the documentation: the off-chain automated role in the previously independent re-verification network has been disabled; on-chain contracts remain as an emergency fallback, and the official says that in subsequent versions it will be optional. On the default route, the signer for institutions is the set built by 16 node operators.
Here’s what I checked, that one line in the list: among the 18, none confirmed that the new validator would be run in production. On a prior scheme of the same type, only one signature was attached, and losing it cost about $292 million.
That extra signature must be connected by the institution itself; the missing re-verification step on the default route isn’t being filled in by anyone. Over the next quarter, if traffic is still not found on the default route for that extra signature, it means the option only exists in the press release—this version is void; and if its share is raised into double digits, it stays. How many institutions truly connect that signature is the one blank space this version leaves; Binance spot listings show Chainlink buy and sell orders, and on the other side of wealth management, the product types pay daily—BNB’s total supply is also updated daily. This article is for recording viewpoints and does not constitute investment advice. $HARD $CC $XLM #chainlink上线ccip2支持企业验证
This cross-chain protocol’s 2.0 version has two start dates: on August 31, an independent tracking party recorded that the first Ethereum routes were migrated over; on September 28, the project team issued a press release—almost a month later. In the same batch of materials, cross-chain assets were written as more than $84 billion, with $15 billion moved in over the most recent four months.
The new layer is to have institutions run a validator themselves, making that signature a necessary step before a transfer; identity verification and sanctions screening can be embedded directly into the transfer, and confirmation depth has been changed to optional. Eighteen institutions are listed on the release roster; among them, two firms’ statements only go as far as “there is potential” and “intend to cooperate.”
On the day, Chainlink was up about 7.1% and up about 13.9% over seven days; Wormhole fell about 14.0% on the day and about 13.5% over seven days; LayerZero fell about 7.4% on the day and about 29.0% over seven days, with daily trading volumes of about $13.8 million, $1.1 million, and $2.76 million, respectively. What separates them is the question of “who signs for you when nothing is added”: two have fixed signers; one hands the choice to the application side, and for this round the default set is still the same, while the added signature is made an option. Even summed together, the three are still far below the platform token BNB.
The truly changed part is in the documentation: the off-chain automated role in the previously independent re-verification network has been disabled; on-chain contracts remain as an emergency fallback, and the official says that in subsequent versions it will be optional. On the default route, the signer for institutions is the set built by 16 node operators.
Here’s what I checked, that one line in the list: among the 18, none confirmed that the new validator would be run in production. On a prior scheme of the same type, only one signature was attached, and losing it cost about $292 million.
That extra signature must be connected by the institution itself; the missing re-verification step on the default route isn’t being filled in by anyone. Over the next quarter, if traffic is still not found on the default route for that extra signature, it means the option only exists in the press release—this version is void; and if its share is raised into double digits, it stays. How many institutions truly connect that signature is the one blank space this version leaves; Binance spot listings show Chainlink buy and sell orders, and on the other side of wealth management, the product types pay daily—BNB’s total supply is also updated daily. This article is for recording viewpoints and does not constitute investment advice. $HARD $CC $XLM #chainlink上线ccip2支持企业验证
The new layer is to have institutions run a validator themselves, making that signature a necessary step before a transfer; identity verification and sanctions screening can be embedded directly into the transfer, and confirmation depth has been changed to optional. Eighteen institutions are listed on the release roster; among them, two firms’ statements only go as far as “there is potential” and “intend to cooperate.”
On the day, Chainlink was up about 7.1% and up about 13.9% over seven days; Wormhole fell about 14.0% on the day and about 13.5% over seven days; LayerZero fell about 7.4% on the day and about 29.0% over seven days, with daily trading volumes of about $13.8 million, $1.1 million, and $2.76 million, respectively. What separates them is the question of “who signs for you when nothing is added”: two have fixed signers; one hands the choice to the application side, and for this round the default set is still the same, while the added signature is made an option. Even summed together, the three are still far below the platform token BNB.
The truly changed part is in the documentation: the off-chain automated role in the previously independent re-verification network has been disabled; on-chain contracts remain as an emergency fallback, and the official says that in subsequent versions it will be optional. On the default route, the signer for institutions is the set built by 16 node operators.
Here’s what I checked, that one line in the list: among the 18, none confirmed that the new validator would be run in production. On a prior scheme of the same type, only one signature was attached, and losing it cost about $292 million.
That extra signature must be connected by the institution itself; the missing re-verification step on the default route isn’t being filled in by anyone. Over the next quarter, if traffic is still not found on the default route for that extra signature, it means the option only exists in the press release—this version is void; and if its share is raised into double digits, it stays. How many institutions truly connect that signature is the one blank space this version leaves; Binance spot listings show Chainlink buy and sell orders, and on the other side of wealth management, the product types pay daily—BNB’s total supply is also updated daily. This article is for recording viewpoints and does not constitute investment advice. $HARD $CC $XLM #chainlink上线ccip2支持企业验证

2
1.3k
·
--
Bullish
Partly True
On September 24, a clearinghouse jointly owned by 25 U.S. banks selected a company for cross-chain interoperability and connected it to its new network. The new network is used to clear and settle tokenized deposits. The company provides the interoperability, orchestration, and transaction management layer—placed alongside the two existing rails: one rail runs real-time payments, and the other handles large-value payments. The network will not be open to participating institutions until the first half of 2027.
Daily clearing and settlement exceed $2 trillion. Those figures are recorded on the clearinghouse side—the readouts from the original network. The selected party’s account has no corresponding amounts. The announcement leaves two blanks: the financial terms were not disclosed, and it says nothing about how to convert one word regarding how the token demand is translated.
On the payment-and-settlement layer side, the names and figures are laid out: Quant up about 48% on a 24-hour basis, about 284% over seven days, with a size of roughly $293 million; Stellar down 1.7%, down 2.3% over seven days, with about $6.81 billion; Hedera up slightly 1.7%, down about 1.9% over seven days, with about $3.94 billion; Algorand up slightly 0.8%, down about 2.8% over seven days, with about $0.98 billion. Combined, the four add up to $14.7 billion—still below the one-trillion tier of the platform token BNB. The figures don’t match the magnitude: what separates them is the largest string of numbers recorded on whoever’s books. In this round, one party is booked on the clearinghouse side, while the other three are recorded on their own publicly available chains.
I checked the readouts on that party’s own side. On September 24, active addresses rose to 2,064—its highest level in nearly a year, after being above 870 every day before. Circulating supply is 12.07 million coins, with a max of 14.61 million already fully minted. On Binance spot markets, it has only one listed quote line. The addresses field was lifted on the same day as the announcement, but no one specified what the middle layer interface corresponds to.
What determines the pricing is which side the interface is installed; what’s left blank is the amount that gets handled. There is only one signal that flips this reading: when, in the first half of 2027, the network opens to participating institutions, if the first batch only reports sign-ups but not the handled amount, it means this layer is still an interface and it stands as such. If a handled amount appears and is linked to tokenized deposits, then this reading no longer holds. The largest string of numbers is recorded on the clearinghouse side; Binance posts the BNB price and supply, while the dormant balances have their own destination for yield. This article is a record of viewpoints and does not constitute investment advice.$Q $QI $QKC
#quant将支持清算所区块链支付网络
On September 24, a clearinghouse jointly owned by 25 U.S. banks selected a company for cross-chain interoperability and connected it to its new network. The new network is used to clear and settle tokenized deposits. The company provides the interoperability, orchestration, and transaction management layer—placed alongside the two existing rails: one rail runs real-time payments, and the other handles large-value payments. The network will not be open to participating institutions until the first half of 2027.
Daily clearing and settlement exceed $2 trillion. Those figures are recorded on the clearinghouse side—the readouts from the original network. The selected party’s account has no corresponding amounts. The announcement leaves two blanks: the financial terms were not disclosed, and it says nothing about how to convert one word regarding how the token demand is translated.
On the payment-and-settlement layer side, the names and figures are laid out: Quant up about 48% on a 24-hour basis, about 284% over seven days, with a size of roughly $293 million; Stellar down 1.7%, down 2.3% over seven days, with about $6.81 billion; Hedera up slightly 1.7%, down about 1.9% over seven days, with about $3.94 billion; Algorand up slightly 0.8%, down about 2.8% over seven days, with about $0.98 billion. Combined, the four add up to $14.7 billion—still below the one-trillion tier of the platform token BNB. The figures don’t match the magnitude: what separates them is the largest string of numbers recorded on whoever’s books. In this round, one party is booked on the clearinghouse side, while the other three are recorded on their own publicly available chains.
I checked the readouts on that party’s own side. On September 24, active addresses rose to 2,064—its highest level in nearly a year, after being above 870 every day before. Circulating supply is 12.07 million coins, with a max of 14.61 million already fully minted. On Binance spot markets, it has only one listed quote line. The addresses field was lifted on the same day as the announcement, but no one specified what the middle layer interface corresponds to.
What determines the pricing is which side the interface is installed; what’s left blank is the amount that gets handled. There is only one signal that flips this reading: when, in the first half of 2027, the network opens to participating institutions, if the first batch only reports sign-ups but not the handled amount, it means this layer is still an interface and it stands as such. If a handled amount appears and is linked to tokenized deposits, then this reading no longer holds. The largest string of numbers is recorded on the clearinghouse side; Binance posts the BNB price and supply, while the dormant balances have their own destination for yield. This article is a record of viewpoints and does not constitute investment advice.$Q $QI $QKC
#quant将支持清算所区块链支付网络
Daily clearing and settlement exceed $2 trillion. Those figures are recorded on the clearinghouse side—the readouts from the original network. The selected party’s account has no corresponding amounts. The announcement leaves two blanks: the financial terms were not disclosed, and it says nothing about how to convert one word regarding how the token demand is translated.
On the payment-and-settlement layer side, the names and figures are laid out: Quant up about 48% on a 24-hour basis, about 284% over seven days, with a size of roughly $293 million; Stellar down 1.7%, down 2.3% over seven days, with about $6.81 billion; Hedera up slightly 1.7%, down about 1.9% over seven days, with about $3.94 billion; Algorand up slightly 0.8%, down about 2.8% over seven days, with about $0.98 billion. Combined, the four add up to $14.7 billion—still below the one-trillion tier of the platform token BNB. The figures don’t match the magnitude: what separates them is the largest string of numbers recorded on whoever’s books. In this round, one party is booked on the clearinghouse side, while the other three are recorded on their own publicly available chains.
I checked the readouts on that party’s own side. On September 24, active addresses rose to 2,064—its highest level in nearly a year, after being above 870 every day before. Circulating supply is 12.07 million coins, with a max of 14.61 million already fully minted. On Binance spot markets, it has only one listed quote line. The addresses field was lifted on the same day as the announcement, but no one specified what the middle layer interface corresponds to.
What determines the pricing is which side the interface is installed; what’s left blank is the amount that gets handled. There is only one signal that flips this reading: when, in the first half of 2027, the network opens to participating institutions, if the first batch only reports sign-ups but not the handled amount, it means this layer is still an interface and it stands as such. If a handled amount appears and is linked to tokenized deposits, then this reading no longer holds. The largest string of numbers is recorded on the clearinghouse side; Binance posts the BNB price and supply, while the dormant balances have their own destination for yield. This article is a record of viewpoints and does not constitute investment advice.$Q $QI $QKC
#quant将支持清算所区块链支付网络
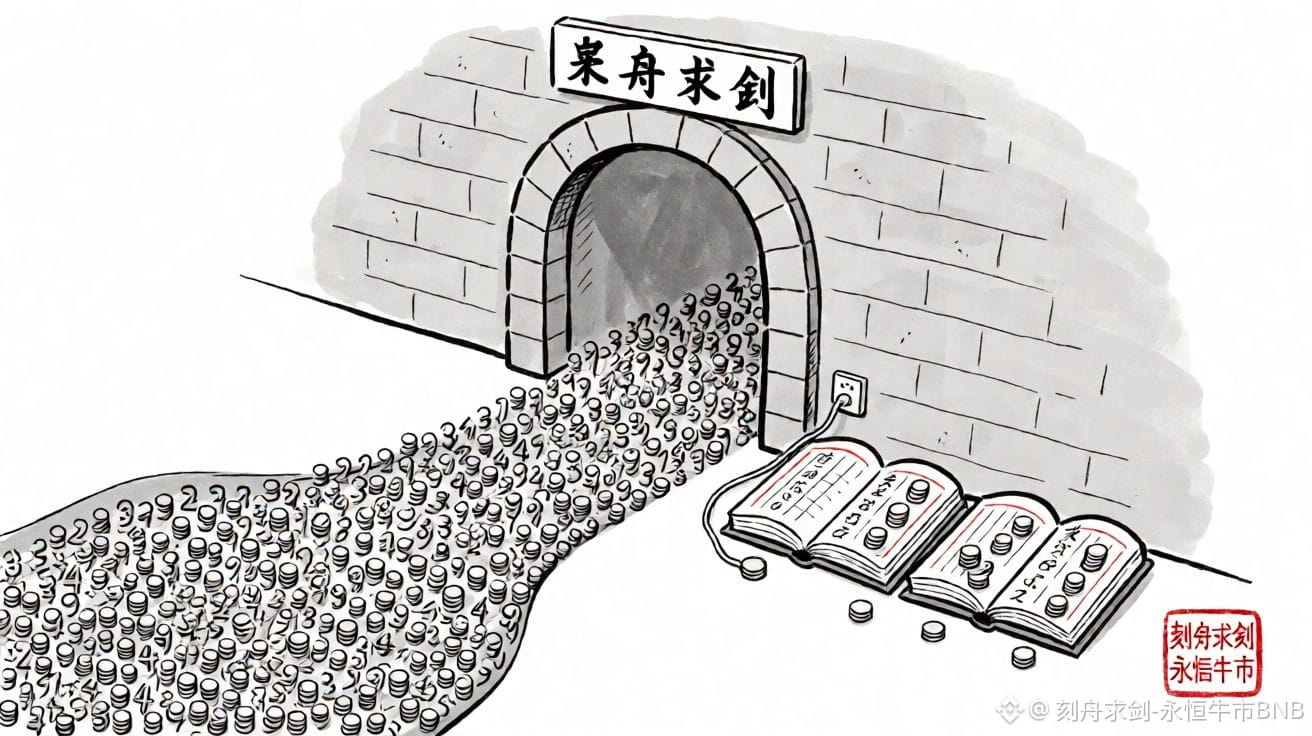
1
1
9.3k
Log in to explore more content
Join global crypto users on Binance Square
⚡️ Get latest and useful information about crypto.
💬 Trusted by the world’s largest crypto exchange.
👍 Discover real insights from verified creators.
Email / Phone number
Trending Topics
DriftHackVictimsBeginClaims
217 views
35 Discussing
#drifthackvictimsbeginclaims Drift finally rolling out DFX claims for April 1 exploit victims
📈
Time to see if users can actually get their funds back or if this is just another ghost story
👻$DRIFT $US $BR
Rajo C
·0 Likes
·10 views
SolanaTokenizedStockVolumeTops$4.4BInSeptember
409 views
13 Discussing
BitcoinSpotETFsDraw$6.34BInflowsInQ3
8,272 views
121 Discussing