
Novansenduk16
27 Posts

Novansenduk16
28 Following
11 Followers
3 Liked
Posts
All
Quotes
PINNED


CZ
·
--
Saw some people panicking or asking about quantum computing's impact on crypto.
At a high level, all crypto has to do is to upgrade to Quantum-Resistant (Post-Quantum) Algorithms. So, no need to panic. 😂
In practice, there are some execution considerations. It's hard to organize upgrades in a decentralized world. There will likely be many debates on which algorithm(s) to use, resulting in some forks.
And some dead project may not upgrade at all. Might be a good to cleanse out those projects anyway.
New code may introduce other bugs or security issues in the short term.
People who self custody will have to migrate their coins to new wallets.
This brings to the question of Satoshi's bitcoins. If those coins move, then it means he/she is still around, which is interesting to know. If they don't move (in a certain period of time), it might be better to lock (or effectively burn) those addresses so that they don't go to the first hacker who cracks it. There is also the difficulty of identifying all his addresses, and not confuse with some old hodlers. Anyway, it's a different topic for later.
Fundamentally:
It's always easier to encrypt than decrypt.
More computing power is always good.
Crypto will stay, post quantum.
At a high level, all crypto has to do is to upgrade to Quantum-Resistant (Post-Quantum) Algorithms. So, no need to panic. 😂
In practice, there are some execution considerations. It's hard to organize upgrades in a decentralized world. There will likely be many debates on which algorithm(s) to use, resulting in some forks.
And some dead project may not upgrade at all. Might be a good to cleanse out those projects anyway.
New code may introduce other bugs or security issues in the short term.
People who self custody will have to migrate their coins to new wallets.
This brings to the question of Satoshi's bitcoins. If those coins move, then it means he/she is still around, which is interesting to know. If they don't move (in a certain period of time), it might be better to lock (or effectively burn) those addresses so that they don't go to the first hacker who cracks it. There is also the difficulty of identifying all his addresses, and not confuse with some old hodlers. Anyway, it's a different topic for later.
Fundamentally:
It's always easier to encrypt than decrypt.
More computing power is always good.
Crypto will stay, post quantum.
CZ
·
--
[Replay] 🎙️ Chat
01 h 01 m 24 s · 208.1k listens

AlphaAnalyst
·
--
Bullish$HBAR
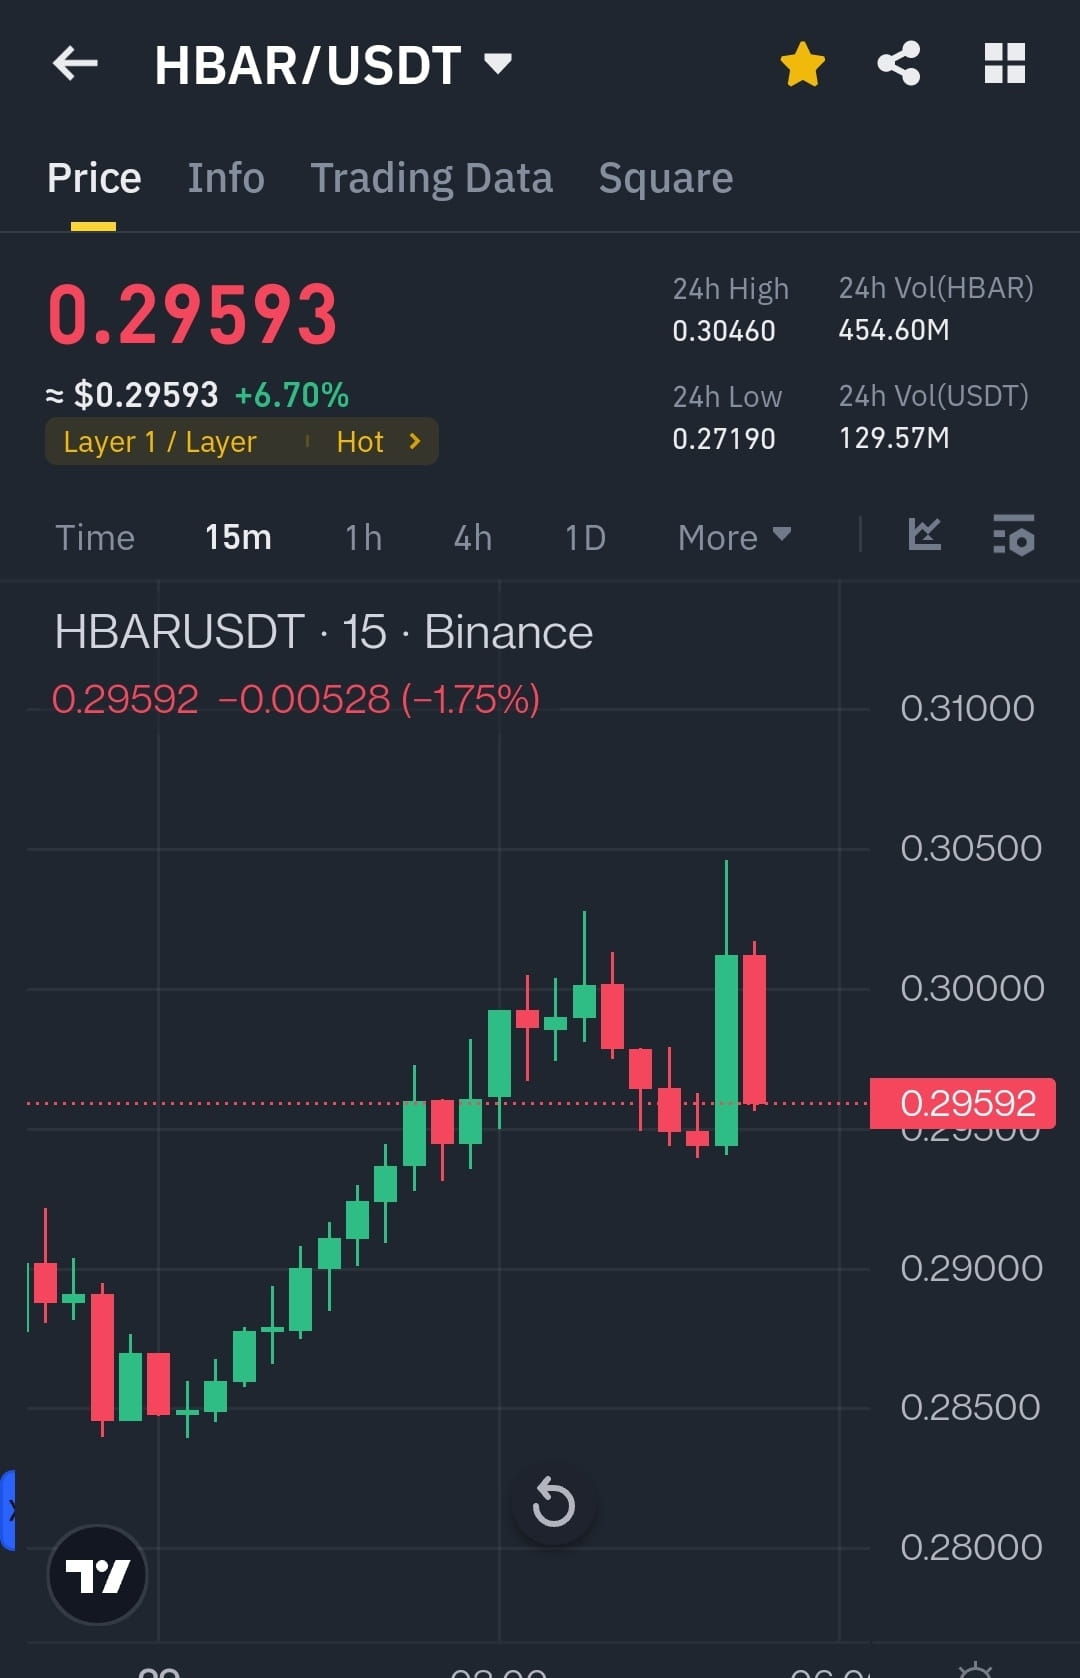
HBAR/USD Market Analysis: Priced at $0.29593
HBAR is currently trading at $0.29593, showing a slight consolidation after recent movements. This price point is key for both bulls and bears, as it sits near crucial support and resistance zones.
Resistance: The first resistance level is at $0.30, with a potential push towards $0.32 if bullish momentum continues. A break above $0.32 could set the stage for a move towards $0.35.
Support: On the downside, $0.28 serves as immediate support. A strong defense at this level could lead to a rebound, while a breakdown below this support might push the price towards $0.25.
Entry Strategy:
Bullish Setup: Look for a break above $0.30, confirming upward momentum with a target near $0.32 and possibly $0.35.
Bearish Setup: If price dips below $0.28, a potential short play could target $0.25.
With HBAR nearing these key levels, it’s important to stay alert to potential breakouts or pullbacks.
#CryptoETFMania #GMTBurnVote #BitwiseBitcoinETF #CryptoRegulation2025 #Write2Earn
HBAR/USD Market Analysis: Priced at $0.29593
HBAR is currently trading at $0.29593, showing a slight consolidation after recent movements. This price point is key for both bulls and bears, as it sits near crucial support and resistance zones.
Resistance: The first resistance level is at $0.30, with a potential push towards $0.32 if bullish momentum continues. A break above $0.32 could set the stage for a move towards $0.35.
Support: On the downside, $0.28 serves as immediate support. A strong defense at this level could lead to a rebound, while a breakdown below this support might push the price towards $0.25.
Entry Strategy:
Bullish Setup: Look for a break above $0.30, confirming upward momentum with a target near $0.32 and possibly $0.35.
Bearish Setup: If price dips below $0.28, a potential short play could target $0.25.
With HBAR nearing these key levels, it’s important to stay alert to potential breakouts or pullbacks.
#CryptoETFMania #GMTBurnVote #BitwiseBitcoinETF #CryptoRegulation2025 #Write2Earn
AlphaAnalyst
·
--
Bearish$GMT
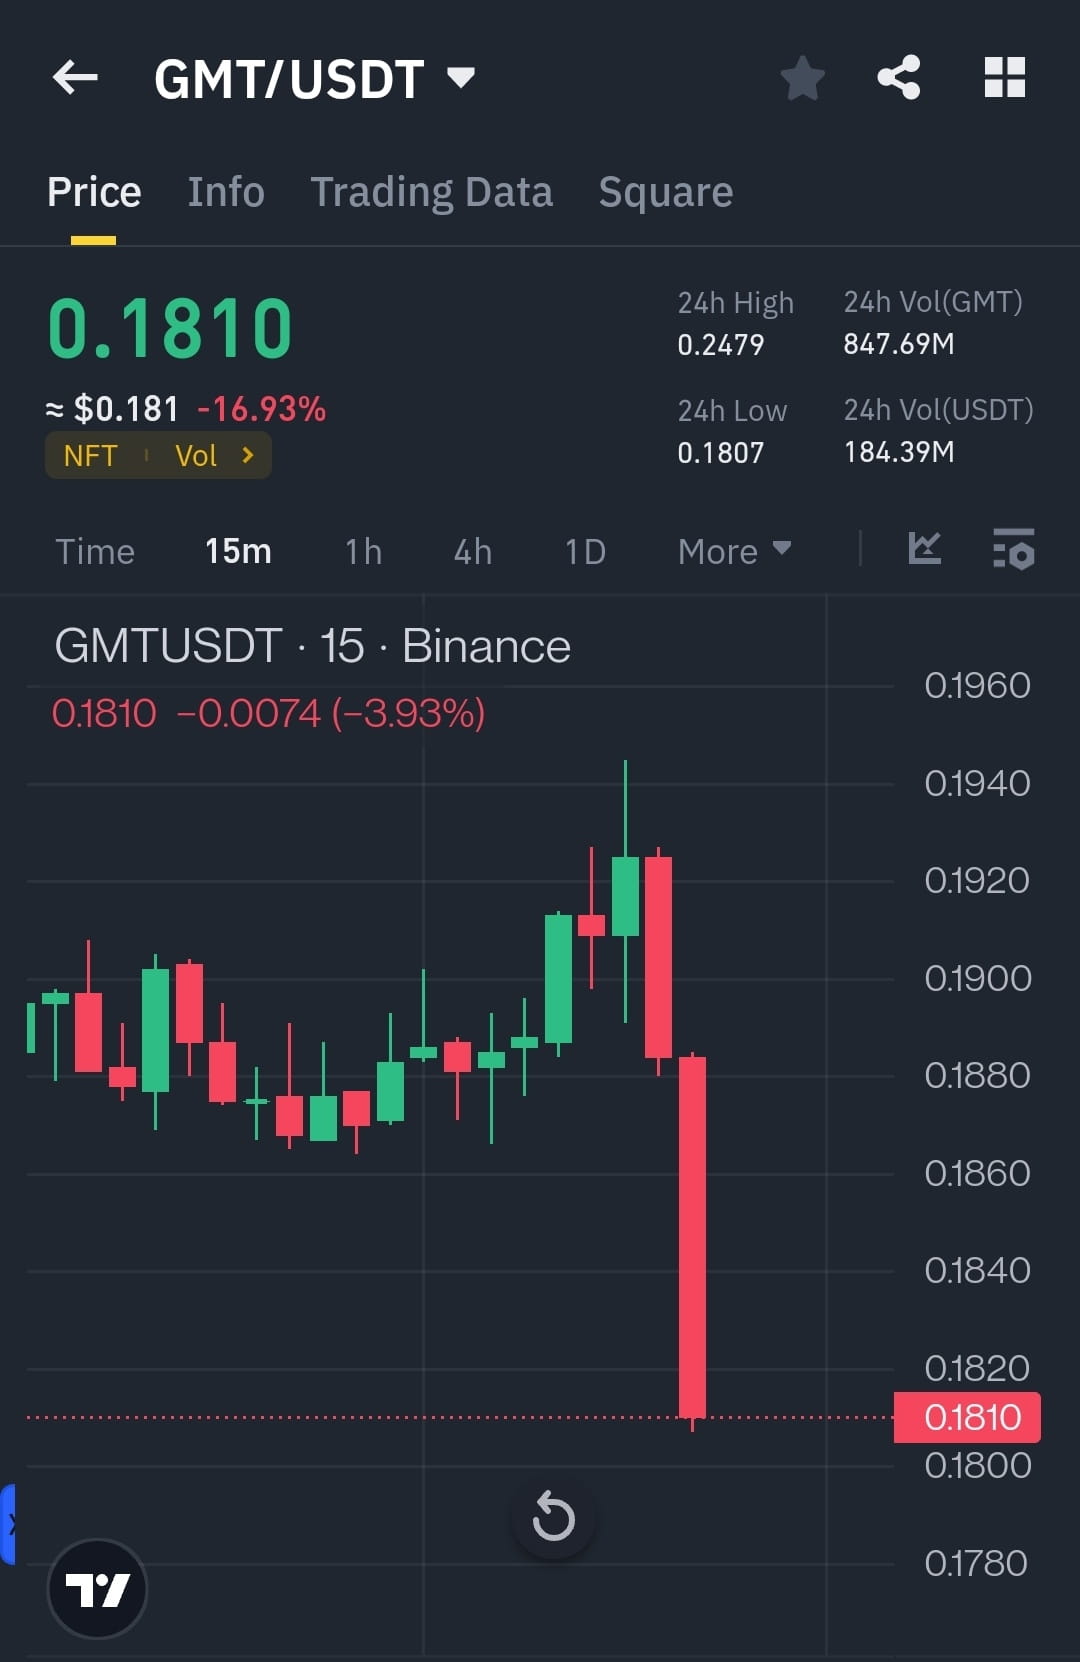
GMT/USD Market Update: Priced at $0.1810
Currently trading at $0.1810, GMT is experiencing a moment of consolidation within a defined range. The market presents a great opportunity for traders looking to capitalize on key support and resistance levels.
Resistance: The immediate resistance for GMT is at $0.1900, which has historically been a tough barrier. A break above this level could lead to a move towards $0.20, offering potential for bullish momentum.
Support: On the downside, $0.1750 is a key support level to watch. If the price holds above this level, it could suggest a potential rebound. A drop below $0.1750 would likely send the price toward the next support at $0.1650, possibly signaling further downside pressure.
Entry Strategy:
Bullish Setup: A breakout above $0.1900 would present an entry point for long positions, targeting $0.20 as the next resistance level.
Bearish Setup: If GMT fails to hold above $0.1750, it could be a signal to take short positions with $0.1650 as the target.
Stay alert for these key levels as GMT trades within this range, offering traders potential for both bullish and bearish opportunities!
#CryptoETFMania #GMTBurnVote #BitwiseBitcoinETF #CryptoRegulation2025 #Write2Earn
GMT/USD Market Update: Priced at $0.1810
Currently trading at $0.1810, GMT is experiencing a moment of consolidation within a defined range. The market presents a great opportunity for traders looking to capitalize on key support and resistance levels.
Resistance: The immediate resistance for GMT is at $0.1900, which has historically been a tough barrier. A break above this level could lead to a move towards $0.20, offering potential for bullish momentum.
Support: On the downside, $0.1750 is a key support level to watch. If the price holds above this level, it could suggest a potential rebound. A drop below $0.1750 would likely send the price toward the next support at $0.1650, possibly signaling further downside pressure.
Entry Strategy:
Bullish Setup: A breakout above $0.1900 would present an entry point for long positions, targeting $0.20 as the next resistance level.
Bearish Setup: If GMT fails to hold above $0.1750, it could be a signal to take short positions with $0.1650 as the target.
Stay alert for these key levels as GMT trades within this range, offering traders potential for both bullish and bearish opportunities!
#CryptoETFMania #GMTBurnVote #BitwiseBitcoinETF #CryptoRegulation2025 #Write2Earn

CryptoMasterMindX
·
--
How to Earn $100 a month on Binance Without Spending Any Money
Binance, one of the world's leading cryptocurrency exchanges, offers several opportunities to earn money without investing your own funds. Whether you are a complete beginner or an experienced user, these methods are accessible and can help you kickstart your crypto journey. Here's a detailed guide to earning $100 on Binance without spending a penny.
1. Participate in Binance Airdrops
Binance frequently collaborates with projects to distribute free tokens as part of promotional campaigns. These giveaways, known as airdrops, are an excellent way to earn crypto without any investment.
Steps to Participate:
Follow Binance Announcements: Stay updated on Binance’s website or social media channels for new airdrop campaigns.
Complete Simple Tasks: Tasks may include signing up for a new project, joining social media channels, or completing quizzes.
Claim Your Rewards: Once tasks are completed, tokens will be credited to your Binance wallet.
💡 Pro Tip: Use Binance's "Launchpad" and "Launchpool" for similar opportunities.
2. Join Binance Affiliate Program
Binance rewards users who bring new customers to their platform through affiliate links.
How It Works:
Sign Up for the Affiliate Program: Apply to be an affiliate on Binance.
Share Your Referral Link: Post your referral link on social media, blogs, or with friends.
Earn Commissions: Receive up to 50% of the trading fees generated by your referrals.
💡 Pro Tip: Promote your referral link in niche communities for better engagement.
3. Leverage Binance Learn & Earn
The Binance Learn & Earn program allows users to learn about blockchain and cryptocurrency while earning free crypto.
How to Get Started:
1. Visit the Binance Learn & Earn Page: Accessible through your account dashboard.
2. Complete Educational Modules: Watch videos or read articles about crypto topics.
3. Take Quizzes: Pass the quizzes to earn rewards in various cryptocurrencies.
💡 Pro Tip: Review the material thoroughly to ensure you pass the quizzes on the first attempt.
4. Win Through Binance Trading Competitions
Binance regularly hosts trading competitions where participants can win prizes without needing upfront capital.
How to Join:
Look Out for Demo Trading Competitions: Some contests use virtual funds instead of real money.
Compete for Prizes: Perform well in the competition to earn rewards.
💡 Pro Tip: Practice strategies with Binance's demo trading feature to sharpen your skills.
5. Engage in Binance Promotions
Binance often runs limited-time promotions with tasks that allow users to earn crypto rewards.
Typical Tasks Include:
Completing Account Verification: Rewards are sometimes offered for KYC completion.
Using Binance Pay: Send or receive crypto payments for rewards.
💡 Pro Tip: Join the Binance newsletter to stay updated on ongoing promotions.
6. Earn Through Binance Community Rewards
Binance rewards active community members who contribute to their ecosystem.
Ways to Earn:
Create Content: Write blogs or create videos about Binance and share them on platforms like Binance Square or social media.
Engage on Binance Forums: Provide valuable input to the Binance community.
💡 Pro Tip: High-quality content is more likely to get rewarded.
7. Binance Staking with Free Tokens
Sometimes Binance offers free staking opportunities for newly launched tokens.
Steps:
1. Look for Zero-Cost Staking Campaigns: These may require participation in promotions.
2. Stake Your Tokens: Earn passive income as the tokens grow in value.
💡 Pro Tip: Check Binance's "Staking" section regularly for updates.
---
8. Join Binance Tasks and Campaigns
Binance often runs specific campaigns like "Task Center" where you can complete small missions to earn crypto.
Typical Missions:
Completing surveys.
Playing interactive games.
Referring friends.
💡 Pro Tip: Keep an eye on the Binance app notifications to never miss an opportunity.
---
Final Tips for Success
Stay Active on Binance: Regularly check for new promotions, events, and campaigns.
Use Social Media: Follow Binance on Twitter, Telegram, and other platforms to stay informed.
Engage with the Community: Join Binance groups to learn from others and discover hidden opportunities.
By leveraging these strategies, you can build your crypto portfolio on Binance without spending any money. With consistency and effort, earning $100 or more is entirely achievable. Start today and let Binance's vast ecosystem work for you!
1. Participate in Binance Airdrops
Binance frequently collaborates with projects to distribute free tokens as part of promotional campaigns. These giveaways, known as airdrops, are an excellent way to earn crypto without any investment.
Steps to Participate:
Follow Binance Announcements: Stay updated on Binance’s website or social media channels for new airdrop campaigns.
Complete Simple Tasks: Tasks may include signing up for a new project, joining social media channels, or completing quizzes.
Claim Your Rewards: Once tasks are completed, tokens will be credited to your Binance wallet.
💡 Pro Tip: Use Binance's "Launchpad" and "Launchpool" for similar opportunities.
2. Join Binance Affiliate Program
Binance rewards users who bring new customers to their platform through affiliate links.
How It Works:
Sign Up for the Affiliate Program: Apply to be an affiliate on Binance.
Share Your Referral Link: Post your referral link on social media, blogs, or with friends.
Earn Commissions: Receive up to 50% of the trading fees generated by your referrals.
💡 Pro Tip: Promote your referral link in niche communities for better engagement.
3. Leverage Binance Learn & Earn
The Binance Learn & Earn program allows users to learn about blockchain and cryptocurrency while earning free crypto.
How to Get Started:
1. Visit the Binance Learn & Earn Page: Accessible through your account dashboard.
2. Complete Educational Modules: Watch videos or read articles about crypto topics.
3. Take Quizzes: Pass the quizzes to earn rewards in various cryptocurrencies.
💡 Pro Tip: Review the material thoroughly to ensure you pass the quizzes on the first attempt.
4. Win Through Binance Trading Competitions
Binance regularly hosts trading competitions where participants can win prizes without needing upfront capital.
How to Join:
Look Out for Demo Trading Competitions: Some contests use virtual funds instead of real money.
Compete for Prizes: Perform well in the competition to earn rewards.
💡 Pro Tip: Practice strategies with Binance's demo trading feature to sharpen your skills.
5. Engage in Binance Promotions
Binance often runs limited-time promotions with tasks that allow users to earn crypto rewards.
Typical Tasks Include:
Completing Account Verification: Rewards are sometimes offered for KYC completion.
Using Binance Pay: Send or receive crypto payments for rewards.
💡 Pro Tip: Join the Binance newsletter to stay updated on ongoing promotions.
6. Earn Through Binance Community Rewards
Binance rewards active community members who contribute to their ecosystem.
Ways to Earn:
Create Content: Write blogs or create videos about Binance and share them on platforms like Binance Square or social media.
Engage on Binance Forums: Provide valuable input to the Binance community.
💡 Pro Tip: High-quality content is more likely to get rewarded.
7. Binance Staking with Free Tokens
Sometimes Binance offers free staking opportunities for newly launched tokens.
Steps:
1. Look for Zero-Cost Staking Campaigns: These may require participation in promotions.
2. Stake Your Tokens: Earn passive income as the tokens grow in value.
💡 Pro Tip: Check Binance's "Staking" section regularly for updates.
---
8. Join Binance Tasks and Campaigns
Binance often runs specific campaigns like "Task Center" where you can complete small missions to earn crypto.
Typical Missions:
Completing surveys.
Playing interactive games.
Referring friends.
💡 Pro Tip: Keep an eye on the Binance app notifications to never miss an opportunity.
---
Final Tips for Success
Stay Active on Binance: Regularly check for new promotions, events, and campaigns.
Use Social Media: Follow Binance on Twitter, Telegram, and other platforms to stay informed.
Engage with the Community: Join Binance groups to learn from others and discover hidden opportunities.
By leveraging these strategies, you can build your crypto portfolio on Binance without spending any money. With consistency and effort, earning $100 or more is entirely achievable. Start today and let Binance's vast ecosystem work for you!
Log in to explore more content